Innovation Icons

Cms Web Development Process Diagram Powerpoint Images
This is a cms web development process diagram powerpoint images. This is a seven stage process. The stages in this process are cms, services, simplified content management, save time and efforts, reduce maintenance cost, complete control, catalogue, projects.

Land Development Process Diagram Powerpoint Presentation Templates
This is a land development process diagram powerpoint presentation templates. This is a five stage process. The stages in this process are design and entitlements, construction management, financial management, marketing, lot sales.
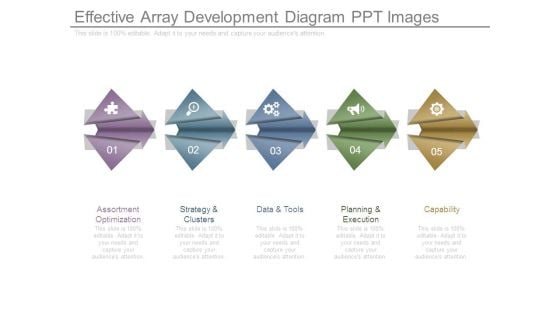
Effective Array Development Diagram Ppt Images
This is a effective array development diagram ppt images. This is a five stage process. The stages in this process are assortment optimization, strategy and clusters, data and tools, planning and execution, capability.
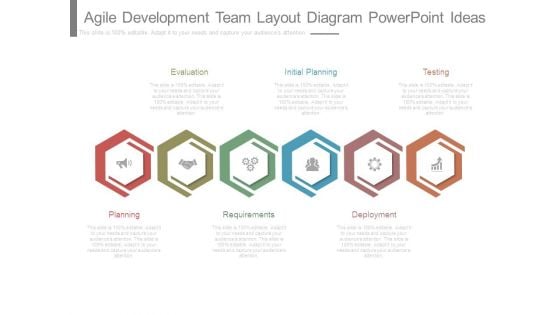
Agile Development Team Layout Diagram Powerpoint Ideas
This is a agile development team layout diagram powerpoint ideas. This is a six stage process. The stages in this process are evaluation, initial planning, testing, planning, requirements, deployment.
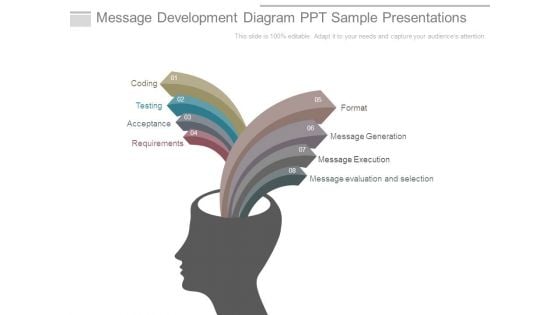
Message Development Diagram Ppt Sample Presentations
This is a message development diagram ppt sample presentations. This is a eight stage process. The stages in this process are coding, testing, acceptance, requirements, format, message generation, message execution, message evaluation and selection.
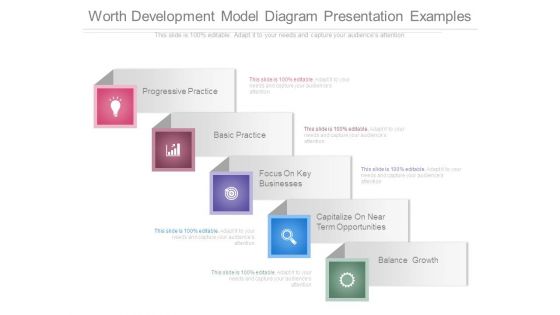
Worth Development Model Diagram Presentation Examples
This is a worth development model diagram presentation examples. This is a five stage process. The stages in this process are progressive practice, basic practice, focus on key businesses, capitalize on near term opportunities, balance growth.
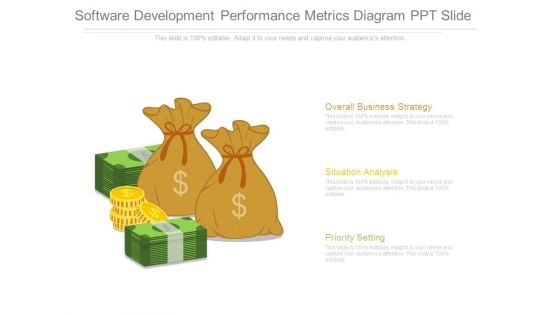
Software Development Performance Metrics Diagram Ppt Slide
This is a software development performance metrics diagram ppt slide. This is a three stage process. The stages in this process are overall business strategy, situation analysis, priority setting.
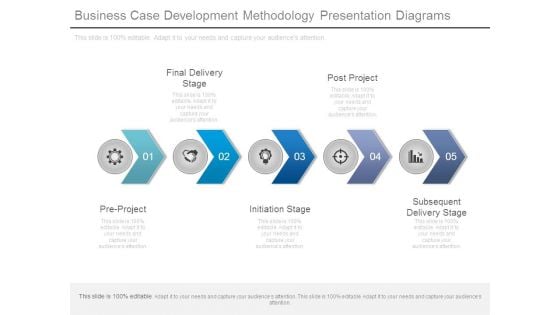
Business Case Development Methodology Presentation Diagrams
This is a business case development methodology presentation diagrams. This is a five stage process. The stages in this process are final delivery stage, post project, subsequent delivery stage, initiation stage, pre project.
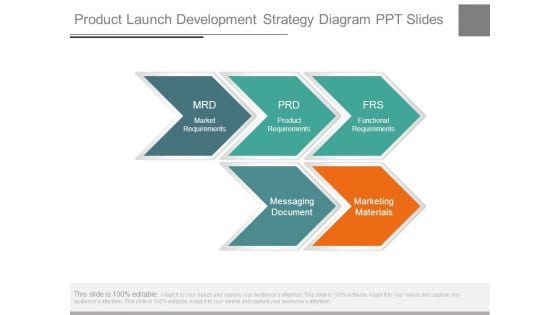
Product Launch Development Strategy Diagram Ppt Slides
This is a product launch development strategy diagram ppt slides. This is a five stage process. The stages in this process are market requirements, product requirements, functional requirements, messaging document, marketing materials.
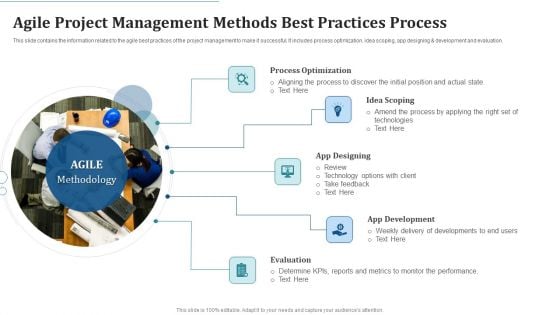
Agile Project Management Methods Best Practices Process Diagrams PDF
This slide contains the information related to the agile best practices of the project management to make it successful. It includes process optimization, idea scoping, app designing and development and evaluation. Persuade your audience using this Agile Project Management Methods Best Practices Process Diagrams PDF. This PPT design covers five stages, thus making it a great tool to use. It also caters to a variety of topics including Process Optimization, App Designing, App Development. Download this PPT design now to present a convincing pitch that not only emphasizes the topic but also showcases your presentation skills.
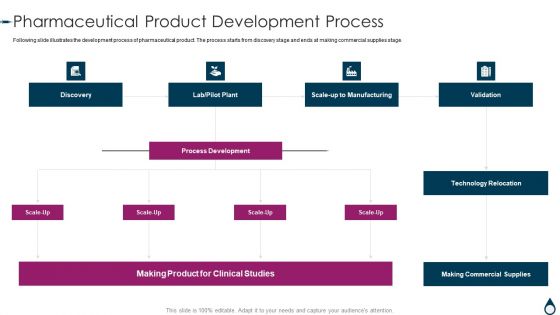
Quality Manufacturing Process For Generic Medicines Pharmaceutical Product Development Process Designs PDF
Following slide illustrates the development process of pharmaceutical product. The process starts from discovery stage and ends at making commercial supplies stage. Presenting Quality Manufacturing Process For Generic Medicines Pharmaceutical Product Development Process Designs PDF to provide visual cues and insights. Share and navigate important information on three stages that need your due attention. This template can be used to pitch topics like Process Development, Technology Relocation, Manufacturing. In addtion, this PPT design contains high resolution images, graphics, etc, that are easily editable and available for immediate download.
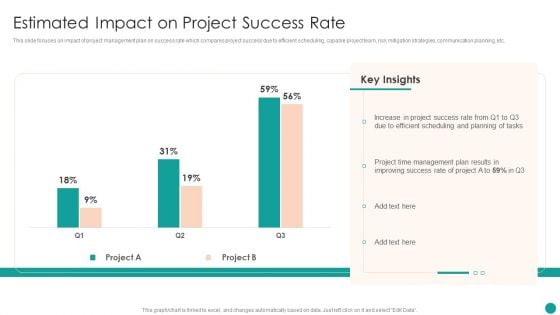
Time Management Techniques For Successful Project Estimated Impact On Project Success Summary PDF
This slide focuses on impact of project management plan on success rate which compares project success due to efficient scheduling, capable project team, risk mitigation strategies, communication planning, etc.Deliver and pitch your topic in the best possible manner with this Time Management Techniques For Successful Project Estimated Impact On Project Success Summary PDF. Use them to share invaluable insights on Increase Project, Efficient Scheduling, Management Plan and impress your audience. This template can be altered and modified as per your expectations. So, grab it now.
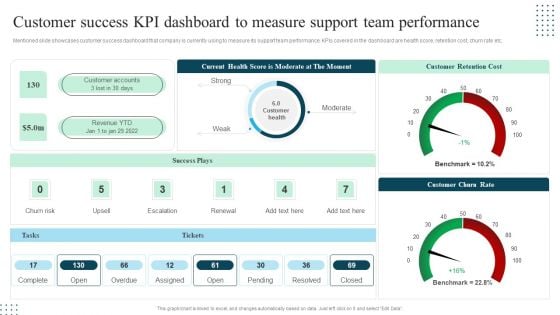
Client Success Playbook Customer Success KPI Dashboard To Measure Support Team Background PDF
Mentioned slide showcases customer success dashboard that company is currently using to measure its support team performance. KPIs covered in the dashboard are health score, retention cost, churn rate etc. Deliver an awe inspiring pitch with this creative Client Success Playbook Customer Success KPI Dashboard To Measure Support Team Background PDF bundle. Topics like Customer Retention Cost, Customer Churn Rate, Success Plays can be discussed with this completely editable template. It is available for immediate download depending on the needs and requirements of the user.
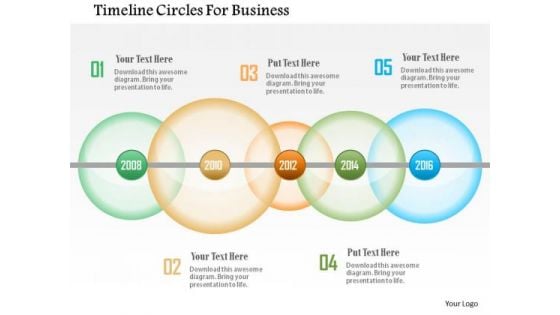
Business Diagram Timeline Circles For Business Presentation Template
Download his diagram for business timeline formation and planning. This business diagram contains the graphic of linear timeline circles. This diagram is designed to attract the attention of your audience.
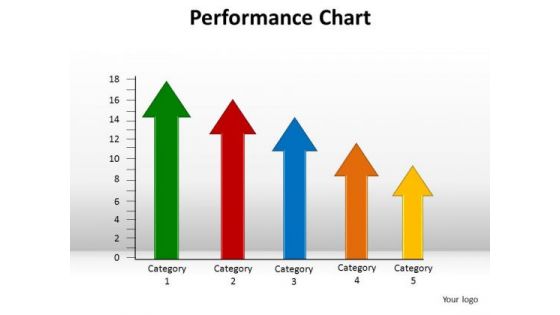
PowerPoint Layouts Graphic Performance Chart Ppt Design
PowerPoint Layouts Graphic Performance Chart PPT Design-Explore the various directions and layers existing in your in your plans and processes. Unravel the desired and essential elements of your overall strategy. Explain the relevance of the different layers and stages and directions in getting down to your core competence, ability and desired result. Step on it with our PowerPoint Layouts Graphic Performance Chart Ppt Design. Escalate the process with our PowerPoint Layouts Graphic Performance Chart Ppt Design.
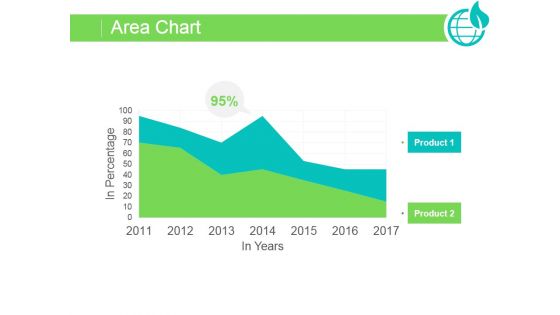
Area Chart Ppt PowerPoint Presentation Backgrounds
This is a area chart ppt powerpoint presentation backgrounds. This is a two stage process. The stages in this process are business, graph, growth, success, marketing.
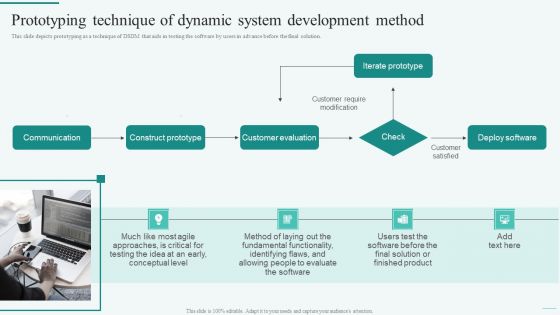
Prototyping Technique Of Dynamic System Development Method Integration Of Dynamic System Themes PDF
This slide depicts prototyping as a technique of DSDM that aids in testing the software by users in advance before the final solution.Boost your pitch with our creative Prototyping Technique Of Dynamic System Development Method Integration Of Dynamic System Themes PDF. Deliver an awe-inspiring pitch that will mesmerize everyone. Using these presentation templates you will surely catch everyones attention. You can browse the ppts collection on our website. We have researchers who are experts at creating the right content for the templates. So you do not have to invest time in any additional work. Just grab the template now and use them.
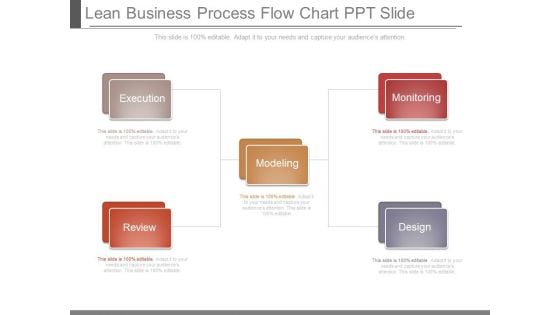
Lean Business Process Flow Chart Ppt Slide
This is a lean business process flow chart ppt slide. This is a five stage process. The stages in this process are execution, review, modeling, design, monitoring.

Value Production Flow Chart Presentation Powerpoint
This is a value production flow chart presentation powerpoint. This is a three stage process. The stages in this process are value production, cost, revenue, profit.
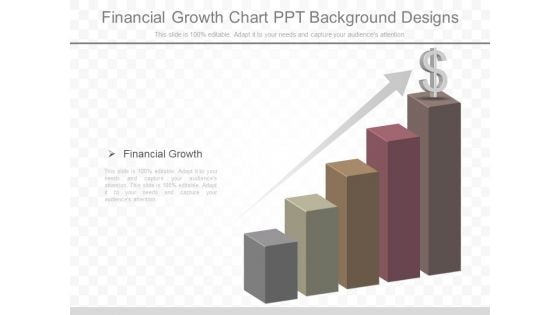
Financial Growth Chart Ppt Background Designs
This is a financial growth chart ppt background designs. This is a five stage process. The stages in this process are financial growth.\n\n\n\n\n\n\n\n\n\n\n\n\n\n\n\n\n\n
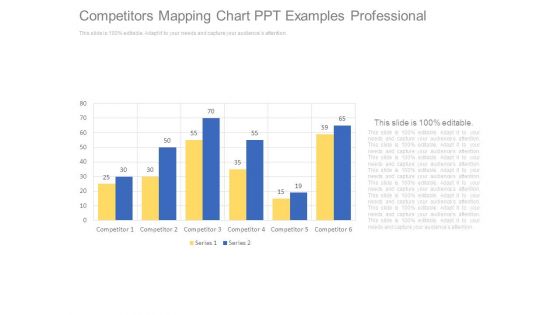
Competitors Mapping Chart Ppt Examples Professional
This is a competitors mapping chart ppt examples professional. This is a six stage process. The stages in this process are competitor, series.

X And R Analysis Chart Ppt Presentation
This is a x and r analysis chart ppt presentation. This is a two stage process. The stages in this process are subtitle, ucl, lcl, option.
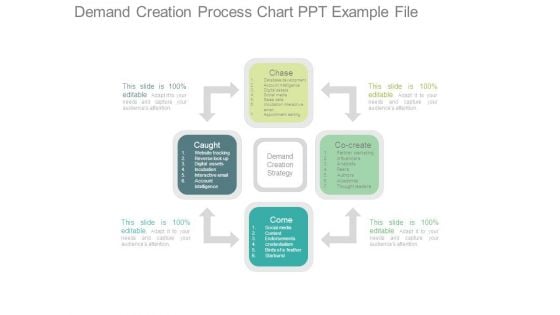
Demand Creation Process Chart Ppt Example File
This is a demand creation process chart ppt example file. This is a four stage process. The stages in this process are chase, come, caught, co create.
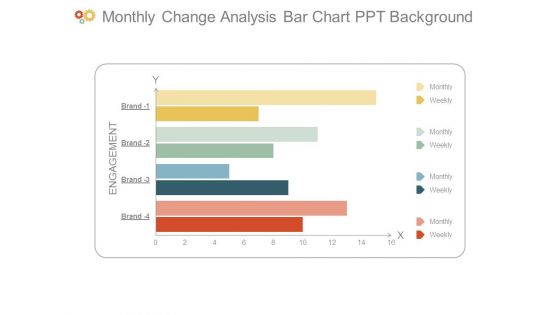
Monthly Change Analysis Bar Chart Ppt Background
This is a monthly change analysis bar chart ppt background. This is a four stage process. The stages in this process are engagement, monthly, weekly, brand.
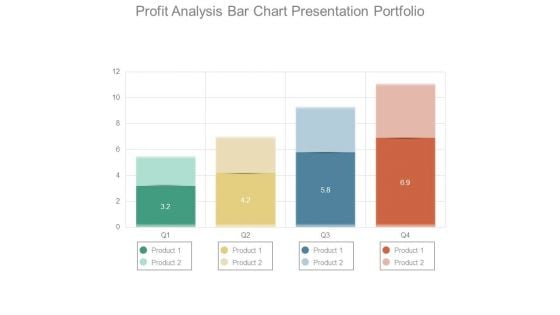
Profit Analysis Bar Chart Presentation Portfolio
This is a profit analysis bar chart presentation portfolio. This is a four stage process. The stages in this process are product.
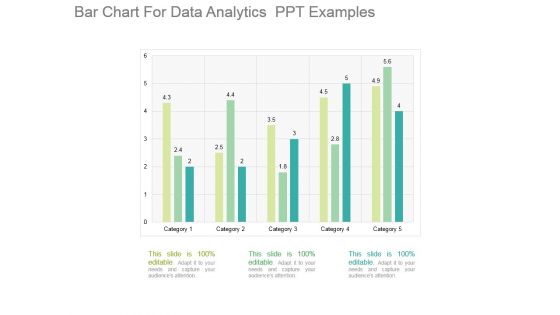
Bar Chart For Data Analytics Ppt Examples
This is a bar chart for data analytics ppt examples. This is a five stage process. The stages in this process are category.
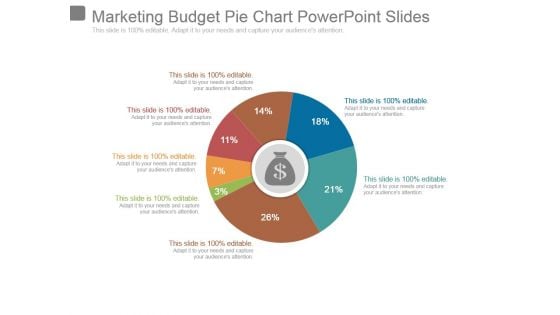
Marketing Budget Pie Chart Powerpoint Slides
This is a marketing budget pie chart powerpoint slides. This is a seven stage process. The stages in this process are business, marketing, strategy, finance, percentage.
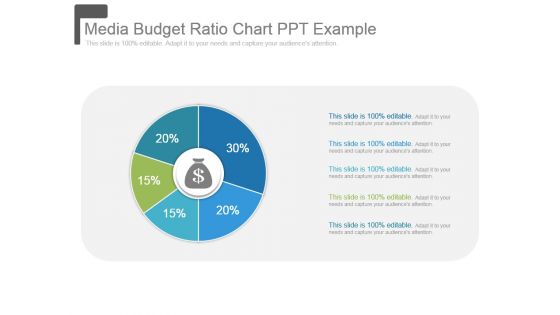
Media Budget Ratio Chart Ppt Example
This is a media budget ratio chart ppt example. This is a five stage process. The stages in this process are strategy, finance, percentage, business, marketing.
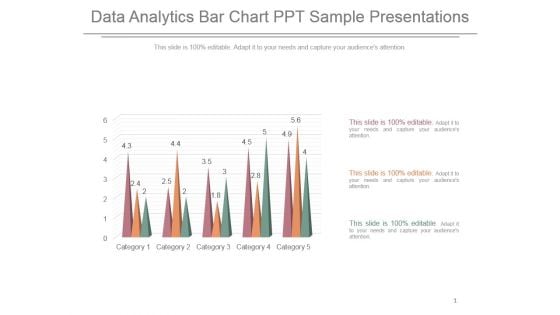
Data Analytics Bar Chart Ppt Sample Presentations
This is a data analytics bar chart ppt sample presentations. This is a five stage process. The stages in this process are category.
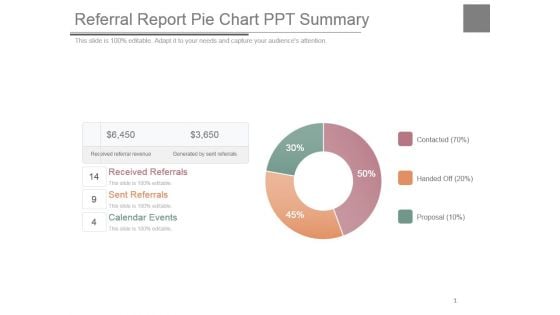
Referral Report Pie Chart Ppt Summary
This is a referral report pie chart ppt summary. This is a three stage process. The stages in this process are received referrals, sent referrals, calendar events.
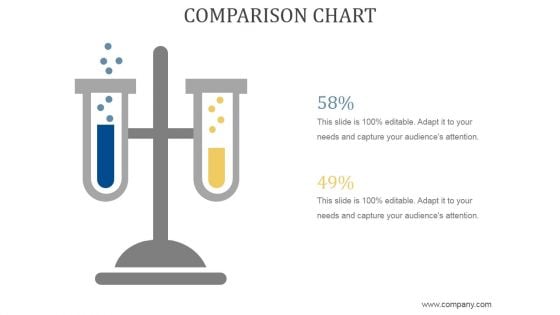
Comparison Chart Ppt PowerPoint Presentation Show
This is a comparison chart ppt powerpoint presentation show. This is a two stage process. The stages in this process are business, strategy, marketing, analysis, growth strategy, compare.
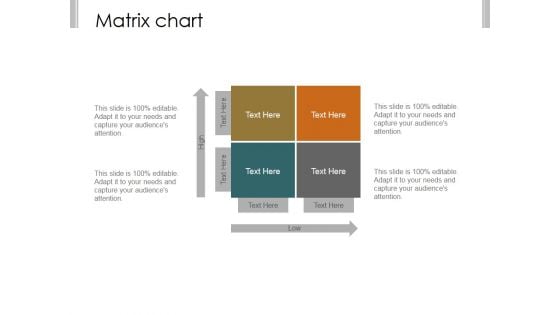
Matrix Chart Ppt PowerPoint Presentation Show
This is a matrix chart ppt powerpoint presentation show. This is a four stage process. The stages in this process are business, strategy, marketing, analysis.
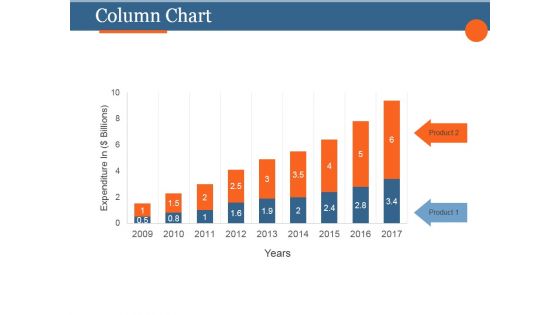
Column Chart Ppt PowerPoint Presentation Designs Download
This is a column chart ppt powerpoint presentation designs download. This is a two stage process. The stages in this process are business, strategy, marketing, analysis, growth.

Donut Chart Ppt PowerPoint Presentation Ideas
This is a donut chart ppt powerpoint presentation ideas. This is a six stage process. The stages in this process are business, strategy, marketing, analysis, finance.
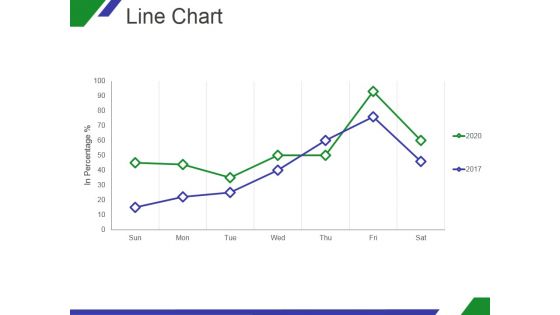
Line Chart Ppt PowerPoint Presentation Shapes
This is a line chart ppt powerpoint presentation shapes. This is a two stage process. The stages in this process are growth, in percentage, sun, mon, tue, wed.
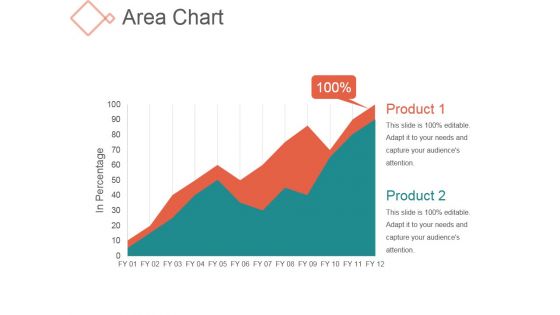
Area Chart Ppt PowerPoint Presentation Rules
This is a area chart ppt powerpoint presentation rules. This is a two stage process. The stages in this process are business, management, product, growth.
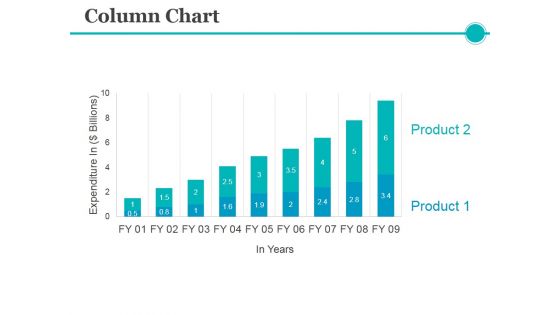
Column Chart Ppt PowerPoint Presentation Inspiration Visuals
This is a column chart ppt powerpoint presentation inspiration visuals. This is a nine stage process. The stages in this process are business, marketing, product, expenditure.
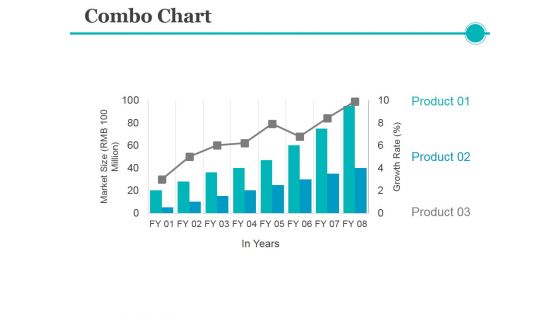
Combo Chart Ppt PowerPoint Presentation Pictures Layouts
This is a combo chart ppt powerpoint presentation pictures layouts. This is a eight stage process. The stages in this process are product, growth rate, market size, years.
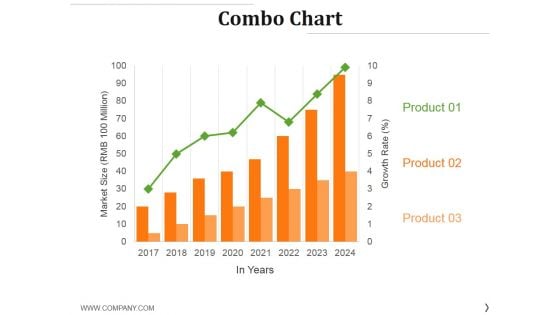
Combo Chart Ppt PowerPoint Presentation File Model
This is a combo chart ppt powerpoint presentation file model. This is a eight stage process. The stages in this process are product, year, market size, business, marketing.

Line Chart Ppt PowerPoint Presentation Model Visuals
This is a line chart ppt powerpoint presentation model visuals. This is a two stage process. The stages in this process are business, strategy, analysis, pretention, growth strategy.
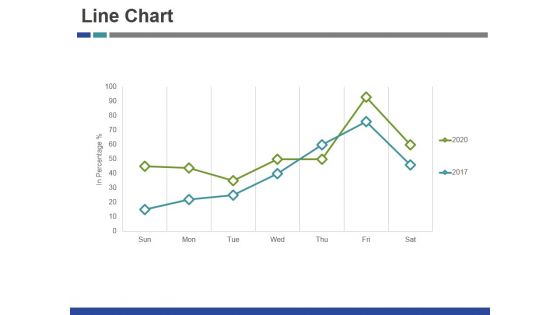
Line Chart Ppt PowerPoint Presentation Gallery Summary
This is a line chart ppt powerpoint presentation gallery summary. This is a two stage process. The stages in this process are finance, graph, business, management, marketing.
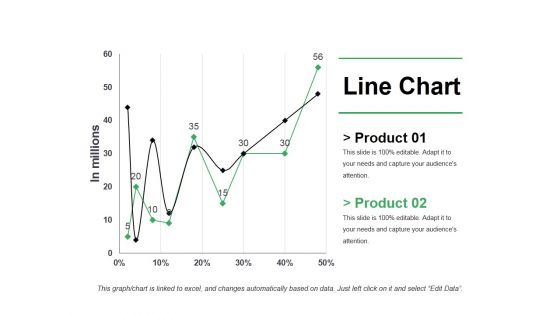
Line Chart Ppt PowerPoint Presentation Pictures Shapes
This is a line chart ppt powerpoint presentation pictures shapes. This is a two stage process. The stages in this process are business, marketing, strategy, finance, growth.

Column Chart Ppt PowerPoint Presentation Portfolio Inspiration
This is a column chart ppt powerpoint presentation portfolio inspiration. This is a two stage process. The stages in this process are finance, marketing, management, investment, analysis.
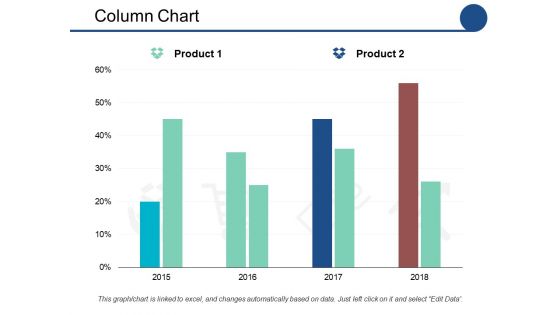
Column Chart Ppt PowerPoint Presentation Show Outfit
This is a column chart ppt powerpoint presentation show outfit. This is a two stage process. The stages in this process are product, percentage, marketing.
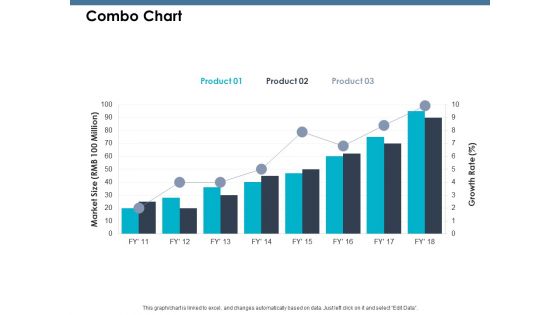
Combo Chart Ppt PowerPoint Presentation Model Grid
This is a combo chart ppt powerpoint presentation model grid. This is a three stage process. The stages in this process are growth, product, percentage, marketing.
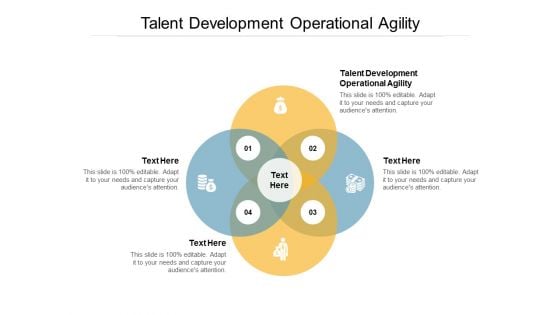
Talent Development Operational Agility Ppt PowerPoint Presentation Outline Graphics Tutorials Cpb
Presenting this set of slides with name talent development operational agility ppt powerpoint presentation outline graphics tutorials cpb. This is a four stage process. The stages in this process are talent development operational agility. This is a completely editable PowerPoint presentation and is available for immediate download. Download now and impress your audience.
Business Charts PowerPoint Templates Graduation Celebration Smiley Emoticon
Business Charts PowerPoint templates graduation celebration smiley emoticon-This PowerPoint Diagram Shows the Different types of Graduation smileys celebrating their completion of degree. It expresses achievement, attainment, close, conclusion, consummation, culmination, curtains, dispatch, end, expiration, finalization, finis, finish, fruition, fulfillment, hips, integration, perfection, realization.-Business Charts PowerPoint templates graduation celebration smiley emoticon Give a good account with our Business Charts PowerPoint Templates Graduation Celebration Smiley Emoticon. Put your views across with clarity.
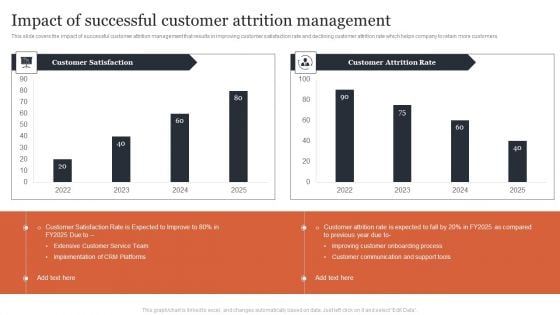
Managing Customer Attrition Impact Of Successful Customer Attrition Management Inspiration PDF
This slide covers the impact of successful customer attrition management that results in improving customer satisfaction rate and declining customer attrition rate which helps company to retain more customers. Do you have an important presentation coming up Are you looking for something that will make your presentation stand out from the rest Look no further than Managing Customer Attrition Impact Of Successful Customer Attrition Management Inspiration PDF. With our professional designs, you can trust that your presentation will pop and make delivering it a smooth process. And with Slidegeeks, you can trust that your presentation will be unique and memorable. So why wait Grab Managing Customer Attrition Impact Of Successful Customer Attrition Management Inspiration PDF today and make your presentation stand out from the rest.
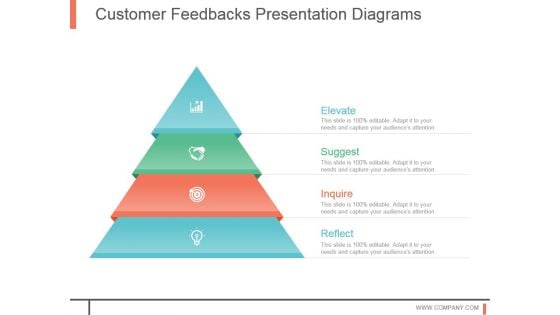
Customer Feedbacks Presentation Diagrams
This is a customer feedbacks presentation diagrams. This is a four stage process. The stages in this process are elevate, suggest, inquire, reflect.
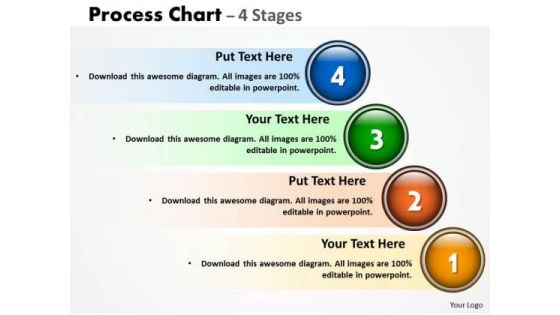
Mba Models And Frameworks Process Chart With 4 Stages Business Diagram
Open Up Doors That Lead To Success. Our MBA Models And Frameworks Process Chart With 4 Stages Business Diagram Powerpoint Templates Provide The Handles.
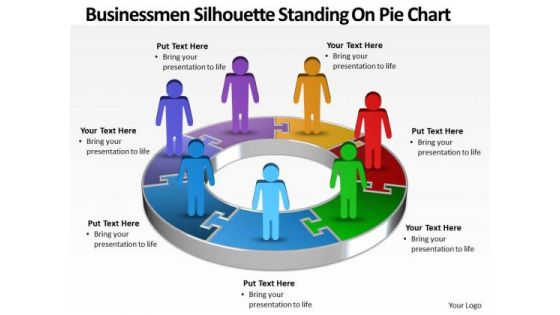
Strategic Management Busines Men Silhouettes Standing On Pie Chart Business Diagram
Knock On The Door To Success With Our Strategic Management Business Men Silhouettes Standing On Pie Chart Business Diagram Powerpoint Templates. Be Assured Of Gaining Entry.
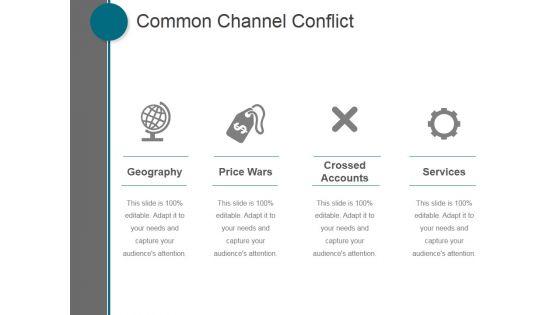
Common Channel Conflict Ppt PowerPoint Presentation Diagrams
This is a common channel conflict ppt powerpoint presentation diagrams. This is a four stage process. The stages in this process are geography, price wars, crossed accounts, services.

About Us Ppt PowerPoint Presentation Styles Diagrams
This is a about us ppt powerpoint presentation styles diagrams. This is a one stage process. The stages in this process are business, marketing, strategy, planning, management.
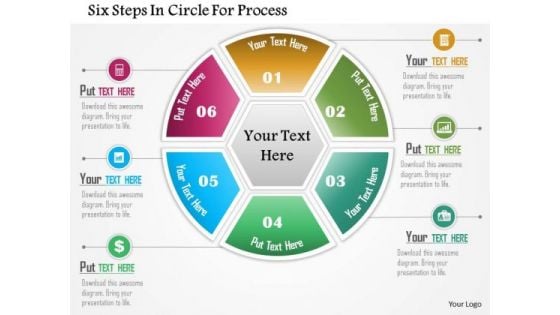
Business Diagram Six Steps In Circle For Process Presentation Template
Six steps circle diagram has been used to design this power point template. This diagram displays circle of steps. Amplify your thoughts via this appropriate business template.
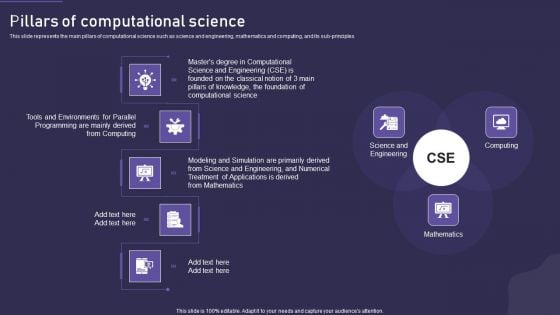
Computational Science Methodology Pillars Of Computational Science Themes PDF
This slide represents the main pillars of computational science such as science and engineering, mathematics and computing, and its sub principles. This is a Computational Science Methodology Pillars Of Computational Science Themes PDF template with various stages. Focus and dispense information on five stages using this creative set, that comes with editable features. It contains large content boxes to add your information on topics like Applications, Environments, Computational Science. You can also showcase facts, figures, and other relevant content using this PPT layout. Grab it now.
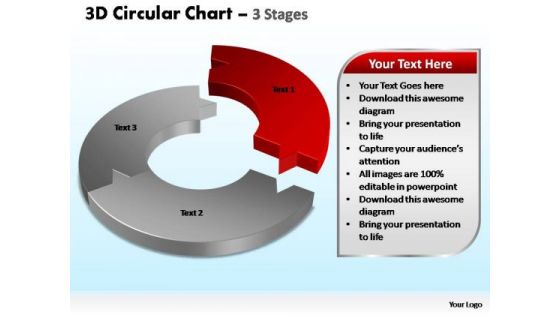
PowerPoint Slide Leadership Circular Chart Leadership
PowerPoint_Slide_Leadership_circular_chart_Leadership-The Circle of Life - a concept emmbedded in our minds and hence easy to comprehend. Life and Business is made up of processes comprising stages that flow from one to another. An excellent graphic to attract the attention of and understanding by your audience to improve earnings. Give a fillip to your campaign. Give it a fitting finale with our PowerPoint Slide Leadership Circular Chart Leadership.
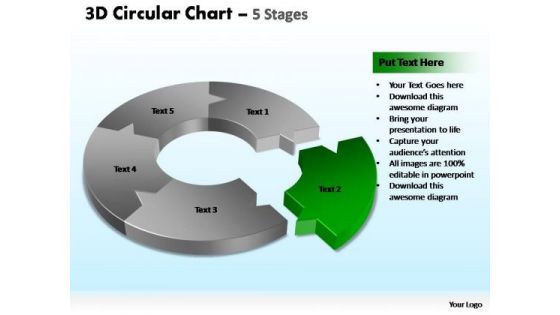
PowerPoint Slide Strategy Circular Chart Ppt Backgrounds
PowerPoint_Slide_Strategy_circular_chart_PPT_Backgrounds-The Circle of Life - a concept emmbedded in our minds and hence easy to comprehend. Life and Business is made up of processes comprising stages that flow from one to another. An excellent graphic to attract the attention of and understanding by your audience to improve earnings. Our PowerPoint Slide Strategy Circular Chart Ppt Backgrounds create presentations that blow your audience away. With our money back guarantee you have nothing to lose.

PowerPoint Slidelayout Image Circular Chart Ppt Backgrounds
PowerPoint_Slidelayout_Image_circular_chart_PPT_Backgrounds-The Circle of Life - a concept emmbedded in our minds and hence easy to comprehend. Life and Business is made up of processes comprising stages that flow from one to another. An excellent graphic to attract the attention of and understanding by your audience to improve earnings. Put your best foot forward with our PowerPoint Slidelayout Image Circular Chart Ppt Backgrounds. You will appear that much better.
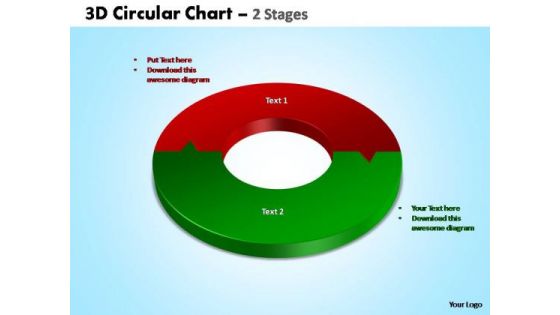
PowerPoint Slidelayout Image Circular Chart Ppt Presentation
PowerPoint_Slidelayout_Image_circular_chart_PPT_Presentation-The Circle of Life - a concept emmbedded in our minds and hence easy to comprehend. Life and Business is made up of processes comprising stages that flow from one to another. An excellent graphic to attract the attention of and understanding by your audience to improve earnings. Our PowerPoint Slidelayout Image Circular Chart Ppt Presentation will carry any burden. Be assured that they will take you far.
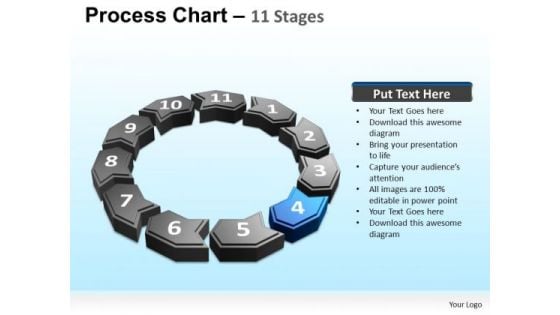
PowerPoint Process Teamwork Process Chart Ppt Template
PowerPoint Process Teamwork process chart PPT Template-The Circle of Life - a concept emmbedded in our minds and hence easy to comprehend. Life and Business is made up of processes comprising stages that flow from one to another. An excellent graphic to attract the attention of and understanding by your audience to improve earnings. Retrieve your thoughts with our PowerPoint Process Teamwork Process Chart Ppt Template. Download without worries with our money back guaranteee.

 Home
Home