Investigation Icons
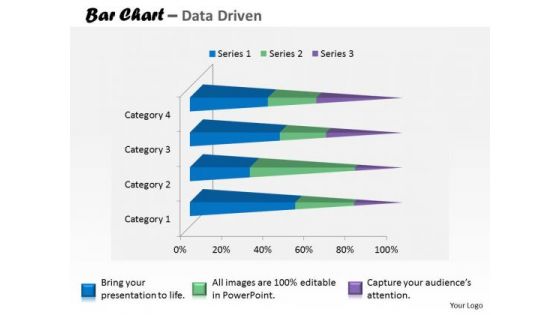
Financial Data Analysis Currency Trading Bar Chart PowerPoint Templates
Put In A Dollop Of Our financial data analysis currency trading bar chart Powerpoint Templates . Give Your Thoughts A Distinctive Flavor.
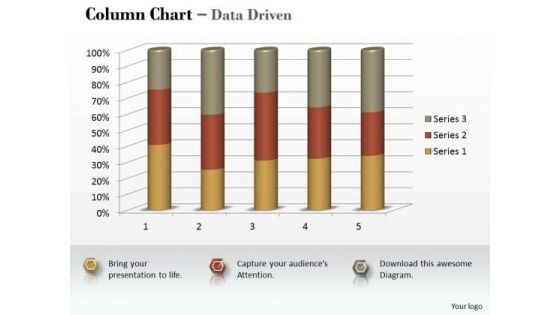
Marketing Data Analysis 3d Statistical Process Column Chart PowerPoint Templates
Be A Donor Of Great Ideas. Display Your Charity On Our marketing data analysis 3d statistical process column chart Powerpoint Templates .
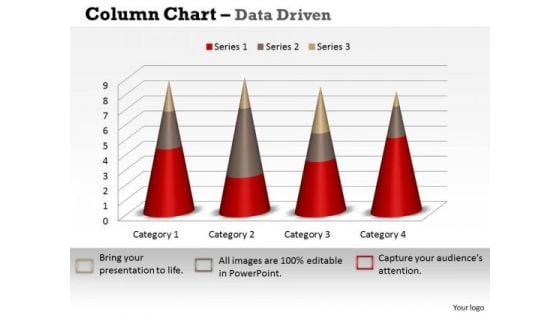
Marketing Data Analysis 3d Statistical Process Control Chart PowerPoint Templates
Open Up Doors That Lead To Success. Our marketing data analysis 3d statistical process control chart Powerpoint Templates Provide The Handles.

Microsoft Excel Data Analysis Bar Chart To Handle PowerPoint Templates
Our microsoft excel data analysis bar chart to handle Powerpoint Templates And Your Ideas Make A Great Doubles Pair. Play The Net With Assured Hands.
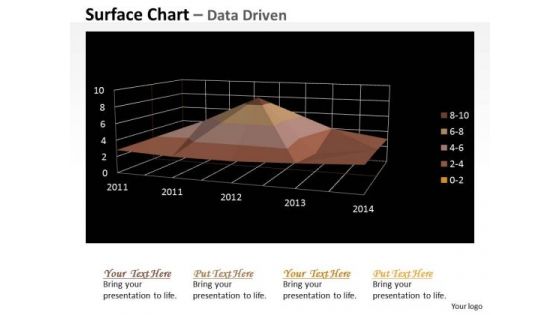
Multivariate Data Analysis Numeric Values Surface Chart PowerPoint Templates
Your Grasp Of Economics Is Well Known. Help Your Audience Comprehend Issues With Our multivariate data analysis numeric values surface chart Powerpoint Templates .
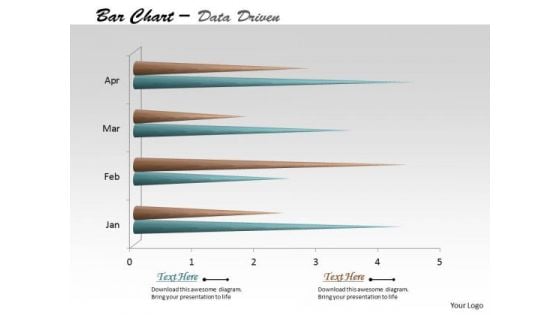
Multivariate Data Analysis Time Based Bar Chart PowerPoint Templates
Edit Your Work With Our multivariate data analysis time based bar chart Powerpoint Templates . They Will Help You Give The Final Form.
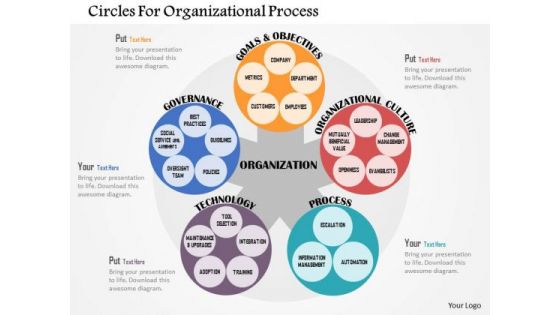
Business Diagram Circles For Organizational Process Presentation Template
This power point diagram has been designed with graphic of business framework cycle. This diagram contains the concept of business collaboration. Display your ideas with this unique diagram and get good remarks.
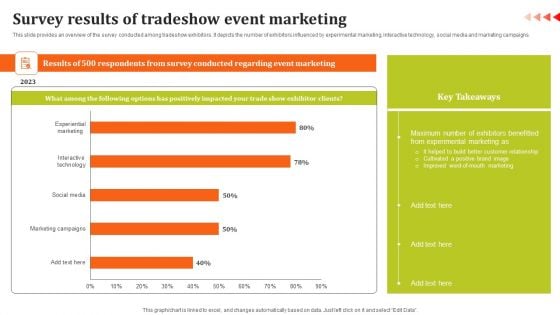
Survey Results Of Tradeshow Event Marketing Diagrams PDF
This slide provides an overview of the survey conducted among tradeshow exhibitors. It depicts the number of exhibitors influenced by experimental marketing, interactive technology, social media and marketing campaigns. Get a simple yet stunning designed Survey Results Of Tradeshow Event Marketing Diagrams PDF. It is the best one to establish the tone in your meetings. It is an excellent way to make your presentations highly effective. So, download this PPT today from Slidegeeks and see the positive impacts. Our easy to edit Survey Results Of Tradeshow Event Marketing Diagrams PDF can be your go to option for all upcoming conferences and meetings. So, what are you waiting for Grab this template today.
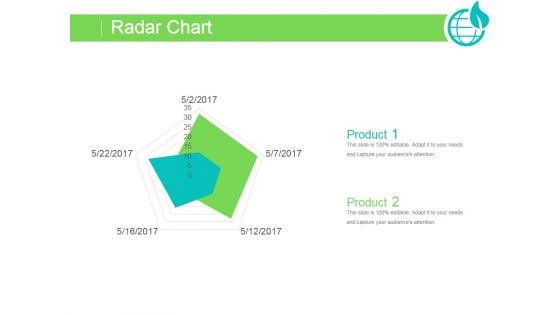
Radar Chart Ppt PowerPoint Presentation Summary
This is a radar chart ppt powerpoint presentation summary. This is a two stage process. The stages in this process are business, strategy, marketing, analysis, chart.
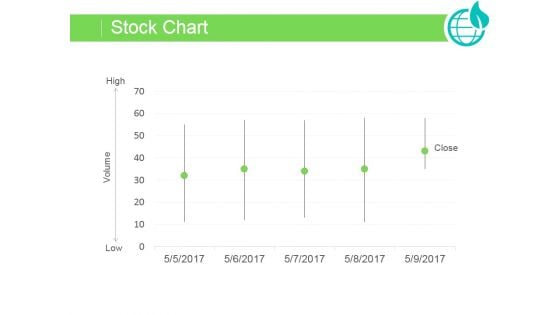
Stock Chart Ppt PowerPoint Presentation Template
This is a stock chart ppt powerpoint presentation template. This is a five stage process. The stages in this process are business, strategy, marketing, analysis, chart and graph.
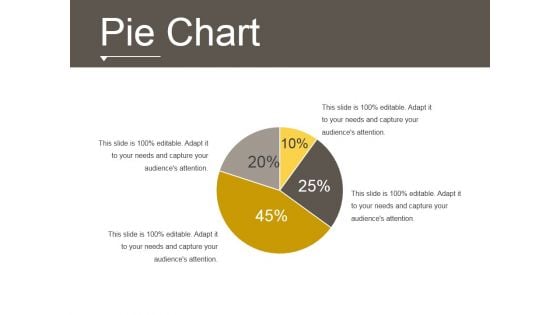
Pie Chart Ppt PowerPoint Presentation Images
This is a pie chart ppt powerpoint presentation images. This is a four stage process. The stages in this process are business, strategy, analysis, marketing, finance, pie chart.

Radar Chart Ppt PowerPoint Presentation Styles Show
This is a radar chart ppt powerpoint presentation styles show. This is a two stage process. The stages in this process are business, strategy, marketing, analysis, radar chart.
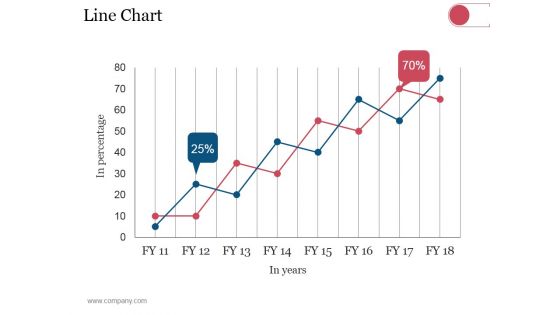
Line Chart Ppt PowerPoint Presentation Model Elements
This is a line chart ppt powerpoint presentation model elements. This is a eight stage process. The stages in this process are business, strategy, analysis, planning, line chart.
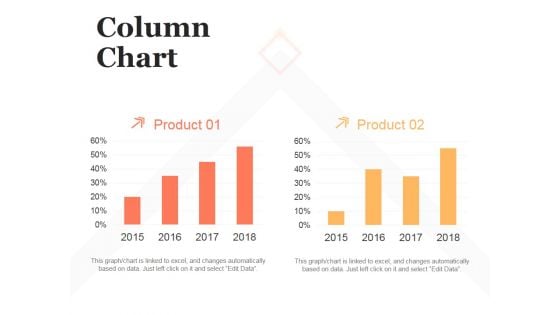
Column Chart Ppt PowerPoint Presentation Influencers
This is a column chart ppt powerpoint presentation influencers. This is a two stage process. The stages in this process are column chart, finance, marketing, strategy, analysis, business.
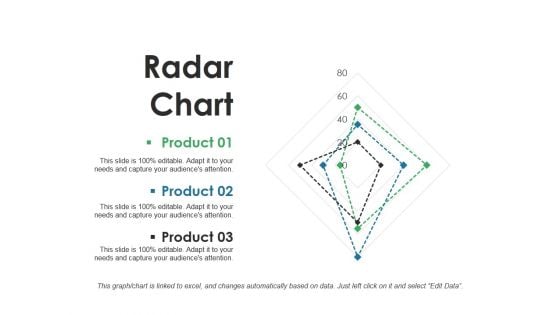
Radar Chart Ppt PowerPoint Presentation Deck
This is a radar chart ppt powerpoint presentation deck. This is a three stage process. The stages in this process are radar chart, analysis, finance, marketing, business.
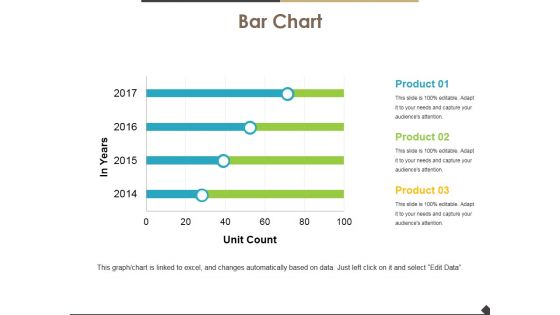
Bar Chart Ppt PowerPoint Presentation Show Grid
This is a bar chart ppt powerpoint presentation show grid. This is a four stage process. The stages in this process are bar chart, finance, marketing, analysis, business.
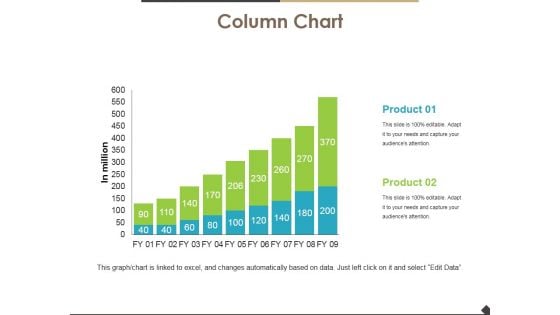
Column Chart Ppt PowerPoint Presentation Ideas Mockup
This is a column chart ppt powerpoint presentation ideas mockup. This is a two stage process. The stages in this process are column chart, finance, marketing, analysis, business.
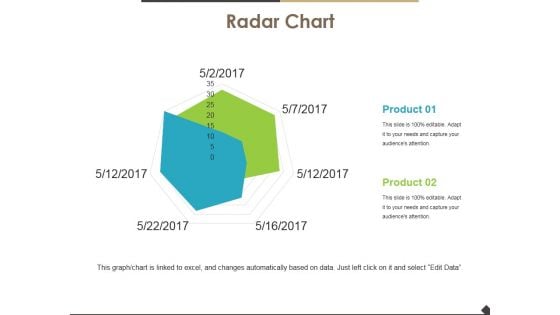
Radar Chart Ppt PowerPoint Presentation Inspiration Layouts
This is a radar chart ppt powerpoint presentation inspiration layouts. This is a two stage process. The stages in this process are radar chart, product, marketing, strategy, analysis.
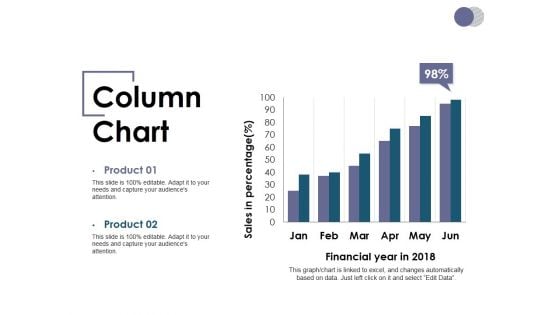
Column Chart Ppt PowerPoint Presentation Show Demonstration
This is a column chart ppt powerpoint presentation show demonstration. This is a two stage process. The stages in this process are column chart, finance, analysis, marketing, business.
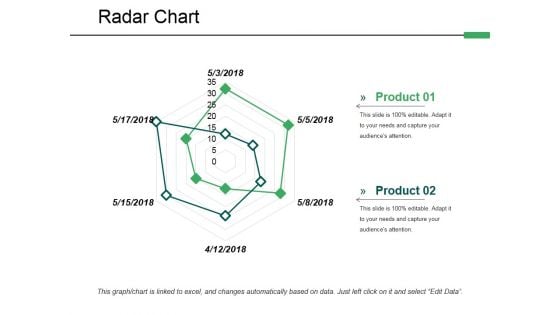
Radar Chart Ppt PowerPoint Presentation Summary Graphics
This is a radar chart ppt powerpoint presentation summary graphics. This is a two stage process. The stages in this process are radar chart, finance, analysis, marketing, business.
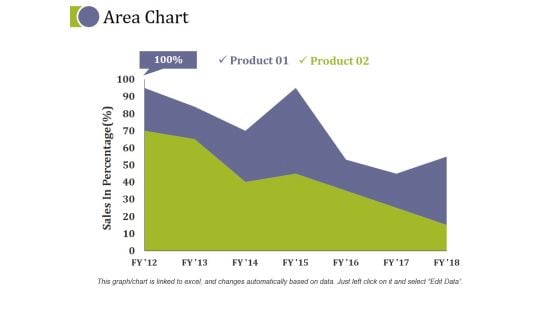
Area Chart Ppt PowerPoint Presentation Model Skills
This is a area chart ppt powerpoint presentation model skills. This is a two stage process. The stages in this process are area chart, finance, analysis, business, marketing.
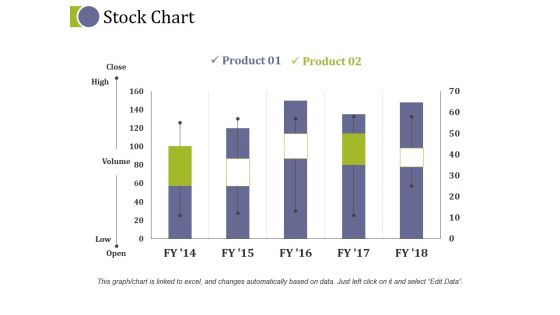
Stock Chart Ppt PowerPoint Presentation Outline Example
This is a stock chart ppt powerpoint presentation outline example. This is a two stage process. The stages in this process are stock chart, finance, analysis, business, marketing.
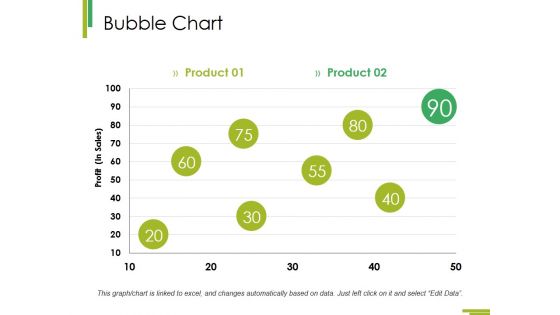
Bubble Chart Ppt PowerPoint Presentation Infographics Objects
This is a bubble chart ppt powerpoint presentation infographics objects. This is a two stage process. The stages in this process are finance, business, analysis, marketing, bubble chart.
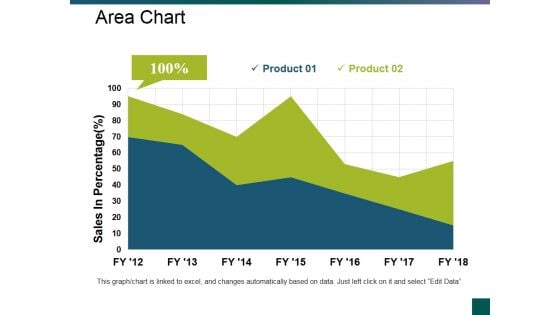
Area Chart Ppt PowerPoint Presentation File Gallery
This is a area chart ppt powerpoint presentation file gallery. This is a two stage process. The stages in this process are area chart, business, finance, marketing, analysis.
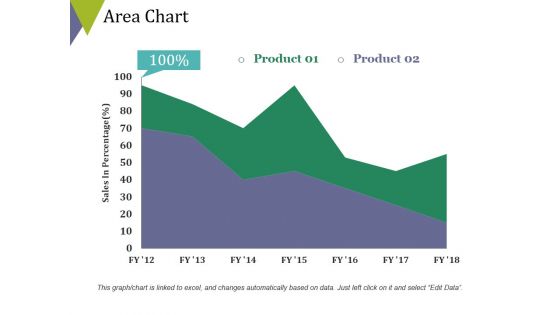
Area Chart Ppt PowerPoint Presentation Ideas Designs
This is a area chart ppt powerpoint presentation ideas designs. This is a two stage process. The stages in this process are area chart, finance, business, analysis, marketing.
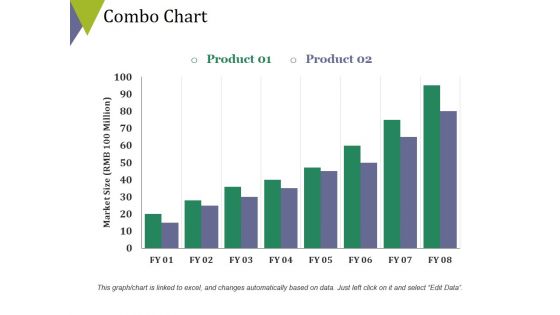
Combo Chart Ppt PowerPoint Presentation Show Styles
This is a combo chart ppt powerpoint presentation show styles. This is a two stage process. The stages in this process are finance, business, analysis, marketing, combo chart.
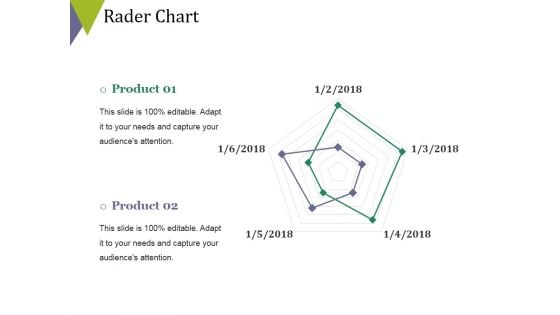
Rader Chart Ppt PowerPoint Presentation Portfolio Infographics
This is a rader chart ppt powerpoint presentation portfolio infographics. This is a two stage process. The stages in this process are rader chart, finance, analysis, business, marketing.
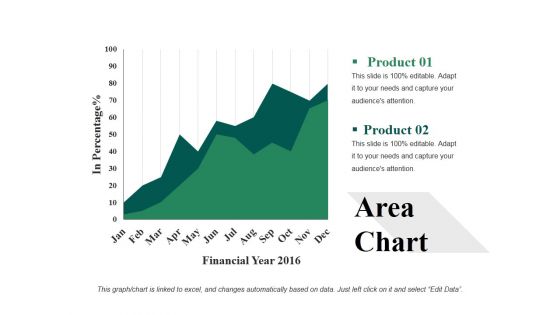
Area Chart Ppt PowerPoint Presentation Inspiration Deck
This is a area chart ppt powerpoint presentation inspiration deck. This is a two stage process. The stages in this process are area chart, analysis, strategy, finance, business.
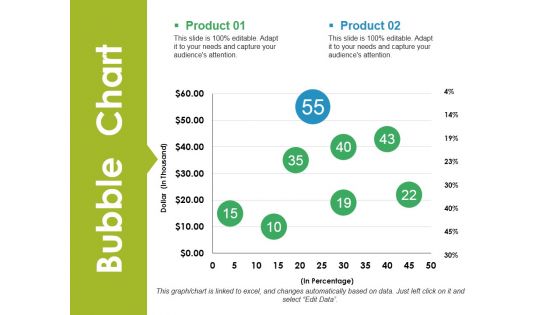
Bubble Chart Ppt PowerPoint Presentation Ideas Files
This is a bubble chart ppt powerpoint presentation ideas files. This is a two stage process. The stages in this process are Bubble Chart, Finance, Marketing, Analysis, Business.
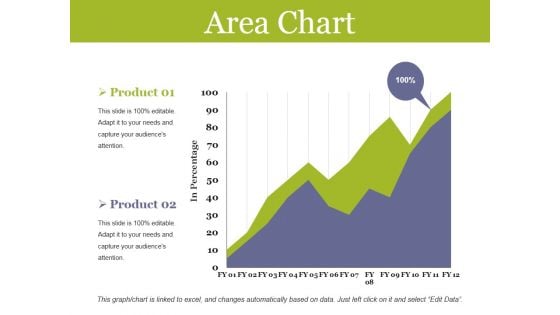
Area Chart Ppt PowerPoint Presentation Professional Templates
This is a area chart ppt powerpoint presentation professional templates. This is a two stage process. The stages in this process are area chart, finance, marketing, analysis, business.
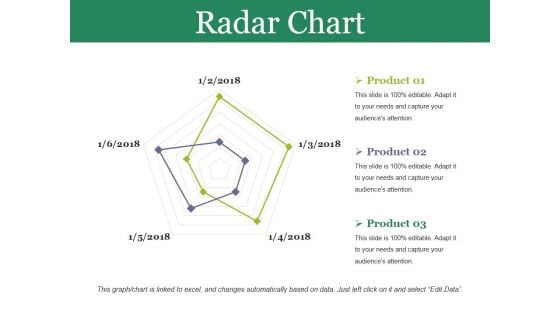
Radar Chart Ppt PowerPoint Presentation Styles Clipart
This is a radar chart ppt powerpoint presentation styles clipart. This is a two stage process. The stages in this process are finance, business, analysis, radar chart, strategy.
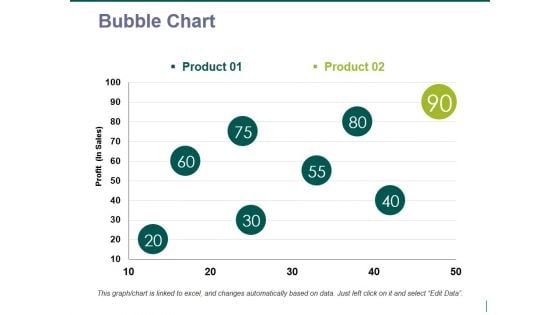
bubble chart ppt powerpoint presentation styles grid
This is a bubble chart ppt powerpoint presentation styles grid. This is a two stage process. The stages in this process are bubble chart, finance, analysis, marketing, business.
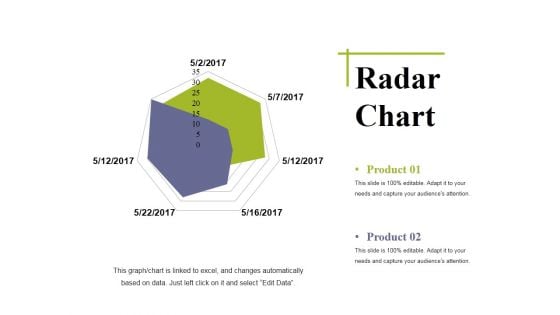
Radar Chart Ppt PowerPoint Presentation Outline Deck
This is a radar chart ppt powerpoint presentation outline deck. This is a two stage process. The stages in this process are radar chart, marketing, strategy, analysis, business.

Scatter Chart Ppt PowerPoint Presentation Inspiration Professional
This is a scatter chart ppt powerpoint presentation inspiration professional. This is a two stage process. The stages in this process are scatter chart, finance, marketing, analysis, business.
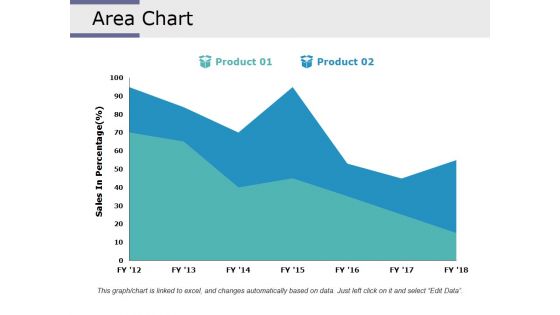
Area Chart Ppt PowerPoint Presentation Styles Influencers
This is a area chart ppt powerpoint presentation styles influencers. This is a two stage process. The stages in this process are area chart, finance, analysis, business, marketing.
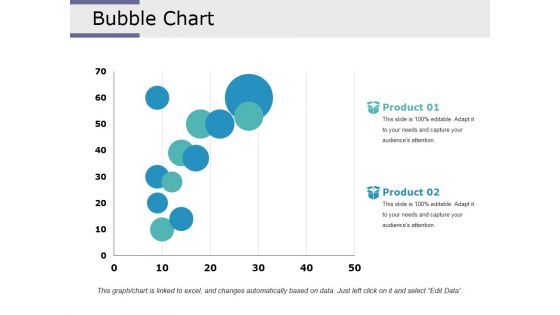
Bubble Chart Ppt PowerPoint Presentation Inspiration Portfolio
This is a bubble chart ppt powerpoint presentation inspiration portfolio. This is a two stage process. The stages in this process are bubble chart, finance, analysis, marketing, strategy.

Rader Chart Ppt PowerPoint Presentation Portfolio Deck
This is a rader chart ppt powerpoint presentation portfolio deck. This is a two stage process. The stages in this process are radar chart, finance, analysis, marketing, business.
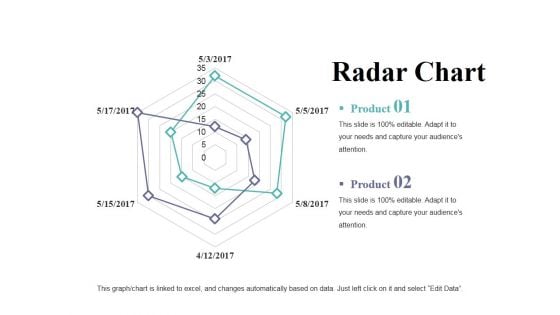
Radar Chart Ppt PowerPoint Presentation Portfolio Clipart
This is a radar chart ppt powerpoint presentation portfolio clipart. This is a two stage process. The stages in this process are radar chart, finance, analysis, marketing, business.
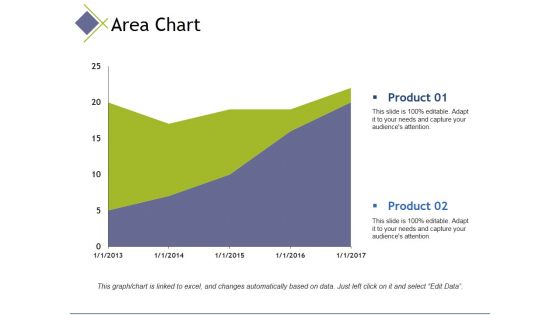
area chart ppt powerpoint presentation inspiration designs
This is a area chart ppt powerpoint presentation inspiration designs. This is a two stage process. The stages in this process are area chart, finance, analysis, marketing, business.
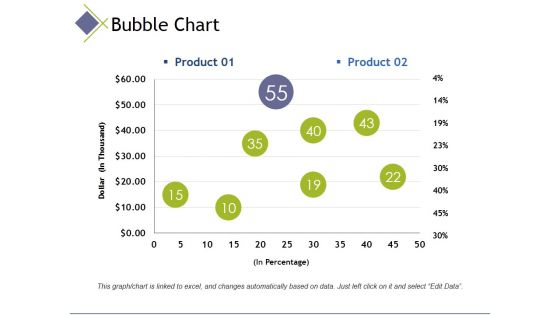
bubble chart ppt powerpoint presentation inspiration elements
This is a bubble chart ppt powerpoint presentation inspiration elements. This is a two stage process. The stages in this process are bubble chart, finance, analysis, marketing, business.

Area Chart Ppt PowerPoint Presentation Portfolio Show
This is a area chart ppt powerpoint presentation portfolio show. This is a two stage process. The stages in this process are area chart, finance, analysis, business, marketing.

Combo Chart Ppt PowerPoint Presentation Infographics Good
This is a combo chart ppt powerpoint presentation infographics good. This is a three stage process. The stages in this process are combo chart, finance, analysis, business, marketing.
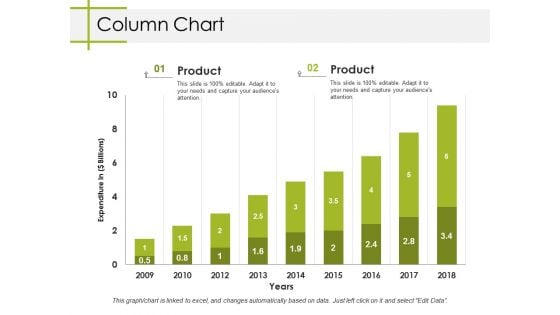
Column Chart Ppt PowerPoint Presentation Styles Clipart
This is a column chart ppt powerpoint presentation styles clipart. This is a two stage process. The stages in this process are column chart, finance, marketing, analysis, business.
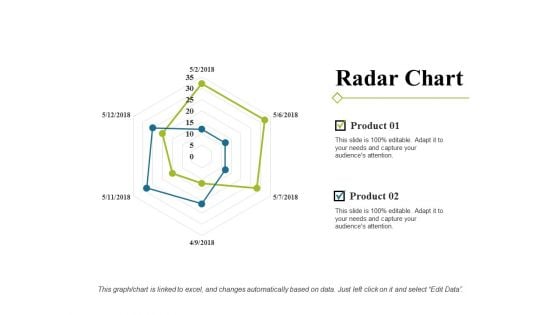
Radar Chart Ppt PowerPoint Presentation Portfolio Show
This is a radar chart ppt powerpoint presentation portfolio show. This is a two stage process. The stages in this process are radar chart, finance, marketing, strategy, analysis.
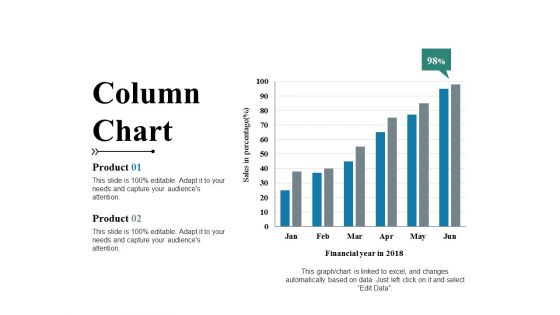
Column Chart Ppt PowerPoint Presentation Inspiration Inspiration
This is a column chart ppt powerpoint presentation inspiration inspiration. This is a two stage process. The stages in this process are column chart, growth, strategy, business, analysis.
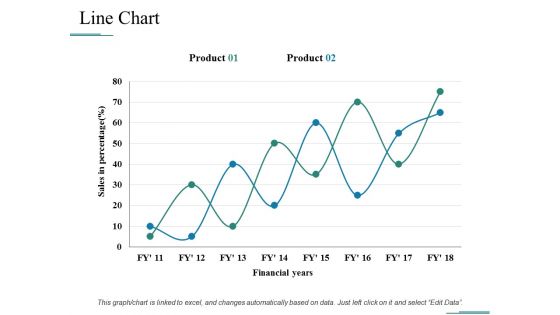
Line Chart Ppt PowerPoint Presentation Ideas Tips
This is a line chart ppt powerpoint presentation ideas tips. This is a two stage process. The stages in this process are line chart, growth, strategy, business, analysis.
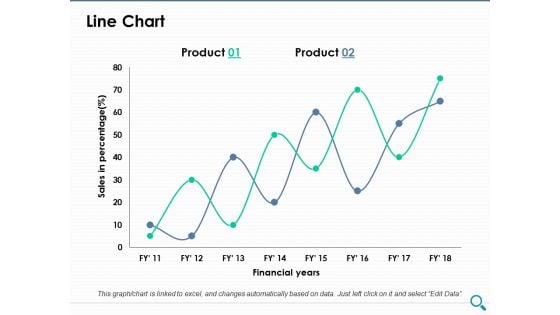
Line Chart Ppt PowerPoint Presentation Model Model
This is a line chart ppt powerpoint presentation model model. This is a two stage process. The stages in this process are line chart, growth, strategy, business, analysis.
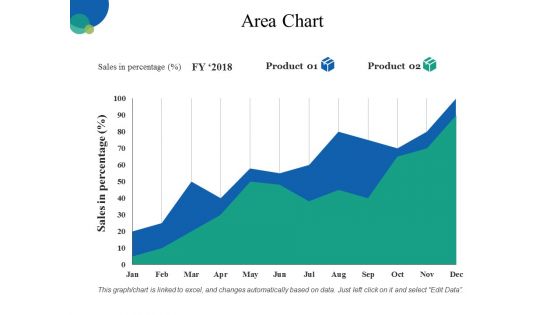
Area Chart Ppt PowerPoint Presentation Guidelines
This is a area chart ppt powerpoint presentation guidelines. This is a two stage process. The stages in this process are business, marketing, analysis, area chart, finance.
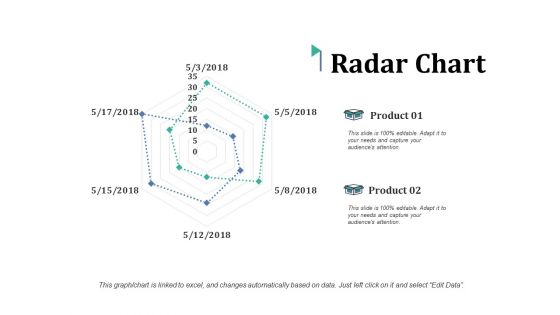
Radar Chart Ppt PowerPoint Presentation Pictures Smartart
This is a radar chart ppt powerpoint presentation pictures smartart. This is a two stage process. The stages in this process are radar chart, finance, marketing, analysis, management.
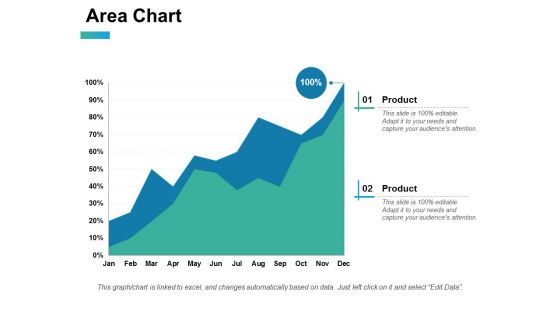
Area Chart Ppt PowerPoint Presentation Summary Guidelines
This is a area chart ppt powerpoint presentation summary guidelines. This is a two stage process. The stages in this process are area chart, finance, analysis, investment, marketing.
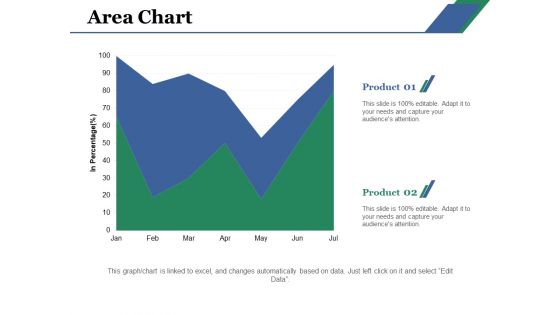
Area Chart Ppt PowerPoint Presentation Layouts Gridlines
This is a area chart ppt powerpoint presentation layouts gridlines. This is a two stage process. The stages in this process are area chart, product, percentage, analysis, capture.
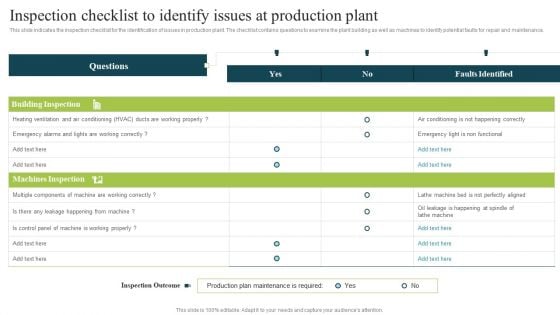
Plan To Enhance Manufacturing Inspection Checklist To Identify Issues At Production Summary PDF
This slide indicates the inspection checklist for the identification of issues in production plant. The checklist contains questions to examine the plant building as well as machines to identify potential faults for repair and maintenance. Do you know about Slidesgeeks Plan To Enhance Manufacturing Inspection Checklist To Identify Issues At Production Summary PDF These are perfect for delivering any kind od presentation. Using it, create PowerPoint presentations that communicate your ideas and engage audiences. Save time and effort by using our pre-designed presentation templates that are perfect for a wide range of topic. Our vast selection of designs covers a range of styles, from creative to business, and are all highly customizable and easy to edit. Download as a PowerPoint template or use them as Google Slides themes.
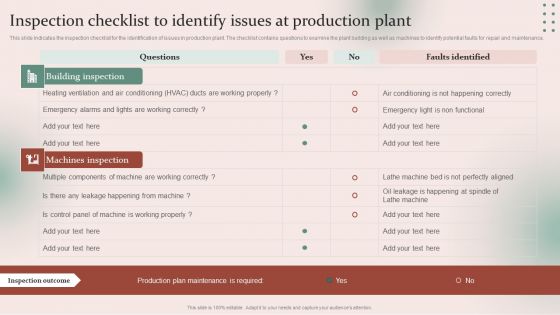
Strategies For Effective Manufacturing Inspection Checklist To Identify Issues At Production Ideas PDF
This slide indicates the inspection checklist for the identification of issues in production plant. The checklist contains questions to examine the plant building as well as machines to identify potential faults for repair and maintenance. Do you know about Slidesgeeks Strategies For Effective Manufacturing Inspection Checklist To Identify Issues At Production Ideas PDF These are perfect for delivering any kind od presentation. Using it, create PowerPoint presentations that communicate your ideas and engage audiences. Save time and effort by using our pre-designed presentation templates that are perfect for a wide range of topic. Our vast selection of designs covers a range of styles, from creative to business, and are all highly customizable and easy to edit. Download as a PowerPoint template or use them as Google Slides themes.
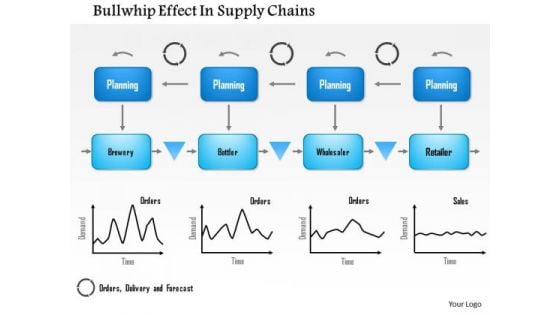
Business Framework Bullwhip Effect In Supply Chains PowerPoint Presentation
Explain the effect of bullwhip condition on larger inventories with this innovative power point diagram slide. This slide contains the graphic of this bullwhip effect with x-y chart for total effect on SCM. This effect is based on customer demand which creates larger swings on inventories. Use this diagram for SCM related presentations.
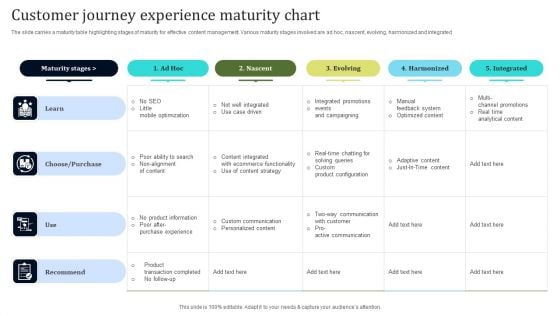
Customer Journey Experience Maturity Chart Demonstration PDF
The slide carries a maturity table highlighting stages of maturity for effective content management. Various maturity stages involved are ad hoc, nascent, evolving, harmonized and integrated. Showcasing this set of slides titled Customer Journey Experience Maturity Chart Demonstration PDF. The topics addressed in these templates are Purchase, Content Strategy, Ecommerce Functionality. All the content presented in this PPT design is completely editable. Download it and make adjustments in color, background, font etc. as per your unique business setting.
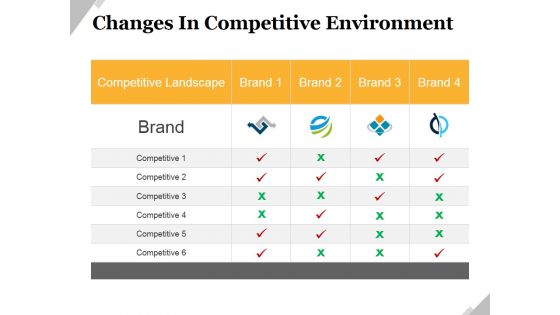
Changes In Competitive Environment Template 2 Ppt PowerPoint Presentation Professional Themes
This is a changes in competitive environment template 2 ppt powerpoint presentation professional themes. This is a four stage process. The stages in this process are brand, business, marketing, competitive landscape, growth.
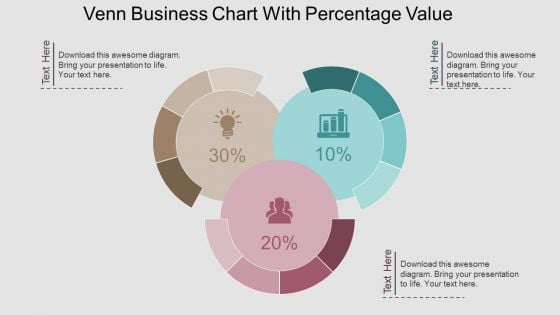
Venn Business Chart With Percentage Value Powerpoint Template
This PPT slide contains Venn business chart with percentage values. This PPT diagram is suitable to present data comparison and analysis. Enlighten others on the process with this innovative PowerPoint template.
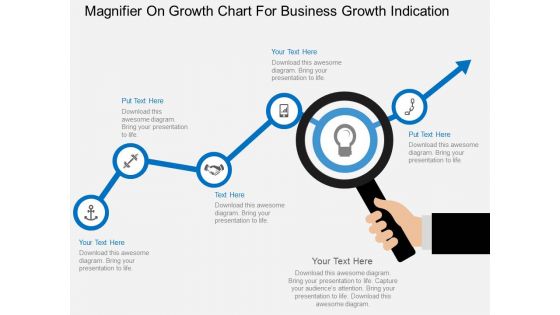
Magnifier On Growth Chart For Business Growth Indication Powerpoint Template
This business slide contains graphics of magnifier on growth chart. This PowerPoint template helps to display business planning and analysis. Use this diagram to impart more clarity to concept and to create more sound impact on viewers.
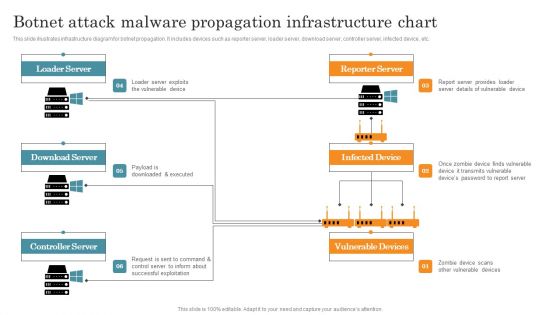
Botnet Attack Malware Propagation Infrastructure Chart Graphics PDF
This slide illustrates infrastructure diagram for botnet propagation. It includes devices such as reporter server, loader server, download server, controller server, infected device, etc. Pitch your topic with ease and precision using this Botnet Attack Malware Propagation Infrastructure Chart Graphics PDF. This layout presents information on Loader Server, Download Server, Controller Server. It is also available for immediate download and adjustment. So, changes can be made in the color, design, graphics or any other component to create a unique layout.
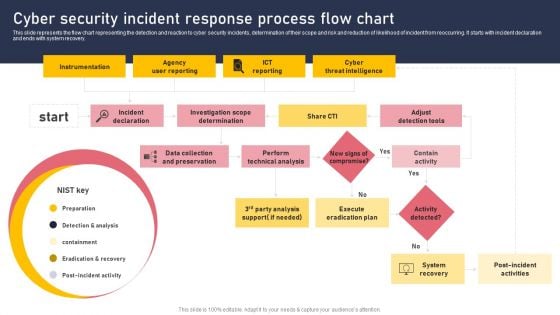
Cyber Security Incident Response Process Flow Chart Download PDF
This slide represents the flow chart representing the detection and reaction to cyber security incidents, determination of their scope and risk and reduction of likelihood of incident from reoccurring. It starts with incident declaration and ends with system recovery. This Cyber Security Incident Response Process Flow Chart Download PDF from Slidegeeks makes it easy to present information on your topic with precision. It provides customization options, so you can make changes to the colors, design, graphics, or any other component to create a unique layout. It is also available for immediate download, so you can begin using it right away. Slidegeeks has done good research to ensure that you have everything you need to make your presentation stand out. Make a name out there for a brilliant performance.


 Continue with Email

 Home
Home


