Investigation Icons
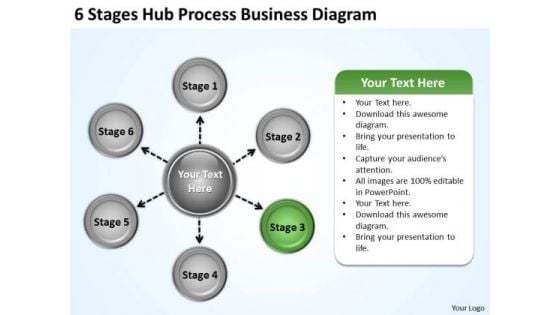
Basic Marketing Concepts 6 Stages Hub Process Business Diagram Ppt Strategy Review
We present our basic marketing concepts 6 stages hub process business diagram ppt strategy review.Present our Competition PowerPoint Templates because You have a driving passion to excel in your field. Our PowerPoint Templates and Slides will prove ideal vehicles for your ideas. Present our Marketing PowerPoint Templates because Our PowerPoint Templates and Slides will effectively help you save your valuable time. They are readymade to fit into any presentation structure. Use our Arrows PowerPoint Templates because Our PowerPoint Templates and Slides will let Your superior ideas hit the target always and everytime. Download our Business PowerPoint Templates because Our PowerPoint Templates and Slides will let your team Walk through your plans. See their energy levels rise as you show them the way. Download and present our Circle Charts PowerPoint Templates because Watching this your Audience will Grab their eyeballs, they wont even blink.Use these PowerPoint slides for presentations relating to Achievement, arrow, business, chart, communication, competition, development, diagram, direction, financial, forward, graphic, growth, increase, investment, leadership, management, marketing, moving, organization, presentation, profit, progress, report, representation, shape, sign, stakeholder, success, symbol, target, teamwork, tool, upwards, way, win. The prominent colors used in the PowerPoint template are Green, Black, Gray. Bid farewell to all your doubts. Attain assuredness with our Basic Marketing Concepts 6 Stages Hub Process Business Diagram Ppt Strategy Review.
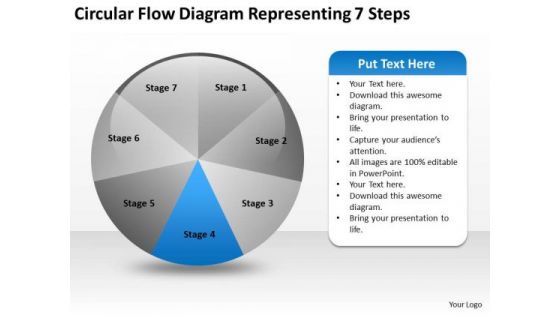
Circular Flow Diagram Representing 7 Steps Computer Business Plan PowerPoint Slides
We present our circular flow diagram representing 7 steps computer business plan PowerPoint Slides.Use our Flow Charts PowerPoint Templates because Our PowerPoint Templates and Slides will let your team Walk through your plans. See their energy levels rise as you show them the way. Download and present our Process and Flows PowerPoint Templates because Our PowerPoint Templates and Slides will let you Illuminate the road ahead to Pinpoint the important landmarks along the way. Use our Business PowerPoint Templates because Our PowerPoint Templates and Slides will let you Leave a lasting impression to your audiences. They possess an inherent longstanding recall factor. Use our Success PowerPoint Templates because Our PowerPoint Templates and Slides are Clear and concise. Use them and dispel any doubts your team may have. Download and present our Marketing PowerPoint Templates because Our PowerPoint Templates and Slides has conjured up a web of all you need with the help of our great team. Use them to string together your glistening ideas.Use these PowerPoint slides for presentations relating to Pie, chart, round, flow, slices, steps, process, graph, wheel, corporate, business, blank, curving, diagram, copyspace, graphic,directional, shape, modern, cycle, blue, circular, clipart, stages, seven, segments, clip, infographic, art, work, clockwise, financial. The prominent colors used in the PowerPoint template are Blue, Black, Gray. Curb assumptions with our Circular Flow Diagram Representing 7 Steps Computer Business Plan PowerPoint Slides. Face up to them with the facts.
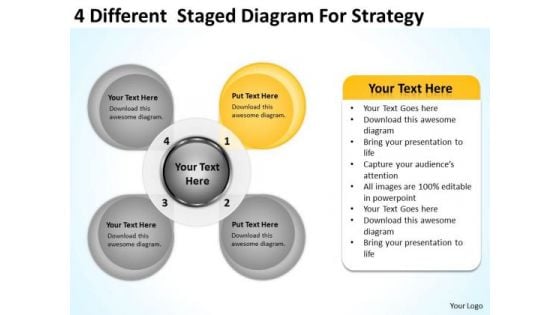
4 Different Staged Diagram For Strategy Ppt Business Plan Examples PowerPoint Templates
We present our 4 different staged diagram for strategy ppt business plan examples PowerPoint templates.Present our Marketing PowerPoint Templates because Our PowerPoint Templates and Slides will effectively help you save your valuable time. They are readymade to fit into any presentation structure. Download and present our Success PowerPoint Templates because Timeline crunches are a fact of life. Meet all deadlines using our PowerPoint Templates and Slides. Download and present our Arrows PowerPoint Templates because It is Aesthetically crafted by artistic young minds. Our PowerPoint Templates and Slides are designed to display your dexterity. Download our Process and Flows PowerPoint Templates because You are working at that stage with an air of royalty. Let our PowerPoint Templates and Slides be the jewels in your crown. Use our Circle Charts PowerPoint Templates because Our PowerPoint Templates and Slides will provide weight to your words. They will bring out the depth of your thought process.Use these PowerPoint slides for presentations relating to Act, Arrow, Blue, Business, Chart, Check, Circle, Concept, Control, Creative, Cycle, Design, Development, Diagram, Do, Engineering, Evaluate, Flow, Glossy, Graphic, Green, Idea, Life, Lifecycle, Management, Marketing, Method, Model, Plan, Plan-Do-Check-Act, Process, Quality, Red, Research, Software, Spiral, Step, Strategy, Success. The prominent colors used in the PowerPoint template are Yellow, Grey, Black. Overcome doubts with our 4 Different Staged Diagram For Strategy Ppt Business Plan Examples PowerPoint Templates. You will come out on top.
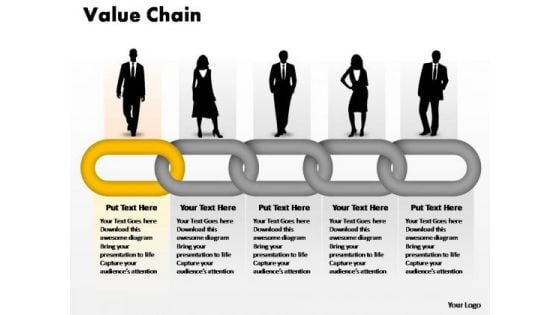
PowerPoint Presentation Chart Designs Business Value Chain Ppt Slide
PowerPoint Presentation Chart Designs Business Value Chain PPT Slide- By using this value chain diagram you can visualize events and the analysis of risks and uncertainties can be significantly explained. -PowerPoint Presentation Chart Designs Business Value Chain PPT Slide Develop a customer driven ethic for your team. Use our PowerPoint Presentation Chart Designs Business Value Chain Ppt Slide to convince them to display care.
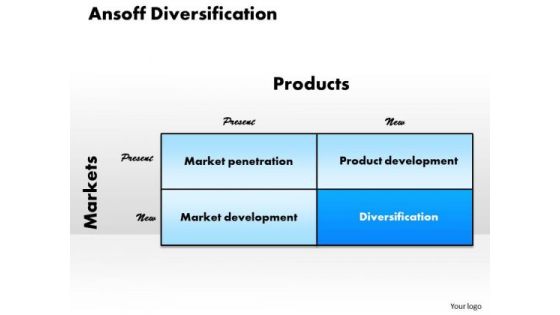
Business Framework Ansoff Diversification PowerPoint Presentation
The Ansoff Matrix, designed by Igor Ansoff, classifies and explains different growth strategies for a company. Use this diagram to explain diversification strategies of a new product.
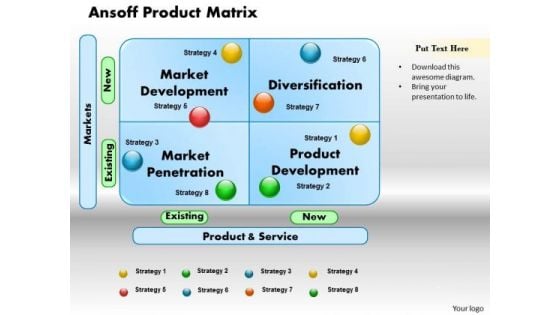
Business Framework Ansoff Product Matrix PowerPoint Presentation
The Ansoff Matrix, designed by Igor Ansoff, classifies and explains different growth strategies for a company. Use this diagram to explain diversification strategies of a new product.
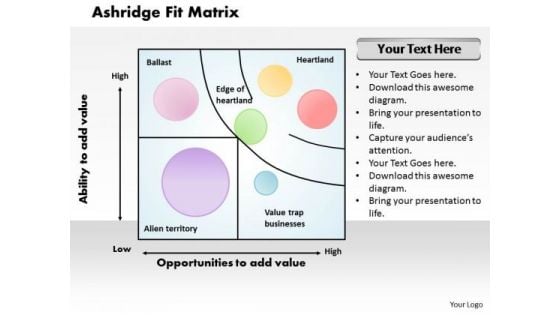
Business Framework Ashridge Fit Matrix PowerPoint Presentation
Ashridge portfolio matrix is used to evaluate the attractiveness of potential acquisition. Use this professional diagram for strategic management and strategic planning related topics.
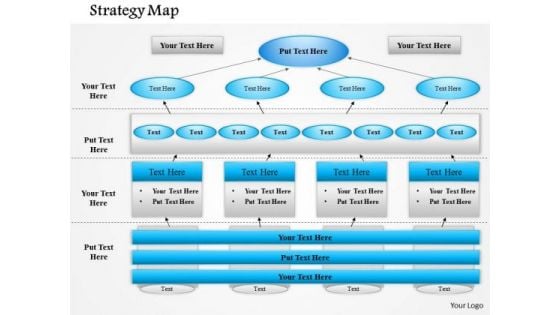
Business Framework Business Strategy Map PowerPoint Presentation
this business framework PPTslide has been designed with graphic of multilevel flow chart with multiple stages. This diagram PPT is usable for business strategy map. Use it and build a quality presentation for business topics.
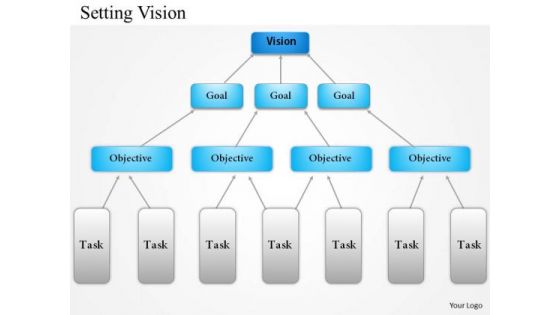
Business Framework Setting Vision PowerPoint Presentation
Set your business vision with this exclusive business framework power point template. This business PPT contains the graphic of flow chart architecture with three stages. Use this diagram template for setting vision and goal for getting success in business.
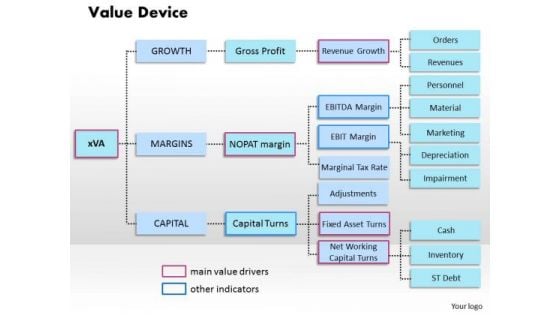
Business Framework Value Device PowerPoint Presentation
This business slide depicts framework of value device. It contains flow chart depicting activities related to growth margin and capital. Download this diagram as a tool for business presentations
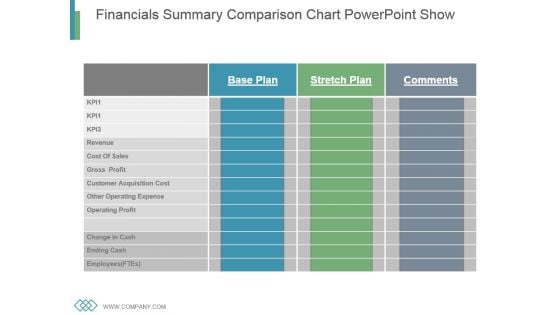
Financials Summary Comparison Chart Powerpoint Show
This is a financials summary comparison chart powerpoint show. This is a three stage process. The stages in this process are revenue, cost of sales, gross profit, customer acquisition cost, other operating cost expense, operating profit, change in cash, ending cash, employees.

Global Automotive Industry Research And Analysis Global Motor Vehicle Sales By Region Diagrams PDF
This slide covers a graphical representation of worldwide automobile sales for Europe, Asia, Africa, NAFTA, Central, and South America, etc. It also includes key insights about Chinese car sales expansion, USA sales, Indias sales, etc. Explore a selection of the finest Global Automotive Industry Research And Analysis Global Motor Vehicle Sales By Region Diagrams PDF here. With a plethora of professionally designed and pre made slide templates, you can quickly and easily find the right one for your upcoming presentation. You can use our Global Automotive Industry Research And Analysis Global Motor Vehicle Sales By Region Diagrams PDF to effectively convey your message to a wider audience. Slidegeeks has done a lot of research before preparing these presentation templates. The content can be personalized and the slides are highly editable. Grab templates today from Slidegeeks.

Techniques For Enhancing Buyer Acquisition Impact Analysis Of Increasing Acquired Customers Diagrams PDF
This slide covers the effect of improving consumers on CAC Client Acquisition Cost. It includes details such as the number of customers acquired and cost of acquisition on a monthly basis.Here you can discover an assortment of the finest PowerPoint and Google Slides templates. With these templates, you can create presentations for a variety of purposes while simultaneously providing your audience with an eye-catching visual experience. Download Techniques For Enhancing Buyer Acquisition Impact Analysis Of Increasing Acquired Customers Diagrams PDF to deliver an impeccable presentation. These templates will make your job of preparing presentations much quicker, yet still, maintain a high level of quality. Slidegeeks has experienced researchers who prepare these templates and write high-quality content for you. Later on, you can personalize the content by editing the Techniques For Enhancing Buyer Acquisition Impact Analysis Of Increasing Acquired Customers Diagrams PDF.
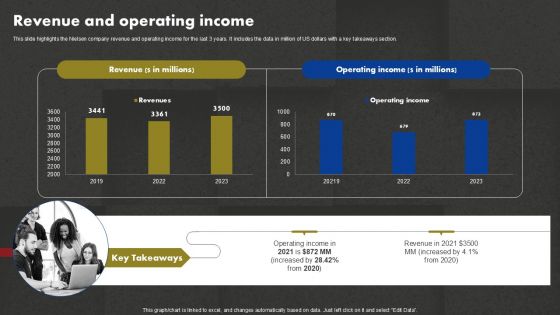
Data And Customer Analysis Company Outline Revenue And Operating Income Diagrams PDF
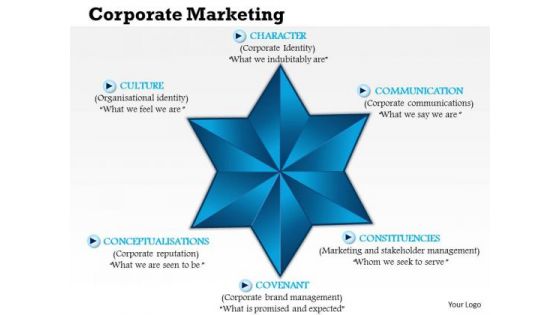
Business Framework Corporate Marketing PowerPoint Presentation
This innovative image slide has been designed with graphic of star to demonstrate aspects of corporate marketing. This business framework template may be used to display corporate strategy management in your presentations. This image slide will enhance the quality of your presentations.
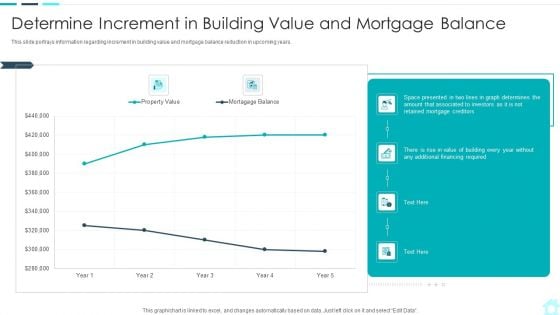
Real Estate Assets Financing Analysis Determine Increment In Building Value And Mortgage Balance Diagrams PDF
This slide portrays information regarding increment in building value and mortgage balance reduction in upcoming years. Deliver and pitch your topic in the best possible manner with this real estate assets financing analysis determine increment in building value and mortgage balance diagrams pdf. Use them to share invaluable insights on value, financing, required, determines and impress your audience. This template can be altered and modified as per your expectations. So, grab it now.
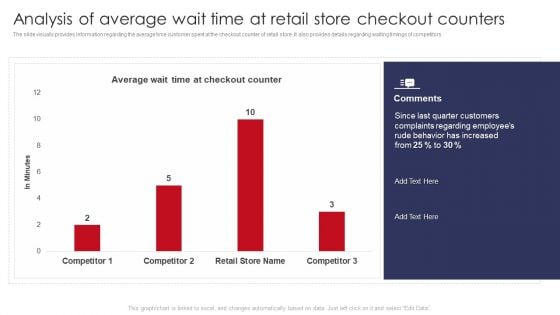
Analysis Of Average Wait Time At Retail Store Checkout Counters Retail Outlet Operations Diagrams PDF
The slide visually provides information regarding the average time customer spent at the checkout counter of retail store. It also provides details regarding waiting timings of competitors.Deliver an awe inspiring pitch with this creative Analysis Of Average Wait Time At Retail Store Checkout Counters Retail Outlet Operations Diagrams PDF bundle. Topics like Quarter Customers, Complaints Regarding, Behavior Increased can be discussed with this completely editable template. It is available for immediate download depending on the needs and requirements of the user.
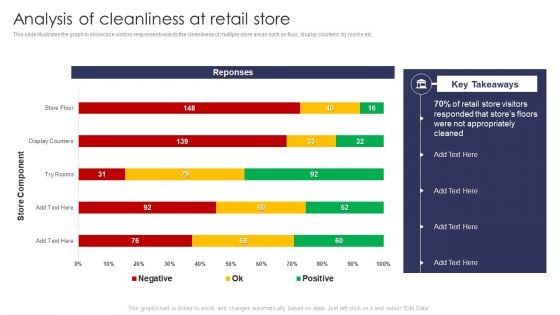
Analysis Of Cleanliness At Retail Store Retail Outlet Operations Performance Evaluation Diagrams PDF
This slide illustrates the graph to showcase visitors responses towards the cleanliness of multiple store areas such as floor, display counters, try rooms etc.Deliver and pitch your topic in the best possible manner with this Analysis Of Cleanliness At Retail Store Retail Outlet Operations Performance Evaluation Diagrams PDF. Use them to share invaluable insights on Retail Store, Visitors Responded, Stores Floors and impress your audience. This template can be altered and modified as per your expectations. So, grab it now.
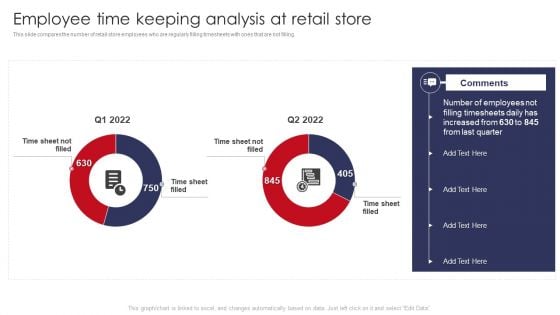
Employee Time Keeping Analysis At Retail Store Retail Outlet Operations Performance Evaluation Diagrams PDF
This slide compares the number of retail store employees who are regularly filling timesheets with ones that are not filling.Deliver an awe inspiring pitch with this creative Employee Time Keeping Analysis At Retail Store Retail Outlet Operations Performance Evaluation Diagrams PDF bundle. Topics like Filling Timesheets, Increased, Last Quarter can be discussed with this completely editable template. It is available for immediate download depending on the needs and requirements of the user.
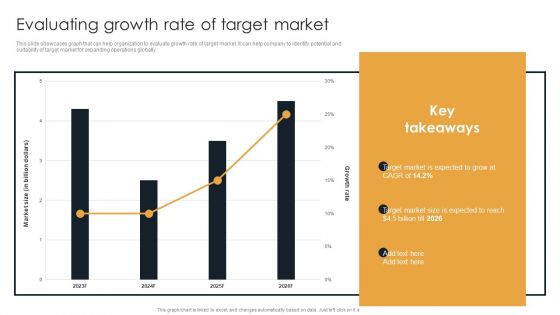
Target Customer Analysis Evaluating Growth Rate Of Target Market Diagrams PDF
This slide showcases graph that can help organization to evaluate growth rate of target market. It can help company to identify potential and suitability of target market for expanding operations globally. There are so many reasons you need a Target Customer Analysis Evaluating Growth Rate Of Target Market Diagrams PDF. The first reason is you cant spend time making everything from scratch, Thus, Slidegeeks has made presentation templates for you too. You can easily download these templates from our website easily.
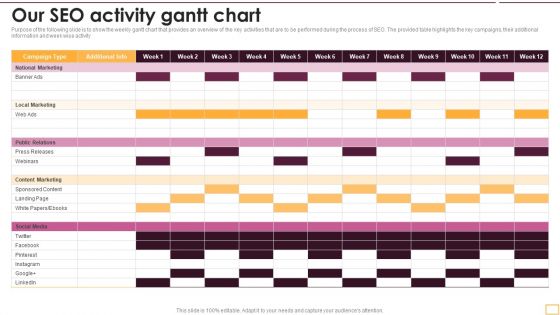
Implementing SEO Strategy To Enhance Business Performance Our SEO Activity Gantt Chart Sample PDF
Purpose of the following slide is to show the weekly gantt chart that provides an overview of the key activities that are to be performed during the process of SEO. The provided table highlights the key campaigns, their additional information and week wise activity. Design a highly optimized project management report using this well-researched Implementing SEO Strategy To Enhance Business Performance Our SEO Activity Gantt Chart Sample PDF. This layout can be used to present the professional details of a task or activity. Showcase the activities allocated to the business executives with this Gantt Chart PowerPoint theme. List down the column tasks in various timeframes and allocate time for each. In addition, also monitor the actual time and make comparisons to interpret the final progress using this innovative Gantt Chart Template. Showcase the work breakdown structure to attract your audience. Download and share it using Google Slides, if it suits your requirement.

Gantt Chart Analysis Ppt PowerPoint Presentation Summary Portfolio Cpb
Presenting this set of slides with name gantt chart analysis ppt powerpoint presentation summary portfolio cpb. This is a three stage process. The stages in this process are gantt chart analysis. This is a completely editable PowerPoint presentation and is available for immediate download. Download now and impress your audience.
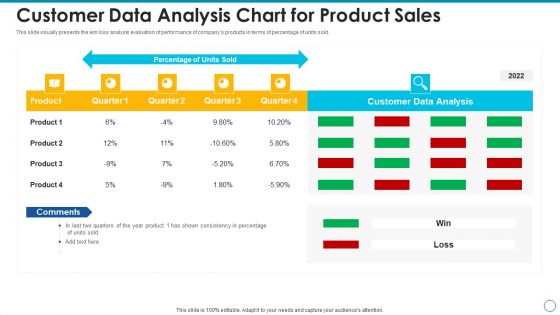
Customer Data Analysis Chart For Product Sales Inspiration PDF
Showcasing this set of slides titled customer data analysis chart for product sales inspiration pdf. The topics addressed in these templates are customer data analysis chart for product sales. All the content presented in this PPT design is completely editable. Download it and make adjustments in color, background, font etc. as per your unique business setting.

Market Share Checklist With Responsible Person And Status Ppt PowerPoint Presentation File Slide PDF
This slide showcases checklist related to market size questions to know total number of buyers for the product. It includes tasks, responsible person and status. Presenting market share checklist with responsible person and status ppt powerpoint presentation file slide pdf to dispense important information. This template comprises three stages. It also presents valuable insights into the topics including technique, market, product. This is a completely customizable PowerPoint theme that can be put to use immediately. So, download it and address the topic impactfully.
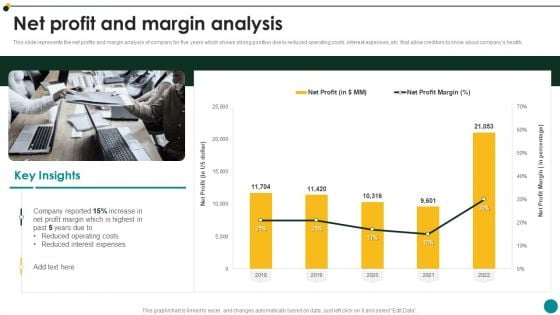
IT Services And Consulting Company Profile Net Profit And Margin Analysis Diagrams PDF
This slide represents the net profits and margin analysis of company for five years which shows strong position due to reduced operating costs, interest expenses, etc. that allow creditors to know about companys health.Deliver an awe inspiring pitch with this creative IT Services And Consulting Company Profile Net Profit And Margin Analysis Diagrams PDF bundle. Topics like Reduced Expenses, Reduced Operating Costs, Profit Highest can be discussed with this completely editable template. It is available for immediate download depending on the needs and requirements of the user.

Performance Analysis Using Operating Revenue Business Operational Expenditure And Income Metrics Diagrams PDF
This slide illustrates performance analysis using operating revenue, operating expenditure opex and income metrics which can be referred by organizations to evaluate their inflows and outflows to make relevant decisions for increasing profitability. It includes information about operating revenue, operating expense and income before taxes. Pitch your topic with ease and precision using this Performance Analysis Using Operating Revenue Business Operational Expenditure And Income Metrics Diagrams PDF. This layout presents information on Taxes, Highest Operating, Recorded. It is also available for immediate download and adjustment. So, changes can be made in the color, design, graphics or any other component to create a unique layout.
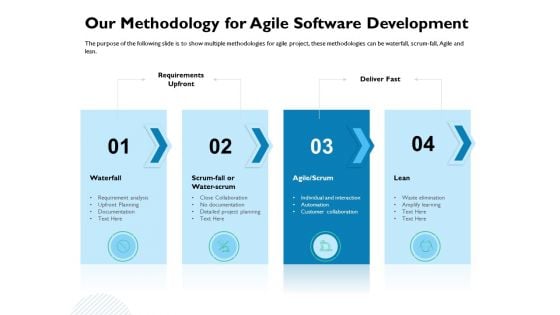
Waterfall Project Prioritization Methodology Our Methodology For Agile Software Development Diagrams PDF
Presenting this set of slides with name waterfall project prioritization methodology our methodology for agile software development diagrams pdf. This is a four stage process. The stages in this process are waterfall, scrum fall or water scrum, agile or scrum, lean. This is a completely editable PowerPoint presentation and is available for immediate download. Download now and impress your audience.
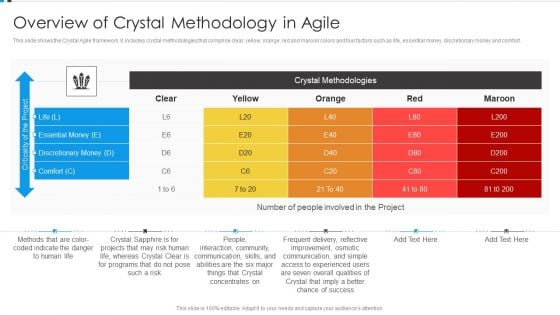
Agile Development Approach IT Overview Of Crystal Methodology In Agile Themes PDF
This slide shows the Crystal Agile framework. It includes crystal methodologies that comprise clear, yellow, orange, red and maroon colors and four factors such as life, essential money, discretionary money and comfort. Deliver an awe inspiring pitch with this creative Agile Development Approach IT Overview Of Crystal Methodology In Agile Themes PDF bundle. Topics like Human Life, Crystal Concentrates, People, Interaction, Community, Communication, Skills can be discussed with this completely editable template. It is available for immediate download depending on the needs and requirements of the user.
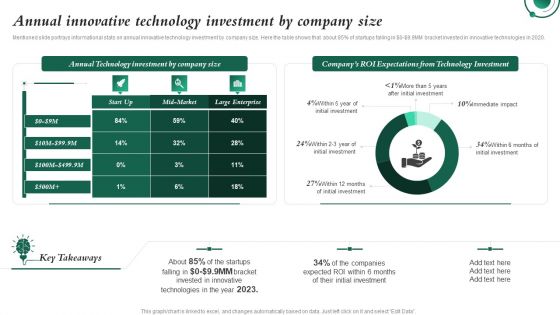
Annual Innovative Technology Investment By Company Size Investment In Latest Technology To Ensure Microsoft PDF
Mentioned slide portrays informational stats on annual innovative technology investment by company size. Here the table shows that about 8precent of startups falling in dollar 0 dollar9.9MM bracket invested in innovative technologies in 2020.Presenting this PowerPoint presentation, titled Annual Innovative Technology Investment By Company Size Investment In Latest Technology To Ensure Microsoft PDF, with topics curated by our researchers after extensive research. This editable presentation is available for immediate download and provides attractive features when used. Download now and captivate your audience. Presenting this Annual Innovative Technology Investment By Company Size Investment In Latest Technology To Ensure Microsoft PDF. Our researchers have carefully researched and created these slides with all aspects taken into consideration. This is a completely customizable Annual Innovative Technology Investment By Company Size Investment In Latest Technology To Ensure Microsoft PDF that is available for immediate downloading. Download now and make an impact on your audience. Highlight the attractive features available with our PPTs.
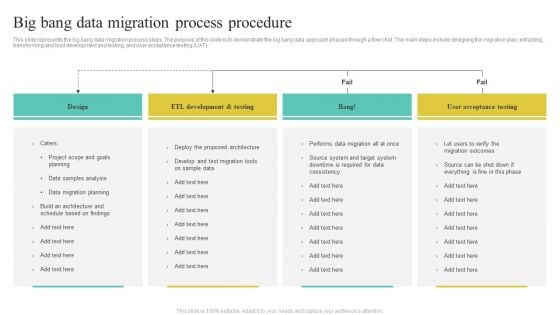
Big Bang Data Migration Process Procedure Diagrams PDF
This slide represents the big bang data migration process steps. The purpose of this slide is to demonstrate the big bang data approach phases through a flow chat. The main steps include designing the migration plan, extracting, transforming and load development and testing, and user acceptance testing UAT.

Innovation Concept With Labyrinth Business PowerPoint Templates And PowerPoint Themes 1112
We present our Innovation Concept With Labyrinth Business PowerPoint Templates And PowerPoint Themes 1112.Use our Labyrinth PowerPoint Templates because, Getting it done in time is the key to success. Use our Business PowerPoint Templates because, You understand the illness and its causes. Use our Success PowerPoint Templates because, Transmit your thoughts via our slides and prod your team to action. Use our Signs PowerPoint Templates because, Discuss each path to the smallest detail. Use our Arrows PowerPoint Templates because, Individual components well researched and understood in their place.Use these PowerPoint slides for presentations relating to Innovation concept with labyrinth, business, success, signs, labyrinth, arrows. The prominent colors used in the PowerPoint template are Green, White, Gray Thwart problems with our Innovation Concept With Labyrinth Business PowerPoint Templates And PowerPoint Themes 1112. Download without worries with our money back guaranteee.
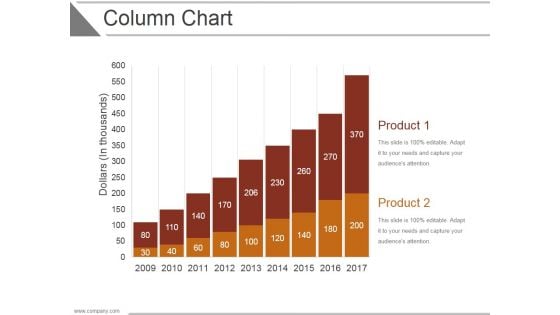
Column Chart Ppt PowerPoint Presentation Designs
This is a column chart ppt powerpoint presentation designs. This is a two stage process. The stages in this process are business, strategy, analysis, marketing, chart and graph, growth.
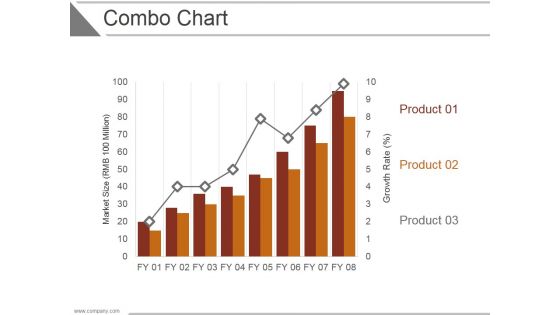
Combo Chart Ppt PowerPoint Presentation Examples
This is a combo chart ppt powerpoint presentation examples. This is a three stage process. The stages in this process are business, strategy, analysis, marketing, chart and graph, growth.
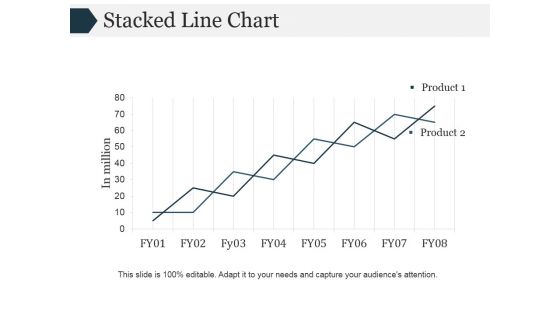
Stacked Line Chart Ppt PowerPoint Presentation Inspiration
This is a stacked line chart ppt powerpoint presentation inspiration. This is a two stage process. The stages in this process are stacked line chart, growth, analysis, management, business.
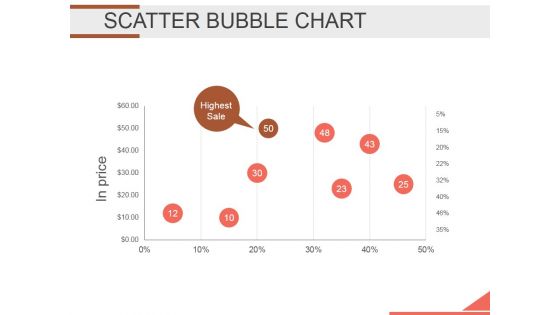
Scatter Bubble Chart Ppt PowerPoint Presentation Backgrounds
This is a scatter bubble chart ppt powerpoint presentation backgrounds. This is a one stage process. The stages in this process are bubble chart, finance, marketing, analysis, strategy, business.
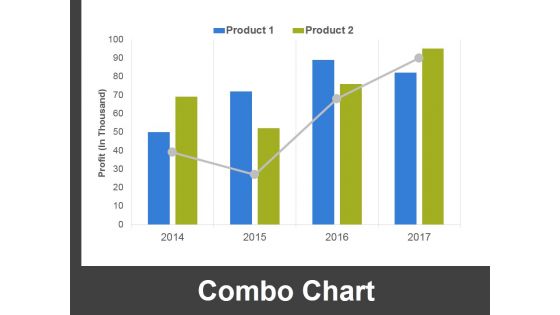
Combo Chart Ppt PowerPoint Presentation Ideas Outfit
This is a combo chart ppt powerpoint presentation ideas outfit. This is a four stage process. The stages in this process are combo chart, finance, analysis, marketing, strategy, business.

Scatter Chart Ppt PowerPoint Presentation Model Influencers
This is a scatter chart ppt powerpoint presentation model influencers. This is a one stage process. The stages in this process are scatter chart, analysis, finance, marketing, business, growth.
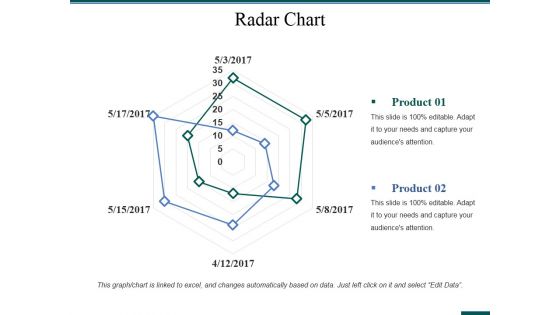
Radar Chart Ppt PowerPoint Presentation Layouts Gallery
This is a radar chart ppt powerpoint presentation layouts gallery. This is a two stage process. The stages in this process are business, analysis, strategy, marketing, radar chart, finance.
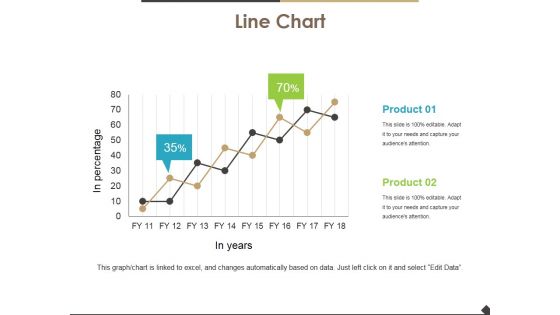
Line Chart Ppt PowerPoint Presentation Inspiration Graphics
This is a line chart ppt powerpoint presentation inspiration graphics. This is a two stage process. The stages in this process are line chart, growth, percentage, marketing, analysis, business.
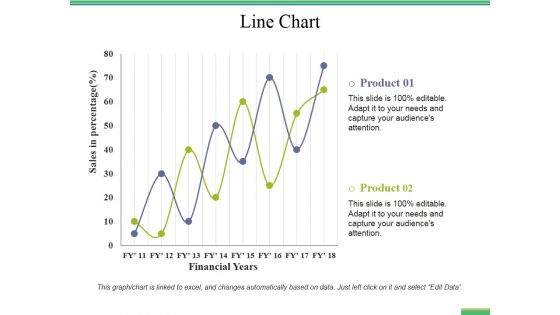
Line Chart Ppt PowerPoint Presentation Portfolio Portrait
This is a line chart ppt powerpoint presentation portfolio portrait. This is a two stage process. The stages in this process are line chart, growth, analysis, marketing, strategy, business.
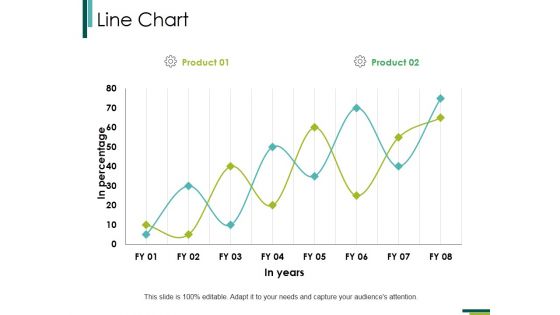
Line Chart Ppt PowerPoint Presentation Professional Examples
This is a line chart ppt powerpoint presentation professional examples. This is a two stage process. The stages in this process are line chart, analysis, growth, marketing, strategy, business.
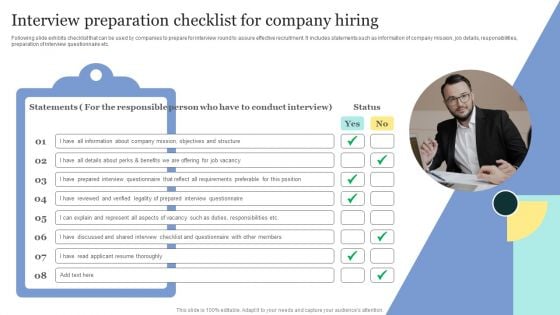
Strategic Approaches To Efficient Candidate Selection Interview Preparation Checklist For Company Hiring Diagrams PDF
Following slide exhibits checklist that can be used by companies to prepare for interview round to assure effective recruitment. It includes statements such as information of company mission, job details, responsibilities, preparation of interview questionnaire etc. Make sure to capture your audiences attention in your business displays with our gratis customizable Strategic Approaches To Efficient Candidate Selection Interview Preparation Checklist For Company Hiring Diagrams PDF. These are great for business strategies, office conferences, capital raising or task suggestions. If you desire to acquire more customers for your tech business and ensure they stay satisfied, create your own sales presentation with these plain slides.
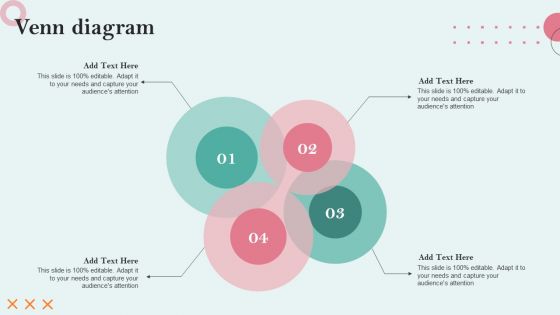
Strategies Employing PPC Advertising To Generate High Quality Leads Venn Diagram Graphics PDF
Find highly impressive Strategies Employing PPC Advertising To Generate High Quality Leads Venn Diagram Graphics PDF on Slidegeeks to deliver a meaningful presentation. You can save an ample amount of time using these presentation templates. No need to worry to prepare everything from scratch because Slidegeeks experts have already done a huge research and work for you. You need to download Strategies Employing PPC Advertising To Generate High Quality Leads Venn Diagram Graphics PDF for your upcoming presentation. All the presentation templates are 100 percent editable and you can change the color and personalize the content accordingly. Download now.

Business Framework Cause And Effect PowerPoint Presentation
To display the problem analysis in form of presentation use our unique PPT slide. This Power Point business framework has been crafted with cause and effect diagram. This PPT is useful for root cause finding of any defect and problem during production.
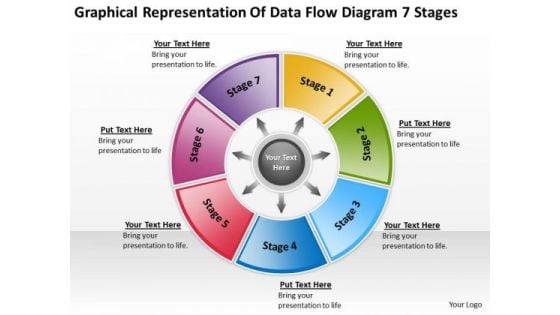
Representation Of Data Flow Diagram 7 Stages Templates For Business PowerPoint
We present our representation of data flow diagram 7 stages templates for business PowerPoint.Download our Circle Charts PowerPoint Templates because Our PowerPoint Templates and Slides will give you great value for your money. Be assured of finding the best projection to highlight your words. Present our Arrows PowerPoint Templates because Our PowerPoint Templates and Slides will let you Leave a lasting impression to your audiences. They possess an inherent longstanding recall factor. Present our Business PowerPoint Templates because Our PowerPoint Templates and Slides are designed to help you succeed. They have all the ingredients you need. Download and present our Shapes PowerPoint Templates because Our PowerPoint Templates and Slides are Clear and concise. Use them and dispel any doubts your team may have. Download and present our Process and Flows PowerPoint Templates because Our PowerPoint Templates and Slides will let you Clearly mark the path for others to follow.Use these PowerPoint slides for presentations relating to abstract, access, arrow, background, banner, blue, bright, business, chart, circle, color, colorful, concept, conceptual, connection, corporate, creative, cycle, design, different, element, empty, form, frame, graphic, green, group, idea, illustration, match, message, order, part, piece, place, process, red, shape, solution, special, speech, strategy, symbol, system loop, template, text, usable, vector, web, website. The prominent colors used in the PowerPoint template are Purple, Yellow, Green. Your thoughts are creating an explosion of ideas. Control the consequences with our Representation Of Data Flow Diagram 7 Stages Templates For Business PowerPoint.
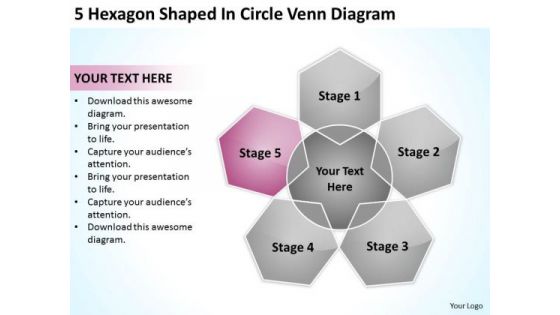
5 Hexagon Shaped In Circle Venn Diagram Ppt Business Financial Plan PowerPoint Templates
We present our 5 hexagon shaped in circle venn diagram ppt business financial plan PowerPoint templates.Download and present our Circle Charts PowerPoint Templates because Our PowerPoint Templates and Slides will let you Leave a lasting impression to your audiences. They possess an inherent longstanding recall factor. Use our Marketing PowerPoint Templates because These PowerPoint Templates and Slides will give the updraft to your ideas. See them soar to great heights with ease. Use our Business PowerPoint Templates because our PowerPoint Templates and Slides are the string of your bow. Fire of your ideas and conquer the podium. Download our Shapes PowerPoint Templates because Our PowerPoint Templates and Slides help you pinpoint your timelines. Highlight the reasons for your deadlines with their use. Download and present our Process and Flows PowerPoint Templates because Our PowerPoint Templates and Slides are Clear and concise. Use them and dispel any doubts your team may have.Use these PowerPoint slides for presentations relating to Flow, chart, business concept, step, future, business, vector, sign, presentation, symbol, template, process, flowchart, report, title, shape, abstract, illustration, system, strategy, project, catalog, round, color full, web, solution, design, color, text, motion, hexagon, structure . The prominent colors used in the PowerPoint template are Pink, Gray, Black. Many a popular belief turn out fallacious. Establish the factual position with our 5 Hexagon Shaped In Circle Venn Diagram Ppt Business Financial Plan PowerPoint Templates.
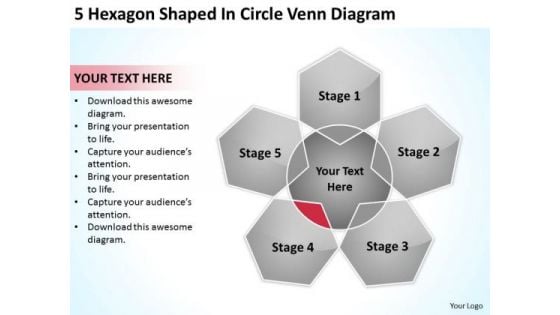
5 Hexagon Shaped In Circle Venn Diagram Ppt How To Do Business Plan PowerPoint Templates
We present our 5 hexagon shaped in circle venn diagram ppt how to do business plan PowerPoint templates.Download and present our Circle Charts PowerPoint Templates because Our PowerPoint Templates and Slides will bullet point your ideas. See them fall into place one by one. Download and present our Marketing PowerPoint Templates because Our PowerPoint Templates and Slides will provide you the cutting edge. Slice through the doubts in the minds of your listeners. Use our Business PowerPoint Templates because It will Strengthen your hand with your thoughts. They have all the aces you need to win the day. Download our Shapes PowerPoint Templates because You can Double your output with our PowerPoint Templates and Slides. They make beating deadlines a piece of cake. Download and present our Process and Flows PowerPoint Templates because Our PowerPoint Templates and Slides are effectively colour coded to prioritise your plans They automatically highlight the sequence of events you desire.Use these PowerPoint slides for presentations relating to Flow, chart, business concept, step, future, business, vector, sign, presentation, symbol, template, process, flowchart, report, title, shape, abstract, illustration, system, strategy, project, catalog, round, color full, web, solution, design, color, text, motion, hexagon, structure . The prominent colors used in the PowerPoint template are Red, Gray, Black. Interpret plans with our 5 Hexagon Shaped In Circle Venn Diagram Ppt How To Do Business Plan PowerPoint Templates. Download without worries with our money back guaranteee.
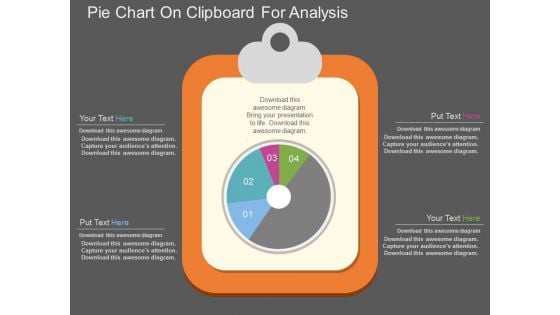
Pie Chart On Clipboard For Analysis Powerpoint Template
This PowerPoint template has been designed with graphics of pie chart on clipboard. Download this PPT slide for business and financial analysis. You may also use this professional template to depict statistical analysis.
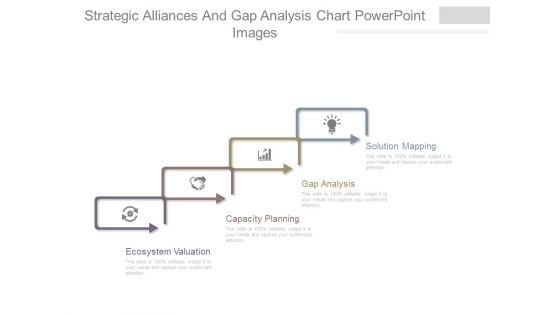
Strategic Alliances And Gap Analysis Chart Powerpoint Images
This is a strategic alliances and gap analysis chart powerpoint images. This is a four stage process. The stages in this process are solution mapping, gap analysis, capacity planning, ecosystem valuation.
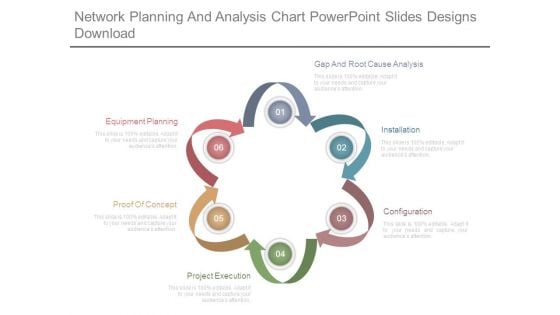
Network Planning And Analysis Chart Powerpoint Slides Designs Download
This is a network planning and analysis chart powerpoint slides designs download. This is a six stage process. The stages in this process are equipment planning, proof of concept, project execution, configuration, installation, gap and root cause analysis.
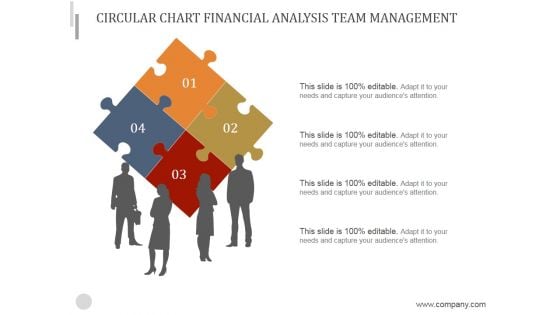
Circular Chart Financial Analysis Team Management Ppt PowerPoint Presentation Guide
This is a circular chart financial analysis team management ppt powerpoint presentation guide. This is a four stage process. The stages in this process are puzzle, teamwork, business, marketing, analysis.
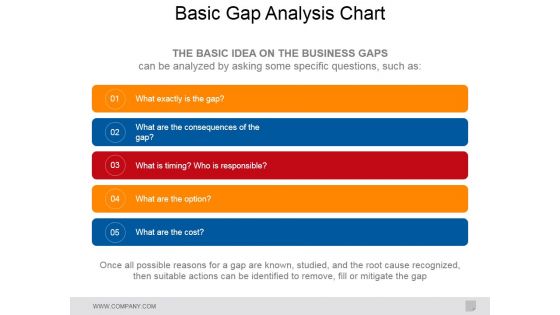
Basic Gap Analysis Chart Ppt PowerPoint Presentation Professional Slide Download
This is a basic gap analysis chart ppt powerpoint presentation professional slide download. This is a five stage process. The stages in this process are business, marketing, analysis, gap, idea, management.
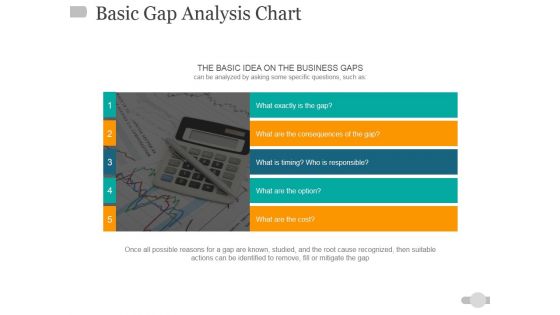
Basic Gap Analysis Chart Ppt PowerPoint Presentation Pictures Design Ideas
This is a basic gap analysis chart ppt powerpoint presentation pictures design ideas. This is a five stage process. The stages in this process are business, finance, marketing, analysis, investment.
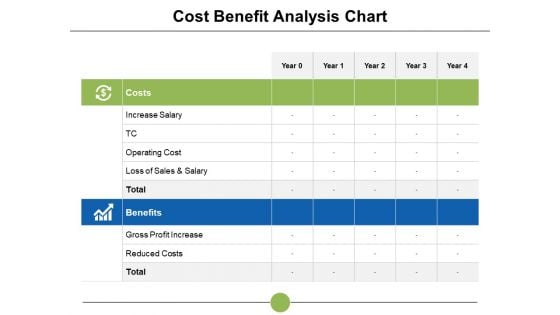
Cost Benefit Analysis Chart Ppt PowerPoint Presentation Slides Example File
This is a cost benefit analysis chart ppt powerpoint presentation slides example file. This is a two stage process. The stages in this process are increase salary, cost benefit, reduced costs, analysis, operating cost.
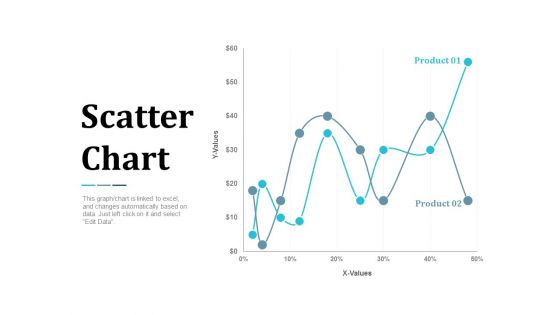
Scatter Chart Analysis Marketing Ppt Powerpoint Presentation Summary Infographic Template
This is a scatter chart analysis marketing ppt powerpoint presentation summary infographic template. This is a two stage process. The stages in this process are finance, marketing, management, investment, analysis.
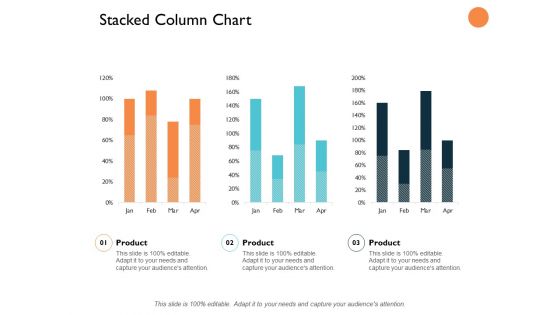
Stacked Column Chart Analysis Ppt PowerPoint Presentation Slides Graphics Design
This is a stacked column chart analysis ppt powerpoint presentation slides graphics design. This is a three stage process. The stages in this process are finance, marketing, management, investment, analysis.
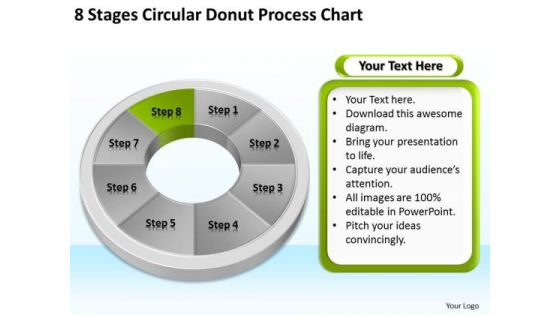
Stages Circular Donut Process Chart Business Plan PowerPoint Templates
We present our stages circular donut process chart business plan PowerPoint templates.Download and present our Process and Flows PowerPoint Templates because You aspire to touch the sky with glory. Let our PowerPoint Templates and Slides provide the fuel for your ascent. Use our Circle Charts PowerPoint Templates because Our PowerPoint Templates and Slides will provide you the cutting edge. Slice through the doubts in the minds of your listeners. Download our Business PowerPoint Templates because Our PowerPoint Templates and Slides will definately Enhance the stature of your presentation. Adorn the beauty of your thoughts with their colourful backgrounds. Use our Flow Charts PowerPoint Templates because Our PowerPoint Templates and Slides are created with admirable insight. Use them and give your group a sense of your logical mind. Present our Shapes PowerPoint Templates because You can Create a matrix with our PowerPoint Templates and Slides. Feel the strength of your ideas click into place.Use these PowerPoint slides for presentations relating to Website, speech, form, special, corporate, order, business, concept, vector, bright, template, circle, match, usable, graphic, process,element, different, idea, shape, abstract, cycle, creative, illustration, piece, connection, chart, strategy, place, frame, web, solution, design, group, blue, text, empty, banner, access, part, background, conceptual . The prominent colors used in the PowerPoint template are Green, Gray, White. Be absolutely professional with our Stages Circular Donut Process Chart Business Plan PowerPoint Templates. Dont pass up this opportunity to shine.

Girl Enjoying The Nature Theme PowerPoint Templates Ppt Backgrounds For Slides 0513
Our Girl Enjoying The Nature Theme PowerPoint Templates PPT Backgrounds For Slides leave no one in doubt. Provide a certainty to your views. Some of your team maybe a little doubtful. Assure them with certainty through our Environment PowerPoint Templates. Our Children PowerPoint Templates and your ideas make a great doubles pair. Play the net with assured hands. Put your thoughts on the anvil. Fashion them with our Girl Enjoying The Nature Theme PowerPoint Templates Ppt Backgrounds For Slides 0513.
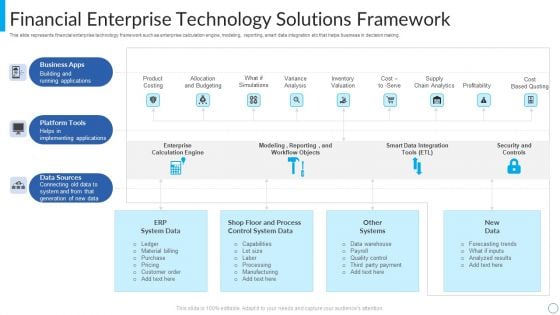
Financial Enterprise Technology Solutions Framework Diagrams PDF
This slide represents financial enterprise technology framework such as enterprise calculation engine, modeling, reporting, smart data integration etc that helps business in decision making. Showcasing this set of slides titled Financial Enterprise Technology Solutions Framework Diagrams PDF. The topics addressed in these templates are Business Apps, Platform Tools, Data Sources. All the content presented in this PPT design is completely editable. Download it and make adjustments in color, background, font etc. as per your unique business setting.

Information Technology Career Progression Framework Diagrams PDF
This slide represents the career framework on IT employees with there experience and annual salaries. It includes comparison on the basis of levels, credential, experience and salary. Showcasing this set of slides titled Information Technology Career Progression Framework Diagrams PDF. The topics addressed in these templates are Practise Lead, Engineer, Senior Engineer. All the content presented in this PPT design is completely editable. Download it and make adjustments in color, background, font etc. as per your unique business setting.


 Continue with Email

 Home
Home


