Investigation Icons
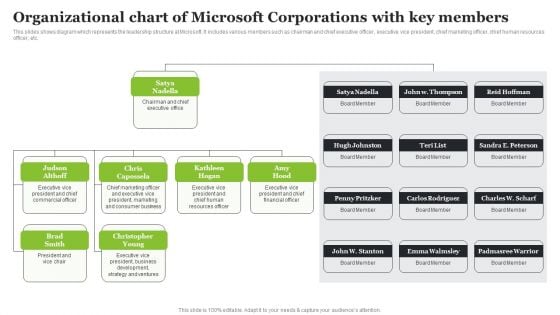
Microsoft Strategic Plan To Become Market Leader Organizational Chart Of Microsoft Corporations Key Portrait PDF
This slides shows diagram which represents the leadership structure at Microsoft. It includes various members such as chairman and chief executive officer, executive vice president, chief marketing officer, chief human resources officer, etc. If your project calls for a presentation, then Slidegeeks is your go-to partner because we have professionally designed, easy-to-edit templates that are perfect for any presentation. After downloading, you can easily edit Microsoft Strategic Plan To Become Market Leader Organizational Chart Of Microsoft Corporations Key Portrait PDF and make the changes accordingly. You can rearrange slides or fill them with different images. Check out all the handy templates

Introduction To Cost Per Action CPA Marketing Ppt Professional Diagrams PDF
This slide covers a brief introduction of cost per action CPA marketing and its working process. It also includes the CPA functioning, partners involved in CPA, affiliate and advertiser, CPA actions such as filling form,Getting quote, sign up, post engagement, generating query etc. Slidegeeks is here to make your presentations a breeze with Introduction To Cost Per Action CPA Marketing Ppt Professional Diagrams PDF With our easy to use and customizable templates, you can focus on delivering your ideas rather than worrying about formatting. With a variety of designs to choose from, you are sure to find one that suits your needs. And with animations and unique photos, illustrations, and fonts, you can make your presentation pop. So whether you are giving a sales pitch or presenting to the board, make sure to check out Slidegeeks first.
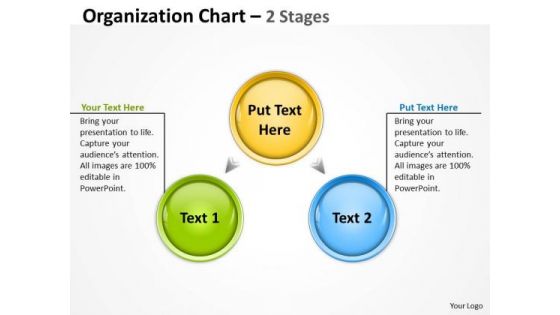
Business Finance Strategy Development Organization Plan Chart Mba Models And Frameworks
Delight Them With Our Business Finance Strategy Development Organization Plan Chart MBA models and frameworks Powerpoint Templates. Your Audience Will Be Ecstatic. Our Business Finance Strategy Development Organization Plan Chart MBA models and frameworks Powerpoint Templates Are Created Cost Effective. They Understand The Need For Economy.
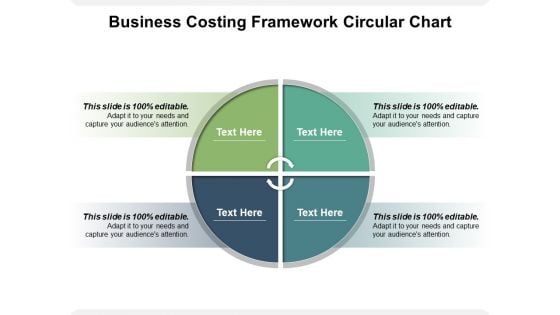
Business Costing Framework Circular Chart Ppt PowerPoint Presentation Gallery Example File PDF
Presenting this set of slides with name business costing framework circular chart ppt powerpoint presentation gallery example file pdf. This is a four stage process. The stages in this process are business costing framework circular chart. This is a completely editable PowerPoint presentation and is available for immediate download. Download now and impress your audience.
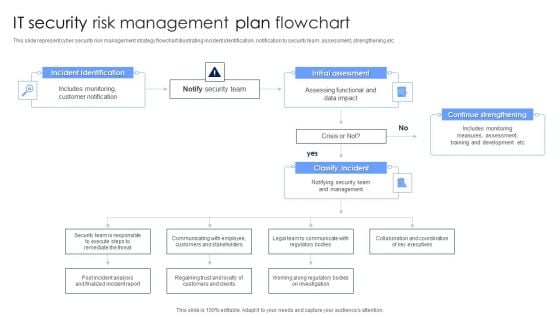
IT Security Risk Management Plan Flowchart Diagrams PDF
This slide represent cyber security risk management strategy flowchart illustrating incident identification, notification to security team, assessment, strengthening etc. Persuade your audience using this IT Security Risk Management Plan Flowchart Diagrams PDF. This PPT design covers four stages, thus making it a great tool to use. It also caters to a variety of topics including Incident Identification, Initial Assessment, Continue Strengthening. Download this PPT design now to present a convincing pitch that not only emphasizes the topic but also showcases your presentation skills.
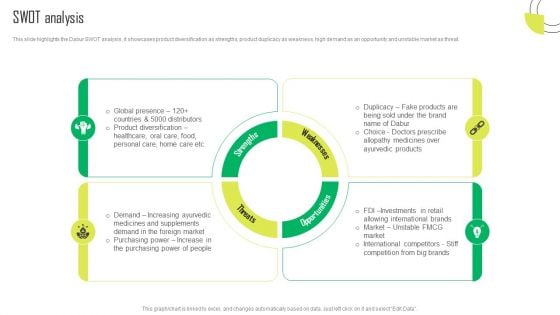
Herbal Products Company Profile SWOT Analysis Diagrams PDF
This slide highlights the Dabur SWOT analysis, it showcases product diversification as strengths, product duplicacy as weakness, high demand as an opportunity and unstable market as threat. Slidegeeks has constructed Herbal Products Company Profile SWOT Analysis Diagrams PDF after conducting extensive research and examination. These presentation templates are constantly being generated and modified based on user preferences and critiques from editors. Here, you will find the most attractive templates for a range of purposes while taking into account ratings and remarks from users regarding the content. This is an excellent jumping off point to explore our content and will give new users an insight into our top notch PowerPoint Templates.

Our Graphs And Charts Ppt PowerPoint Presentation Infographics Infographics
This is a our graphs and charts ppt powerpoint presentation infographics infographics. This is a one stage process. The stages in this process are business, strategy, analysis, pretention, chart and graph.
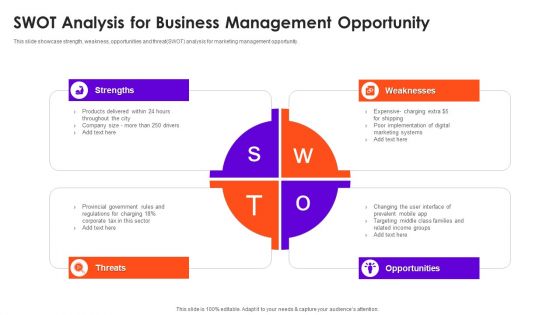
SWOT Analysis For Business Management Opportunity Themes Demonstration PDF
This slide showcase strength, weakness, opportunities and threat SWOT analysis for marketing management opportunity. Presenting SWOT Analysis For Business Management Opportunity Themes Demonstration PDF to dispense important information. This template comprises four stages. It also presents valuable insights into the topics including Strengths, Weaknesses, Opportunities, Threats. This is a completely customizable PowerPoint theme that can be put to use immediately. So, download it and address the topic impactfully.
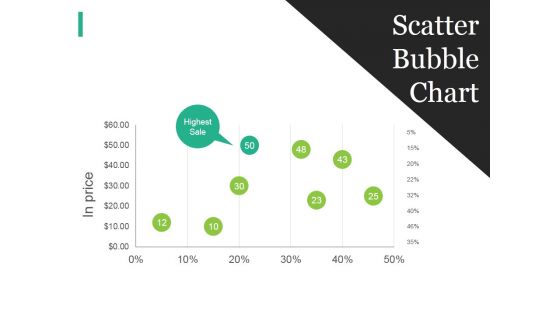
Scatter Bubble Chart Ppt PowerPoint Presentation Summary Mockup
This is a scatter bubble chart ppt powerpoint presentation summary mockup. This is a five stage process. The stages in this process are business, strategy, marketing, analysis, scatter bubble chart.
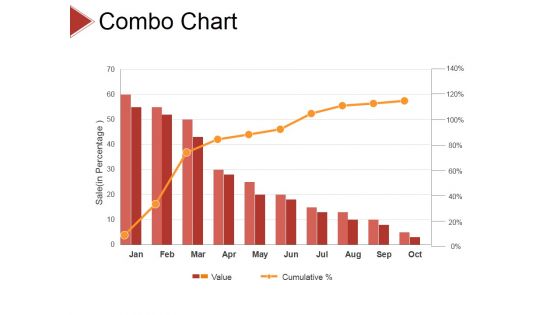
Combo Chart Ppt PowerPoint Presentation File Example Introduction
This is a combo chart ppt powerpoint presentation file example introduction. This is a ten stage process. The stages in this process are business, strategy, analysis, pretention, chart and graph.
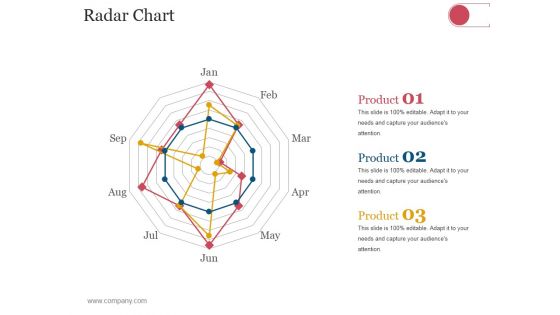
Radar Chart Ppt PowerPoint Presentation Inspiration Example File
This is a radar chart ppt powerpoint presentation inspiration example file. This is a three stage process. The stages in this process are business, strategy, analysis, marketing, radar chart.
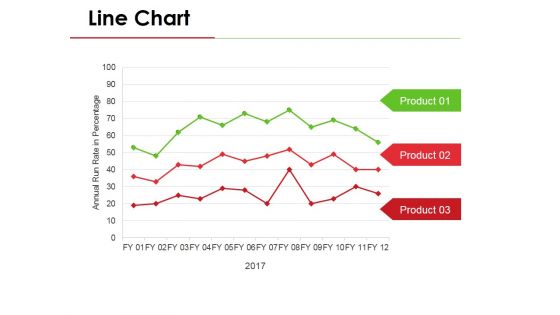
Line Chart Ppt PowerPoint Presentation Visual Aids Pictures
This is a line chart ppt powerpoint presentation visual aids pictures. This is a three stage process. The stages in this process are business, marketing, line chart, analysis, growth.
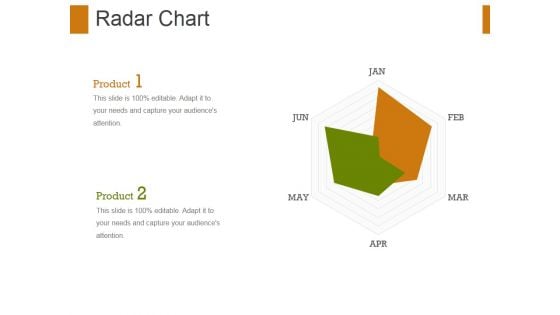
Radar Chart Ppt PowerPoint Presentation Show Graphic Tips
This is a radar chart ppt powerpoint presentation show graphic tips. This is a two stage process. The stages in this process are radar chart, finance, management, marketing, business, analysis.
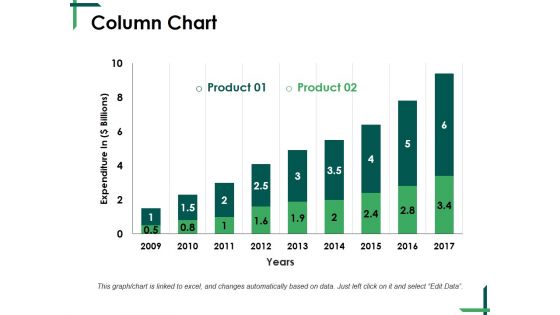
Column Chart Ppt PowerPoint Presentation Gallery Graphics Pictures
This is a column chart ppt powerpoint presentation gallery graphics pictures. This is a two stage process. The stages in this process are column chart, finance, planning, analysis, management, growth.
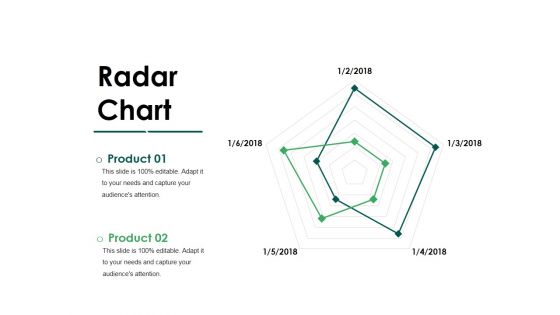
Radar Chart Ppt PowerPoint Presentation Inspiration File Formats
This is a radar chart ppt powerpoint presentation inspiration file formats. This is a two stage process. The stages in this process are radar chart, business, finance, management, analysis.
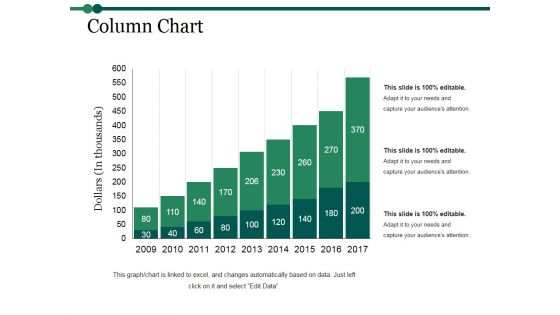
Column Chart Ppt PowerPoint Presentation Inspiration Graphics Example
This is a column chart ppt powerpoint presentation inspiration graphics example. This is a nine stage process. The stages in this process are column chart, finance, marketing, strategy, analysis, business.
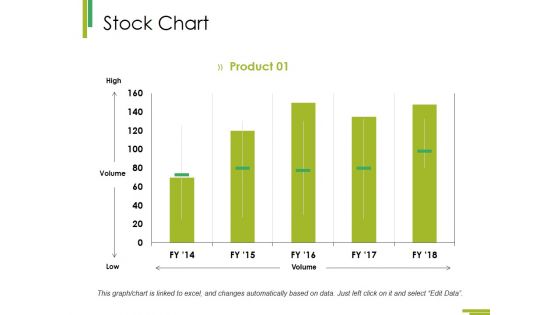
Stock Chart Ppt PowerPoint Presentation Summary Format Ideas
This is a stock chart ppt powerpoint presentation summary format ideas. This is a one stage process. The stages in this process are stock chart, finance, business, analysis, marketing.
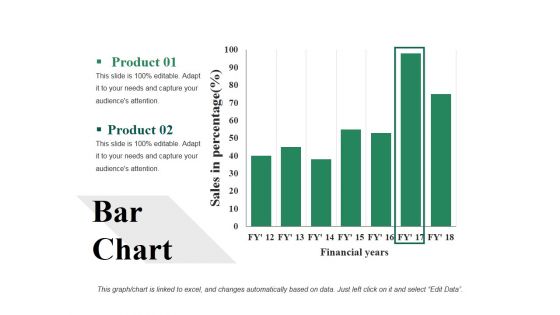
Bar Chart Ppt PowerPoint Presentation Visual Aids Backgrounds
This is a bar chart ppt powerpoint presentation visual aids backgrounds. This is a two stage process. The stages in this process are bar chart, analysis, strategy, finance, business.
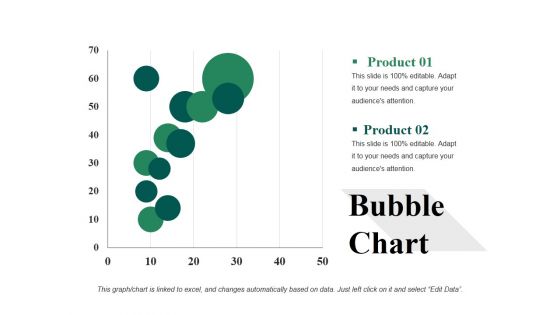
Bubble Chart Ppt PowerPoint Presentation Infographic Template Example 2015
This is a bubble chart ppt powerpoint presentation infographic template example 2015. This is a two stage process. The stages in this process are analysis, strategy, finance, business, bubble chart.

Clustered Chart Ppt PowerPoint Presentation Gallery Background Images
This is a clustered chart ppt powerpoint presentation gallery background images. This is a two stage process. The stages in this process are clustered chart, analysis, strategy, finance, business.
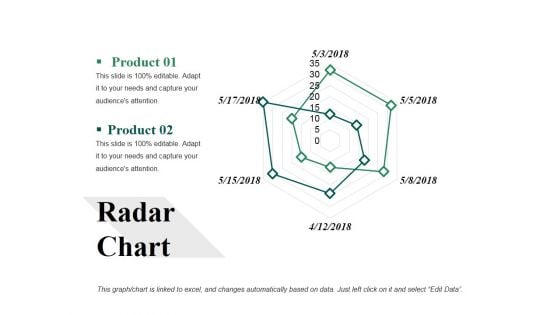
Radar Chart Ppt PowerPoint Presentation File Background Image
This is a radar chart ppt powerpoint presentation file background image. This is a two stage process. The stages in this process are radar chart, finance, analysis, marketing, business.
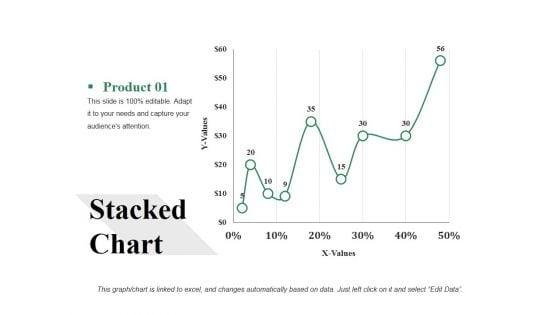
Stacked Chart Ppt PowerPoint Presentation Gallery Infographic Template
This is a stacked chart ppt powerpoint presentation gallery infographic template. This is a one stage process. The stages in this process are stacked chart, finance, analysis, marketing, business.
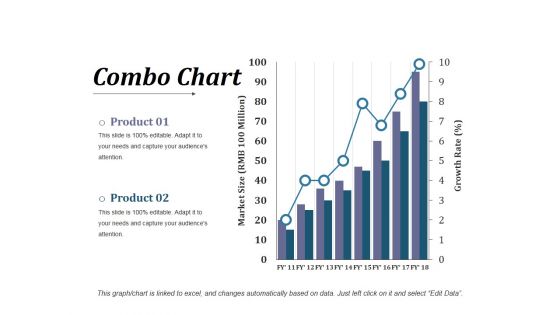
Combo Chart Ppt PowerPoint Presentation Infographic Template Visuals
This is a combo chart ppt powerpoint presentation infographic template visuals. This is a three stage process. The stages in this process are business, finance, strategy, analysis, combo chart.
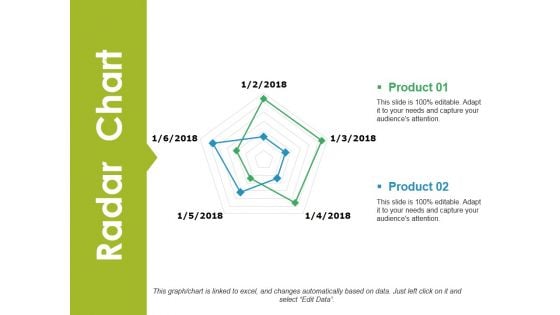
Radar Chart Ppt PowerPoint Presentation Infographic Template Tips
This is a radar chart ppt powerpoint presentation infographic template tips. This is a two stage process. The stages in this process are radar chart, business, finance, analysis, strategy.
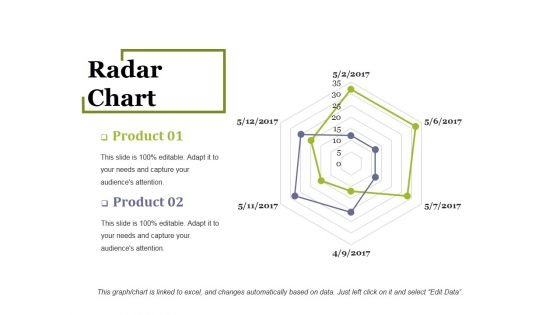
Radar Chart Ppt PowerPoint Presentation Infographic Template Outline
This is a radar chart ppt powerpoint presentation infographic template outline. This is a two stage process. The stages in this process are radar chart, finance, analysis, management, business.
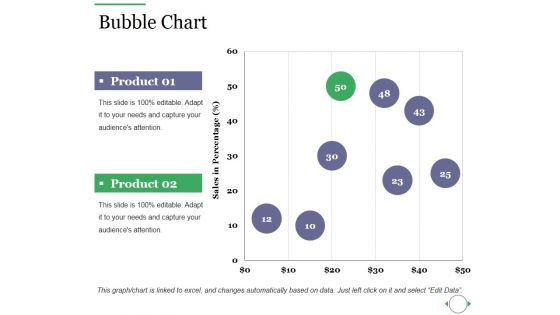
Bubble Chart Ppt PowerPoint Presentation Layouts Graphic Images
This is a bubble chart ppt powerpoint presentation layouts graphic images. This is a two stage process. The stages in this process are bubble chart, finance, marketing, strategy, business, analysis.
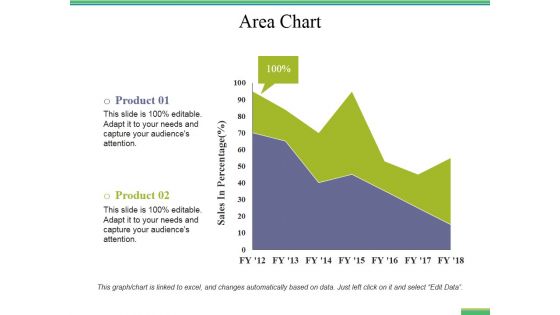
Area Chart Ppt PowerPoint Presentation Portfolio Graphics Template
This is a area chart ppt powerpoint presentation portfolio graphics template. This is a two stage process. The stages in this process are area chart, finance, analysis, business, marketing.
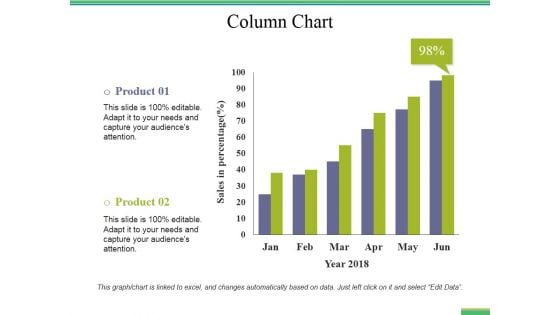
Column Chart Ppt PowerPoint Presentation Pictures Visual Aids
This is a column chart ppt powerpoint presentation pictures visual aids. This is a two stage process. The stages in this process are column chart, business, finance, marketing, analysis, investment.
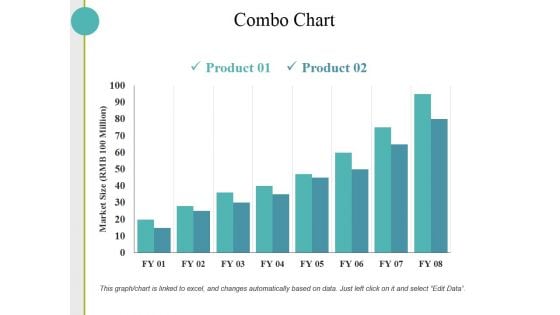
Combo Chart Ppt PowerPoint Presentation Layouts Design Templates
This is a combo chart ppt powerpoint presentation layouts design templates. This is a two stage process. The stages in this process are combo chart, finance, marketing, strategy, analysis, business.
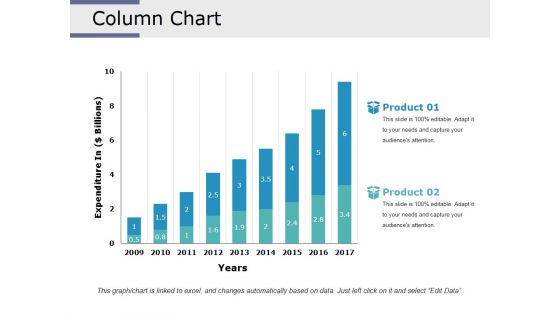
Column Chart Ppt PowerPoint Presentation Infographic Template Designs Download
This is a column chart ppt powerpoint presentation infographic template designs download. This is a two stage process. The stages in this process are column chart, analysis, finance, marketing, strategy, business.
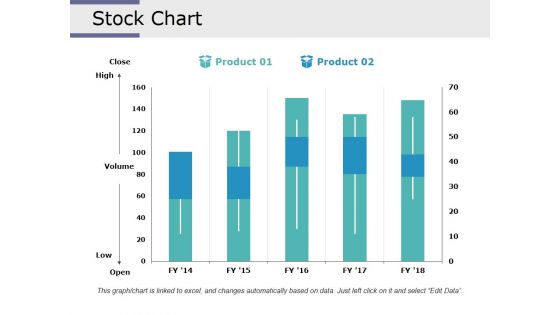
Stock Chart Ppt PowerPoint Presentation Infographic Template Design Inspiration
This is a stock chart ppt powerpoint presentation infographic template design inspiration. This is a two stage process. The stages in this process are stock chart, finance, analysis, business, marketing.
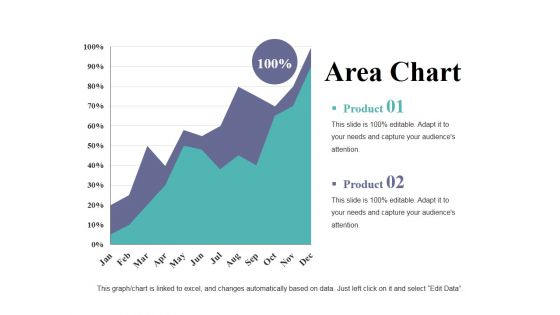
Area Chart Ppt PowerPoint Presentation Professional Graphic Images
This is a area chart ppt powerpoint presentation professional graphic images. This is a two stage process. The stages in this process are area chart, growth, strategy, business, finance, analysis.
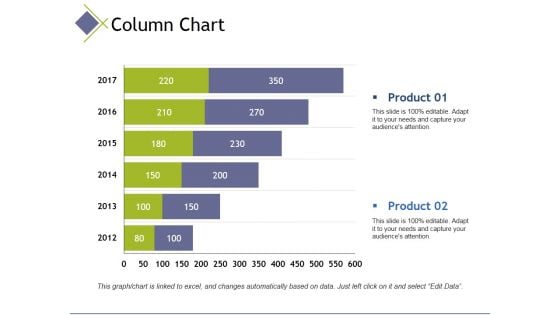
column chart ppt powerpoint presentation portfolio master slide
This is a column chart ppt powerpoint presentation portfolio master slide. This is a two stage process. The stages in this process are column chart, finance, analysis, marketing, business.
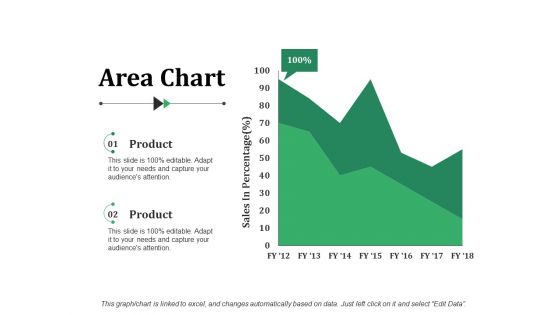
Area Chart Ppt PowerPoint Presentation Visual Aids Gallery
This is a area chart ppt powerpoint presentation visual aids gallery. This is a two stage process. The stages in this process are area chart, finance, marketing, analysis, business.
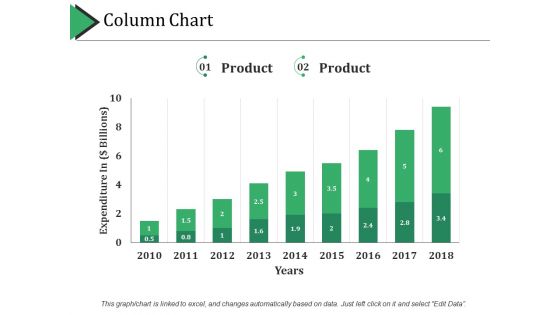
Column Chart Ppt PowerPoint Presentation Professional Example Topics
This is a column chart ppt powerpoint presentation professional example topics. This is a two stage process. The stages in this process are column chart, finance, marketing, strategy, analysis, business.
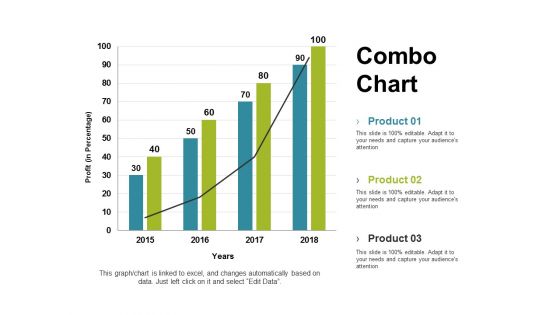
Combo Chart Ppt PowerPoint Presentation Gallery Graphics Tutorials
This is a Combo Chart Ppt PowerPoint Presentation Gallery Graphics Tutorials. This is a three stage process. The stages in this process are combo chart, finance, marketing, strategy, analysis.
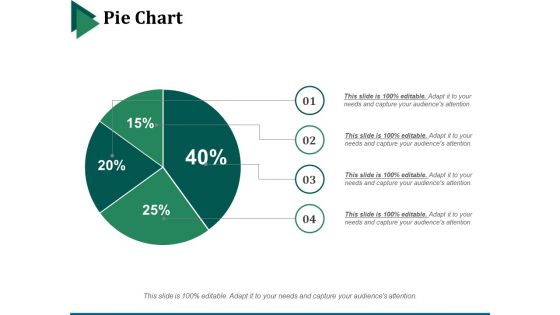
Pie Chart Ppt PowerPoint Presentation Infographic Template Backgrounds
This is a pie chart ppt powerpoint presentation infographic template backgrounds. This is a four stage process. The stages in this process are pie chart, marketing, strategy, finance, analysis.
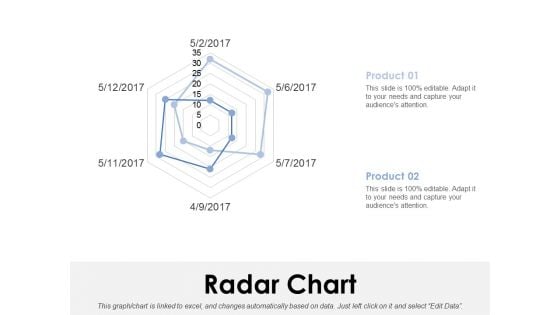
Radar Chart Ppt PowerPoint Presentation Model Clipart Images
This is a radar chart ppt powerpoint presentation model clipart images. This is a two stage process. The stages in this process are radar chart, finance, analysis, marketing, strategy, business.
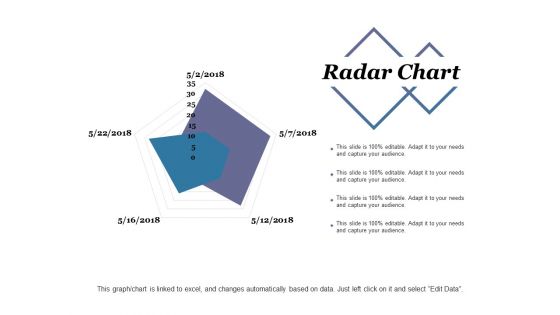
Radar Chart Ppt PowerPoint Presentation Infographic Template Sample
This is a radar chart ppt powerpoint presentation infographic template sample. This is a two stage process. The stages in this process are radar chart, finance, marketing, strategy, analysis.
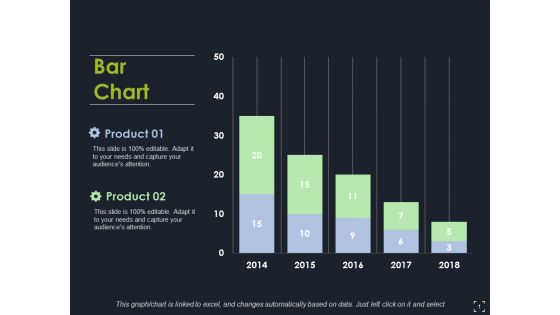
Bar Chart Ppt PowerPoint Presentation Model Clipart Images
This is a bar chart ppt powerpoint presentation model clipart images. This is a two stage process. The stages in this process are bar chart, finance, marketing, strategy, analysis.
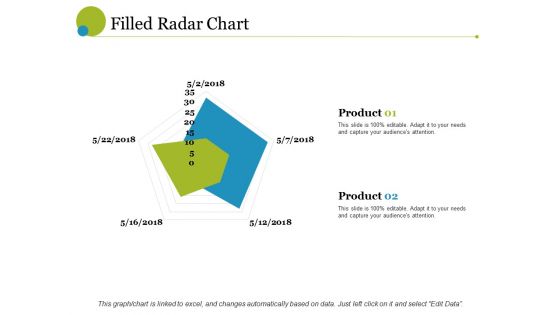
filled radar chart ppt powerpoint presentation ideas brochure
This is a filled radar chart ppt powerpoint presentation ideas brochure. This is a two stage process. The stages in this process are radar chart, finance, analysis, business, marketing, strategy.
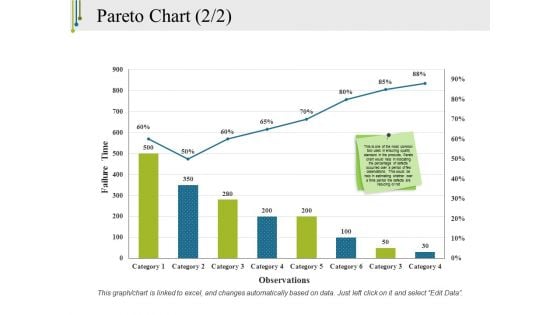
Pareto Chart Template 2 Ppt PowerPoint Presentation Outline Model
This is a pareto chart template 2 ppt powerpoint presentation outline model. This is a eight stage process. The stages in this process are pareto chart, finance, marketing, strategy, analysis.

Area Chart Ppt PowerPoint Presentation Styles Design Templates
This is a area chart ppt powerpoint presentation styles design templates. This is a two stage process. The stages in this process are area chart, analysis, business, marketing, strategy.

Combo Chart Ppt PowerPoint Presentation Inspiration Slide Download
This is a combo chart ppt powerpoint presentation inspiration slide download. This is a two stage process. The stages in this process are Combo chart, finance, marketing, strategy, analysis.
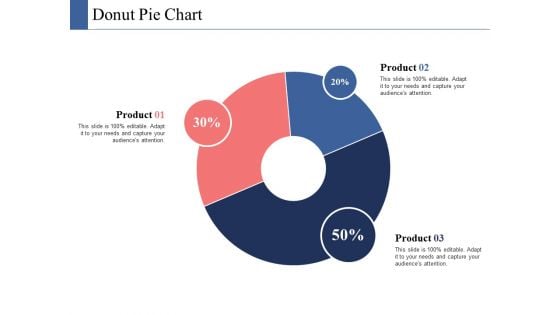
Donut Pie Chart Ppt PowerPoint Presentation Infographics Ideas
This is a donut pie chart ppt powerpoint presentation infographics ideas. This is a three stage process. The stages in this process are donut pie chart, finance, marketing, strategy, analysis.
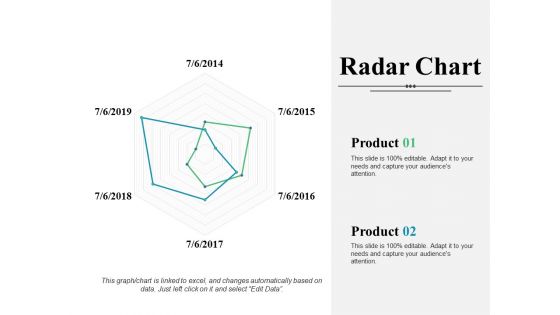
Radar Chart Ppt PowerPoint Presentation Infographic Template Introduction
This is a radar chart ppt powerpoint presentation infographic template introduction. This is a two stage process. The stages in this process are radar chart, finance, marketing, strategy, analysis, business.
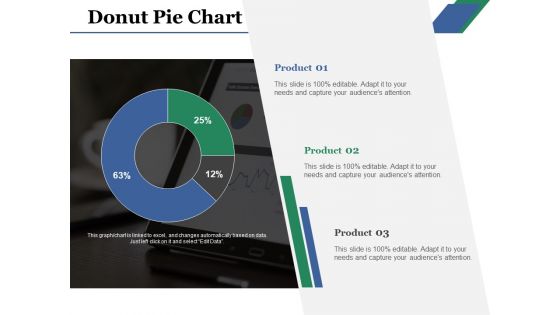
Donut Pie Chart Ppt PowerPoint Presentation Gallery Gridlines
This is a donut pie chart ppt powerpoint presentation gallery gridlines. This is a three stage process. The stages in this process are donut pie chart, product, business, management, analysis.
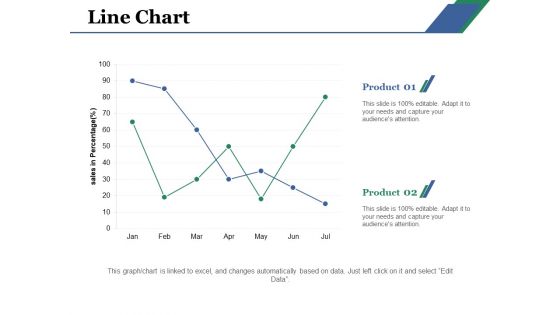
Line Chart Ppt PowerPoint Presentation Layouts Example File
This is a line chart ppt powerpoint presentation layouts example file. This is a two stage process. The stages in this process are line chart, product, business, sales, analysis.
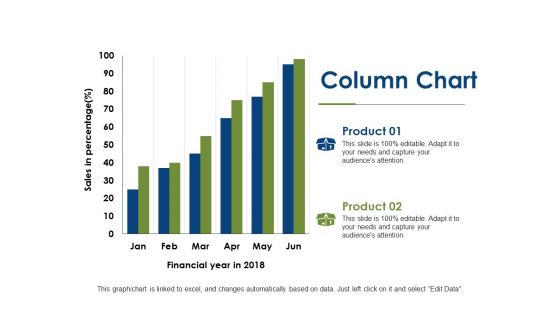
Column Chart Finance Ppt PowerPoint Presentation Infographics Backgrounds
This is a column chart finance ppt powerpoint presentation infographics backgrounds. This is a two stage process. The stages in this process are column chart, investment, marketing, finance, analysis.
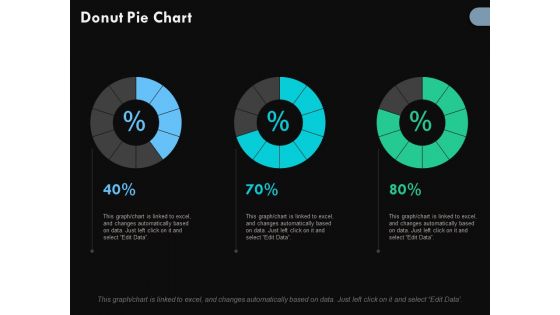
Donut Pie Chart Finance Ppt PowerPoint Presentation Outline Portrait
This is a donut pie chart finance ppt powerpoint presentation outline portrait. This is a three stage process. The stages in this process are donut pie chart, percentage, marketing, business, analysis.
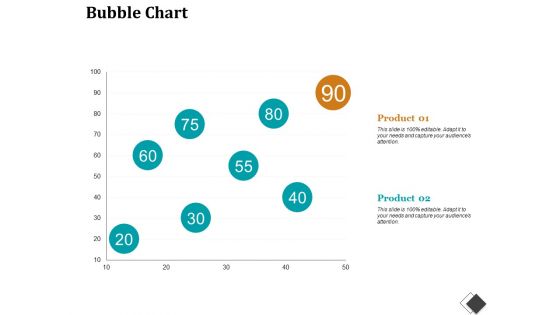
Bubble Chart Enterprise Model Canvas Ppt PowerPoint Presentation File Structure
This is a bubble chart enterprise model canvas ppt powerpoint presentation file structure. This is a two stage process. The stages in this process are bubble chart, finance, marketing, strategy, analysis, investment.
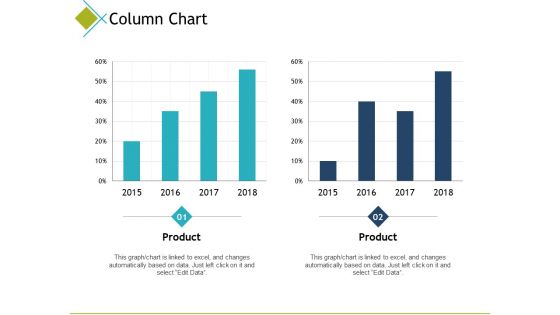
Column Chart Finance Ppt PowerPoint Presentation Model Examples
This is a column chart finance ppt powerpoint presentation model examples. This is a two stage process. The stages in this process are column chart, finance, marketing, analysis, investment.
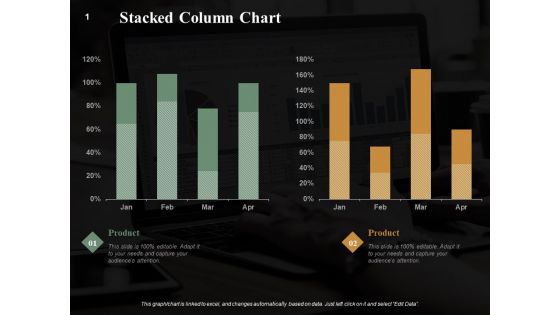
Stacked Column Chart Finance Ppt PowerPoint Presentation Summary Graphics Example
This is a stacked column chart finance ppt powerpoint presentation summary graphics example. This is a two stage process. The stages in this process are stacked column chart, marketing, analysis, business, investment.
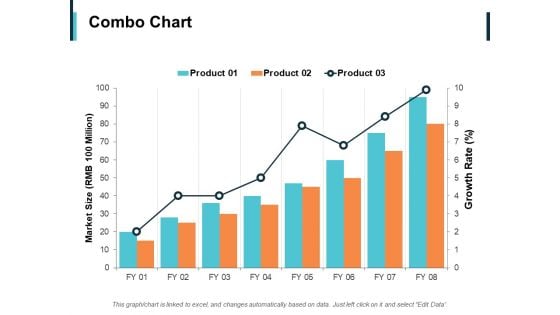
Combo Chart Finance Ppt PowerPoint Presentation Infographic Template Outline
This is a combo chart finance ppt powerpoint presentation infographic template outline. This is a three stage process. The stages in this process are combo chart, finance, analysis, business, investment.
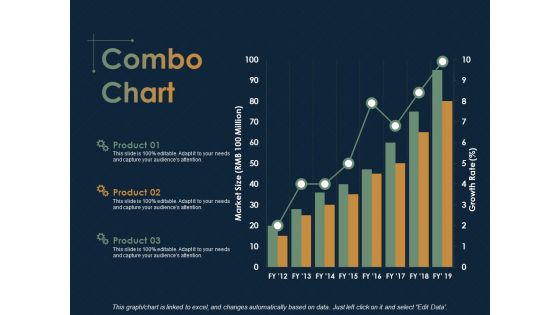
Combo Chart Finance Ppt PowerPoint Presentation Ideas Microsoft
This is a combo chart finance ppt powerpoint presentation ideas microsoft. This is a three stage process. The stages in this process are combo chart, Finance, Analysis, Business, Investment.

Area Chart Investment Ppt PowerPoint Presentation Styles Topics
This is a area chart investment ppt powerpoint presentation styles topics. This is a three stage process. The stages in this process are area chart, finance, marketing, analysis, investment.
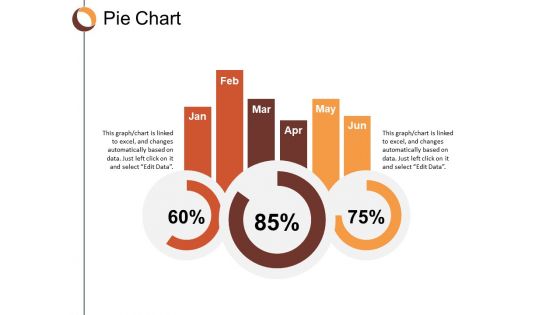
Pie Chart Finance Ppt Powerpoint Presentation Infographic Template Clipart
This is a pie chart finance ppt powerpoint presentation infographic template clipart. This is a three stage process. The stages in this process are pie chart, finance, marketing, business, analysis.
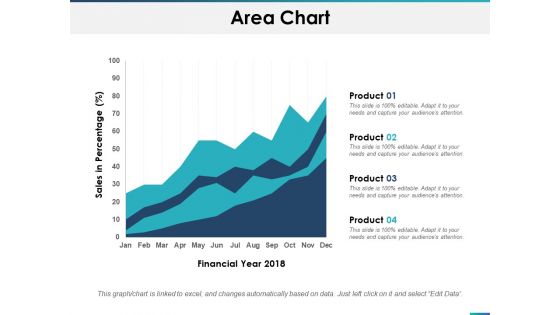
Area Chart Finance Ppt PowerPoint Presentation Outline Brochure
This is a area chart finance ppt powerpoint presentation outline brochure. This is a four stage process. The stages in this process are area chart, finance, marketing, analysis, investment.
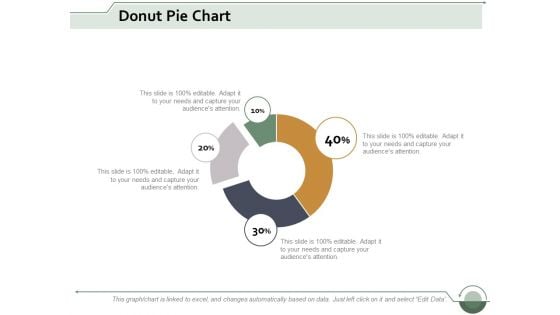
donut pie chart investment ppt powerpoint presentation show guide
This is a donut pie chart investment ppt powerpoint presentation show guide. This is a four stage process. The stages in this process are donut pie chart, finance, marketing, business, analysis.
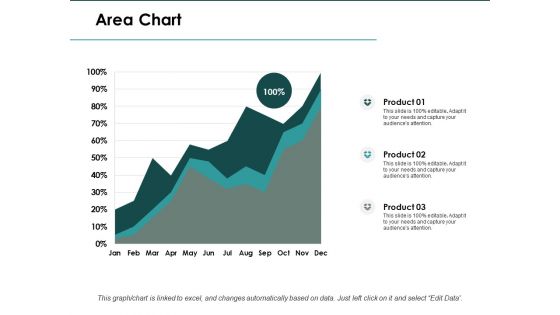
Area Chart Finance Ppt PowerPoint Presentation Infographics Slide
This is a area chart finance ppt powerpoint presentation infographics slide. This is a three stage process. The stages in this process are area chart, finance, marketing, analysis, investment.


 Continue with Email

 Home
Home


