Investment Highlights
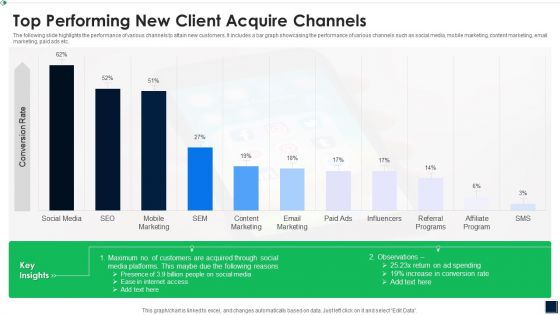
Top Performing New Client Acquire Channels Elements PDF
The following slide highlights the performance of various channels to attain new customers. It includes a bar graph showcasing the performance of various channels such as social media, mobile marketing, content marketing, email marketing, paid ads etc. Showcasing this set of slides titled Top Performing New Client Acquire Channels Elements PDF The topics addressed in these templates are Top Performing New Client Acquire Channels All the content presented in this PPT design is completely editable. Download it and make adjustments in color, background, font etc. as per your unique business setting.
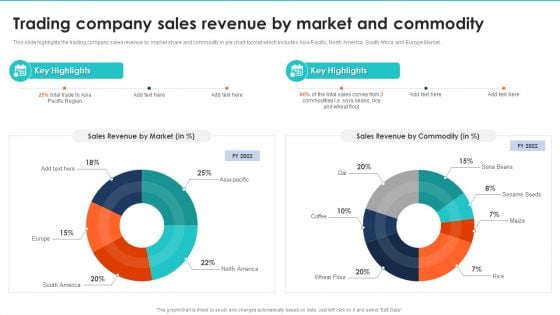
Export Management Company Profile Trading Company Sales Revenue By Market And Commodity Background PDF
This slide highlights the trading company sales revenue by market share and commodity in pie chart format which includes Asia Pacific, North America, South Africa and Europe Market. Deliver and pitch your topic in the best possible manner with this Export Management Company Profile Trading Company Sales Revenue By Market And Commodity Background PDF. Use them to share invaluable insights on Sales Revenue By Market, Sales Revenue By Commodity and impress your audience. This template can be altered and modified as per your expectations. So, grab it now.
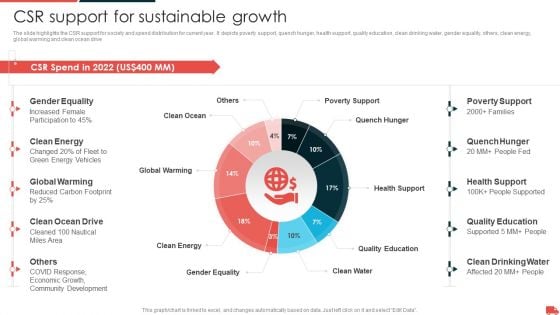
Transportation And Logistics Services Company Profile CSR Support For Sustainable Growth Ideas PDF
The slide highlights the CSR support for society and spend distribution for current year. It depicts poverty support, quench hunger, health support, quality education, clean drinking water, gender equality, others, clean energy, global warming and clean ocean drive. Deliver and pitch your topic in the best possible manner with this Transportation And Logistics Services Company Profile CSR Support For Sustainable Growth Ideas PDF. Use them to share invaluable insights on Gender Equality, Clean Energy, Global Warming, Clean Ocean Drive, Health Support and impress your audience. This template can be altered and modified as per your expectations. So, grab it now.
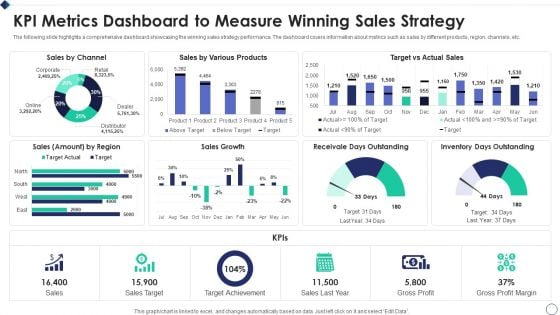
KPI Metrics Dashboard To Measure Winning Sales Strategy Ideas PDF
The following slide highlights a comprehensive dashboard showcasing the winning sales strategy performance. The dashboard covers information about metrics such as sales by different products, region, channels, etc.Showcasing this set of slides titled KPI Metrics Dashboard To Measure Winning Sales Strategy Ideas PDF The topics addressed in these templates are Sales By Channel, Various Products, Inventory Outstanding All the content presented in this PPT design is completely editable. Download it and make adjustments in color, background, font etc. as per your unique business setting.
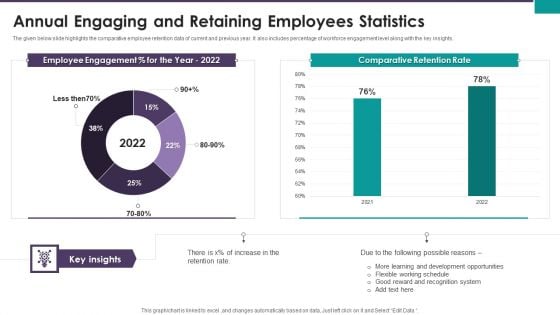
Annual Engaging And Retaining Employees Statistics Ppt Styles Example PDF
The given below slide highlights the comparative employee retention data of current and previous year. It also includes percentage of workforce engagement level along with the key insights. Showcasing this set of slides titled Annual Engaging And Retaining Employees Statistics Ppt Styles Example PDF. The topics addressed in these templates are Employee Engagement Percent, Comparative Retention Rate. All the content presented in this PPT design is completely editable. Download it and make adjustments in color, background, font etc. as per your unique business setting.
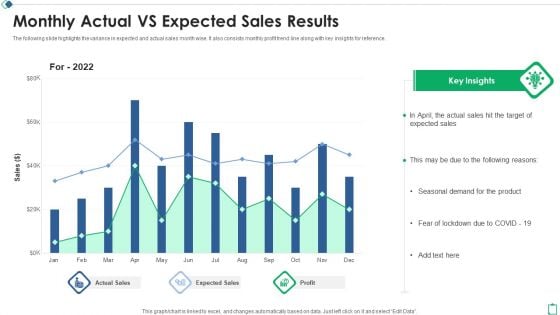
Monthly Actual Vs Expected Sales Results Ppt Show Deck PDF
The following slide highlights the variance in expected and actual sales month wise. It also consists monthly profit trend line along with key insights for reference. Showcasing this set of slides titled Monthly Actual Vs Expected Sales Results Ppt Show Deck PDF. The topics addressed in these templates are Target Expected Sales, Actual Sales Profit, Expected Sales 2022. All the content presented in this PPT design is completely editable. Download it and make adjustments in color, background, font etc. as per your unique business setting.
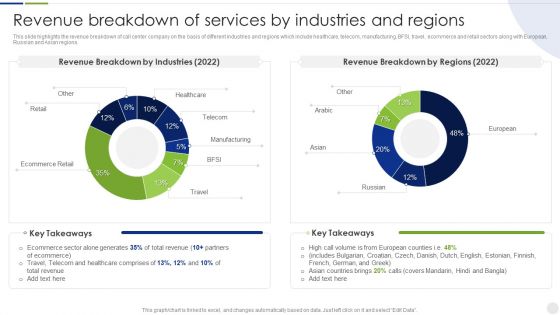
Business Process Outsourcing Company Profile Revenue Breakdown Of Services Elements PDF
This slide highlights the revenue breakdown of call center company on the basis of different industries and regions which include healthcare, telecom, manufacturing, BFSI, travel, ecommerce and retail sectors along with European, Russian and Asian regions. Deliver an awe inspiring pitch with this creative Business Process Outsourcing Company Profile Revenue Breakdown Of Services Elements PDF bundle. Topics like Revenue Breakdown, Ecommerce Retail, Healthcare can be discussed with this completely editable template. It is available for immediate download depending on the needs and requirements of the user.
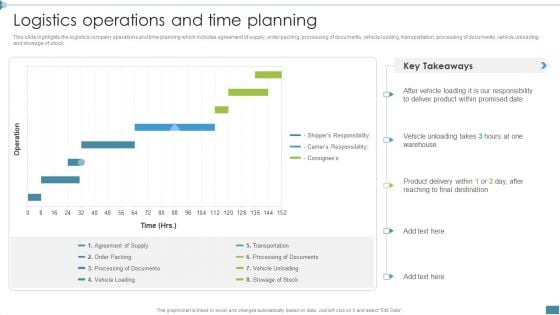
Supply Chain And Logistics Company Profile Logistics Operations And Time Planning Portrait PDF
This slide highlights the logistics company operations and time planning which includes agreement of supply, order packing, processing of documents, vehicle loading, transportation, processing of documents, vehicle unloading and stowage of stock. Deliver and pitch your topic in the best possible manner with this Supply Chain And Logistics Company Profile Logistics Operations And Time Planning Portrait PDF. Use them to share invaluable insights on Logistics, Operations, Planning and impress your audience. This template can be altered and modified as per your expectations. So, grab it now.
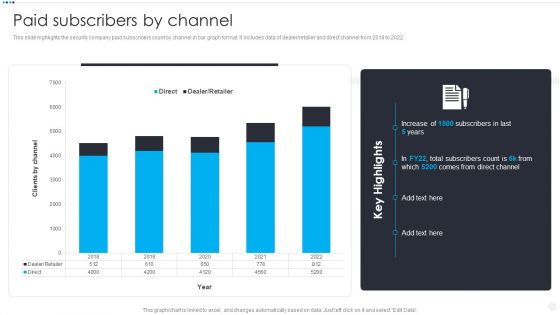
Smart Home Security Solutions Company Profile Paid Subscribers By Channel Clipart PDF
This slide highlights the security company paid subscribers count by channel in bar graph format. It includes data of dealer or retailer and direct channel from 2018 to 2022. Deliver an awe inspiring pitch with this creative Smart Home Security Solutions Company Profile Paid Subscribers By Channel Clipart PDF bundle. Topics like Direct Dealer Retailer, 2018 To 2022, Clients By Channel can be discussed with this completely editable template. It is available for immediate download depending on the needs and requirements of the user.
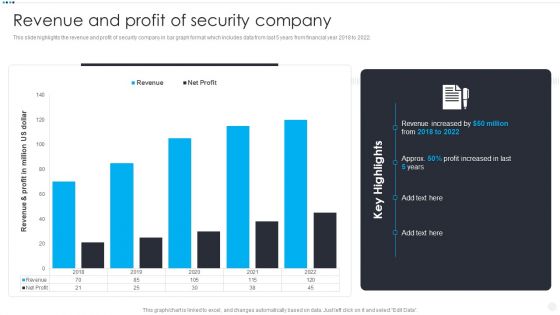
Smart Home Security Solutions Company Profile Revenue And Profit Of Security Company Elements PDF
This slide highlights the revenue and profit of security company in bar graph format which includes data from last 5 years from financial year 2018 to 2022. Deliver and pitch your topic in the best possible manner with this Smart Home Security Solutions Company Profile Revenue And Profit Of Security Company Elements PDF. Use them to share invaluable insights on Revenue And Profit, Million US Dollar, Revenue Increased Profit and impress your audience. This template can be altered and modified as per your expectations. So, grab it now.
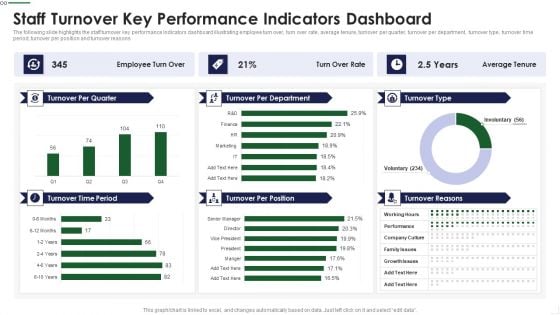
Staff Turnover Key Performance Indicators Dashboard Sample PDF
The following slide highlights the staff turnover key performance Indicators dashboard illustrating employee turn over, turn over rate, average tenure, turnover per quarter, turnover per department, turnover type, turnover time period, turnover per position and turnover reasons Deliver and pitch your topic in the best possible manner with this Staff Turnover Key Performance Indicators Dashboard Sample PDF Use them to share invaluable insights on Management Goals, Subjective Appraisal, Product Defects and impress your audience. This template can be altered and modified as per your expectations. So, grab it now.
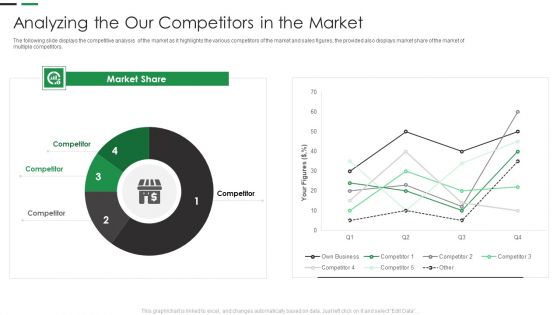
Evaluating New Commodity Impact On Market Analyzing The Our Competitors In The Market Rules PDF
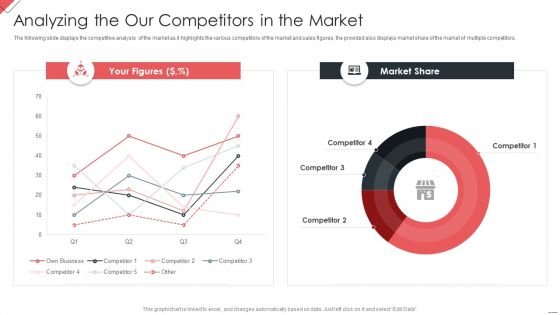
The following slide displays the competitive analysis of the market as it highlights the various competitors of the market and sales figures, the provided also displays market share of the market of multiple competitors.Deliver and pitch your topic in the best possible manner with this Evaluating New Commodity Impact On Market Analyzing The Our Competitors In The Market Rules PDF Use them to share invaluable insights on Analyzing, Our Competitors, Market and impress your audience. This template can be altered and modified as per your expectations. So, grab it now.
New Commodity Market Viability Review Analyzing The Our Competitors In The Market Guidelines PDF
The following slide displays the competitive analysis of the market as it highlights the various competitors of the market and sales figures, the provided also displays market share of the market of multiple competitors.Deliver and pitch your topic in the best possible manner with this New Commodity Market Viability Review Analyzing The Our Competitors In The Market Guidelines PDF Use them to share invaluable insights on Analyzing, Competitors, Market and impress your audience. This template can be altered and modified as per your expectations. So, grab it now.
Solid Waste Management Process KPI Dashboard Pictures PDF
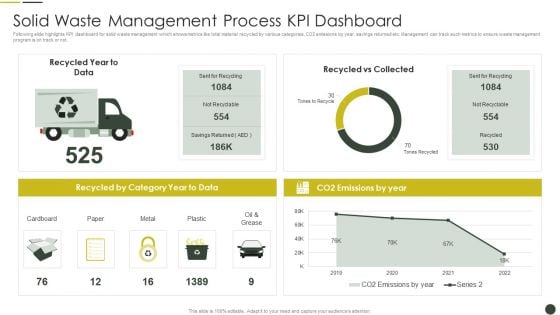
Following slide highlights KPI dashboard for solid waste management which shows metrics like total material recycled by various categories, CO2 emissions by year, savings returned etc. Management can track such metrics to ensure waste management program is on track or not.Showcasing this set of slides titled Solid Waste Management Process KPI Dashboard Pictures PDF The topics addressed in these templates are Recycled Category, Sent Recycling, Tones Recycle All the content presented in this PPT design is completely editable. Download it and make adjustments in color, background, font etc. as per your unique business setting.
Understanding The Global Market Scenario For Aerated Drinks Industry Elevator Pitch Deck Clipart PDF
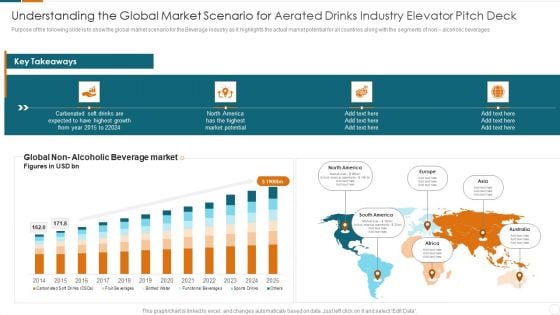
Purpose of the following slide is to show the global market scenario for the Beverage industry as it highlights the actual market potential for all countries along with the segments of non alcoholic beverages.Deliver and pitch your topic in the best possible manner with this Understanding The Global Market Scenario For Aerated Drinks Industry Elevator Pitch Deck Clipart PDF Use them to share invaluable insights on Understanding Global, Market Scenario, Aerated Drinks and impress your audience. This template can be altered and modified as per your expectations. So, grab it now.
Statistics Showing Success Rate Of Skill Evaluation Practices Topics PDF
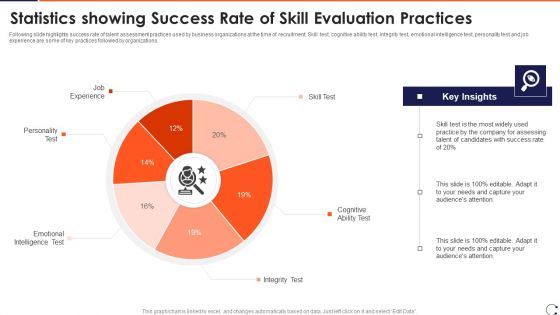
Following slide highlights success rate of talent assessment practices used by business organizations at the time of recruitment. Skill test, cognitive ability test, integrity test, emotional intelligence test, personality test and job experience are some of key practices followed by organizations.Pitch your topic with ease and precision using this Statistics Showing Success Rate Of Skill Evaluation Practices Topics PDF This layout presents information on Emotional Intelligence, Test Cognitive, Personality Test It is also available for immediate download and adjustment. So, changes can be made in the color, design, graphics or any other component to create a unique layout.
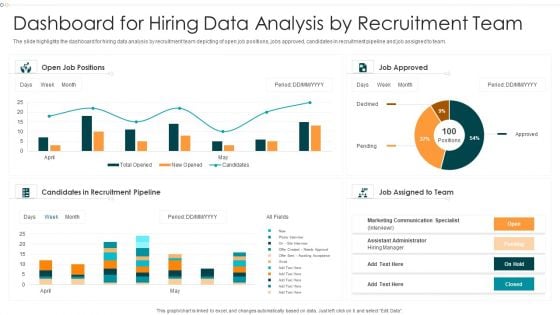
Dashboard For Hiring Data Analysis By Recruitment Team Formats PDF
The slide highlights the dashboard for hiring data analysis by recruitment team depicting of open job positions, jobs approved, candidates in recruitment pipeline and job assigned to team.Pitch your topic with ease and precision using this Dashboard For Hiring Data Analysis By Recruitment Team Formats PDF This layout presents information on Candidates Recruitment, Marketing Communication, Approved It is also available for immediate download and adjustment. So, changes can be made in the color, design, graphics or any other component to create a unique layout.
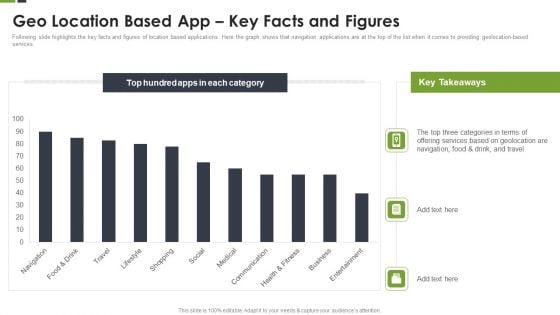
LBS Application Elevator Geo Location Based App Key Facts And Figures Ppt Infographic Template Example Topics PDF
Following slide highlights the key facts and figures of location based applications. Here the graph shows that navigation applications are at the top of the list when it comes to providing geolocation-based services. Deliver and pitch your topic in the best possible manner with this LBS Application Elevator Geo Location Based App Key Facts And Figures Ppt Infographic Template Example Topics PDF. Use them to share invaluable insights on Health Fitness, Business Entertainment, Social Medical and impress your audience. This template can be altered and modified as per your expectations. So, grab it now.
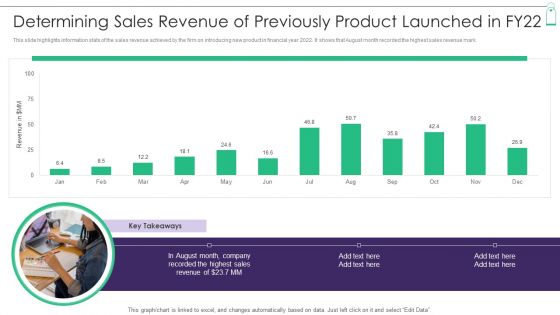
New Product Sales Strategy And Marketing Determining Sales Revenue Of Previously Product Brochure PDF
This slide highlights information stats of the sales revenue achieved by the firm on introducing new product in financial year 2022. It shows that August month recorded the highest sales revenue mark. Deliver and pitch your topic in the best possible manner with this New Product Sales Strategy And Marketing Determining Sales Revenue Of Previously Product Brochure PDF. Use them to share invaluable insights on Sales Revenue, Previously Product, Revenue and impress your audience. This template can be altered and modified as per your expectations. So, grab it now.
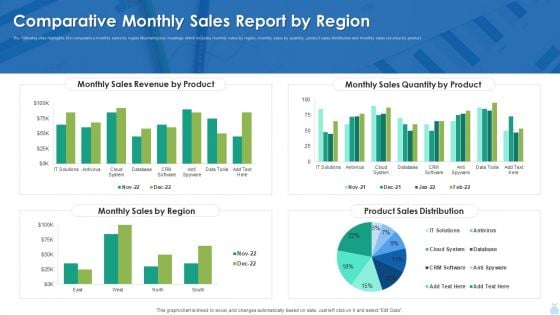
Comparative Monthly Sales Report By Region Graphics PDF
The following slide highlights the comparative monthly sales by region illustrating key headings which includes monthly sales by region, monthly sales by quantity, product sales distribution and monthly sales revenue by product. Showcasing this set of slides titled Comparative Monthly Sales Report By Region Graphics PDF. The topics addressed in these templates are Sales Revenue, Monthly Sales Quantity, Product Sales Distribution. All the content presented in this PPT design is completely editable. Download it and make adjustments in color, background, font etc. as per your unique business setting.
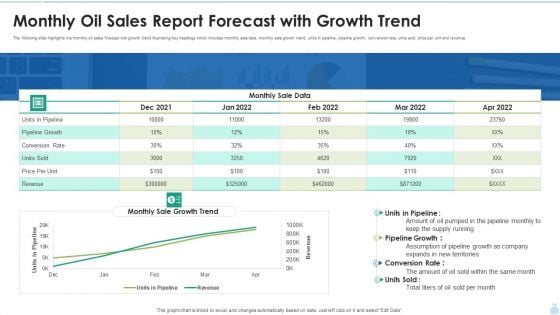
Monthly Oil Sales Report Forecast With Growth Trend Graphics PDF
The following slide highlights the monthly oil sales forecast with growth trend illustrating key headings which includes monthly sale data, monthly sale growth trend, units in pipeline, pipeline growth, conversion rate, units sold, price per unit and revenue. Showcasing this set of slides titled Monthly Oil Sales Report Forecast With Growth Trend Graphics PDF. The topics addressed in these templates are Pipeline Growth, Monthly Sale Data, Conversion Rate. All the content presented in this PPT design is completely editable. Download it and make adjustments in color, background, font etc. as per your unique business setting.
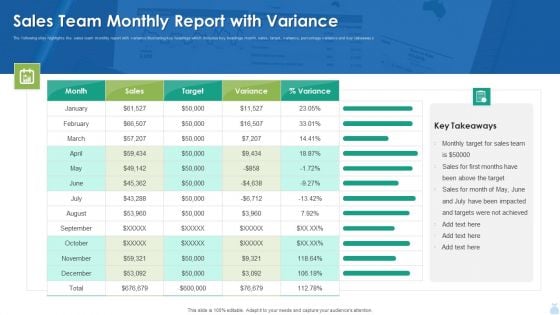
Sales Team Monthly Report With Variance Background PDF
The following slide highlights the sales team monthly report with variance illustrating key headings which includes key headings month, sales, target, variance, percentage variance and key takeaways. Pitch your topic with ease and precision using this Sales Team Monthly Report With Variance Background PDF. This layout presents information on Sales Team Monthly Report With Variance Background PDF. It is also available for immediate download and adjustment. So, changes can be made in the color, design, graphics or any other component to create a unique layout.
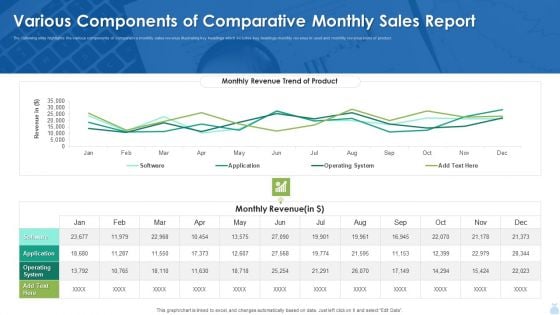
Various Components Of Comparative Monthly Sales Report Inspiration PDF
The following slide highlights the various components of comparative monthly sales revenue illustrating key headings which includes key headings monthly revenue in used and monthly revenue trend of product. Showcasing this set of slides titled Various Components Of Comparative Monthly Sales Report Inspiration PDF. The topics addressed in these templates are Various Components Of Comparative Monthly Sales Report Inspiration PDF. All the content presented in this PPT design is completely editable. Download it and make adjustments in color, background, font etc. as per your unique business setting.
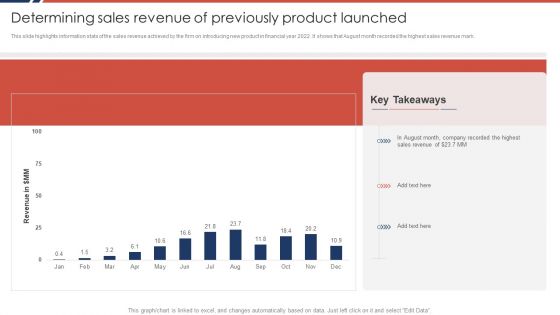
Effective Sales Plan For New Product Introduction In Market Determining Sales Revenue Of Previously Information PDF
This slide highlights information stats of the sales revenue achieved by the firm on introducing new product in financial year 2022. It shows that August month recorded the highest sales revenue mark.Deliver an awe inspiring pitch with this creative Effective Sales Plan For New Product Introduction In Market Determining Sales Revenue Of Previously Information PDF bundle. Topics like Determining Sales, Revenue Previously, Product Launched can be discussed with this completely editable template. It is available for immediate download depending on the needs and requirements of the user.
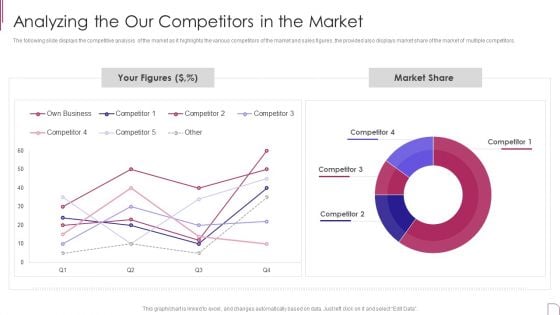
Yearly Product Performance Assessment Repor Analyzing The Our Competitors Portrait PDF
The following slide displays the competitive analysis of the market as it highlights the various competitors of the market and sales figures, the provided also displays market share of the market of multiple competitors.Deliver and pitch your topic in the best possible manner with this Yearly Product Performance Assessment Repor Analyzing The Our Competitors Portrait PDF Use them to share invaluable insights on Total Addressable, Serviceable Addressable, Obtainable Market and impress your audience. This template can be altered and modified as per your expectations. So, grab it now.

Makeup And Beauty Care Products Company Profile Annual Revenue 2018 To 2022 Sample PDF
This slide highlights the annual revenue of our company in last five years with CAGR from 2018 to 2022 which shows increasing trend due to improved product sales.Deliver and pitch your topic in the best possible manner with this Makeup And Beauty Care Products Company Profile Annual Revenue 2018 To 2022 Sample PDF Use them to share invaluable insights on Revenue Increased, Company Reported, Annual Revenue and impress your audience. This template can be altered and modified as per your expectations. So, grab it now.
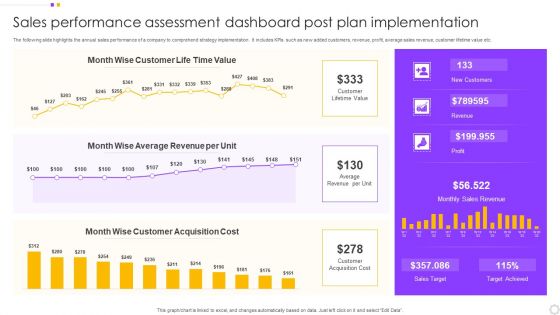
Sales Performance Assessment Dashboard Post Plan Implementation Introduction PDF
The following slide highlights the annual sales performance of a company to comprehend strategy implementation. It includes KPIs such as new added customers, revenue, profit, average sales revenue, customer lifetime value etc. Pitch your topic with ease and precision using this Sales Performance Assessment Dashboard Post Plan Implementation Introduction PDF. This layout presents information on Customer, Value, Average Revenue. It is also available for immediate download and adjustment. So, changes can be made in the color, design, graphics or any other component to create a unique layout.
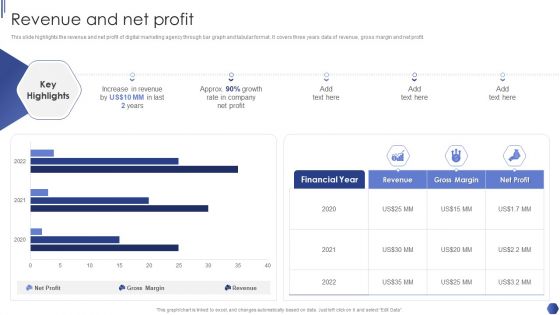
Digital Marketing Agency Business Profile Revenue And Net Profit Diagrams PDF
This slide highlights the revenue and net profit of digital marketing agency through bar graph and tabular format. It covers three years data of revenue, gross margin and net profit. Deliver and pitch your topic in the best possible manner with this Digital Marketing Agency Business Profile Revenue And Net Profit Diagrams PDF. Use them to share invaluable insights on Increase In Revenue, Growth Rate, Net Profit and impress your audience. This template can be altered and modified as per your expectations. So, grab it now.
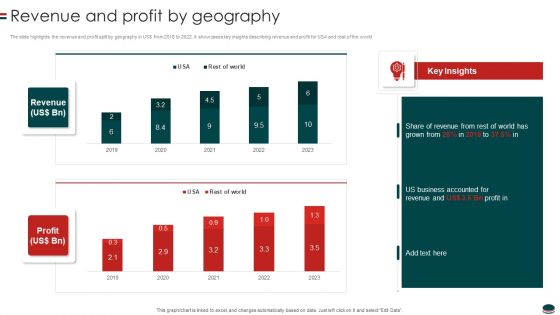
Instant Snacks And Food Firm Details Revenue And Profit By Geography Mockup PDF
The slide highlights the revenue and profit split by geography in US from 2018 to 2022. It showcases key insights describing revenue and profit for USA and rest of the world.Deliver an awe inspiring pitch with this creative Instant Snacks And Food Firm Details Revenue And Profit By Geography Mockup PDF bundle. Topics like Business Accounted, Share Of Revenue, Key Insights can be discussed with this completely editable template. It is available for immediate download depending on the needs and requirements of the user.
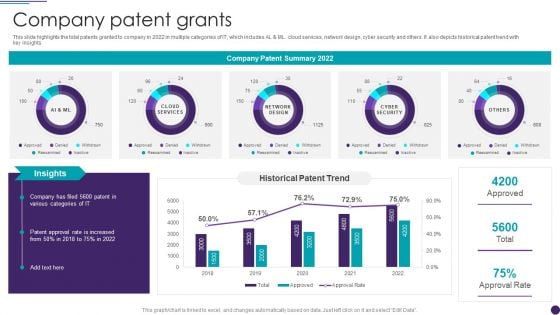
IT Services Business Profile Company Patent Grants Infographics PDF
This slide highlights the total patents granted to company in 2022 in multiple categories of IT, which includes AL and ML. cloud services, network design, cyber security and others. It also depicts historical patent trend with key insights. Deliver an awe inspiring pitch with this creative IT Services Business Profile Company Patent Grants Infographics PDF bundle. Topics like Network Design, Cyber Security, Cloud Services can be discussed with this completely editable template. It is available for immediate download depending on the needs and requirements of the user.
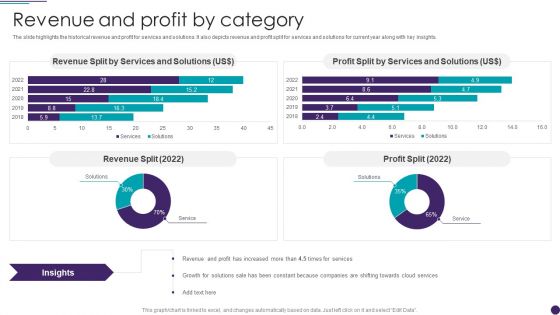
IT Services Business Profile Revenue And Profit By Category Mockup PDF
The slide highlights the historical revenue and profit for services and solutions. It also depicts revenue and profit split for services and solutions for current year along with key insights. Deliver and pitch your topic in the best possible manner with this IT Services Business Profile Revenue And Profit By Category Mockup PDF. Use them to share invaluable insights on Revenue Split, Services And Solutions, Profit Split and impress your audience. This template can be altered and modified as per your expectations. So, grab it now.
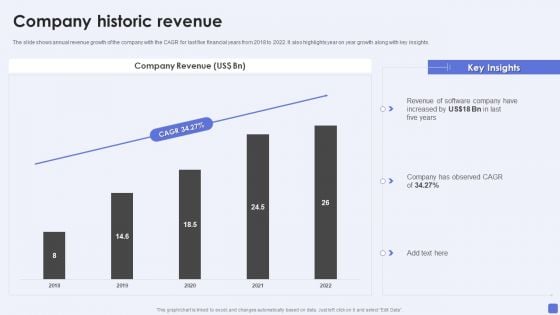
Software Services Business Profile Company Historic Revenue Ppt PowerPoint Presentation Gallery Graphics Download PDF
The slide shows annual revenue growth of the company with the CAGR for last five financial years from 2018 to 2022. It also highlights year on year growth along with key insights. Deliver and pitch your topic in the best possible manner with this Software Services Business Profile Company Historic Revenue Ppt PowerPoint Presentation Gallery Graphics Download PDF. Use them to share invaluable insights on Company Revenue, Observed CAGR, 2018 To 2022 and impress your audience. This template can be altered and modified as per your expectations. So, grab it now.
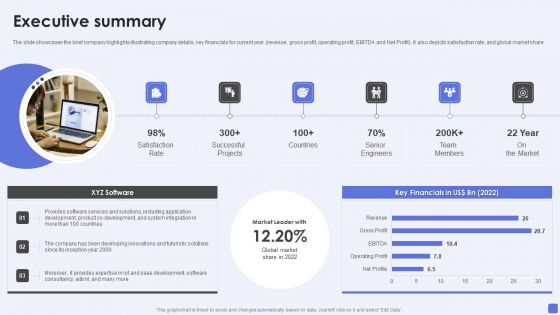
Software Services Business Profile Executive Summary Ppt PowerPoint Presentation File Elements PDF
The slide showcases the brief company highlights illustrating company details, key financials for current year revenue, gross profit, operating profit, EBITDA and Net Profit. It also depicts satisfaction rate, and global market share. Deliver an awe inspiring pitch with this creative Software Services Business Profile Executive Summary Ppt PowerPoint Presentation File Elements PDF bundle. Topics like Satisfaction Rate, Successful Projects, Senior Engineers can be discussed with this completely editable template. It is available for immediate download depending on the needs and requirements of the user.
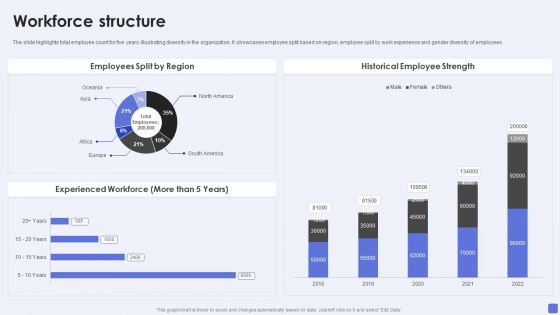
Software Services Business Profile Workforce Structure Ppt PowerPoint Presentation Gallery Good PDF
The slide highlights total employee count for five years illustrating diversity in the organization. It showcases employee split based on region, employee split by work experience and gender diversity of employees. Deliver and pitch your topic in the best possible manner with this Software Services Business Profile Workforce Structure Ppt PowerPoint Presentation Gallery Good PDF. Use them to share invaluable insights on Employees Split Region, Historical Employee Strength, Experienced Workforce, 2018 To 2022 and impress your audience. This template can be altered and modified as per your expectations. So, grab it now.
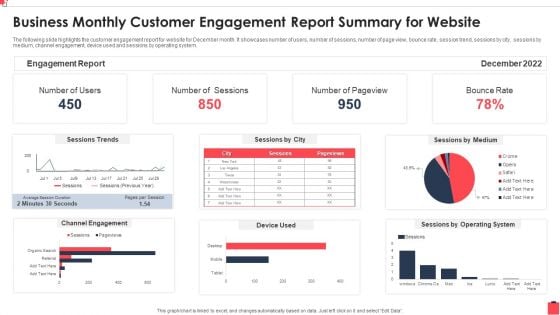
Business Monthly Customer Engagement Report Summary For Website Sample PDF
The following slide highlights the customer engagement report for website for December month. It showcases number of users, number of sessions, number of page view, bounce rate, session trend, sessions by city, sessions by medium, channel engagement, device used and sessions by operating system.Showcasing this set of slides titled Business Monthly Customer Engagement Report Summary For Website Sample PDF The topics addressed in these templates are Channel Engagement, Operating System, Bounce Rate All the content presented in this PPT design is completely editable. Download it and make adjustments in color, background, font etc. as per your unique business setting.
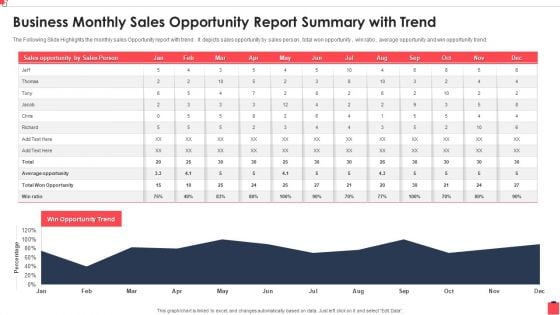
Business Monthly Sales Opportunity Report Summary With Trend Professional PDF
The Following Slide Highlights the monthly sales Opportunity report with trend . It depicts sales opportunity by sales person , total won opportunity , win ratio , average opportunity and win opportunity trend.Showcasing this set of slides titled Business Monthly Sales Opportunity Report Summary With Trend Professional PDF The topics addressed in these templates are Average Opportunity, Won Opportunity, Sales Opportunity All the content presented in this PPT design is completely editable. Download it and make adjustments in color, background, font etc. as per your unique business setting.
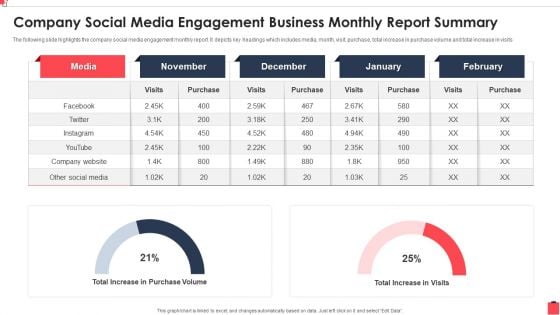
Company Social Media Engagement Business Monthly Report Summary Mockup PDF
The following slide highlights the company social media engagement monthly report. It depicts key headings which includes media, month, visit, purchase, total increase in purchase volume and total increase in visits.Pitch your topic with ease and precision using this Company Social Media Engagement Business Monthly Report Summary Mockup PDF This layout presents information on Total Increase, Company Website, Purchase Volume It is also available for immediate download and adjustment. So, changes can be made in the color, design, graphics or any other component to create a unique layout.
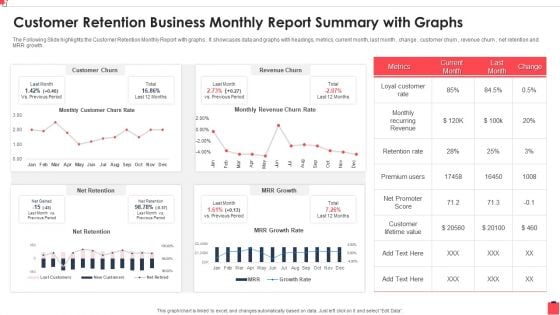
Customer Retention Business Monthly Report Summary With Graphs Guidelines PDF
The Following Slide highlights the Customer Retention Monthly Report with graphs . It showcases data and graphs with headings, metrics, current month, last month , change , customer churn , revenue churn , net retention and MRR growth. Showcasing this set of slides titled Customer Retention Business Monthly Report Summary With Graphs Guidelines PDF The topics addressed in these templates are Recurring Revenue, Customer Churn, Promoter Score All the content presented in this PPT design is completely editable. Download it and make adjustments in color, background, font etc. as per your unique business setting.
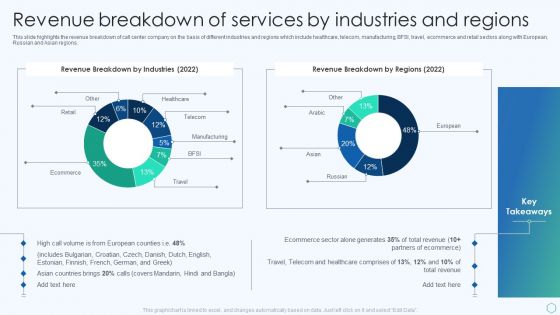
Inbound And Outbound Services Business Profile Revenue Breakdown Of Services Professional PDF
This slide highlights the revenue breakdown of call center company on the basis of different industries and regions which include healthcare, telecom, manufacturing, BFSI, travel, ecommerce and retail sectors along with European, Russian and Asian regions. Deliver and pitch your topic in the best possible manner with this Inbound And Outbound Services Business Profile Revenue Breakdown Of Services Professional PDF. Use them to share invaluable insights on Revenue Breakdown, Manufacturing, Healthcare Comprises and impress your audience. This template can be altered and modified as per your expectations. So, grab it now.
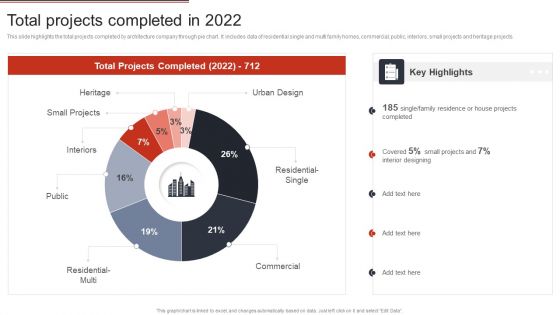
Building Design Firm Details Total Projects Completed In 2022 Ppt Infographic Template Graphics Pictures PDF
This slide highlights the total projects completed by architecture company through pie chart. It includes data of residential single and multi family homes, commercial, public, interiors, small projects and heritage projects. Deliver an awe inspiring pitch with this creative Building Design Firm Details Total Projects Completed In 2022 Ppt Infographic Template Graphics Pictures PDF bundle. Topics like Urban Design, Residential Single, Commercial, Interiors, Small Projects can be discussed with this completely editable template. It is available for immediate download depending on the needs and requirements of the user.
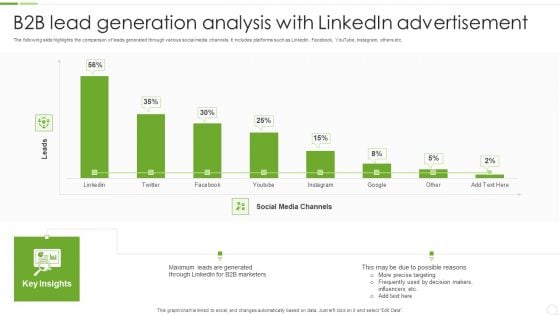
B2B Lead Generation Analysis With Linkedin Advertisement Ppt Outline Example Introduction PDF
The following slide highlights the comparison of leads generated through various social media channels. It includes platforms such as LinkedIn, Facebook, YouTube, Instagram, others etc. Showcasing this set of slides titled B2B Lead Generation Analysis With Linkedin Advertisement Ppt Outline Example Introduction PDF. The topics addressed in these templates are Social Media Channels, B2B Marketers, Maximum Leads. All the content presented in this PPT design is completely editable. Download it and make adjustments in color, background, font etc. as per your unique business setting.
Saas Cloud Security Analysis With KPI Dashboard Ppt PowerPoint Presentation Icon Slides PDF
The following slide highlights the assessment of Software as a security to meet safety standards. It includes key elements such as critical incidents, risk analysis, number of open tasks etc. Pitch your topic with ease and precision using this Saas Cloud Security Analysis With KPI Dashboard Ppt PowerPoint Presentation Icon Slides PDF. This layout presents information on Quarterly Incident Severity, Incident Risk Analysis, Critical Incidents. It is also available for immediate download and adjustment. So, changes can be made in the color, design, graphics or any other component to create a unique layout.
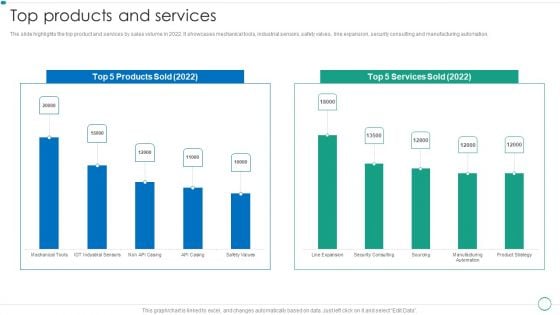
Real Estate Construction And Engineering Company Profile Top Products And Services Microsoft PDF
The slide highlights the top product and services by sales volume in 2022. It showcases mechanical tools, industrial sensors, safety valves, line expansion, security consulting and manufacturing automation.Deliver and pitch your topic in the best possible manner with this Real Estate Construction And Engineering Company Profile Top Products And Services Microsoft PDF. Use them to share invaluable insights on Employee Diversity, Employee Count, Total Employees and impress your audience. This template can be altered and modified as per your expectations. So, grab it now.
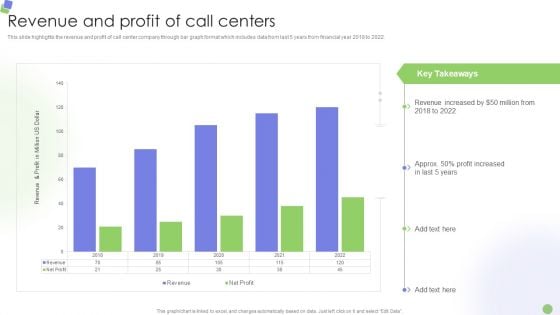
Knowledge Process Outsourcing Company Profile Revenue And Profit Of Call Centers Diagrams PDF
This slide highlights the revenue and profit of call center company through bar graph format which includes data from last 5 years from financial year 2018 to 2022.Deliver and pitch your topic in the best possible manner with this Knowledge Process Outsourcing Company Profile Revenue And Profit Of Call Centers Diagrams PDF. Use them to share invaluable insights on Revenue Increased, Profit Increased, Key Takeaways and impress your audience. This template can be altered and modified as per your expectations. So, grab it now.
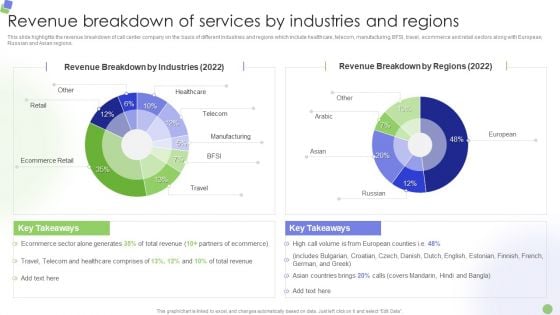
Knowledge Process Outsourcing Company Profile Revenue Breakdown Of Services By Industries And Regions Infographics PDF
This slide highlights the revenue breakdown of call center company on the basis of different industries and regions which include healthcare, telecom, manufacturing, BFSI, travel, ecommerce and retail sectors along with European, Russian and Asian regions. Deliver an awe inspiring pitch with this creative Knowledge Process Outsourcing Company Profile Revenue Breakdown Of Services By Industries And Regions Infographics PDF bundle. Topics like Manufacturing, Ecommerce Retail, Revenue Breakdown can be discussed with this completely editable template. It is available for immediate download depending on the needs and requirements of the user.
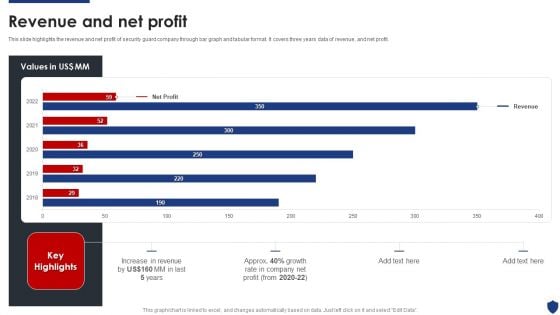
Security Officer Service Company Profile Revenue And Net Profit Ppt PowerPoint Presentation Gallery Graphic Images PDF
This slide highlights the revenue and net profit of security guard company through bar graph and tabular format. It covers three years data of revenue, and net profit. Deliver an awe inspiring pitch with this creative Security Officer Service Company Profile Revenue And Net Profit Ppt PowerPoint Presentation Gallery Graphic Images PDF bundle. Topics like Net Profit, Increase Revenue, 2018 To 2022 can be discussed with this completely editable template. It is available for immediate download depending on the needs and requirements of the user.
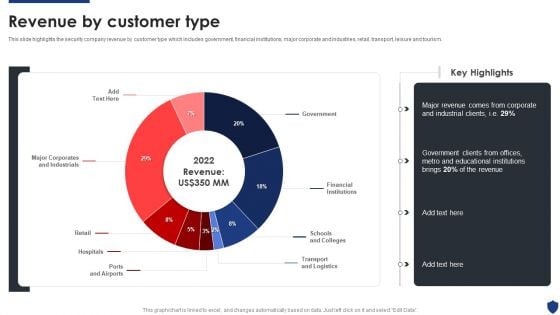
Security Officer Service Company Profile Revenue By Customer Type Ppt PowerPoint Presentation File Themes PDF
This slide highlights the security company revenue by customer type which includes government, financial institutions, major corporate and industries, retail, transport, leisure and tourism. Deliver and pitch your topic in the best possible manner with this Security Officer Service Company Profile Revenue By Customer Type Ppt PowerPoint Presentation File Themes PDF. Use them to share invaluable insights on Government, Financial Institutions, Schools And Colleges, Transport And Logistics and impress your audience. This template can be altered and modified as per your expectations. So, grab it now.

Freight Shipping Company Profile CSR Support For Sustainable Growth Portrait PDF
The slide highlights the CSR support for society and spend distribution for current year. It depicts poverty support, quench hunger, health support, quality education, clean drinking water, gender equality, others, clean energy, global warming and clean ocean drive.Deliver and pitch your topic in the best possible manner with this Freight Shipping Company Profile CSR Support For Sustainable Growth Portrait PDF. Use them to share invaluable insights on Quench Hunger, Health Support, Quality Education and impress your audience. This template can be altered and modified as per your expectations. So, grab it now.
Stock Requirement Plan With Delivery Performance Ppt PowerPoint Presentation Icon Deck PDF
The following slide highlights the material requirement planning with delivery performance illustrating top clients by revenue details, top clients by revenue, delivery performance and shipments. Pitch your topic with ease and precision using this Stock Requirement Plan With Delivery Performance Ppt PowerPoint Presentation Icon Deck PDF. This layout presents information on Delivery Performance, Shipments, Top Clients Revenue. It is also available for immediate download and adjustment. So, changes can be made in the color, design, graphics or any other component to create a unique layout.
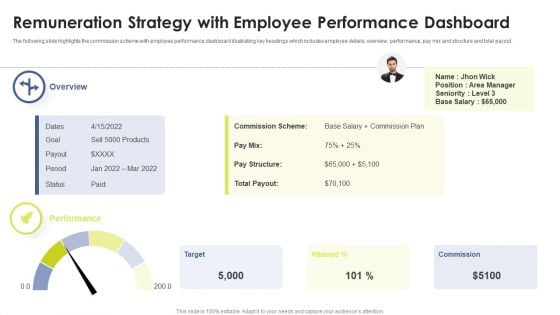
Remuneration Strategy With Employee Performance Dashboard Ppt Styles Themes PDF
The following slide highlights the commission scheme with employee performance dashboard illustrating key headings which includes employee details, overview, performance, pay mix and structure and total payout. Persuade your audience using this Remuneration Strategy With Employee Performance Dashboard Ppt Styles Themes PDF. This PPT design covers one stages, thus making it a great tool to use. It also caters to a variety of topics including Target, Attained, Commission. Download this PPT design now to present a convincing pitch that not only emphasizes the topic but also showcases your presentation skills.
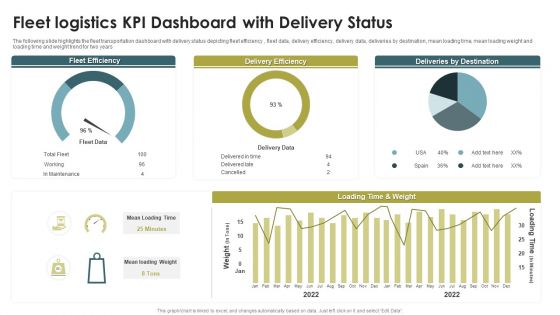
Fleet Logistics KPI Dashboard With Delivery Status Ppt Model Guide PDF
The following slide highlights the fleet transportation dashboard with delivery status depicting fleet efficiency , fleet data, delivery efficiency, delivery data, deliveries by destination, mean loading time, mean loading weight and loading time and weight trend for two years. Pitch your topic with ease and precision using this Fleet Logistics KPI Dashboard With Delivery Status Ppt Model Guide PDF. This layout presents information on Fleet Efficiency, Delivery Efficiency, Deliveries By Destination. It is also available for immediate download and adjustment. So, changes can be made in the color, design, graphics or any other component to create a unique layout.
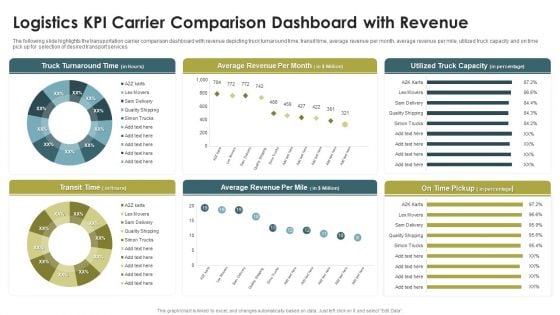
Logistics KPI Carrier Comparison Dashboard With Revenue Ppt Infographics Portfolio PDF
The following slide highlights the transportation carrier comparison dashboard with revenue depicting truck turnaround time, transit time, average revenue per month, average revenue per mile, utilized truck capacity and on time pick up for selection of desired transport services. Pitch your topic with ease and precision using this Logistics KPI Carrier Comparison Dashboard With Revenue Ppt Infographics Portfolio PDF. This layout presents information on Truck Turnaround Time, Average Revenue, Per Month, Transit Time. It is also available for immediate download and adjustment. So, changes can be made in the color, design, graphics or any other component to create a unique layout.
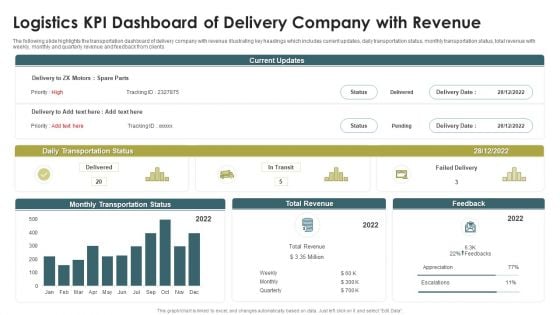
Logistics KPI Dashboard Of Delivery Company With Revenue Ppt Show PDF
The following slide highlights the transportation dashboard of delivery company with revenue illustrating key headings which includes current updates, daily transportation status, monthly transportation status, total revenue with weekly, monthly and quarterly revenue and feedback from clients. Showcasing this set of slides titled Logistics KPI Dashboard Of Delivery Company With Revenue Ppt Show PDF. The topics addressed in these templates are Daily Transportation Status, Monthly Transportation Status, Total Revenue. All the content presented in this PPT design is completely editable. Download it and make adjustments in color, background, font etc. as per your unique business setting.
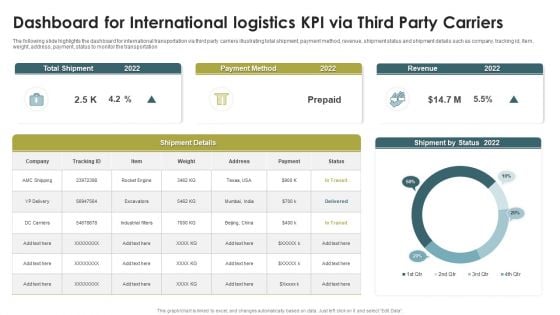
Dashboard For International Logistics KPI Via Third Party Carriers Rules PDF
The following slide highlights the dashboard for international transportation via third party carriers illustrating total shipment, payment method, revenue, shipment status and shipment details such as company, tracking id, Item, weight, address, payment, status to monitor the transportation. Showcasing this set of slides titled Dashboard For International Logistics KPI Via Third Party Carriers Rules PDF. The topics addressed in these templates are Total Shipment, Payment Method, Revenue, 20. All the content presented in this PPT design is completely editable. Download it and make adjustments in color, background, font etc. as per your unique business setting.
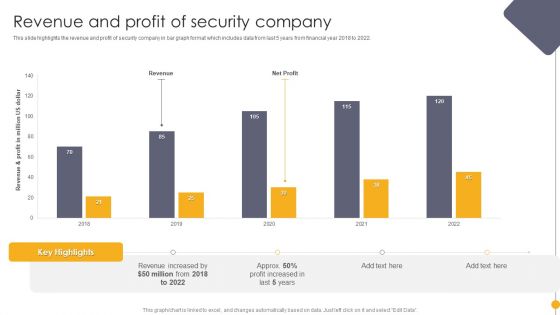
Portable Home Safety Systems Company Profile Revenue And Profit Of Security Company Ideas PDF
This slide highlights the revenue and profit of security company in bar graph format which includes data from last 5 years from financial year 2018 to 2022. Deliver and pitch your topic in the best possible manner with this Portable Home Safety Systems Company Profile Revenue And Profit Of Security Company Ideas PDF. Use them to share invaluable insights on Revenue Increased, 2018 To 2022, Profit Increased and impress your audience. This template can be altered and modified as per your expectations. So, grab it now.
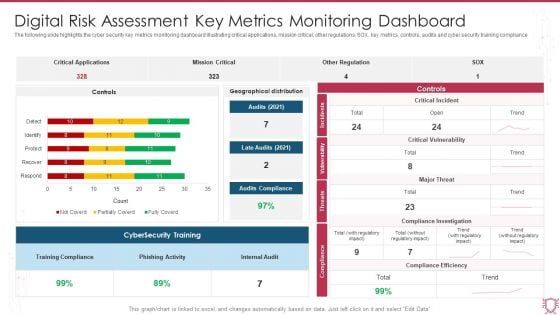
Digital Risk Assessment Key Metrics Monitoring Dashboard Ppt Ideas Diagrams PDF
The following slide highlights the cyber security key metrics monitoring dashboard illustrating critical applications, mission critical, other regulations, SOX, key metrics, controls, audits and cyber security training compliance. Showcasing this set of slides titled Digital Risk Assessment Key Metrics Monitoring Dashboard Ppt Ideas Diagrams PDF. The topics addressed in these templates are Critical Applications, Mission Critical, Other Regulation. All the content presented in this PPT design is completely editable. Download it and make adjustments in color, background, font etc. as per your unique business setting.
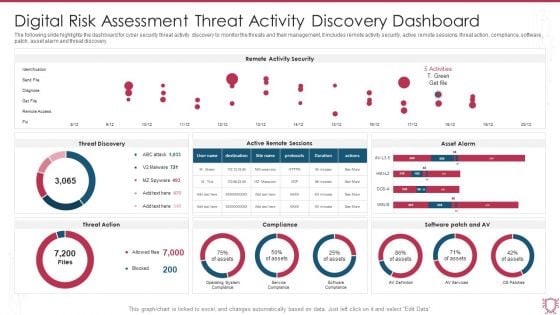
Digital Risk Assessment Threat Activity Discovery Dashboard Ppt Ideas Skills PDF
The following slide highlights the dashboard for cyber security threat activity discovery to monitor the threats and their management, it includes remote activity security, active remote sessions, threat action, compliance, software patch, asset alarm and threat discovery. Pitch your topic with ease and precision using this Digital Risk Assessment Threat Activity Discovery Dashboard Ppt Ideas Skills PDF. This layout presents information on Remote Activity Security, Threat Discovery, Asset Alarm. It is also available for immediate download and adjustment. So, changes can be made in the color, design, graphics or any other component to create a unique layout.
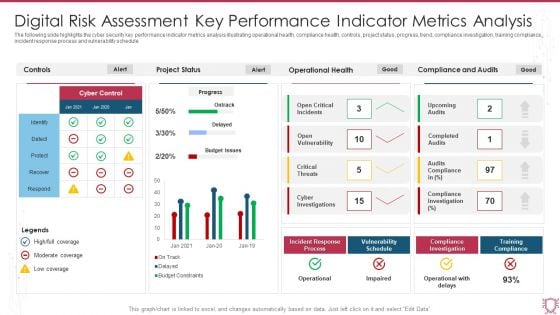
Digital Risk Assessment Key Performance Indicator Metrics Analysis Infographics PDF
The following slide highlights the cyber security key performance indicator metrics analysis illustrating operational health, compliance health, controls, project status, progress, trend, compliance investigation, training compliance, incident response process and vulnerability schedule. Showcasing this set of slides titled Digital Risk Assessment Key Performance Indicator Metrics Analysis Infographics PDF. The topics addressed in these templates are Project Status, Operational Health, Compliance And Audits. All the content presented in this PPT design is completely editable. Download it and make adjustments in color, background, font etc. as per your unique business setting.
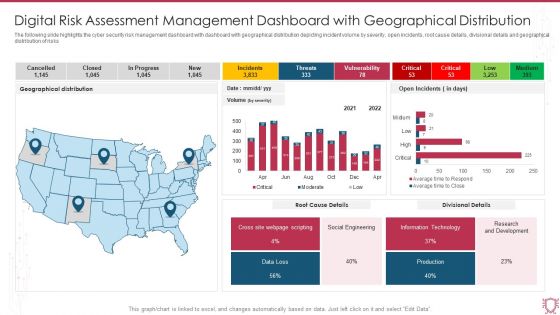
Digital Risk Assessment Management Dashboard With Geographical Distribution Clipart PDF
The following slide highlights the cyber security risk management dashboard with dashboard with geographical distribution depicting incident volume by severity, open incidents, root cause details, divisional details and geographical distribution of risks. Pitch your topic with ease and precision using this Digital Risk Assessment Management Dashboard With Geographical Distribution Clipart PDF. This layout presents information on Geographical Distribution, Root Cause Details, Divisional Details, Social Engineering. It is also available for immediate download and adjustment. So, changes can be made in the color, design, graphics or any other component to create a unique layout.
Market Insights Research Results With KPI Dashboard Ppt PowerPoint Presentation Icon File Formats PDF
The given below slide highlights the KPAs of market research associated with customer satisfaction. It includes net promoter score, customer effort score, monthly NPS and CES trend etc.Pitch your topic with ease and precision using this Market Insights Research Results With KPI Dashboard Ppt PowerPoint Presentation Icon File Formats PDF. This layout presents information on Satisfaction Score, Customer Effort, Customer Score. It is also available for immediate download and adjustment. So, changes can be made in the color, design, graphics or any other component to create a unique layout.


 Continue with Email

 Home
Home


