Investment Portfolio Dashboard
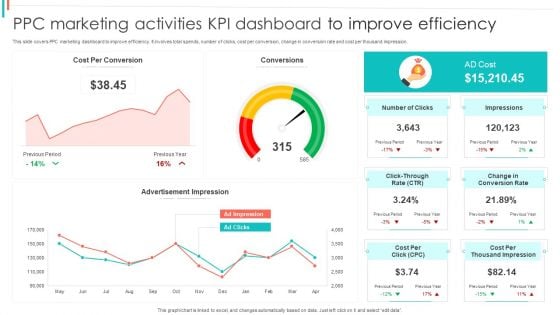
PPC Marketing Activities KPI Dashboard To Improve Efficiency Diagrams PDF
This slide covers PPC marketing dashboard to improve efficiency. It involves total spends, number of clicks, cost per conversion, change in conversion rate and cost per thousand impression.Showcasing this set of slides titled PPC Marketing Activities KPI Dashboard To Improve Efficiency Diagrams PDF. The topics addressed in these templates are Per Conversion, Advertisement Impression, Impressions. All the content presented in this PPT design is completely editable. Download it and make adjustments in color, background, font etc. as per your unique business setting.
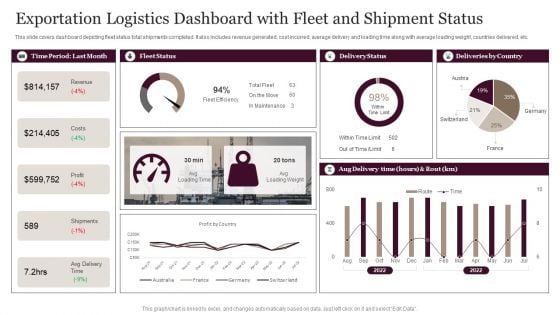
Exportation Logistics Dashboard With Fleet And Shipment Status Demonstration PDF
This slide covers dashboard depicting fleet status total shipments completed. It also includes revenue generated, cost incurred, average delivery and loading time along with average loading weight, countries delivered, etc. Showcasing this set of slides titled Exportation Logistics Dashboard With Fleet And Shipment Status Demonstration PDF. The topics addressed in these templates are Revenue, Costs, Profit. All the content presented in this PPT design is completely editable. Download it and make adjustments in color, background, font etc. as per your unique business setting.
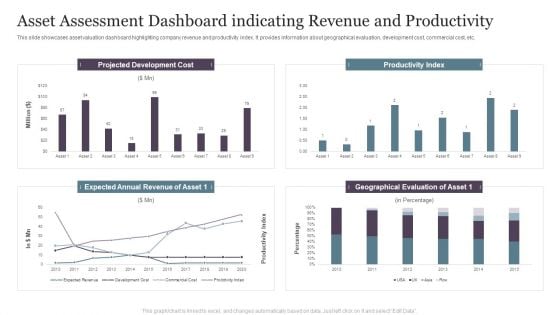
Asset Assessment Dashboard Indicating Revenue And Productivity Infographics PDF
This slide showcases asset valuation dashboard highlighting company revenue and productivity index. It provides information about geographical evaluation, development cost, commercial cost, etc.Pitch your topic with ease and precision using this Asset Assessment Dashboard Indicating Revenue And Productivity Infographics PDF. This layout presents information on Projected Development, Productivity Index, Geographical Evaluation. It is also available for immediate download and adjustment. So, changes can be made in the color, design, graphics or any other component to create a unique layout.
Project Tracking Management And Workload Tracker Dashboard Clipart PDF
The following slide highlights the workload status of various projects to administer cost and timeliness. It includes KPAs such activity, workload status, total cost, task duration etc. Showcasing this set of slides titled Project Tracking Management And Workload Tracker Dashboard Clipart PDF. The topics addressed in these templates are Project Tracking Management, Workload Tracker Dashboard. All the content presented in this PPT design is completely editable. Download it and make adjustments in color, background, font etc. as per your unique business setting.
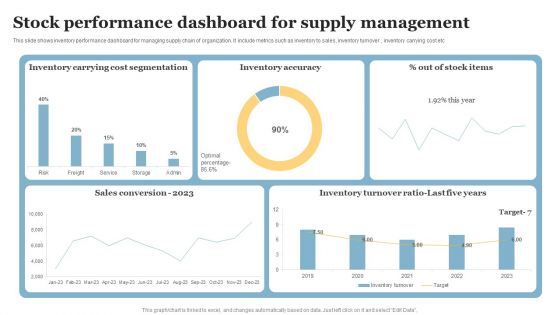
Stock Performance Dashboard For Supply Management Template PDF
This slide shows inventory performance dashboard for managing supply chain of organization. It include metrics such as inventory to sales, inventory turnover , inventory carrying cost etc. Showcasing this set of slides titled Stock Performance Dashboard For Supply Management Template PDF. The topics addressed in these templates are Inventory Carrying, Cost Segmentation, Inventory Accuracy. All the content presented in this PPT design is completely editable. Download it and make adjustments in color, background, font etc. as per your unique business setting.

Monthly Profit And Loss Statement Reports Analysis Dashboard Brochure PDF
This slide shows a monthly profit and loss statement dashboard. The constituting elements herein are total net revenue, cost of goods sold and gross profit.Pitch your topic with ease and precision using this Monthly Profit And Loss Statement Reports Analysis Dashboard Brochure PDF. This layout presents information on Costs Good Sold, Earnings Before, Interest Expense. It is also available for immediate download and adjustment. So, changes can be made in the color, design, graphics or any other component to create a unique layout.

Weekly Sales Performance KPI Dashboard For Revenue Generation Brochure PDF
The following slide exhibits dashboard to maintain revenue and management under control. It presents information related to profits, cross selling, costs, etc. Pitch your topic with ease and precision using this Weekly Sales Performance KPI Dashboard For Revenue Generation Brochure PDF. This layout presents information on Total Sales, Revenue, Profit, Cost. It is also available for immediate download and adjustment. So, changes can be made in the color, design, graphics or any other component to create a unique layout.
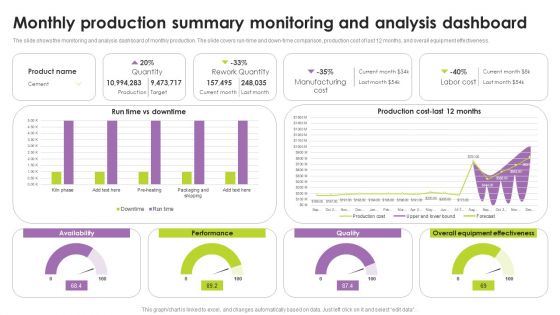
Monthly Production Summary Monitoring And Analysis Dashboard Guidelines PDF
The slide shows the monitoring and analysis dashboard of monthly production. The slide covers run-time and down time comparison, production cost of last 12 months, and overall equipment effectiveness. Showcasing this set of slides titled Monthly Production Summary Monitoring And Analysis Dashboard Guidelines PDF. The topics addressed in these templates are Availability, Rework Quantity, Manufacturing Cost. All the content presented in this PPT design is completely editable. Download it and make adjustments in color, background, font etc. as per your unique business setting.
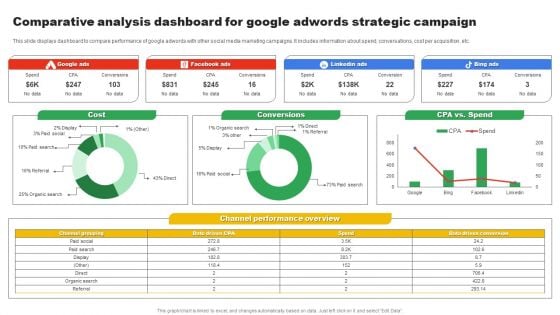
Comparative Analysis Dashboard For Google Adwords Strategic Campaign Slides PDF
This slide displays dashboard to compare performance of google adwords with other social media marketing campaigns. It includes information about spend, conversations, cost per acquisition, etc. Showcasing this set of slides titled Comparative Analysis Dashboard For Google Adwords Strategic Campaign Slides PDF. The topics addressed in these templates are Google Ads, Cost, Conversions. All the content presented in this PPT design is completely editable. Download it and make adjustments in color, background, font etc. as per your unique business setting.

Monthly Financial Metrics Dashboard With Revenue And Expenditure Rules PDF
This slide showcases KPI dashboard for monitoring financial health of business to ensure smooth flow of business operations. It includes details such as COGS, net profit, cost breakdown, etc. Showcasing this set of slides titled Monthly Financial Metrics Dashboard With Revenue And Expenditure Rules PDF. The topics addressed in these templates are Net Profit, Costs, Expenditure. All the content presented in this PPT design is completely editable. Download it and make adjustments in color, background, font etc. as per your unique business setting.
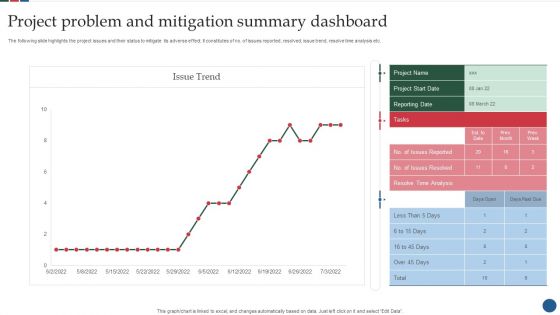
Project Problem And Mitigation Summary Dashboard Designs PDF
The following slide highlights the project issues and their status to mitigate its adverse effect. It constitutes of no. of issues reported, resolved, issue trend, resolve time analysis etc. Showcasing this set of slides titled Project Problem And Mitigation Summary Dashboard Designs PDF. The topics addressed in these templates are Analysis, Project, Mitigation Summary Dashboard. All the content presented in this PPT design is completely editable. Download it and make adjustments in color, background, font etc. as per your unique business setting.
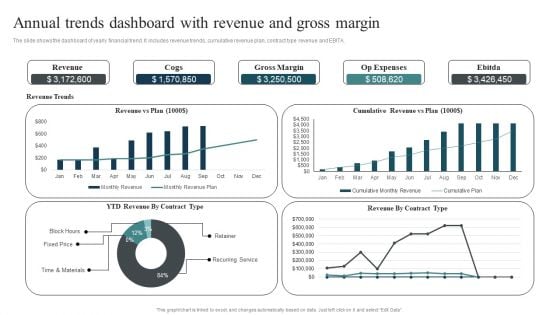
Annual Trends Dashboard With Revenue And Gross Margin Designs PDF
The slide shows the dashboard of yearly financial trend. It includes revenue trends, cumulative revenue plan, contract type revenue and EBITA. Showcasing this set of slides titled Annual Trends Dashboard With Revenue And Gross Margin Designs PDF. The topics addressed in these templates are Cumulative Revenue, Time Materials, Recurring Service. All the content presented in this PPT design is completely editable. Download it and make adjustments in color, background, font etc. as per your unique business setting.

Market Area Analysis Regional Sales Performance Metrics Dashboard Designs PDF
This slide provides the glimpse about the sales performance metrics which focuses on regional sales based on customer demands and sales team performance. Deliver and pitch your topic in the best possible manner with this market area analysis regional sales performance metrics dashboard designs pdf. Use them to share invaluable insights on regional sales performance metrics dashboard and impress your audience. This template can be altered and modified as per your expectations. So, grab it now.
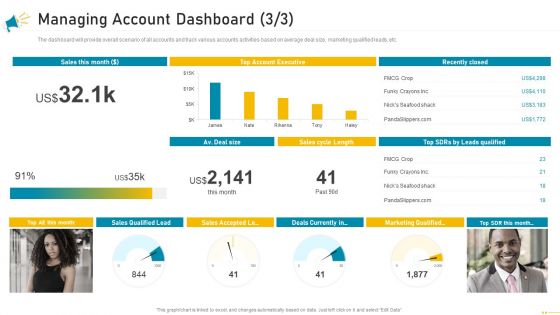
Key Account Marketing Approach Managing Account Dashboard Sales Designs PDF
The dashboard will provide overall scenario of all accounts and track various accounts activities based on average deal size, marketing qualified leads, etc. Deliver and pitch your topic in the best possible manner with this key account marketing approach managing account dashboard sales designs pdf. Use them to share invaluable insights on sales, account executive, marketing and impress your audience. This template can be altered and modified as per your expectations. So, grab it now.
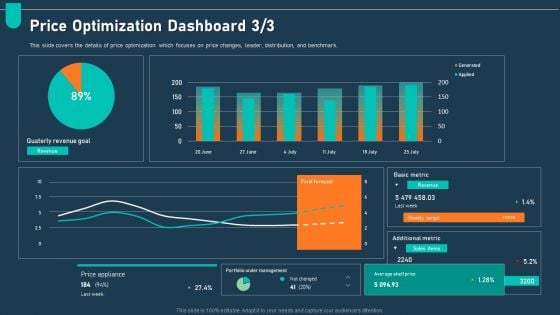
Examining Price Optimization Organization Price Optimization Dashboard Appliance Designs PDF
This slide covers the details of price optimization which focuses on price changes, leader, distribution, and benchmark. Deliver and pitch your topic in the best possible manner with this examining price optimization organization price optimization dashboard appliance designs pdf. Use them to share invaluable insights on price optimization dashboard and impress your audience. This template can be altered and modified as per your expectations. So, grab it now.
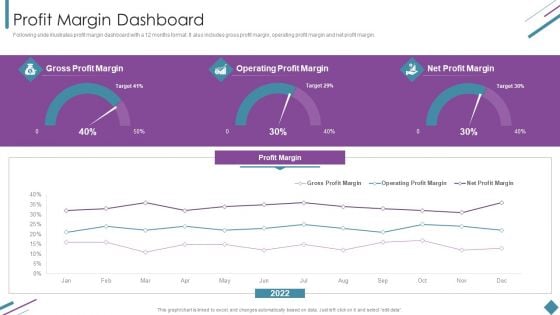
Metrics To Measure Business Performance Profit Margin Dashboard Designs PDF
Following slide illustrates profit margin dashboard with a 12 months format. It also includes gross profit margin, operating profit margin and net profit margin. Deliver and pitch your topic in the best possible manner with this Metrics To Measure Business Performance Profit Margin Dashboard Designs PDF. Use them to share invaluable insights on Gross Profit Margin, Operating Profit Margin, Net Profit Margin and impress your audience. This template can be altered and modified as per your expectations. So, grab it now.
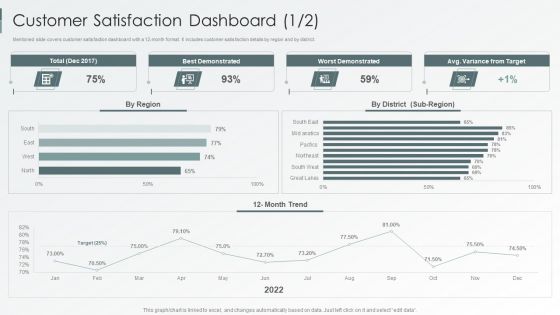
Enterprise Sustainability Performance Metrics Customer Satisfaction Dashboard Designs PDF
Mentioned slide covers customer satisfaction dashboard with a 12-month format. It includes customer satisfaction details by region and by district. Deliver an awe inspiring pitch with this creative Enterprise Sustainability Performance Metrics Customer Satisfaction Dashboard Designs PDF bundle. Topics like Best Demonstrated, Worst Demonstrated, Variance Target can be discussed with this completely editable template. It is available for immediate download depending on the needs and requirements of the user.
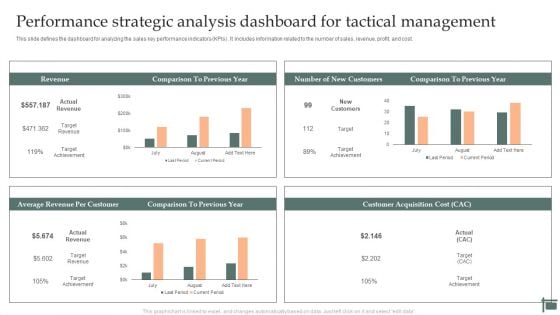
Performance Strategic Analysis Dashboard For Tactical Management Rules PDF
This slide defines the dashboard for analyzing the sales key performance indicators KPIs. It includes information related to the number of sales, revenue, profit, and cost. Showcasing this set of slides titled Performance Strategic Analysis Dashboard For Tactical Management Rules PDF. The topics addressed in these templates are Revenue, New Customers, Average Revenue, Per Customer. All the content presented in this PPT design is completely editable. Download it and make adjustments in color, background, font etc. as per your unique business setting.
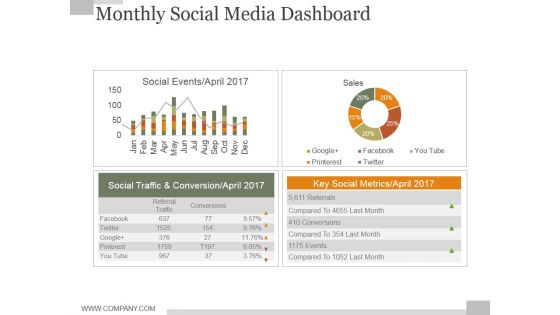
Monthly Social Media Dashboard Ppt PowerPoint Presentation Background Designs
This is a monthly social media dashboard ppt powerpoint presentation background designs. This is a four stage process. The stages in this process are business, finance, marketing, strategy, analysis, success.
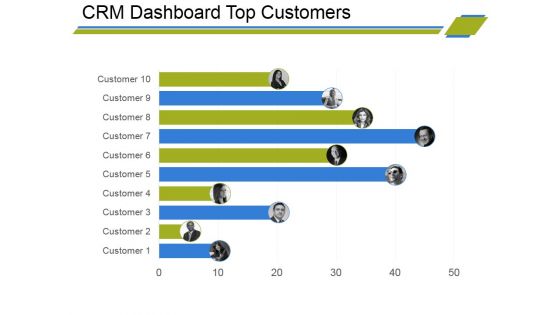
Crm Dashboard Top Customers Ppt PowerPoint Presentation Styles Designs
This is a crm dashboard top customers ppt powerpoint presentation styles designs. This is a ten stage process. The stages in this process are business, customer, finance, bar graph, marketing, strategy, analysis.
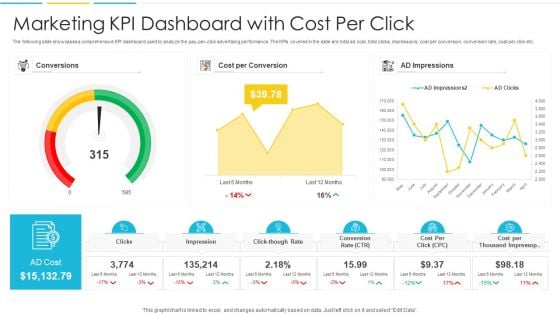
Marketing KPI Dashboard With Cost Per Click Infographics PDF
The following slide showcases a comprehensive KPI dashboard used to analyze the pay-per-click advertising performance. The KPIs covered in the slide are total ad cost, total clicks, impressions, cost per conversion, conversion rate, cost per click etc. Pitch your topic with ease and precision using this Marketing KPI Dashboard With Cost Per Click Infographics PDF. This layout presents information on Conversions, Cost, Impressions. It is also available for immediate download and adjustment. So, changes can be made in the color, design, graphics or any other component to create a unique layout.
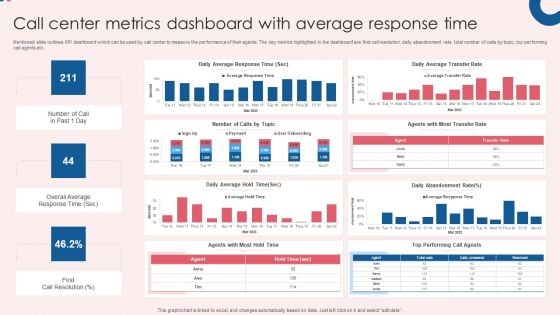
Call Center Metrics Dashboard With Average Response Time Inspiration PDF
Mentioned slide outlines KPI dashboard which can be used by call center to measure the performance of their agents. The key metrics highlighted in the dashboard are first call resolution, daily abandonment rate, total number of calls by topic, top performing call agents etc. Showcasing this set of slides titled Call Center Metrics Dashboard With Average Response Time Inspiration PDF. The topics addressed in these templates are Efficiency, Quality, Activity, Daily Average Response, Daily Average Transfer. All the content presented in this PPT design is completely editable. Download it and make adjustments in color, background, font etc. as per your unique business setting.
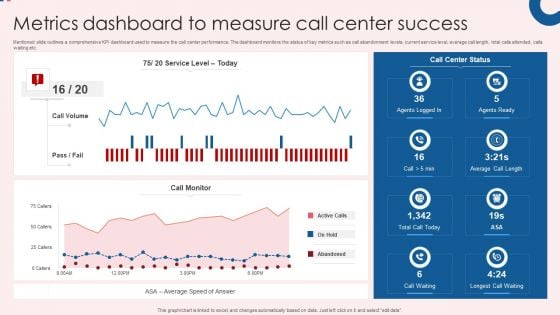
Metrics Dashboard To Measure Call Center Success Themes PDF
Mentioned slide outlines a comprehensive KPI dashboard used to measure the call center performance. The dashboard monitors the status of key metrics such as call abandonment levels, current service level, average call length, total calls attended, calls waiting etc. Showcasing this set of slides titled Metrics Dashboard To Measure Call Center Success Themes PDF. The topics addressed in these templates are Center Success, Call Center Status, Call Monitor. All the content presented in this PPT design is completely editable. Download it and make adjustments in color, background, font etc. as per your unique business setting.
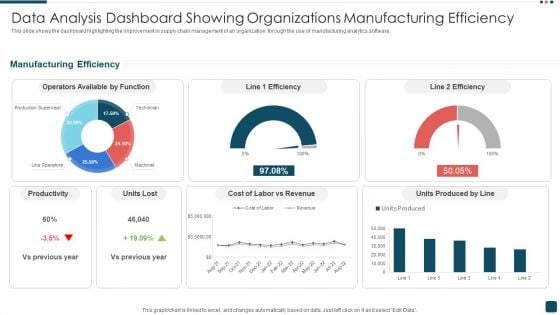
Data Analysis Dashboard Showing Organizations Manufacturing Efficiency Demonstration PDF
This slide shows the dashboard highlighting the improvement in supply chain management of an organization through the use of manufacturing analytics software. Pitch your topic with ease and precision using this Data Analysis Dashboard Showing Organizations Manufacturing Efficiency Demonstration PDF. This layout presents information on Productivity, Revenue, Manufacturing Efficiency. It is also available for immediate download and adjustment. So, changes can be made in the color, design, graphics or any other component to create a unique layout.
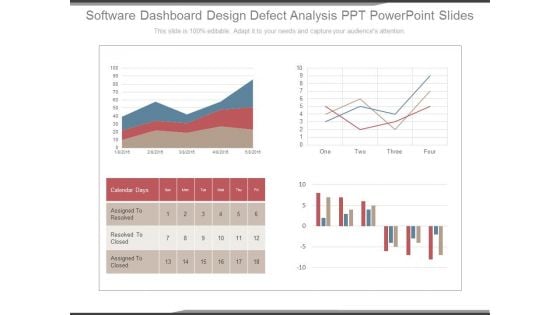
Software Dashboard Design Defect Analysis Ppt Powerpoint Slides
This is a software dashboard design defect analysis ppt powerpoint slides. This is a four stage process. The stages in this process are calendar days, assigned to resolved, resolved to closed, assigned to closed.
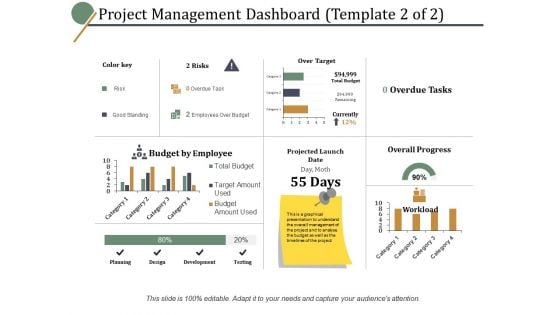
Project Management Dashboard Planning Ppt PowerPoint Presentation Ideas Graphics Design
This is a project management dashboard planning ppt powerpoint presentation ideas graphics design. This is a four stage process. The stages in this process are business, management, marketing, percentage.
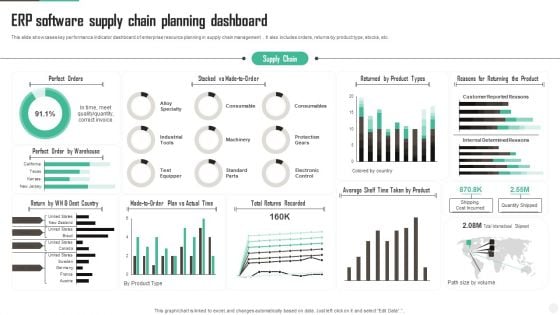
ERP Software Supply Chain Planning Dashboard Diagrams PDF
This slide showcases key performance indicator dashboard of enterprise resource planning in supply chain management . It also includes orders, returns by product type, stocks, etc. Showcasing this set of slides titled ERP Software Supply Chain Planning Dashboard Diagrams PDF Sample. The topics addressed in these templates are Perfect Orders, Dest Country, Actual Time. All the content presented in this PPT design is completely editable. Download it and make adjustments in color, background, font etc. as per your unique business setting.
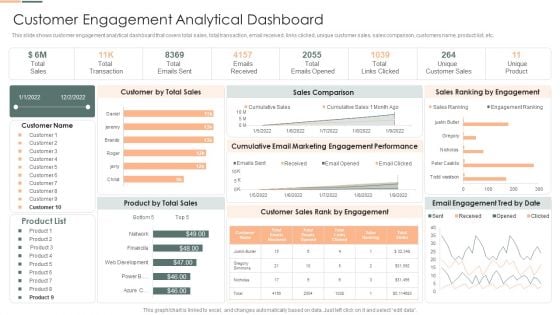
Developing Client Engagement Techniques Customer Engagement Analytical Dashboard Clipart PDF
This slide shows customer engagement analytical dashboard that covers total sales, total transaction, email received, links clicked, unique customer sales, sales comparison, customers name, product list, etc. Deliver an awe inspiring pitch with this creative Developing Client Engagement Techniques Customer Engagement Analytical Dashboard Clipart PDF bundle. Topics like Sales Comparison, Cumulative Email Marketing, Sales Ranking can be discussed with this completely editable template. It is available for immediate download depending on the needs and requirements of the user.
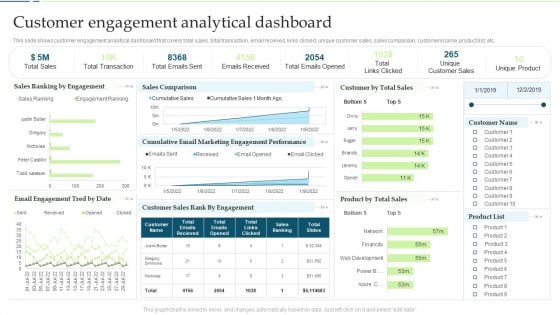
Customer Engagement And Experience Customer Engagement Analytical Dashboard Slides PDF
This slide shows customer engagement analytical dashboard that covers total sales, total transaction, email received, links clicked, unique customer sales, sales comparison, customers name, product list, etc.Deliver an awe inspiring pitch with this creative Customer Engagement And Experience Customer Engagement Analytical Dashboard Slides PDF bundle. Topics like Total Transaction, Emails Received, Unique Customer can be discussed with this completely editable template. It is available for immediate download depending on the needs and requirements of the user.
Cost And Purchase Order Procurement Dashboard Icons PDF
This slide provides an overview of the cost and purchase order-related performance indicators to improve efficiency and optimize processes. The dashboard includes the cost of the purchase order, cost reduction, savings, procurement ROI and top 5 suppliers. If you are looking for a format to display your unique thoughts, then the professionally designed Cost And Purchase Order Procurement Dashboard Icons PDF is the one for you. You can use it as a Google Slides template or a PowerPoint template. Incorporate impressive visuals, symbols, images, and other charts. Modify or reorganize the text boxes as you desire. Experiment with shade schemes and font pairings. Alter, share or cooperate with other people on your work. Download Cost And Purchase Order Procurement Dashboard Icons PDF and find out how to give a successful presentation. Present a perfect display to your team and make your presentation unforgettable.
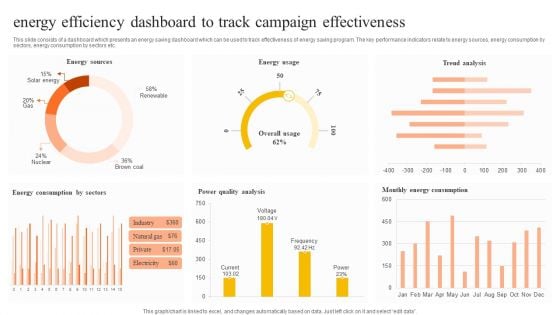
Energy Efficiency Dashboard To Track Campaign Effectiveness Pictures PDF
This slide consists of a dashboard which presents an energy saving dashboard which can be used to track effectiveness of energy saving program. The key performance indicators relate to energy sources, energy consumption by sectors, energy consumption by sectors etc. Pitch your topic with ease and precision using this Energy Efficiency Dashboard To Track Campaign Effectiveness Pictures PDF. This layout presents information on Energy Sources, Energy Usage, Trend Analysis. It is also available for immediate download and adjustment. So, changes can be made in the color, design, graphics or any other component to create a unique layout.
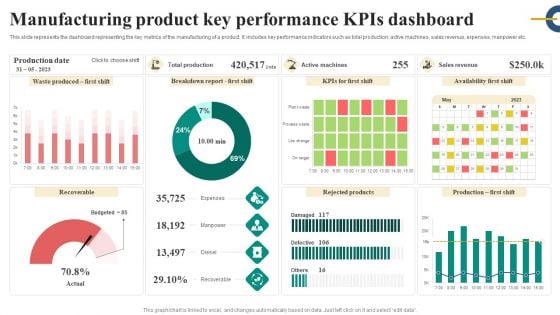
Manufacturing Product Key Performance Kpis Dashboard Inspiration PDF
This slide represents the dashboard representing the key metrics of the manufacturing of a product. It includes key performance indicators such as total production, active machines, sales revenue, expenses, manpower etc. Showcasing this set of slides titled Manufacturing Product Key Performance Kpis Dashboard Inspiration PDF. The topics addressed in these templates are Expenses, Manpower, Diesel, Recoverable. All the content presented in this PPT design is completely editable. Download it and make adjustments in color, background, font etc. as per your unique business setting.
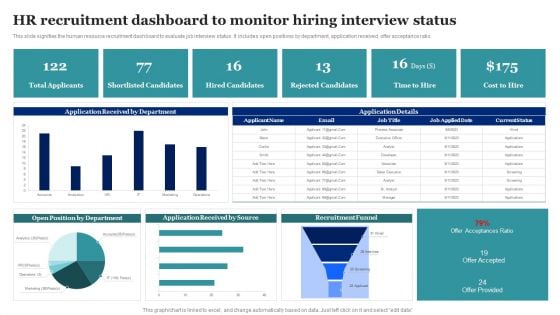
HR Recruitment Dashboard To Monitor Hiring Interview Status Ideas PDF
This slide signifies the human resource recruitment dashboard to evaluate job interview status. It includes open positions by department, application received, offer acceptance ratio. Showcasing this set of slides titled HR Recruitment Dashboard To Monitor Hiring Interview Status Ideas PDF. The topics addressed in these templates are Application Received Department, Total Applicants, Shortlisted Candidates, Hired Candidates. All the content presented in this PPT design is completely editable. Download it and make adjustments in color, background, font etc. as per your unique business setting.
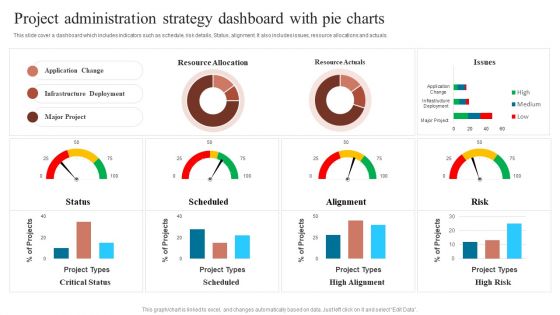
Project Administration Strategy Dashboard With Pie Charts Sample PDF
This slide cover a dashboard which includes indicators such as schedule, risk details, Status, alignment. It also includes issues, resource allocations and actuals. Pitch your topic with ease and precision using this Project Administration Strategy Dashboard With Pie Charts Sample PDF. This layout presents information on Communication Goal, Communication Tool, Increase Revenue. It is also available for immediate download and adjustment. So, changes can be made in the color, design, graphics or any other component to create a unique layout.
Project Implementation Tactics Dashboard For Performance Tracking Demonstration PDF
The following slide presents dashboard which establishes means to execute , monitor and control projects effectively. It includes information about different quarters and work percentage. Showcasing this set of slides titled Project Implementation Tactics Dashboard For Performance Tracking Demonstration PDF. The topics addressed in these templates are Resource Plan, System Testing, Performance Tracking. All the content presented in this PPT design is completely editable. Download it and make adjustments in color, background, font etc. as per your unique business setting.
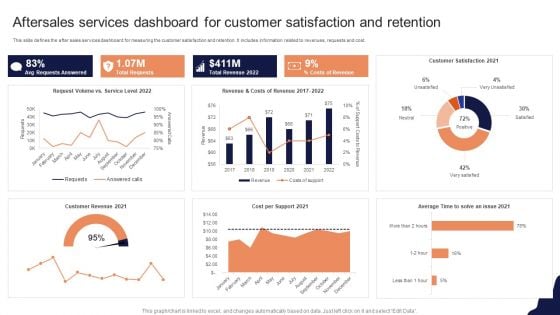
Aftersales Services Dashboard For Customer Satisfaction And Retention Template PDF
This slide defines the after sales services dashboard for measuring the customer satisfaction and retention. It includes information related to revenues, requests and cost.Showcasing this set of slides titled Aftersales Services Dashboard For Customer Satisfaction And Retention Template PDF The topics addressed in these templates are Requests Answered, Total Requests, Customer Satisfaction All the content presented in this PPT design is completely editable. Download it and make adjustments in color, background, font etc. as per your unique business setting.
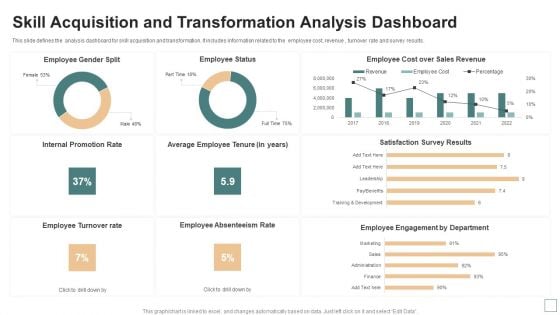
Skill Acquisition And Transformation Analysis Dashboard Themes PDF
This slide defines the analysis dashboard for skill acquisition and transformation. It includes information related to the employee cost, revenue , turnover rate and survey results. Showcasing this set of slides titled Skill Acquisition And Transformation Analysis Dashboard Themes PDF. The topics addressed in these templates are Internal Promotion Rate, Employee Turnover Rate, Average Employee Tenure. All the content presented in this PPT design is completely editable. Download it and make adjustments in color, background, font etc. as per your unique business setting.
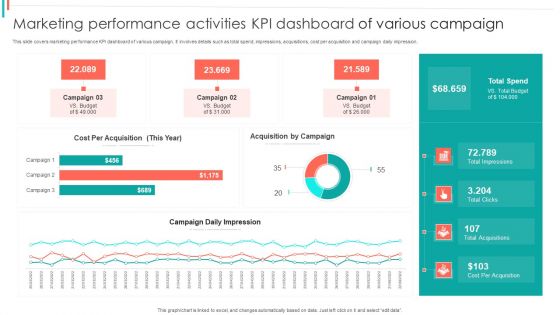
Marketing Performance Activities KPI Dashboard Of Various Campaign Microsoft PDF
This slide covers marketing performance KPI dashboard of various campaign. It involves details such as total spend, impressions, acquisitions, cost per acquisition and campaign daily impression.Showcasing this set of slides titled Marketing Performance Activities KPI Dashboard Of Various Campaign Microsoft PDF. The topics addressed in these templates are Acquisition Campaign, Campaign Impression, Total Impressions. All the content presented in this PPT design is completely editable. Download it and make adjustments in color, background, font etc. as per your unique business setting.
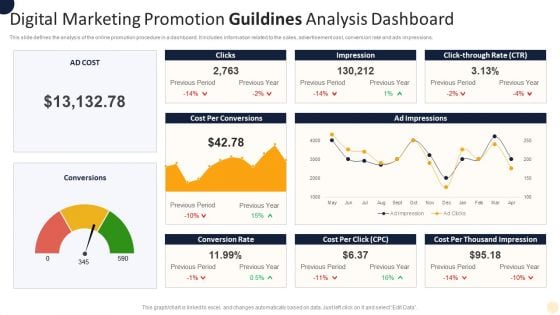
Digital Marketing Promotion Guildines Analysis Dashboard Rules PDF
This slide defines the analysis of the online promotion procedure in a dashboard. It includes information related to the sales, advertisement cost, conversion rate and ads impressions. Showcasing this set of slides titled Digital Marketing Promotion Guildines Analysis Dashboard Rules PDF. The topics addressed in these templates are Impression, Conversion Rate, Thousand Impression. All the content presented in this PPT design is completely editable. Download it and make adjustments in color, background, font etc. as per your unique business setting.
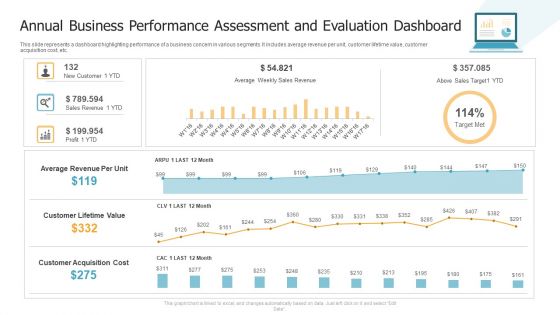
Annual Business Performance Assessment And Evaluation Dashboard Brochure PDF
This slide represents a dashboard highlighting performance of a business concern in various segments. It includes average revenue per unit, customer lifetime value, customer acquisition cost, etc. Showcasing this set of slides titled Annual Business Performance Assessment And Evaluation Dashboard Brochure PDF. The topics addressed in these templates are Profit, Sales Revenue, New Customer. All the content presented in this PPT design is completely editable. Download it and make adjustments in color, background, font etc. as per your unique business setting.
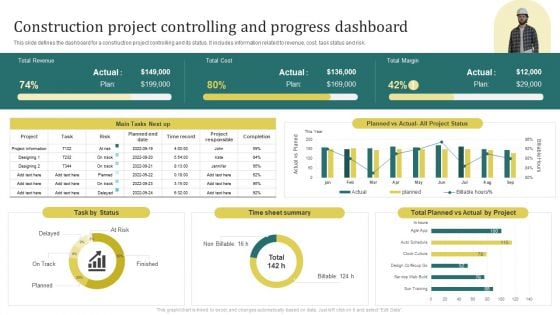
Construction Project Controlling And Progress Dashboard Slides PDF
This slide defines the dashboard for a construction project controlling and its status. It includes information related to revenue, cost, task status and risk.Showcasing this set of slides titled Construction Project Controlling And Progress Dashboard Slides PDF. The topics addressed in these templates are Time Sheet Summary, Project Responsible, Total Planned. All the content presented in this PPT design is completely editable. Download it and make adjustments in color, background, font etc. as per your unique business setting.
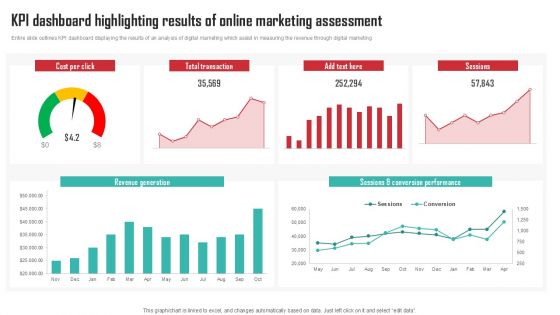
KPI Dashboard Highlighting Results Of Online Marketing Assessment Background PDF
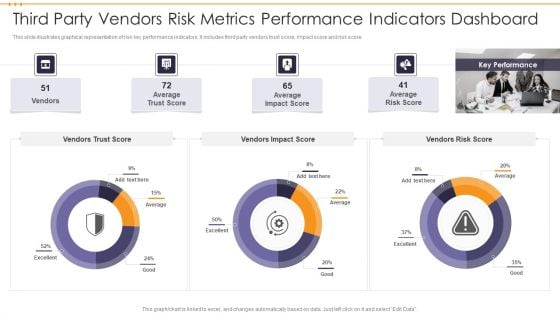
Third Party Vendors Risk Metrics Performance Indicators Dashboard Topics PDF
This slide illustrates graphical representation of risk key performance indicators. It includes third party vendors trust score, impact score and risk score. Pitch your topic with ease and precision using this Third Party Vendors Risk Metrics Performance Indicators Dashboard Topics PDF. This layout presents information on Third Party Vendors Risk Metrics Performance Indicators Dashboard. It is also available for immediate download and adjustment. So, changes can be made in the color, design, graphics or any other component to create a unique layout.
Dashboard Analysis For Tracking Agricultural Tasks Adopting Sustainable Farming Techniques
This slide showcases the KPIs that would help to track the improvements with adoption of new sustainable agriculture practices. It includes current tasks, crops, harvest, todays weather, summary, etc. Take your projects to the next level with our ultimate collection of Dashboard Analysis For Tracking Agricultural Tasks Adopting Sustainable Farming Techniques. Slidegeeks has designed a range of layouts that are perfect for representing task or activity duration, keeping track of all your deadlines at a glance. Tailor these designs to your exact needs and give them a truly corporate look with your own brand colors they will make your projects stand out from the rest This slide showcases the KPIs that would help to track the improvements with adoption of new sustainable agriculture practices. It includes current tasks, crops, harvest, todays weather, summary, etc.
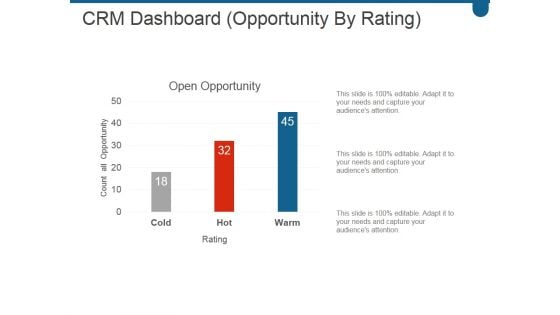
Crm Dashboard Opportunity By Rating Ppt PowerPoint Presentation Model
This is a crm dashboard opportunity by rating ppt powerpoint presentation model. This is a three stage process. The stages in this process are open opportunity, cold, hot, warm.
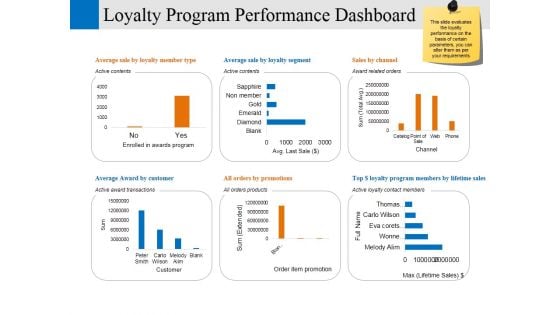
Loyalty Program Performance Dashboard Ppt PowerPoint Presentation Professional Model
This is a loyalty program performance dashboard ppt powerpoint presentation professional model. This is a six stage process. The stages in this process are enrolled in awards program, customer, order item promotion, channel, business.
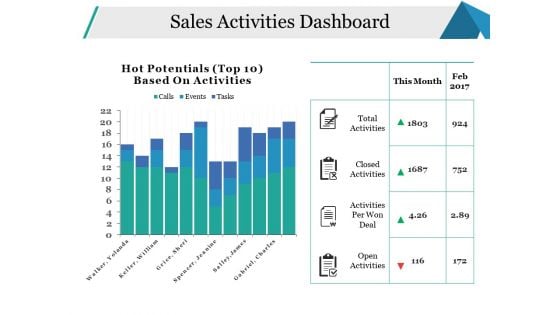
Sales Activities Dashboard Ppt PowerPoint Presentation Pictures Model
This is a sales activities dashboard ppt powerpoint presentation pictures model. This is a two stage process. The stages in this process are open activities, activities per won deal, closed activities, total activities, business.
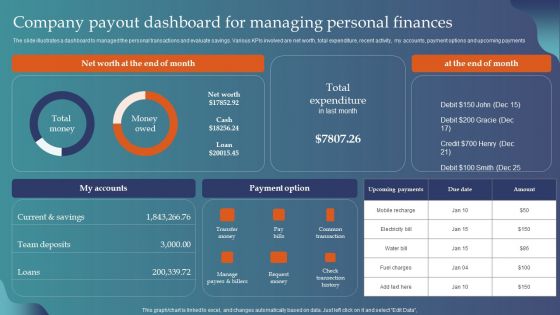
Company Payout Dashboard For Managing Personal Finances Brochure PDF
The slide illustrates a dashboard to managed the personal transactions and evaluate savings. Various KPIs involved are net worth, total expenditure, recent activity, my accounts, payment options and upcoming payments. Showcasing this set of slides titled Company Payout Dashboard For Managing Personal Finances Brochure PDF. The topics addressed in these templates are Net Worth, Total Expenditure, My Accounts, Payment Option. All the content presented in this PPT design is completely editable. Download it and make adjustments in color, background, font etc. as per your unique business setting.
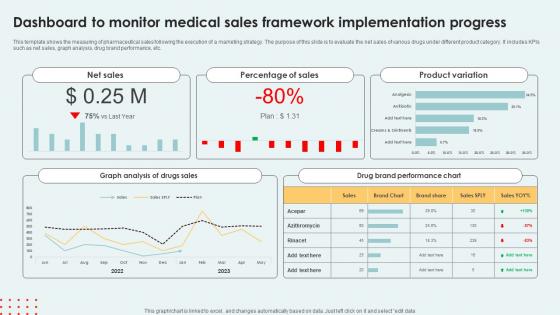
Dashboard To Monitor Medical Sales Framework Implementation Progress Formats Pdf
This template shows the measuring of pharmaceutical sales following the execution of a marketing strategy. The purpose of this slide is to evaluate the net sales of various drugs under different product category. It includes KPIs such as net sales, graph analysis, drug brand performance, etc. Showcasing this set of slides titled Dashboard To Monitor Medical Sales Framework Implementation Progress Formats Pdf The topics addressed in these templates are Percentage Sales, Product Variation, Brand Performance Chart All the content presented in this PPT design is completely editable. Download it and make adjustments in color, background, font etc. as per your unique business setting. This template shows the measuring of pharmaceutical sales following the execution of a marketing strategy. The purpose of this slide is to evaluate the net sales of various drugs under different product category. It includes KPIs such as net sales, graph analysis, drug brand performance, etc.
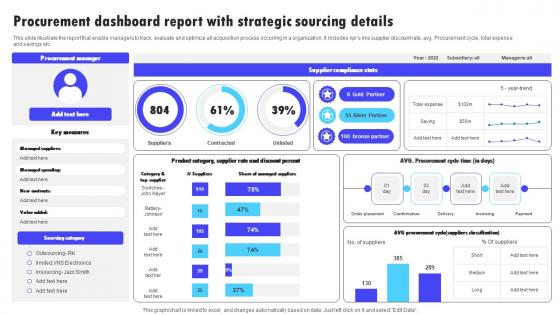
Procurement Dashboard Report With Strategic Sourcing Details Information Pdf
This slide illustrate the report that enable managers to track, evaluate and optimize all acquisition process occurring in a organization. It includes kpis like supplier discount rate, avg. Procurement cycle, total expense and savings etc. Pitch your topic with ease and precision using this Procurement Dashboard Report With Strategic Sourcing Details Information Pdf. This layout presents information on Supplier Compliance Stats, Procurement Manager, Sourcing Category. It is also available for immediate download and adjustment. So, changes can be made in the color, design, graphics or any other component to create a unique layout. This slide illustrate the report that enable managers to track, evaluate and optimize all acquisition process occurring in a organization. It includes kpis like supplier discount rate, avg. Procurement cycle, total expense and savings etc.
Dashboard Analysis For Tracking Enhancing Productivity With Adoption PPT Presentation
This slide showcases the KPIs that would help to track the improvements with adoption of new sustainable agriculture practices. It includes current tasks, crops, harvest, todays weather, summary, etc. This Dashboard Analysis For Tracking Enhancing Productivity With Adoption PPT Presentation from Slidegeeks makes it easy to present information on your topic with precision. It provides customization options, so you can make changes to the colors, design, graphics, or any other component to create a unique layout. It is also available for immediate download, so you can begin using it right away. Slidegeeks has done good research to ensure that you have everything you need to make your presentation stand out. Make a name out there for a brilliant performance. This slide showcases the KPIs that would help to track the improvements with adoption of new sustainable agriculture practices. It includes current tasks, crops, harvest, todays weather, summary, etc.
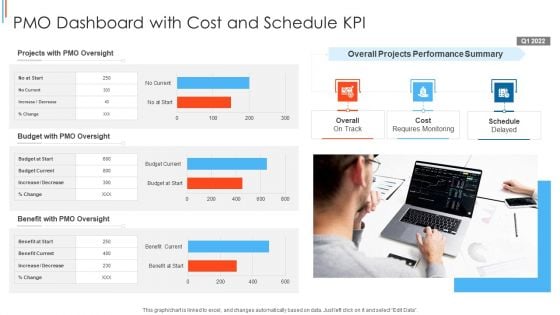
PMO Dashboard With Cost And Schedule KPI Template PDF
Showcasing this set of slides titled PMO Dashboard With Cost And Schedule KPI Themes PDF The topics addressed in these templates are Projects With Pmo Oversight, Budget With Pmo Oversight, Benefit With Pmo Oversight All the content presented in this PPT design is completely editable. Download it and make adjustments in color, background, font etc. as per your unique business setting.
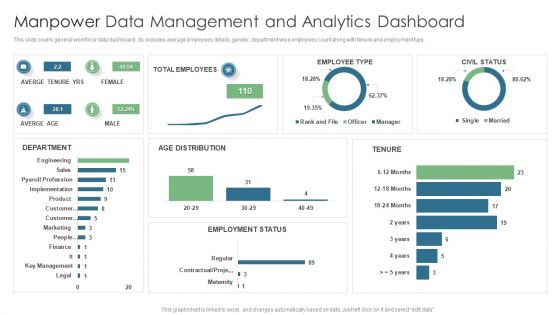
Manpower Data Management And Analytics Dashboard Topics PDF
This slide covers general workforce data dashboard . Its includes average employees details, gender, department wise employees count along with tenure and employment type. Pitch your topic with ease and precision using this Manpower Data Management And Analytics Dashboard Topics PDF. This layout presents information on Total Employees, Averge Tenure Yrs, Employee Type. It is also available for immediate download and adjustment. So, changes can be made in the color, design, graphics or any other component to create a unique layout.

Property Dealer Sales Dashboard By Power BI Ppt Presentation SS
The following slide showcases figures highlighting sustainability plans taken by corporates. It provides information about competitors, energy reduction, waste management, operations, employee retention, etc. Do you know about Slidesgeeks Property Dealer Sales Dashboard By Power BI Ppt Presentation SS These are perfect for delivering any kind od presentation. Using it, create PowerPoint presentations that communicate your ideas and engage audiences. Save time and effort by using our pre-designed presentation templates that are perfect for a wide range of topic. Our vast selection of designs covers a range of styles, from creative to business, and are all highly customizable and easy to edit. Download as a PowerPoint template or use them as Google Slides themes. The following slide showcases figures highlighting sustainability plans taken by corporates. It provides information about competitors, energy reduction, waste management, operations, employee retention, etc.
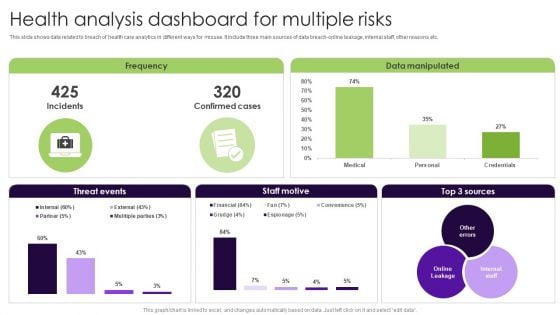
Health Analysis Dashboard For Multiple Risks Elements PDF
This slide shows data related to breach of health care analytics in different ways for misuse. It include three main sources of data breach-online leakage, internal staff, other reasons etc. Showcasing this set of slides titled Health Analysis Dashboard For Multiple Risks Elements PDF. The topics addressed in these templates are Health Analysis Dashboard, Multiple Risks. All the content presented in this PPT design is completely editable. Download it and make adjustments in color, background, font etc. as per your unique business setting.
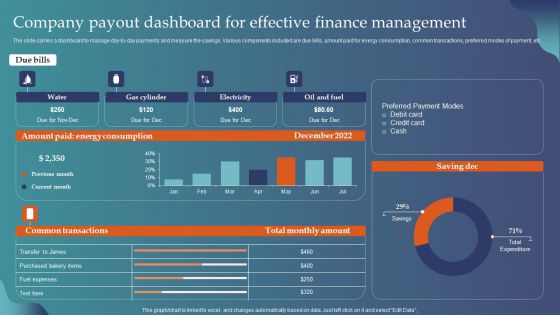
Company Payout Dashboard For Effective Finance Management Introduction PDF
The slide carries a dashboard to manage day-to-day payments and measure the savings. Various components included are due bills, amount paid for energy consumption, common transactions, preferred modes of payment, etc. Pitch your topic with ease and precision using this Company Payout Dashboard For Effective Finance Management Introduction PDF. This layout presents information on Electricity, Oil And Fuel, Gas Cylinder. It is also available for immediate download and adjustment. So, changes can be made in the color, design, graphics or any other component to create a unique layout.
Web Access Control Solution Secure Web Gateway Performance Tracking Dashboard
This slide represents a dashboard to maintain the record of various functions of Secure Web Gateway. The main components are top blocked web malware, web usage trend, top web application categories, risky web isolations, etc. Get a simple yet stunning designed Web Access Control Solution Secure Web Gateway Performance Tracking Dashboard. It is the best one to establish the tone in your meetings. It is an excellent way to make your presentations highly effective. So, download this PPT today from Slidegeeks and see the positive impacts. Our easy-to-edit Web Access Control Solution Secure Web Gateway Performance Tracking Dashboard can be your go-to option for all upcoming conferences and meetings. So, what are you waiting for Grab this template today. This slide represents a dashboard to maintain the record of various functions of Secure Web Gateway. The main components are top blocked web malware, web usage trend, top web application categories, risky web isolations, etc.
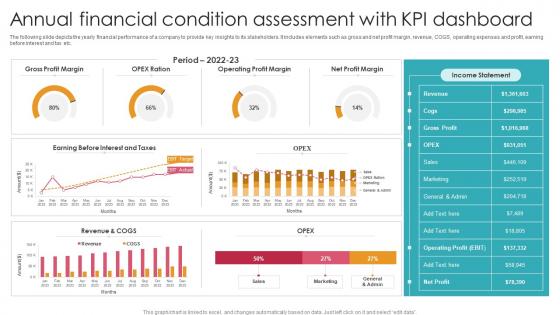
Annual Financial Condition Assessment With KPI Dashboard Ideas Pdf
The following slide depicts the yearly financial performance of a company to provide key insights to its stakeholders. It includes elements such as gross and net profit margin, revenue, COGS, operating expenses and profit, earning before interest and tax etc. Showcasing this set of slides titled Annual Financial Condition Assessment With KPI Dashboard Ideas Pdf. The topics addressed in these templates are Gross Profit Margin, Operating Profit Margin, Net Profit Margin. All the content presented in this PPT design is completely editable. Download it and make adjustments in color, background, font etc. as per your unique business setting. The following slide depicts the yearly financial performance of a company to provide key insights to its stakeholders. It includes elements such as gross and net profit margin, revenue, COGS, operating expenses and profit, earning before interest and tax etc.
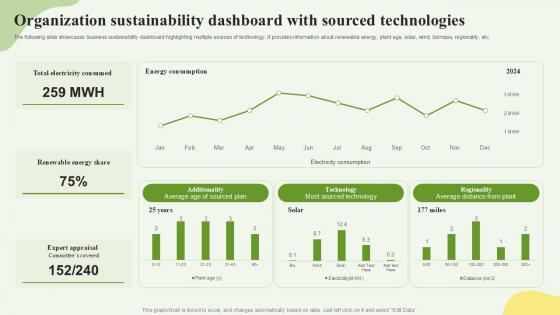
Organization Sustainability Dashboard With Sourced Technologies Ppt Example SS
The following slide showcases techniques to bring sustainability in startups. It provides information about sustainable solutions, eco point, electric vehicles, ozone generator, etc. Retrieve professionally designed Organization Sustainability Dashboard With Sourced Technologies Ppt Example SS to effectively convey your message and captivate your listeners. Save time by selecting pre-made slideshows that are appropriate for various topics, from business to educational purposes. These themes come in many different styles, from creative to corporate, and all of them are easily adjustable and can be edited quickly. Access them as PowerPoint templates or as Google Slides themes. You do not have to go on a hunt for the perfect presentation because Slidegeeks got you covered from everywhere. The following slide showcases techniques to bring sustainability in startups. It provides information about sustainable solutions, eco point, electric vehicles, ozone generator, etc.
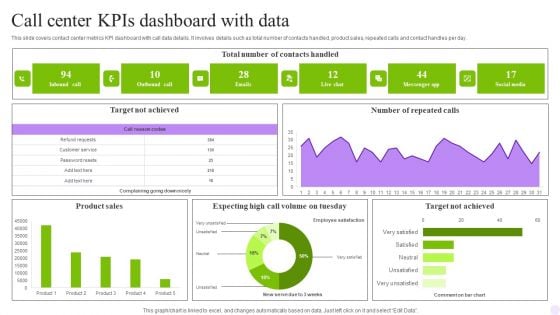
Call Center Kpis Dashboard With Data Graphics PDF
This slide covers contact center team performance metrics KPI dashboard. It involves details such as resolutions, response time, call data management and daily response time. Showcasing this set of slides titled Call Center Kpis Dashboard With Data Graphics PDF. The topics addressed in these templates are Response Time, Data Management, Resolution Rate. All the content presented in this PPT design is completely editable. Download it and make adjustments in color, background, font etc. as per your unique business setting.


 Continue with Email

 Home
Home


