Investment Portfolio Dashboard
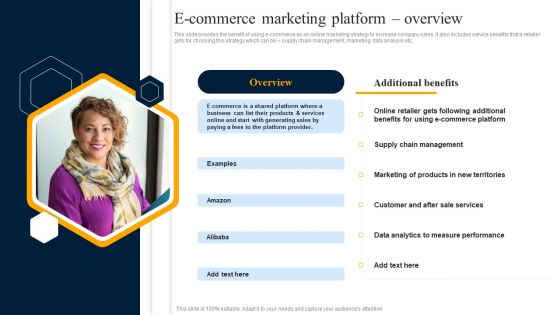
Customer Engagement Methods For Online Platforms E Commerce Marketing Platform Overview Information PDF
This slide provides the benefit of using e commerce as an online marketing strategy to increase company sales. It also includes service benefits that a retailer gets for choosing this strategy which can be supply chain management, marketing, data analysis etc. This Customer Engagement Methods For Online Platforms E Commerce Marketing Platform Overview Information PDF from Slidegeeks makes it easy to present information on your topic with precision. It provides customization options, so you can make changes to the colors, design, graphics, or any other component to create a unique layout. It is also available for immediate download, so you can begin using it right away. Slidegeeks has done good research to ensure that you have everything you need to make your presentation stand out. Make a name out there for a brilliant performance.

Quantitative Data Analysis Ppt PowerPoint Presentation Complete Deck With Slides
Boost your confidence and team morale with this well-structured Quantitative Data Analysis Ppt PowerPoint Presentation Complete Deck With Slides. This prefabricated set gives a voice to your presentation because of its well-researched content and graphics. Our experts have added all the components very carefully, thus helping you deliver great presentations with a single click. Not only that, it contains a set of seventeen slides that are designed using the right visuals, graphics, etc. Various topics can be discussed, and effective brainstorming sessions can be conducted using the wide variety of slides added in this complete deck. Apart from this, our PPT design contains clear instructions to help you restructure your presentations and create multiple variations. The color, format, design anything can be modified as deemed fit by the user. Not only this, it is available for immediate download. So, grab it now.

Multiple AML Technology Integration Challenges Mapping Out The Anti Money Fin SS V
The following slide presents various challenges faced during AML and technology integration that hinders the operational process. The different challenges are data security concerns, integrity complexity, cost constraints, and regulatory challenges. Do you know about Slidesgeeks Multiple AML Technology Integration Challenges Mapping Out The Anti Money Fin SS V These are perfect for delivering any kind od presentation. Using it, create PowerPoint presentations that communicate your ideas and engage audiences. Save time and effort by using our pre-designed presentation templates that are perfect for a wide range of topic. Our vast selection of designs covers a range of styles, from creative to business, and are all highly customizable and easy to edit. Download as a PowerPoint template or use them as Google Slides themes. The following slide presents various challenges faced during AML and technology integration that hinders the operational process. The different challenges are data security concerns, integrity complexity, cost constraints, and regulatory challenges.
Data Expansion Trends For Global Home Ware Market Icons PDF
This slide shows data growth trends for home ware industry that presents incremental growth, CAGR and other figures etc. It include figure next year growth and incremental growth etc. Pitch your topic with ease and precision using this Data Expansion Trends For Global Home Ware Market Icons PDF. This layout presents information on Incremental Growth Figures, Growth Rate Predicted, Fragmented Market Model. It is also available for immediate download and adjustment. So, changes can be made in the color, design, graphics or any other component to create a unique layout.
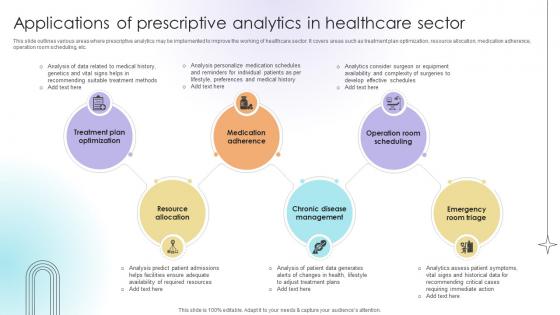
Applications Of Prescriptive Analytics In Healthcare Sector Data Analytics SS V
This slide outlines various areas where prescriptive analytics may be implemented to improve the working of healthcare sector. It covers areas such as treatment plan optimization, resource allocation, medication adherence, operation room scheduling, etc.Slidegeeks is here to make your presentations a breeze with Applications Of Prescriptive Analytics In Healthcare Sector Data Analytics SS V With our easy-to-use and customizable templates, you can focus on delivering your ideas rather than worrying about formatting. With a variety of designs to choose from, you are sure to find one that suits your needs. And with animations and unique photos, illustrations, and fonts, you can make your presentation pop. So whether you are giving a sales pitch or presenting to the board, make sure to check out Slidegeeks first This slide outlines various areas where prescriptive analytics may be implemented to improve the working of healthcare sector. It covers areas such as treatment plan optimization, resource allocation, medication adherence, operation room scheduling, etc.
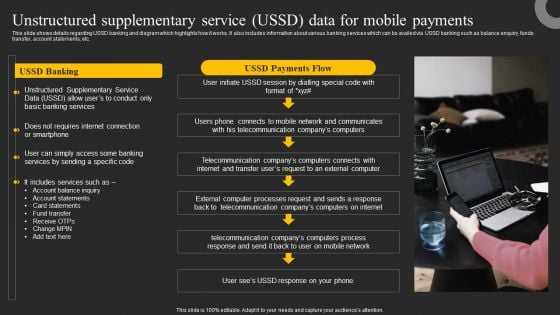
Unstructured Supplementary Service USSD Data For Mobile Payments Ppt Slides Show PDF
This slide shows details regarding USSD banking and diagram which highlights how it works. It also includes information about various banking services which can be availed via USSD banking such as balance enquiry, funds transfer, account statements, etc. The Unstructured Supplementary Service USSD Data For Mobile Payments Ppt Slides Show PDF is a compilation of the most recent design trends as a series of slides. It is suitable for any subject or industry presentation, containing attractive visuals and photo spots for businesses to clearly express their messages. This template contains a variety of slides for the user to input data, such as structures to contrast two elements, bullet points, and slides for written information. Slidegeeks is prepared to create an impression.
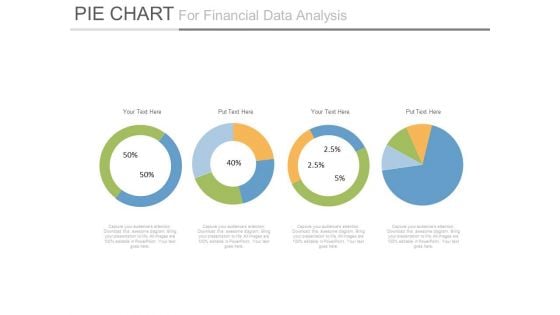
Pie Charts For Financial Ratio Analysis Powerpoint Slides
This PowerPoint template has been designed with diagram of pie charts. This PPT slide can be used to prepare presentations for profit growth report and also for financial data analysis. You can download finance PowerPoint template to prepare awesome presentations.
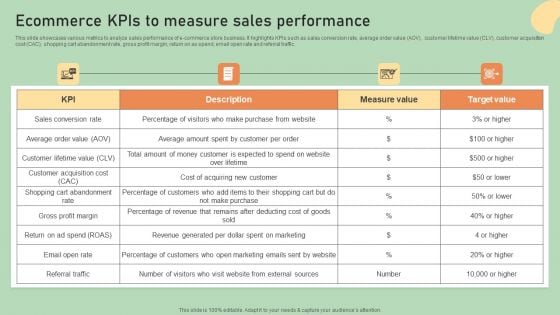
E Commerce Business Development Plan Ecommerce Kpis To Measure Sales Performance Structure PDF
This slide showcases various metrics to analyze sales performance of e-commerce store business. It highlights KPIs such as sales conversion rate, average order value AOV, customer lifetime value CLV, customer acquisition cost CAC, shopping cart abandonment rate, gross profit margin, return on as spend, email open rate and referral traffic. Retrieve professionally designed E Commerce Business Development Plan Ecommerce Kpis To Measure Sales Performance Structure PDF to effectively convey your message and captivate your listeners. Save time by selecting pre-made slideshows that are appropriate for various topics, from business to educational purposes. These themes come in many different styles, from creative to corporate, and all of them are easily adjustable and can be edited quickly. Access them as PowerPoint templates or as Google Slides themes. You do not have to go on a hunt for the perfect presentation because Slidegeeks got you covered from everywhere.
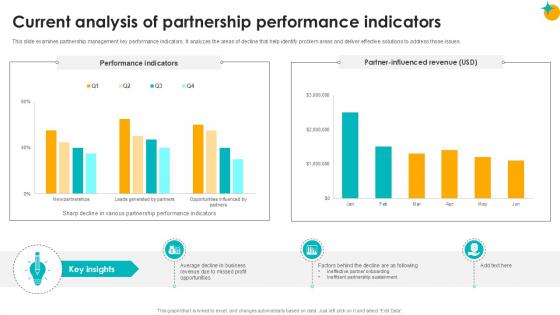
Current Analysis Of Partnership Performance Partner Relationship Ppt Template
This slide examines partnership management key performance indicators. It analyzes the areas of decline that help identify problem areas and deliver effective solutions to address those issues. Create an editable Current Analysis Of Partnership Performance Partner Relationship Ppt Template that communicates your idea and engages your audience. Whether you are presenting a business or an educational presentation, pre-designed presentation templates help save time. Current Analysis Of Partnership Performance Partner Relationship Ppt Template is highly customizable and very easy to edit, covering many different styles from creative to business presentations. Slidegeeks has creative team members who have crafted amazing templates. So, go and get them without any delay. This slide examines partnership management key performance indicators. It analyzes the areas of decline that help identify problem areas and deliver effective solutions to address those issues.
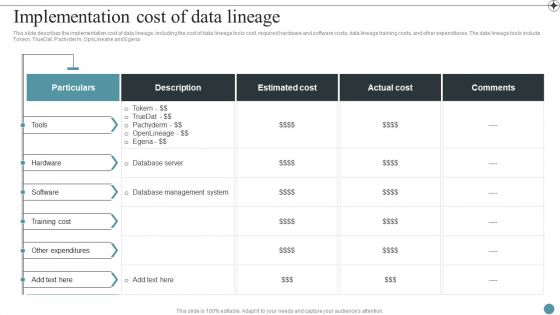
Implementation Cost Of Data Lineage Deploying Data Lineage IT Brochure PDF
This slide describes the implementation cost of data lineage, including the cost of data lineage tools cost, required hardware and software costs, data lineage training costs, and other expenditures. The data lineage tools include Tokern, TrueDat, Pachyderm, OpnLineahe and Egeria. The Implementation Cost Of Data Lineage Deploying Data Lineage IT Brochure PDF is a compilation of the most recent design trends as a series of slides. It is suitable for any subject or industry presentation, containing attractive visuals and photo spots for businesses to clearly express their messages. This template contains a variety of slides for the user to input data, such as structures to contrast two elements, bullet points, and slides for written information. Slidegeeks is prepared to create an impression.
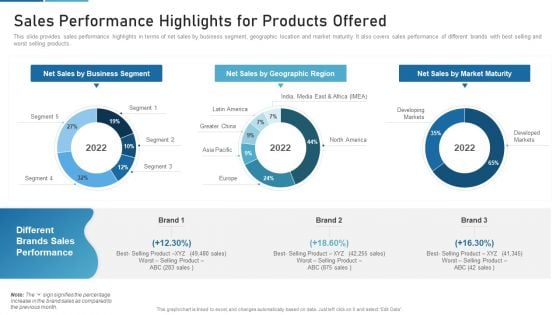
Sales Process Catalogue Template Sales Performance Highlights For Products Offered Infographics PDF
This slide provides sales performance highlights in terms of net sales by business segment, geographic location and market maturity. It also covers sales performance of different brands with best selling and worst selling products. Deliver and pitch your topic in the best possible manner with this sales process catalogue template sales performance highlights for products offered infographics pdf. Use them to share invaluable insights on net sales by business segment, net sales by geographic region, net sales by market maturity and impress your audience. This template can be altered and modified as per your expectations. So, grab it now.
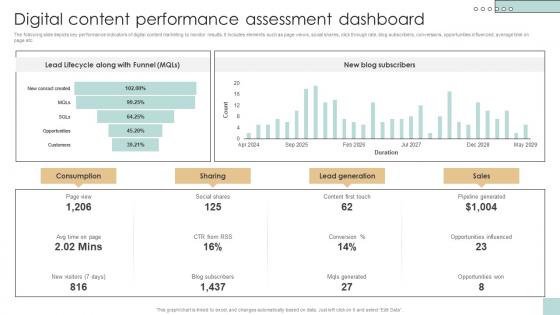
Digital Content Performance Assessment Developing And Creating Digital Content Strategy SS V
The following slide depicts key performance indicators of digital content marketing to monitor results. It includes elements such as page views, social shares, click through rate, blog subscribers, conversions, opportunities influenced, average time on page etc. If your project calls for a presentation, then Slidegeeks is your go-to partner because we have professionally designed, easy-to-edit templates that are perfect for any presentation. After downloading, you can easily edit Digital Content Performance Assessment Developing And Creating Digital Content Strategy SS V and make the changes accordingly. You can rearrange slides or fill them with different images. Check out all the handy templates The following slide depicts key performance indicators of digital content marketing to monitor results. It includes elements such as page views, social shares, click through rate, blog subscribers, conversions, opportunities influenced, average time on page etc.

Electronic Initiative For International Commerce Business Infographics PDF
This slide contains the initiatives for ecommerce business to expand globally. It includes ace, national trade platforms, skill framework, etc. Persuade your audience using this Electronic Initiative For International Commerce Business Infographics PDF. This PPT design covers three stages, thus making it a great tool to use. It also caters to a variety of topics including Secure Data, Productivity, Retail. Download this PPT design now to present a convincing pitch that not only emphasizes the topic but also showcases your presentation skills.
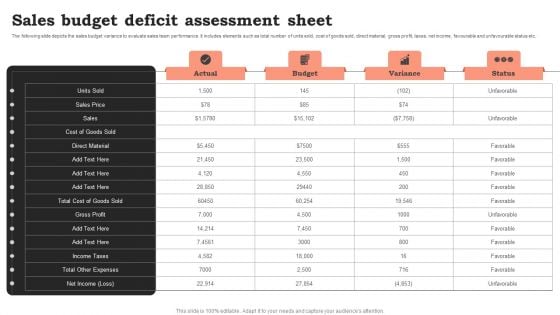
Sales Budget Deficit Assessment Sheet Infographics PDF
The following slide illustrates the process to evaluate budget variances to review actual VS projected cost. It includes elements such as collect data, assess gap, compile management report, adjusts forecast etc. Pitch your topic with ease and precision using this Sales Budget Deficit Assessment Sheet Infographics PDF. This layout presents information on Collect Data, Assess Gap, Adjusts Forecast. It is also available for immediate download and adjustment. So, changes can be made in the color, design, graphics or any other component to create a unique layout.
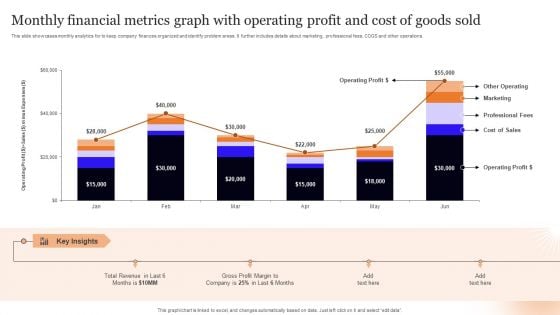
Monthly Financial Metrics Graph With Operating Profit And Cost Of Goods Sold Pictures PDF
This slide showcases monthly analytics for to keep company finances organized and identify problem areas. It further includes details about marketing, professional fees, COGS and other operations. Pitch your topic with ease and precision using this Monthly Financial Metrics Graph With Operating Profit And Cost Of Goods Sold Pictures PDF. This layout presents information on Key Insights, Operating Profit, Total Revenue. It is also available for immediate download and adjustment. So, changes can be made in the color, design, graphics or any other component to create a unique layout.

Marketers Guide To Data Analysis Optimization Analyzing Cost Per Click CPC To Ensure Higher ROI Slides PDF
Get a simple yet stunning designed Marketers Guide To Data Analysis Optimization Analyzing Cost Per Click CPC To Ensure Higher ROI Slides PDF. It is the best one to establish the tone in your meetings. It is an excellent way to make your presentations highly effective. So, download this PPT today from Slidegeeks and see the positive impacts. Our easy to edit Marketers Guide To Data Analysis Optimization Analyzing Cost Per Click CPC To Ensure Higher ROI Slides PDF can be your go to option for all upcoming conferences and meetings. So, what are you waiting for Grab this template today.
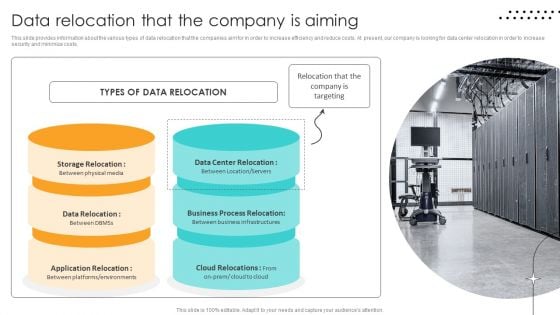
Cost Saving Benefits Of Implementing Data Center Data Relocation That The Company Is Aiming Ideas PDF
This slide provides information about the various types of data relocation that the companies aim for in order to increase efficiency and reduce costs. At present, our company is looking for data center relocation in order to increase security and minimize costs. Get a simple yet stunning designed Cost Saving Benefits Of Implementing Data Center Data Relocation That The Company Is Aiming Ideas PDF. It is the best one to establish the tone in your meetings. It is an excellent way to make your presentations highly effective. So, download this PPT today from Slidegeeks and see the positive impacts. Our easy to edit Cost Saving Benefits Of Implementing Data Center Data Relocation That The Company Is Aiming Ideas PDF can be your go to option for all upcoming conferences and meetings. So, what are you waiting for Grab this template today.
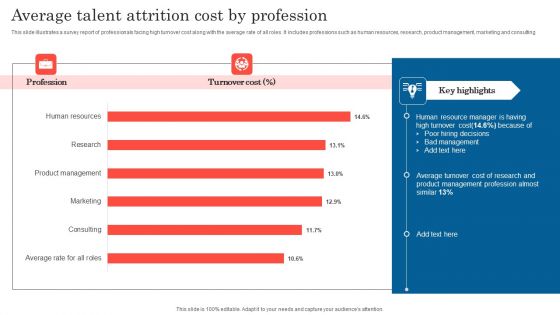
Average Talent Attrition Cost By Profession Diagrams PDF
This slide illustrates a survey report of professionals facing high turnover cost along with the average rate of all roles. It includes professions such as human resources, research, product management, marketing and consulting. Pitch your topic with ease and precision using this Average Talent Attrition Cost By Profession Diagrams PDF. This layout presents information on Human Resource Manager, Key Highlights, Bad Management. It is also available for immediate download and adjustment. So, changes can be made in the color, design, graphics or any other component to create a unique layout.
Concentric Circles Data Flow Diagram 3 Stages Business Plan For Non Profit PowerPoint Slides
We present our concentric circles data flow diagram 3 stages business plan for non profit PowerPoint Slides.Present our Circle Charts PowerPoint Templates because Our PowerPoint Templates and Slides team portray an attitude of elegance. Personify this quality by using them regularly. Download our Shapes PowerPoint Templates because You will get more than you ever bargained for. Download our Signs PowerPoint Templates because Timeline crunches are a fact of life. Meet all deadlines using our PowerPoint Templates and Slides. Use our Maketing PowerPoint Templates because you can Add colour to your speech with our PowerPoint Templates and Slides. Your presentation will leave your audience speechless. Use our Metaphors-Visual Concepts PowerPoint Templates because Our PowerPoint Templates and Slides are like the strings of a tennis racquet. Well strung to help you serve aces.Use these PowerPoint slides for presentations relating to diagram, circular, market, bar, advertise, interface, business, concept, vector, sign, success, presentation, symbol, template, circle, brochure, finance, data, description, report, marketing, title, label, abstract, management, graph, four, illustration, icon, pie, chart, strategy, catalog, research, web, design, growth, text, professional, banner, account, profit, information, background, info-graphic, analyze, financial, button, goals. The prominent colors used in the PowerPoint template are Blue, Blue light, White. Our Concentric Circles Data Flow Diagram 3 Stages Business Plan For Non Profit PowerPoint Slides are evidently advantageous. The balance will tilt in your favour.
Rings Forming Structured Data 7 Stages Step By Business Plan Template PowerPoint Slides
We present our rings forming structured data 7 stages step by business plan template PowerPoint Slides.Use our Circle Charts PowerPoint Templates because They will Put your wonderful verbal artistry on display. Our PowerPoint Templates and Slides will provide you the necessary glam and glitter. Present our Shapes PowerPoint Templates because It will Give impetus to the hopes of your colleagues. Our PowerPoint Templates and Slides will aid you in winning their trust. Download and present our Signs PowerPoint Templates because Our PowerPoint Templates and Slides will let you Clearly mark the path for others to follow. Download and present our Maketing PowerPoint Templates because It will mark the footprints of your journey. Illustrate how they will lead you to your desired destination. Use our Metaphors-Visual Concepts PowerPoint Templates because Our PowerPoint Templates and Slides has conjured up a web of all you need with the help of our great team. Use them to string together your glistening ideas.Use these PowerPoint slides for presentations relating to diagram, circular, market, bar, advertise, interface, business, concept, vector, sign, success, presentation, symbol, template, circle, brochure, finance, data, description, report, marketing, title, label, abstract, management, graph, four, illustration, icon, pie, chart, strategy, catalog, research, web, design, growth, text, professional, banner, account, profit, information, background, info-graphic, analyze, financial, button, goals. The prominent colors used in the PowerPoint template are Blue, Blue light, White. Face your audience with our Rings Forming Structured Data 7 Stages Step By Business Plan Template PowerPoint Slides. You will come out on top.
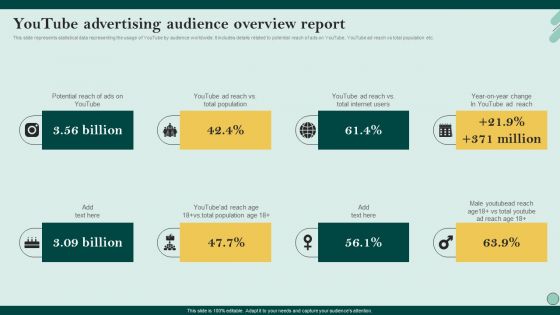
Social Networks Marketing To Improve Youtube Advertising Audience Overview Report Microsoft PDF
This slide represents statistical data representing the usage of YouTube by audience worldwide. It includes details related to potential reach of ads on YouTube, YouTube ad reach vs total population etc. Do you have an important presentation coming up Are you looking for something that will make your presentation stand out from the rest Look no further than Social Networks Marketing To Improve Youtube Advertising Audience Overview Report Microsoft PDF. With our professional designs, you can trust that your presentation will pop and make delivering it a smooth process. And with Slidegeeks, you can trust that your presentation will be unique and memorable. So why wait Grab Social Networks Marketing To Improve Youtube Advertising Audience Overview Report Microsoft PDF today and make your presentation stand out from the rest.
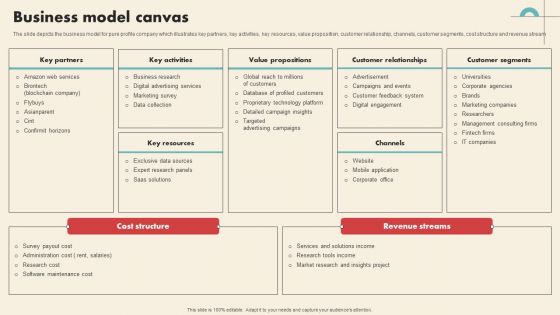
Data Driven Marketing Solutions Firm Company Profile Business Model Canvas Professional PDF
The slide depicts the business model for pure profile company which illustrates key partners, key activities, key resources, value proposition, customer relationship, channels, customer segments, cost structure and revenue stream Want to ace your presentation in front of a live audience Our Data Driven Marketing Solutions Firm Company Profile Business Model Canvas Professional PDF can help you do that by engaging all the users towards you. Slidegeeks experts have put their efforts and expertise into creating these impeccable powerpoint presentations so that you can communicate your ideas clearly. Moreover, all the templates are customizable, and easy to edit and downloadable. Use these for both personal and commercial use.
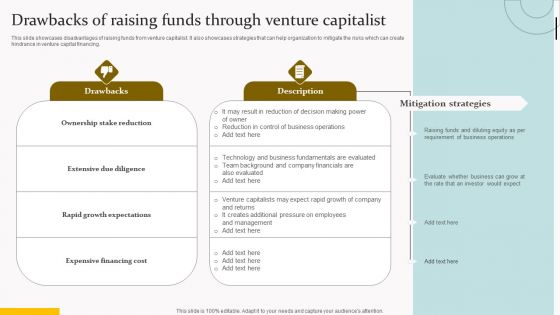
Drawbacks Of Raising Funds Through Venture Capitalist Diagrams PDF
This slide showcases disadvantages of raising funds from venture capitalist. It also showcases strategies that can help organization to mitigate the risks which can create hindrance in venture capital financing. The Drawbacks Of Raising Funds Through Venture Capitalist Diagrams PDF is a compilation of the most recent design trends as a series of slides. It is suitable for any subject or industry presentation, containing attractive visuals and photo spots for businesses to clearly express their messages. This template contains a variety of slides for the user to input data, such as structures to contrast two elements, bullet points, and slides for written information. Slidegeeks is prepared to create an impression.
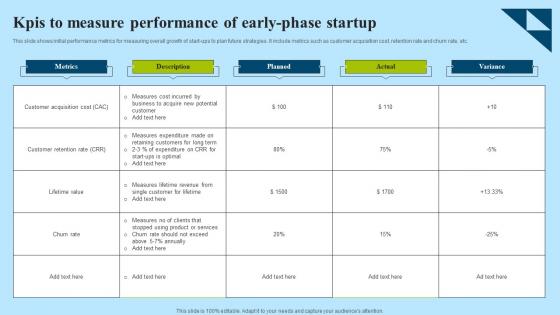
KPIs To Measure Performance Of Early Phase Startup Professional Pdf
This slide shows initial performance metrics for measuring overall growth of start-ups to plan future strategies. It include metrics such as customer acquisition cost, retention rate and churn rate, etc. Showcasing this set of slides titled KPIs To Measure Performance Of Early Phase Startup Professional Pdf. The topics addressed in these templates are Metrics, Description, Planned. All the content presented in this PPT design is completely editable. Download it and make adjustments in color, background, font etc. as per your unique business setting. This slide shows initial performance metrics for measuring overall growth of start-ups to plan future strategies. It include metrics such as customer acquisition cost, retention rate and churn rate, etc.

Project Management Software Capital Raising Deck Product And Services Offered Formats PDF
Following slide highlights various services and products offered by company for efficient project and work management. It includes elements such as costs, report, statistics, AI, smart time tracking etc. The Project Management Software Capital Raising Deck Product And Services Offered Formats PDF is a compilation of the most recent design trends as a series of slides. It is suitable for any subject or industry presentation, containing attractive visuals and photo spots for businesses to clearly express their messages. This template contains a variety of slides for the user to input data, such as structures to contrast two elements, bullet points, and slides for written information. Slidegeeks is prepared to create an impression.
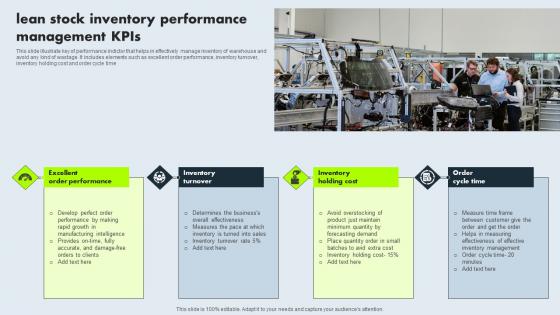
Lean Stock Inventory Performance Management Kpis Slides Pdf
This slide illustrate key of performance indictor that helps in effectively manage inventory of warehouse and avoid any kind of wastage. It includes elements such as excellent order performance, inventory turnover, inventory holding cost and order cycle time. Showcasing this set of slides titled Lean Stock Inventory Performance Management Kpis Slides Pdf. The topics addressed in these templates are Inventory Turnover, Inventory Holding Cost, Excellent Order Performance. All the content presented in this PPT design is completely editable. Download it and make adjustments in color, background, font etc. as per your unique business setting. This slide illustrate key of performance indictor that helps in effectively manage inventory of warehouse and avoid any kind of wastage. It includes elements such as excellent order performance, inventory turnover, inventory holding cost and order cycle time.
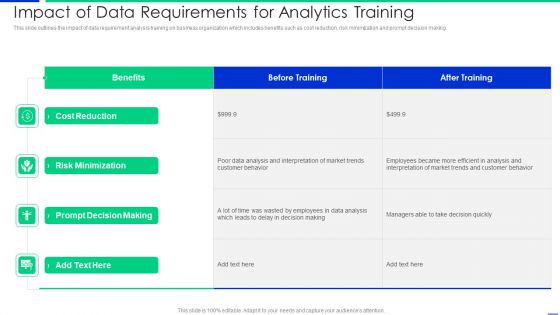
Impact Of Data Requirements For Analytics Training Background PDF
This slide outlines the impact of data requirement analysis training on business organization which includes benefits such as cost reduction, risk minimization and prompt decision making. Pitch your topic with ease and precision using this impact of data requirements for analytics training background pdf. This layout presents information on risk minimization, prompt decision making, cost reduction. It is also available for immediate download and adjustment. So, changes can be made in the color, design, graphics or any other component to create a unique layout.
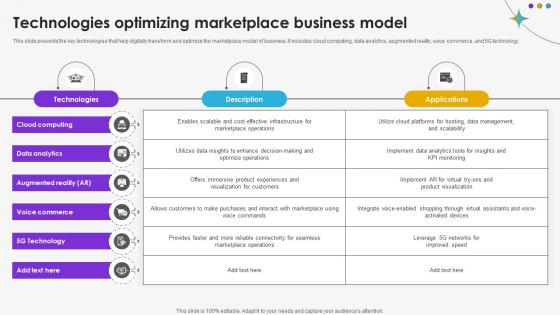
Technologies Optimizing Marketplace Business Model DT SS V
This slide presents the key technologies that help digitally transform and optimize the marketplace model of business. It includes cloud computing, data analytics, augmented reality, voice commerce, and 5G technology.Present like a pro with Technologies Optimizing Marketplace Business Model DT SS V. Create beautiful presentations together with your team, using our easy-to-use presentation slides. Share your ideas in real-time and make changes on the fly by downloading our templates. So whether you are in the office, on the go, or in a remote location, you can stay in sync with your team and present your ideas with confidence. With Slidegeeks presentation got a whole lot easier. Grab these presentations today. This slide presents the key technologies that help digitally transform and optimize the marketplace model of business. It includes cloud computing, data analytics, augmented reality, voice commerce, and 5G technology.
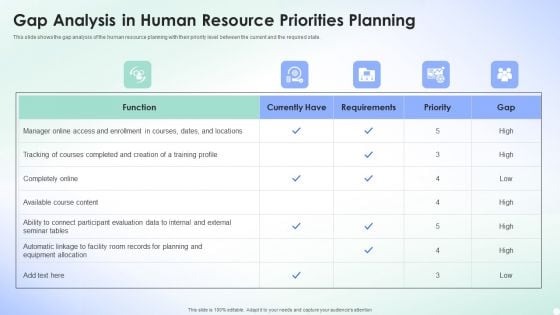
Gap Analysis In Human Resource Priorities Planning Rules PDF
This slide shows the gap analysis of the human resource planning with their priority level between the current and the required state. Showcasing this set of slides titled Gap Analysis In Human Resource Priorities Planning Rules PDF. The topics addressed in these templates are Requirements, Equipment Allocation, Evaluation Data. All the content presented in this PPT design is completely editable. Download it and make adjustments in color, background, font etc. as per your unique business setting.
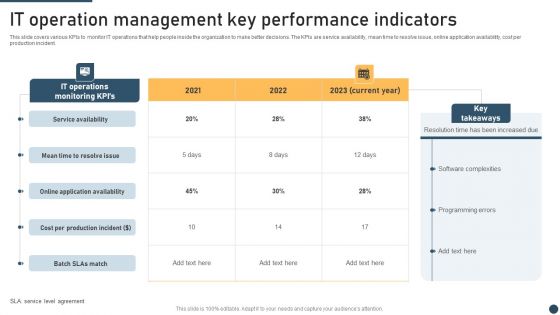
It Operation Management Key Performance Indicators Template PDF
This slide covers various KPIs to monitor IT operations that help people inside the organization to make better decisions. The KPIs are service availability, mean time to resolve issue, online application availability, cost per production incident. Showcasing this set of slides titled It Operation Management Key Performance Indicators Template PDF. The topics addressed in these templates are Service Availability, Cost Per Production, Performance Indicators. All the content presented in this PPT design is completely editable. Download it and make adjustments in color, background, font etc. as per your unique business setting.
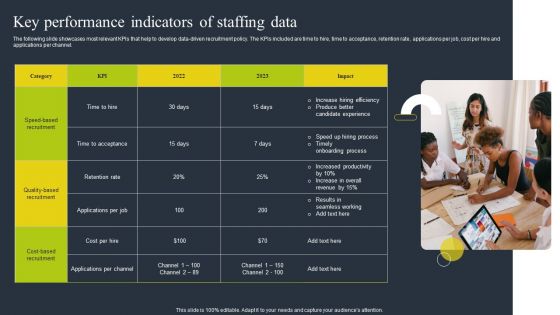
Key Performance Indicators Of Staffing Data Download PDF
The following slide showcases most relevant KPIs that help to develop data driven recruitment policy. The KPIs included are time to hire, time to acceptance, retention rate, applications per job, cost per hire and applications per channel. Persuade your audience using this Key Performance Indicators Of Staffing Data Download PDF. This PPT design covers one stages, thus making it a great tool to use. It also caters to a variety of topics including Quality Based Recruitment, Cost, Applications Per Channel. Download this PPT design now to present a convincing pitch that not only emphasizes the topic but also showcases your presentation skills.
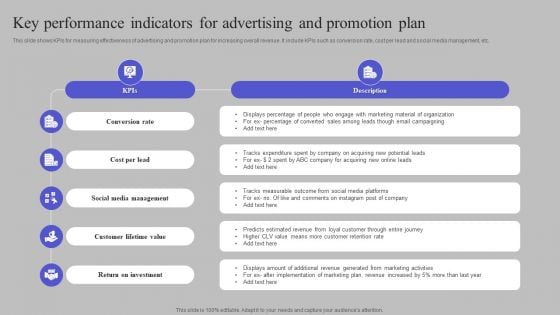
Key Performance Indicators For Advertising And Promotion Plan Background PDF
This slide shows KPIs for measuring effectiveness of advertising and promotion plan for increasing overall revenue. It include KPIs such as conversion rate, cost per lead and social media management, etc. Persuade your audience using this Key Performance Indicators For Advertising And Promotion Plan Background PDF. This PPT design covers five stages, thus making it a great tool to use. It also caters to a variety of topics including Conversion Rate, Cost Per Lead, Social Media Management. Download this PPT design now to present a convincing pitch that not only emphasizes the topic but also showcases your presentation skills.
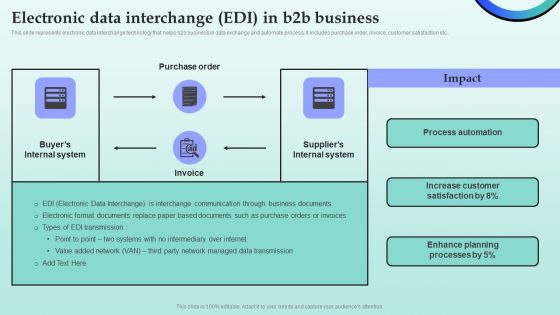
Strategies For Successful Customer Base Development In B2b M Commerce Electronic Data Interchange EDI In B2b Business Ideas PDF
This slide represents electronic data interchange technology that helps b2b business in data exchange and automate process. It includes purchase order, invoice, customer satisfaction etc.. Slidegeeks is here to make your presentations a breeze with Strategies For Successful Customer Base Development In B2b M Commerce Electronic Data Interchange EDI In B2b Business Ideas PDF With our easy to use and customizable templates, you can focus on delivering your ideas rather than worrying about formatting. With a variety of designs to choose from, you are sure to find one that suits your needs. And with animations and unique photos, illustrations, and fonts, you can make your presentation pop. So whether you are giving a sales pitch or presenting to the board, make sure to check out Slidegeeks first.
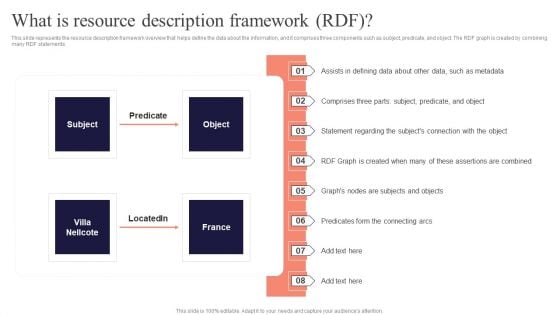
Concept Of Ontology In The Semantic Web What Is Resource Description Framework RDF Diagrams PDF
This slide represents the resource description framework overview that helps define the data about the information, and it comprises three components such as subject, predicate, and object. The RDF graph is created by combining many RDF statements. Do you know about Slidesgeeks Concept Of Ontology In The Semantic Web Steps To Obtain Semantic Searchs Benefits Demonstration PDF These are perfect for delivering any kind od presentation. Using it, create PowerPoint presentations that communicate your ideas and engage audiences. Save time and effort by using our pre designed presentation templates that are perfect for a wide range of topic. Our vast selection of designs covers a range of styles, from creative to business, and are all highly customizable and easy to edit. Download as a PowerPoint template or use them as Google Slides themes.
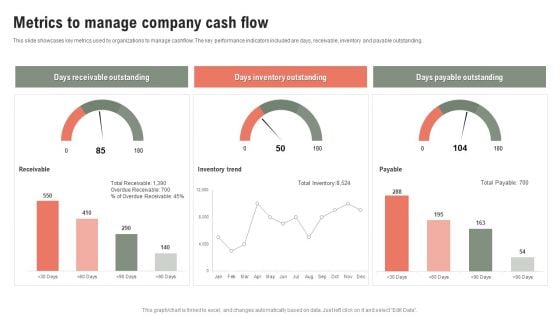
Metrics To Manage Company Cash Flow Ppt Model Gridlines PDF
This slide showcases key metrics used by organizations to manage cashflow. The key performance indicators included are days, receivable, inventory and payable outstanding. Pitch your topic with ease and precision using this Metrics To Manage Company Cash Flow Ppt Model Gridlines PDF. This layout presents information on Days Receivable Outstanding, Days Inventory Outstanding, Days Payable Outstanding. It is also available for immediate download and adjustment. So, changes can be made in the color, design, graphics or any other component to create a unique layout.
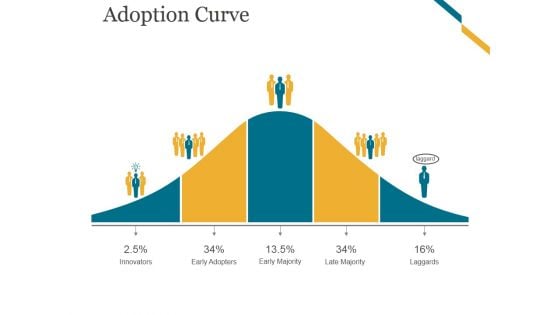
Adoption Curve Ppt PowerPoint Presentation Designs
This is a adoption curve ppt powerpoint presentation designs. This is a five stage process. The stages in this process are innovators, early adopters, early majority, late majority, laggards.
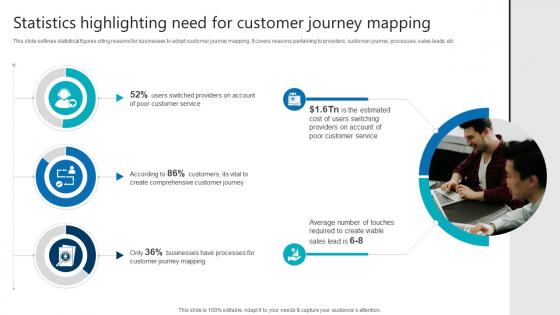
Statistics Highlighting Need For Customer Journey Mapping Product Analytics Implementation Data Analytics V
This slide outlines statistical figures citing reasons for businesses to adopt customer journey mapping. It covers reasons pertaining to providers, customer journey, processes, sales leads, etc Crafting an eye-catching presentation has never been more straightforward. Let your presentation shine with this tasteful yet straightforward Statistics Highlighting Need For Customer Journey Mapping Product Analytics Implementation Data Analytics V template. It offers a minimalistic and classy look that is great for making a statement. The colors have been employed intelligently to add a bit of playfulness while still remaining professional. Construct the ideal Statistics Highlighting Need For Customer Journey Mapping Product Analytics Implementation Data Analytics V that effortlessly grabs the attention of your audience Begin now and be certain to wow your customers This slide outlines statistical figures citing reasons for businesses to adopt customer journey mapping. It covers reasons pertaining to providers, customer journey, processes, sales leads, etc
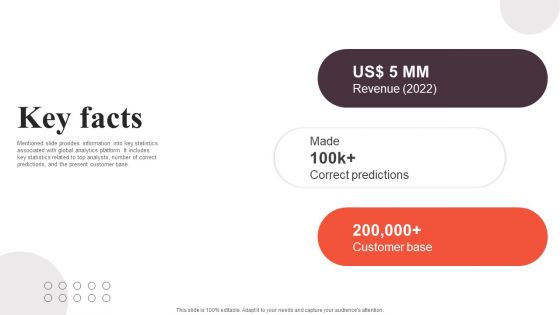
Financial Analytics Solution Investor Funding Elevator Pitch Deck Key Facts Themes PDF
Mentioned slide provides information into key statistics associated with global analytics platform. It includes key statistics related to top analysts, number of correct predictions, and the present customer base. The Financial Analytics Solution Investor Funding Elevator Pitch Deck Key Facts Themes PDF is a compilation of the most recent design trends as a series of slides. It is suitable for any subject or industry presentation, containing attractive visuals and photo spots for businesses to clearly express their messages. This template contains a variety of slides for the user to input data, such as structures to contrast two elements, bullet points, and slides for written information. Slidegeeks is prepared to create an impression.

Empowering The Future Key Emerging Market Trends In IoT Driven Smart Grid IoT SS V
This slide showcases emerging trends and opportunities that optimize and increase the sustainability of energy solutions. It includes trends such as renewable energy sources continued growth, distributed energy resources, electric vehicle charging, and a focus on cybersecurity. Slidegeeks is here to make your presentations a breeze with Empowering The Future Key Emerging Market Trends In IoT Driven Smart Grid IoT SS V With our easy-to-use and customizable templates, you can focus on delivering your ideas rather than worrying about formatting. With a variety of designs to choose from, you are sure to find one that suits your needs. And with animations and unique photos, illustrations, and fonts, you can make your presentation pop. So whether you are giving a sales pitch or presenting to the board, make sure to check out Slidegeeks first This slide showcases emerging trends and opportunities that optimize and increase the sustainability of energy solutions. It includes trends such as renewable energy sources continued growth, distributed energy resources, electric vehicle charging, and a focus on cybersecurity.
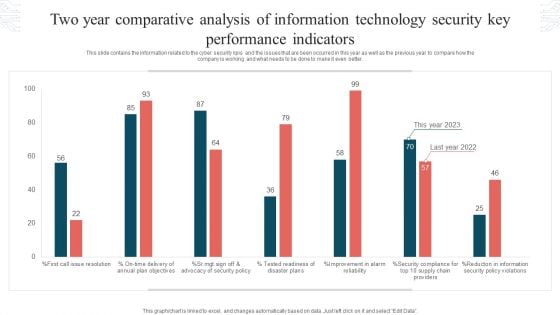
Two Year Comparative Analysis Of Information Technology Security Key Performance Indicators Graphics PDF
This slide contains the information related to the cyber security kpis and the issues that are been occurred in this year as well as the previous year to compare how the company is working and what needs to be done to make it even better. Showcasing this set of slides titled Two Year Comparative Analysis Of Information Technology Security Key Performance Indicators Graphics PDF. The topics addressed in these templates are Tested Readiness, Disaster Plans, Security Policy Violations. All the content presented in this PPT design is completely editable. Download it and make adjustments in color, background, font etc. as per your unique business setting.
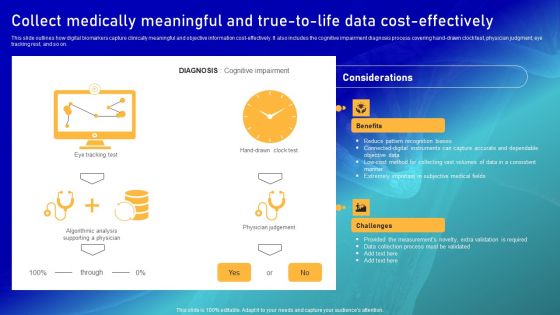
Biomarker Categorization Collect Medically Meaningful And True To Life Data Cost Effectively Designs PDF
This slide outlines how digital biomarkers capture clinically meaningful and objective information cost-effectively. It also includes the cognitive impairment diagnosis process covering hand-drawn clock test, physician judgment, eye tracking rest, and so on. Want to ace your presentation in front of a live audience Our Biomarker Categorization Collect Medically Meaningful And True To Life Data Cost Effectively Designs PDF can help you do that by engaging all the users towards you. Slidegeeks experts have put their efforts and expertise into creating these impeccable powerpoint presentations so that you can communicate your ideas clearly. Moreover, all the templates are customizable, and easy to edit and downloadable. Use these for both personal and commercial use.
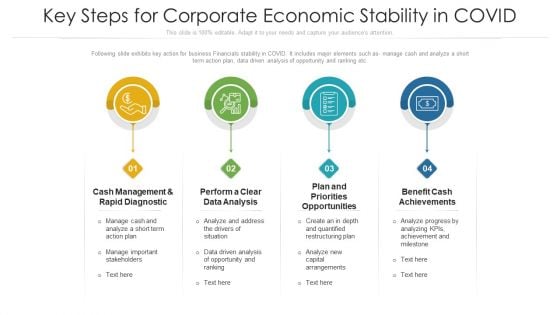
Key Steps For Corporate Economic Stability In COVID Ppt PowerPoint Presentation File Clipart Images PDF
Following slide exhibits key action for business Financials stability in COVID. It includes major elements such as- manage cash and analyze a short term action plan, data driven analysis of opportunity and ranking etc. Persuade your audience using this key steps for corporate economic stability in covid ppt powerpoint presentation file clipart images pdf. This PPT design covers four stages, thus making it a great tool to use. It also caters to a variety of topics including cash management and rapid diagnostic, perform a clear data analysis, benefit cash achievements. Download this PPT design now to present a convincing pitch that not only emphasizes the topic but also showcases your presentation skills.
Advanced Human Resource Value Chain With Kpis Icons PDF
This slide shows advanced HR value chain with KPIs to demonstrate its role in achieving goals. It includes aspects such as HR enablers, activities, outcomes, strategic focus , and KPI for financial, process and customer. Showcasing this set of slides titled Advanced Human Resource Value Chain With Kpis Icons PDF. The topics addressed in these templates are Strategic Focus, Process Kpis, Customer Kpis. All the content presented in this PPT design is completely editable. Download it and make adjustments in color, background, font etc. as per your unique business setting.
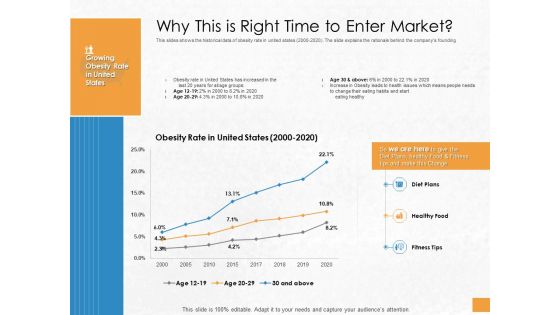
Convertible Debenture Funding Why This Is Right Time To Enter Market Ppt PowerPoint Presentation Model Styles PDF
This slides shows the historical data of obesity rate in united states 2000 to 2020 . The slide explains the rationale behind the companys founding. Deliver an awe-inspiring pitch with this creative convertible debenture funding why this is right time to enter market ppt powerpoint presentation model styles pdf bundle. Topics like obesity rate, diet plans, healthy food, fitness tips can be discussed with this completely editable template. It is available for immediate download depending on the needs and requirements of the user.
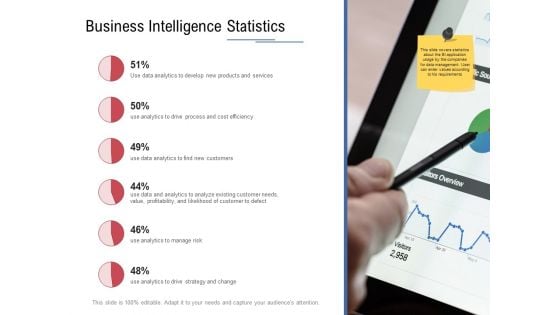
Data Assimilation Business Intelligence Statistics Ppt Slides Graphics Design PDF
This is a data assimilation business intelligence statistics ppt slides graphics design pdf template with various stages. Focus and dispense information on six stages using this creative set, that comes with editable features. It contains large content boxes to add your information on topics like data analytics, develop, services, efficiency, cost. You can also showcase facts, figures, and other relevant content using this PPT layout. Grab it now.
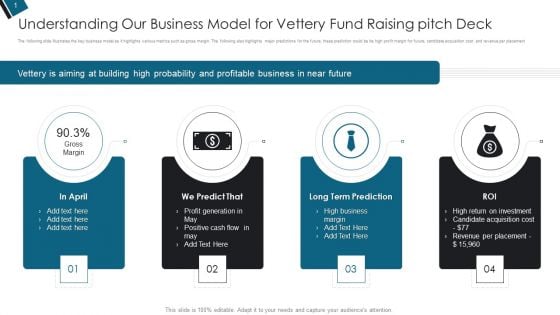
Understanding Our Business Model For Vettery Fund Raising Pitch Deck Ppt PowerPoint Presentation Design Ideas PDF
The following slide illustrates the key business model as it highlights various metrics such as gross margin. The following also highlights major predictions for the future, these prediction could be be high profit margin for future, candidate acquisition cost and revenue per placement.This is a Understanding Our Business Model For Vettery Fund Raising Pitch Deck Ppt PowerPoint Presentation Design Ideas PDF template with various stages. Focus and dispense information on four stages using this creative set, that comes with editable features. It contains large content boxes to add your information on topics like Profit Generation, Positive Cash, Candidate Acquisition You can also showcase facts, figures, and other relevant content using this PPT layout. Grab it now.
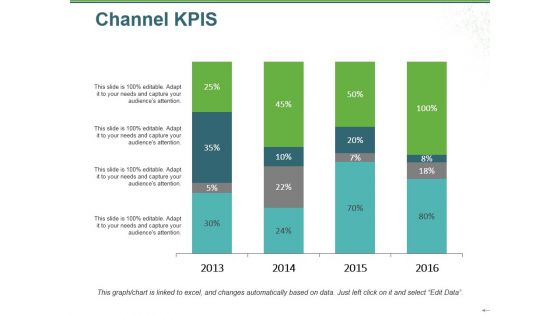
Channel Kpis Ppt PowerPoint Presentation Model Smartart
This is a channel kpis ppt powerpoint presentation model smartart. This is a four stage process. The stages in this process are business, marketing, finance, years, percentage.
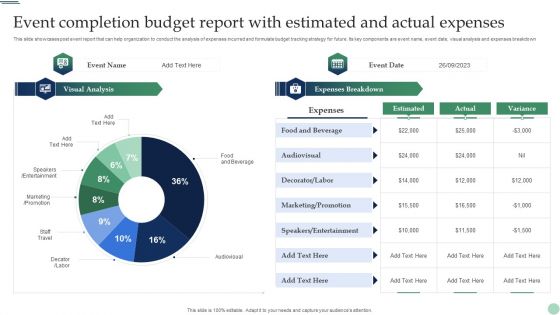
Event Completion Budget Report With Estimated And Actual Expenses Pictures PDF
This slide showcases post event report that can help organization to conduct the analysis of expenses incurred and formulate budget tracking strategy for future. Its key components are event name, event date, visual analysis and expenses breakdown. Pitch your topic with ease and precision using this Event Completion Budget Report With Estimated And Actual Expenses Pictures PDF. This layout presents information on Food And Beverage, Audiovisual, Marketing, Entertainment. It is also available for immediate download and adjustment. So, changes can be made in the color, design, graphics or any other component to create a unique layout.
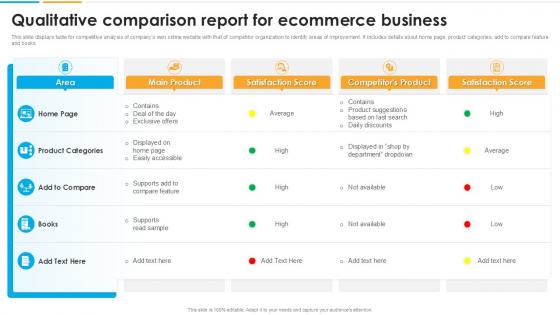
Qualitative Comparison Report For Ecommerce Business
From laying roadmaps to briefing everything in detail, our templates are perfect for you. You can set the stage with your presentation slides. All you have to do is download these easy-to-edit and customizable templates. Qualitative Comparison Report For Ecommerce Business will help you deliver an outstanding performance that everyone would remember and praise you for. Do download this presentation today. This template focuses on presenting a qualitative comparison of different aspects of e-commerce businesses, such as customer experience, product offerings, and marketing strategies. It includes detailed comparison charts and narrative sections to support business analysis. Useful for stakeholders, strategists, and marketers to identify competitive advantages and areas for improvement.
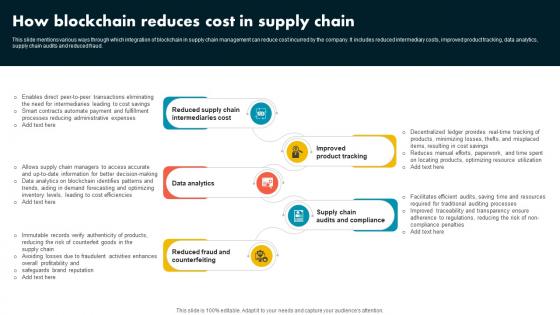
How Blockchain Reduces Cost In Supply Chain Supply Chain Evolution Harnessing The Power BCT SS V
This slide mentions various ways through which integration of blockchain in supply chain management can reduce cost incurred by the company. It includes reduced intermediary costs, improved product tracking, data analytics, supply chain audits and reduced fraud. Take your projects to the next level with our ultimate collection of How Blockchain Reduces Cost In Supply Chain Supply Chain Evolution Harnessing The Power BCT SS V. Slidegeeks has designed a range of layouts that are perfect for representing task or activity duration, keeping track of all your deadlines at a glance. Tailor these designs to your exact needs and give them a truly corporate look with your own brand colors they will make your projects stand out from the rest This slide mentions various ways through which integration of blockchain in supply chain management can reduce cost incurred by the company. It includes reduced intermediary costs, improved product tracking, data analytics, supply chain audits and reduced fraud.
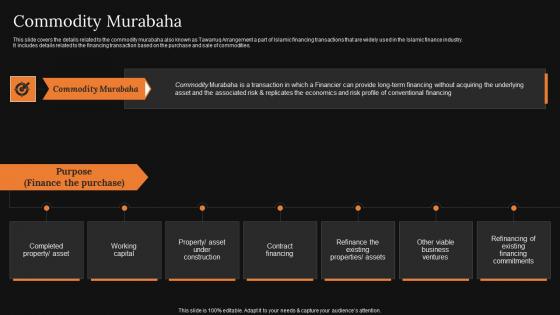
Commodity Murabaha A Detailed Knowledge Of Islamic Finance Infographics Pdf
This slide covers the details related to the commodity murabaha also known as Tawarruq Arrangement a part of Islamic financing transactions that are widely used in the Islamic finance industry. It includes details related to the financing transaction based on the purchase and sale of commodities. This Commodity Murabaha A Detailed Knowledge Of Islamic Finance Infographics Pdf from Slidegeeks makes it easy to present information on your topic with precision. It provides customization options, so you can make changes to the colors, design, graphics, or any other component to create a unique layout. It is also available for immediate download, so you can begin using it right away. Slidegeeks has done good research to ensure that you have everything you need to make your presentation stand out. Make a name out there for a brilliant performance. This slide covers the details related to the commodity murabaha also known as Tawarruq Arrangement a part of Islamic financing transactions that are widely used in the Islamic finance industry. It includes details related to the financing transaction based on the purchase and sale of commodities.
Key Performance Indicators To Track Sales Performance Ppt PowerPoint Presentation Icon Diagrams PDF
Showcasing this set of slides titled key performance indicators to track sales performance ppt powerpoint presentation icon diagrams pdf. The topics addressed in these templates are key performance indicators to track sales performance. All the content presented in this PPT design is completely editable. Download it and make adjustments in color, background, font etc. as per your unique business setting.
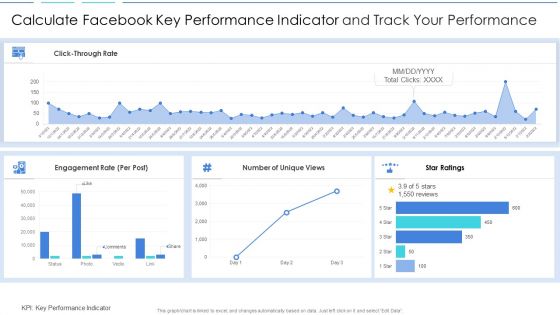
Calculate Facebook Key Performance Indicator And Track Your Performance Information PDF
Showcasing this set of slides titled calculate facebook key performance indicator and track your performance information pdf. The topics addressed in these templates are calculate facebook key performance indicator and track your performance. All the content presented in this PPT design is completely editable. Download it and make adjustments in color, background, font etc. as per your unique business setting.
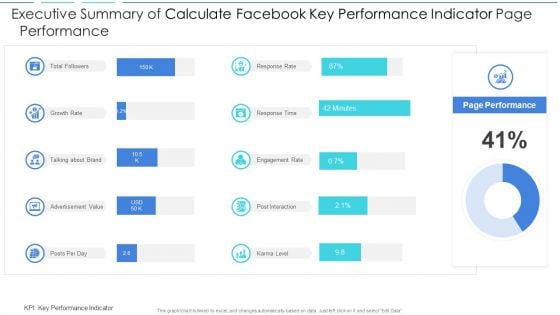
Executive Summary Of Calculate Facebook Key Performance Indicator Page Performance Download PDF
Showcasing this set of slides titled executive summary of calculate facebook key performance indicator page performance download pdf. The topics addressed in these templates are executive summary of calculate facebook key performance indicator page performance. All the content presented in this PPT design is completely editable. Download it and make adjustments in color, background, font etc. as per your unique business setting.

Organizations CEO Message To Employees And Stakeholders One Pager Documents
This one pager covers the message by organizations CEO to employees and stakeholders for ensuring validation of data. Presenting you a fantastic Organizations CEO Message To Employees And Stakeholders One Pager Documents. This piece is crafted on hours of research and professional design efforts to ensure you have the best resource. It is completely editable and its design allow you to rehash its elements to suit your needs. Get this Organizations CEO Message To Employees And Stakeholders One Pager Documents A4 One-pager now.
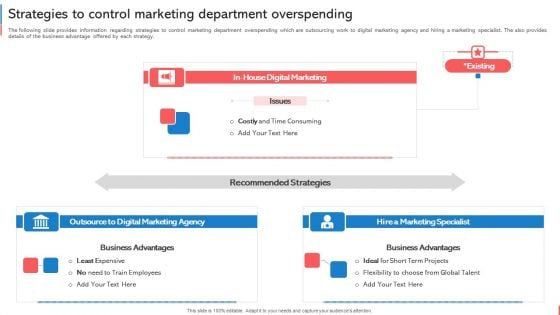
Company Budget Analysis Strategies To Control Marketing Department Overspending Mockup PDF
The following slide provides information regarding strategies to control marketing department overspending which are outsourcing work to digital marketing agency and hiring a marketing specialist. The also provides details of the business advantage offered by each strategy. The Company Budget Analysis Strategies To Control Marketing Department Overspending Mockup PDF is a compilation of the most recent design trends as a series of slides. It is suitable for any subject or industry presentation, containing attractive visuals and photo spots for businesses to clearly express their messages. This template contains a variety of slides for the user to input data, such as structures to contrast two elements, bullet points, and slides for written information. Slidegeeks is prepared to create an impression.
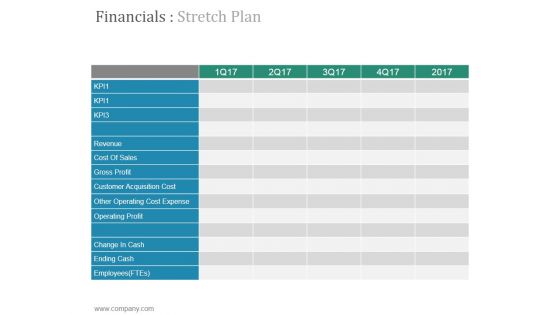
Financials Stretch Plan Ppt PowerPoint Presentation Designs
This is a financials stretch plan ppt powerpoint presentation designs. This is a five stage process. The stages in this process are revenue, cost of sales, gross profit, customer acquisition cost, other operating cost expense.
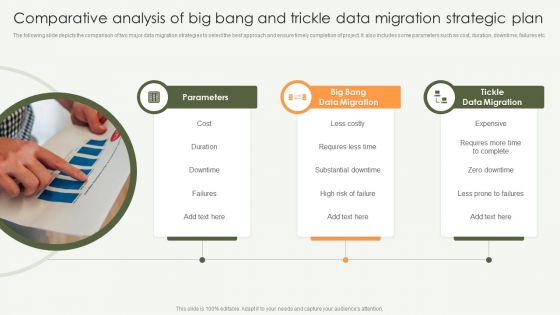
Comparative Analysis Of Big Bang And Trickle Data Migration Strategic Plan Designs PDF
The following slide depicts the comparison of two major data migration strategies to select the best approach and ensure timely completion of project. It also includes some parameters such as cost, duration, downtime, failures etc. Persuade your audience using this Comparative Analysis Of Big Bang And Trickle Data Migration Strategic Plan Designs PDF. This PPT design covers three stages, thus making it a great tool to use. It also caters to a variety of topics including Big Bang Data Migration, Tickle Data Migration, Cost. Download this PPT design now to present a convincing pitch that not only emphasizes the topic but also showcases your presentation skills.
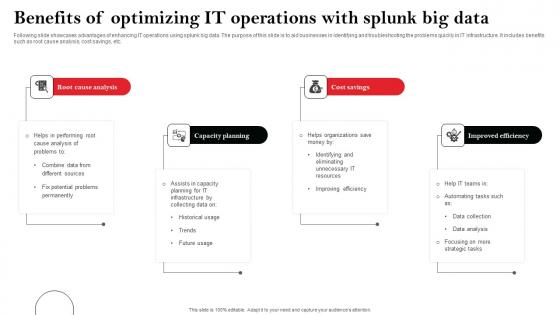
Benefits Of Optimizing It Operations With Splunk Big Data Mockup Pdf
Following slide showcases advantages of enhancing IT operations using splunk big data. The purpose of this slide is to aid businesses in identifying and troubleshooting the problems quickly in IT infrastructure. It includes benefits such as root cause analysis, cost savings, etc. Showcasing this set of slides titled Benefits Of Optimizing It Operations With Splunk Big Data Mockup Pdf The topics addressed in these templates are Capacity Planning, Cost Savings, Improved Efficiency All the content presented in this PPT design is completely editable. Download it and make adjustments in color, background, font etc. as per your unique business setting. Following slide showcases advantages of enhancing IT operations using splunk big data. The purpose of this slide is to aid businesses in identifying and troubleshooting the problems quickly in IT infrastructure. It includes benefits such as root cause analysis, cost savings, etc.
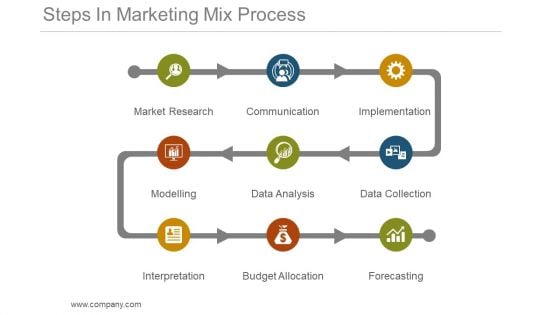
Steps In Marketing Mix Process Powerpoint Slide Deck
This is a steps in marketing mix process powerpoint slide deck. This is a nine stage process. The stages in this process are market research, communication, implementation, data collection, data analysis, modelling, interpretation, budget allocation, forecasting.


 Continue with Email

 Home
Home


