Investment Strategy
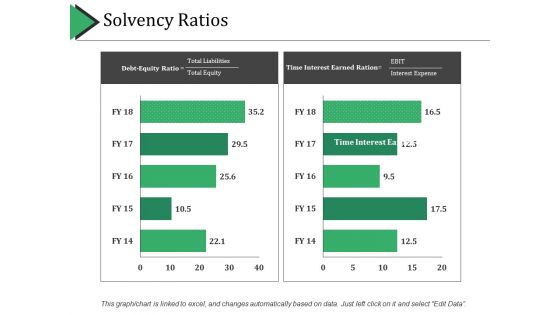
Solvency Ratios Ppt PowerPoint Presentation Professional Summary
This is a solvency ratios ppt powerpoint presentation professional summary. This is a two stage process. The stages in this process are solvency ratios, finance, marketing, strategy, business.

Taxation Ppt PowerPoint Presentation Outline Templates
This is a taxation ppt powerpoint presentation outline templates. This is a one stage process. The stages in this process are business, finance, marketing, strategy, analysis.
Stacked Bar Ppt PowerPoint Presentation Icon Objects
This is a stacked bar ppt powerpoint presentation icon objects. This is a two stage process. The stages in this process are stacked bar, finance, analysis, marketing, strategy.
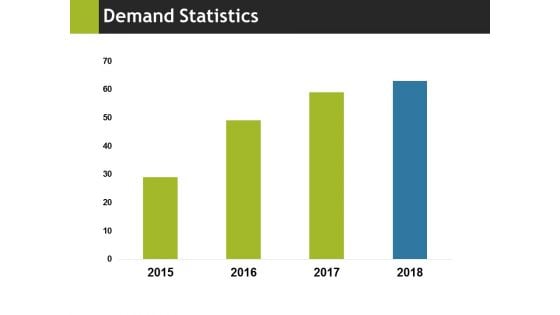
Demand Statistics Ppt PowerPoint Presentation Pictures Slides
This is a demand statistics ppt powerpoint presentation pictures slides. This is a four stage process. The stages in this process are business, marketing, years, finance, strategy.
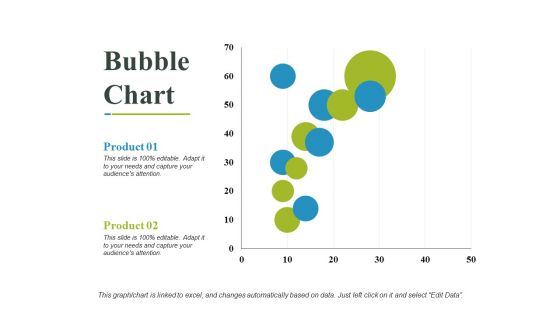
Bubble Chart Ppt PowerPoint Presentation Summary Sample
This is a bubble chart ppt powerpoint presentation summary sample. This is a two stage process. The stages in this process are business, marketing, bubble chart, finance, strategy.
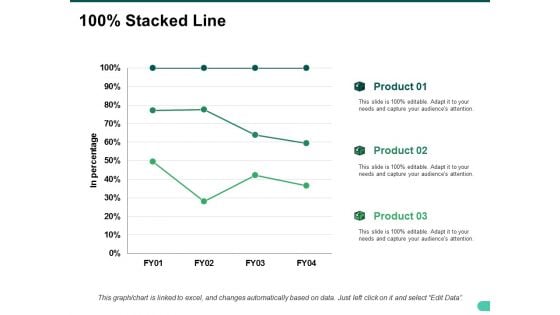
Stacked Line Ppt PowerPoint Presentation Slides Show
This is a stacked line ppt powerpoint presentation slides show. This is a three stage process. The stages in this process are in percentage, business, marketing, strategy, finance.
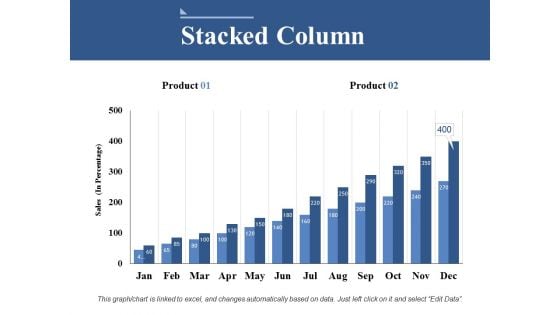
Stacked Column Ppt PowerPoint Presentation Model Information
This is a stacked column ppt powerpoint presentation model information. This is a two stage process. The stages in this process are business, sales, marketing, finance, strategy.
Radar Chart Ppt PowerPoint Presentation Icon Format
This is a radar chart ppt powerpoint presentation icon format. This is a two stage process. The stages in this process are business, radar chart, finance, strategy, years.
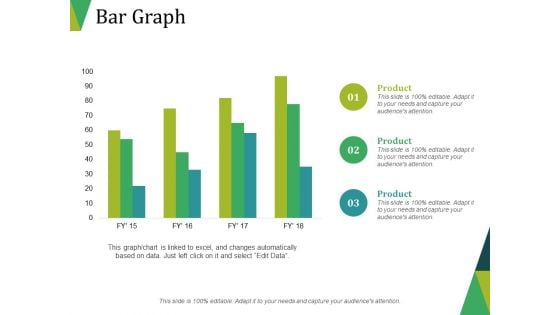
Bar Graph Ppt PowerPoint Presentation Layouts Portrait
This is a bar graph ppt powerpoint presentation layouts portrait. This is a three stage process. The stages in this process are bar graph, finance, marketing, strategy, business.
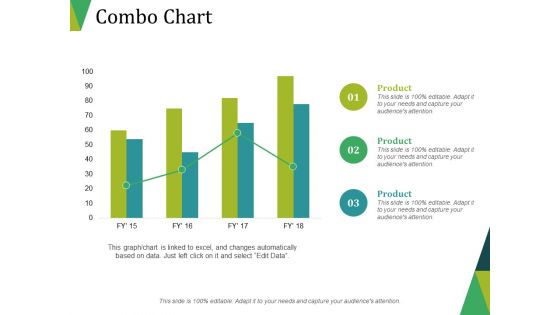
Combo Chart Ppt PowerPoint Presentation Inspiration Outline
This is a combo chart ppt powerpoint presentation inspiration outline. This is a three stage process. The stages in this process are combo chart, finance, marketing, strategy, business.
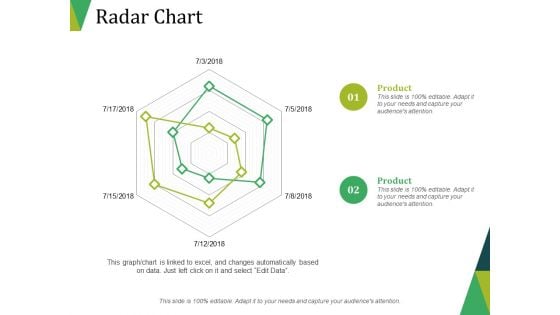
Radar Chart Ppt PowerPoint Presentation Tips
This is a radar chart ppt powerpoint presentation tips. This is a two stage process. The stages in this process are radar chart, finance, marketing, strategy, business.
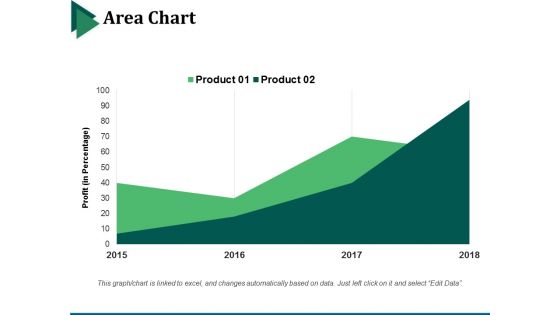
Area Chart Ppt PowerPoint Presentation File Portrait
This is a area chart ppt powerpoint presentation file portrait. This is a two stage process. The stages in this process are business, marketing, strategy, finance, area chart.
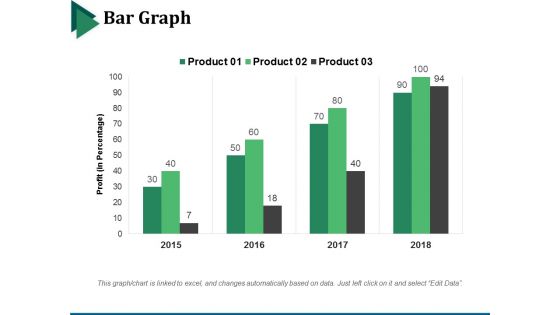
Bar Graph Ppt PowerPoint Presentation File Display
This is a bar graph ppt powerpoint presentation file display. This is a four stage process. The stages in this process are bar graph, marketing, strategy, finance, analysis.

Combo Chart Ppt PowerPoint Presentation Infographics Ideas
This is a combo chart ppt powerpoint presentation infographics ideas. This is a four stage process. The stages in this process are bar graph, marketing, strategy, finance, analysis.
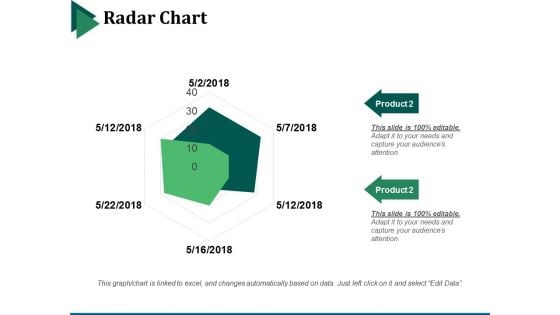
Radar Chart Ppt PowerPoint Presentation Infographic Template Guidelines
This is a radar chart ppt powerpoint presentation infographic template guidelines. This is a two stage process. The stages in this process are business, marketing, strategy, finance, analysis.
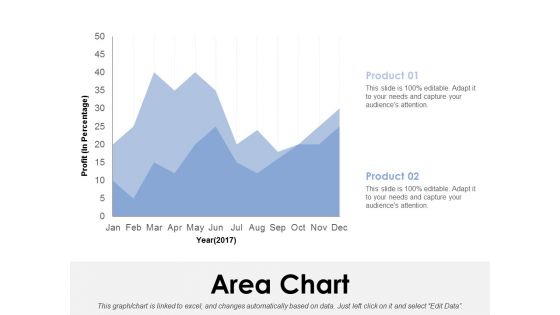
Area Chart Ppt PowerPoint Presentation Model Templates
This is a area chart ppt powerpoint presentation model templates. This is a two stage process. The stages in this process are area chart, finance, marketing, strategy, business.
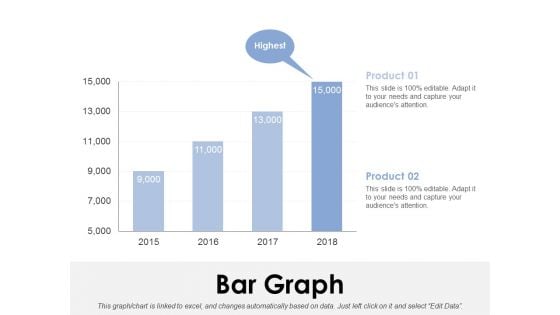
Bar Graph Ppt PowerPoint Presentation Professional Background
This is a bar graph ppt powerpoint presentation professional background. This is a two stage process. The stages in this process are bar graph, finance, marketing, strategy, business.
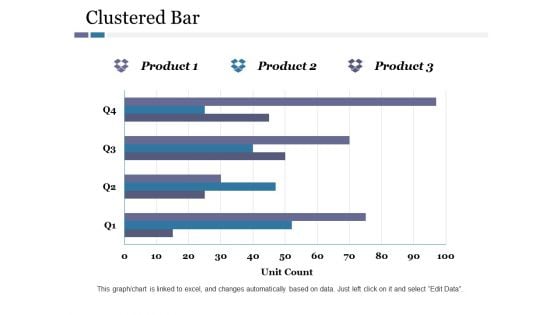
Clustered Bar Ppt PowerPoint Presentation Pictures Guidelines
This is a clustered bar ppt powerpoint presentation pictures guidelines. This is a three stage process. The stages in this process are clustered bar, finance, marketing, strategy, business.
Radar Chart Ppt PowerPoint Presentation Show Icon
This is a radar chart ppt powerpoint presentation show icon. This is a two stage process. The stages in this process are radar chart, finance, marketing, strategy, business.
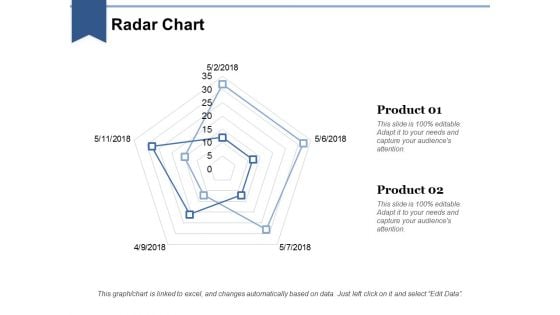
Radar Chart Ppt PowerPoint Presentation Styles Deck
This is a radar chart ppt powerpoint presentation styles deck. This is a two stage process. The stages in this process are business, radar chart, finance, strategy, graph.
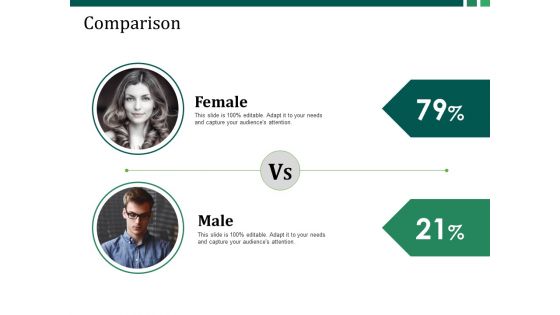
Comparison Ppt PowerPoint Presentation Slides Introduction
This is a comparison ppt powerpoint presentation slides introduction. This is a three stage process. The stages in this process are male, female, marketing, strategy, finance.
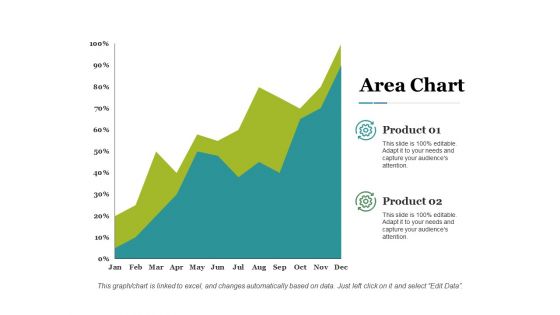
Area Chart Ppt PowerPoint Presentation Layouts Deck
This is a area chart ppt powerpoint presentation layouts deck. This is a two stage process. The stages in this process are business, marketing, area chart, finance, strategy.
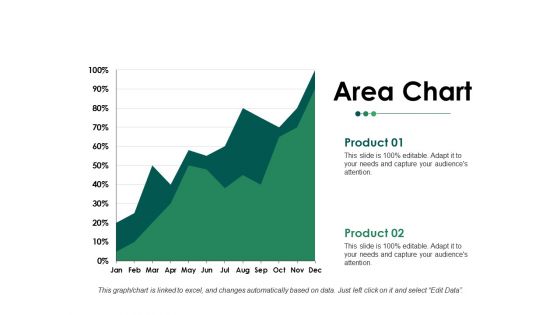
Area Chart Ppt PowerPoint Presentation Slides Guidelines
This is a area chart ppt powerpoint presentation slides guidelines. This is a two stage process. The stages in this process are business, area chart, marketing, strategy, finance.
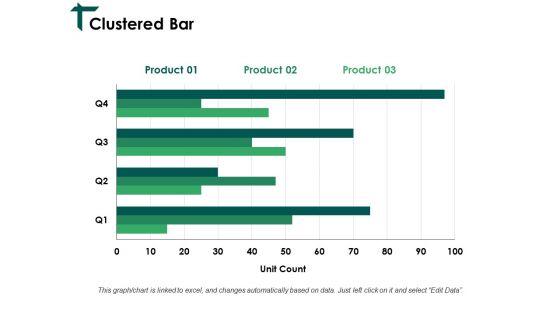
Clustered Bar Ppt PowerPoint Presentation Diagram Templates
This is a clustered bar ppt powerpoint presentation diagram templates. This is a three stage process. The stages in this process are business, marketing, unit count, finance, strategy.
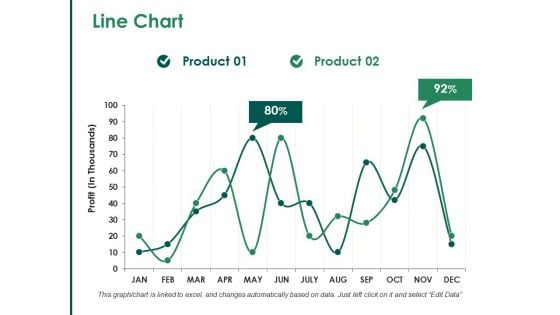
Line Chart Ppt PowerPoint Presentation File Diagrams
This is a line chart ppt powerpoint presentation file diagrams. This is a two stage process. The stages in this process are line chart, business, marketing, strategy, finance.
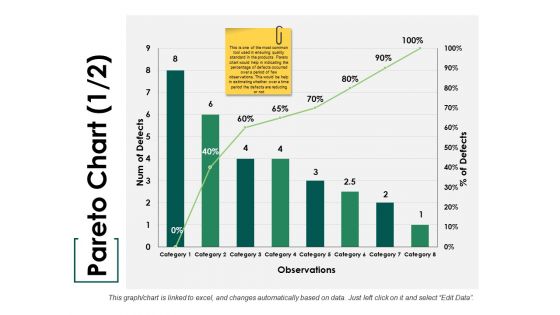
Pareto Chart Ppt PowerPoint Presentation Summary Show
This is a pareto chart ppt powerpoint presentation summary show. This is a eight stage process. The stages in this process are bar, marketing, strategy, finance, teamwork.
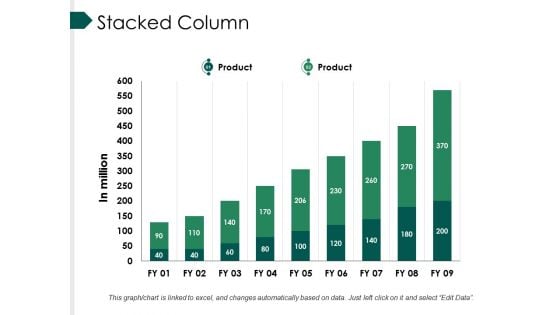
Stacked Column Ppt PowerPoint Presentation Professional Infographics
This is a stacked column ppt powerpoint presentation professional infographics. This is a nine stage process. The stages in this process are bar, marketing, strategy, finance, teamwork.
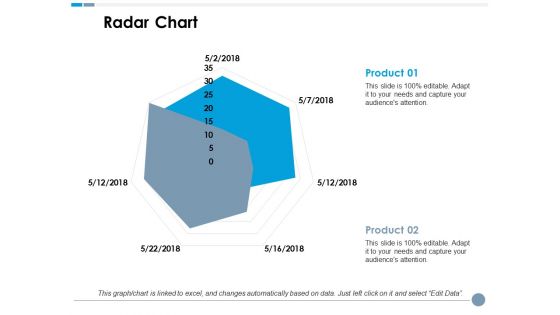
Radar Chart Ppt PowerPoint Presentation Summary Layouts
This is a radar chart ppt powerpoint presentation summary layouts. This is a two stage process. The stages in this process are business, radar chart, marketing, finance, strategy.

Column Chart Ppt PowerPoint Presentation Show Brochure
This is a column chart ppt powerpoint presentation show brochure. This is a two stage process. The stages in this process are column chart, finance, marketing, strategy, business.
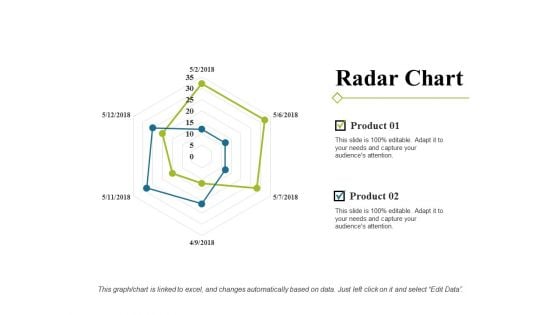
Radar Chart Ppt PowerPoint Presentation Portfolio Show
This is a radar chart ppt powerpoint presentation portfolio show. This is a two stage process. The stages in this process are radar chart, finance, marketing, strategy, analysis.
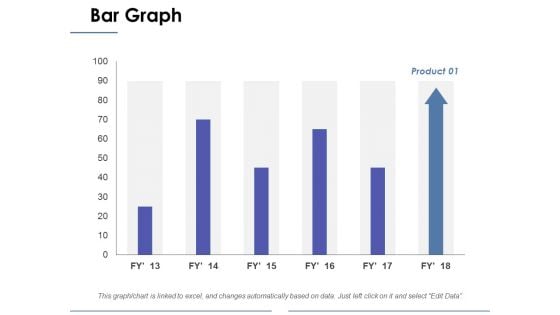
Bar Graph Ppt PowerPoint Presentation Layouts Backgrounds
This is a bar graph ppt powerpoint presentation layouts backgrounds. This is a one stage process. The stages in this process are business, marketing, finance, bar graph, strategy.
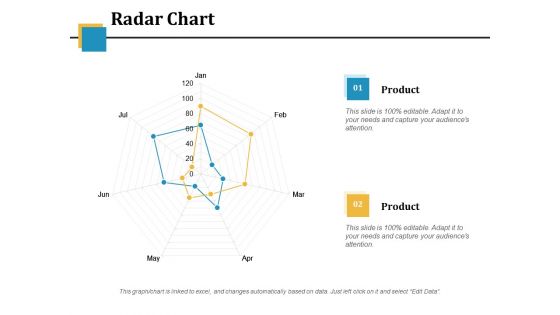
Radar Chart Ppt PowerPoint Presentation Summary Microsoft
This is a radar chart ppt powerpoint presentation summary microsoft. This is a two stage process. The stages in this process are business, radar chart, marketing, finance, strategy.
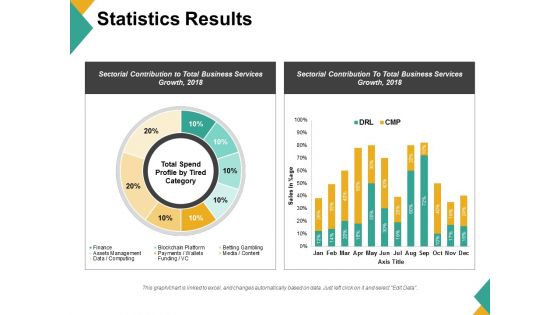
Statistics Results Ppt PowerPoint Presentation Gallery Graphics Pictures
This is a statistics results ppt powerpoint presentation gallery graphics pictures. This is a two stage process. The stages in this process are business, finance, marketing, strategy, analysis.
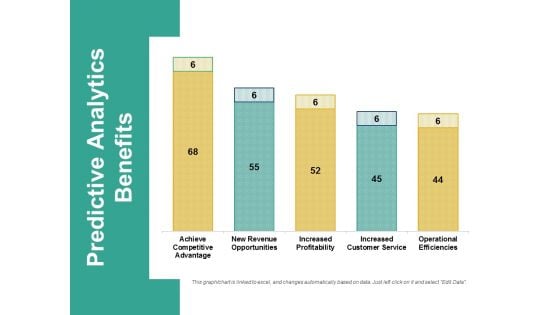
Predictive Analytics Benefits Ppt PowerPoint Presentation Professional Samples
This is a predictive analytics benefits ppt powerpoint presentation professional samples. This is a five stage process. The stages in this process are business, finance, marketing, strategy, analysis.
Bubble Chart Ppt PowerPoint Presentation Icon Gridlines
This is a bubble chart ppt powerpoint presentation icon gridlines. This is a two stage process. The stages in this process are bubble chart, finance, marketing, strategy, analysis.
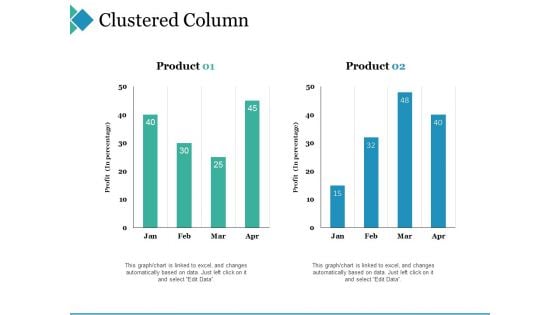
Clustered Column Ppt PowerPoint Presentation Gallery Microsoft
This is a clustered column ppt powerpoint presentation gallery microsoft. This is a two stage process. The stages in this process are clustered column, finance, marketing, strategy, analysis.
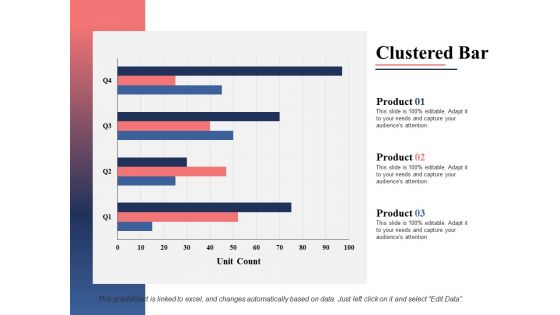
Clustered Bar Ppt PowerPoint Presentation Professional Guidelines
This is a clustered bar ppt powerpoint presentation professional guidelines. This is a three stage process. The stages in this process are clustered bar, finance, marketing, strategy, analysis.
Area Chart Ppt PowerPoint Presentation Icon Deck
This is a area chart ppt powerpoint presentation icon deck. This is a two stage process. The stages in this process are area chart, finance, marketing, strategy, business.
Bubble Chart Ppt PowerPoint Presentation Outline Icon
This is a bubble chart ppt powerpoint presentation outline icon. This is a two stage process. The stages in this process are bubble chart, finance, marketing, strategy, business.
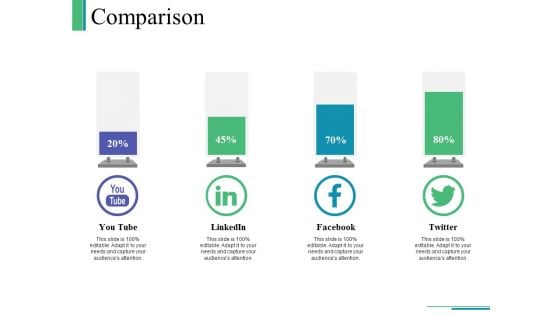
Comparison Ppt PowerPoint Presentation Inspiration Influencers
This is a comparison ppt powerpoint presentation inspiration influencers. This is a four stage process. The stages in this process are comparison, finance, icons, marketing, strategy, business.
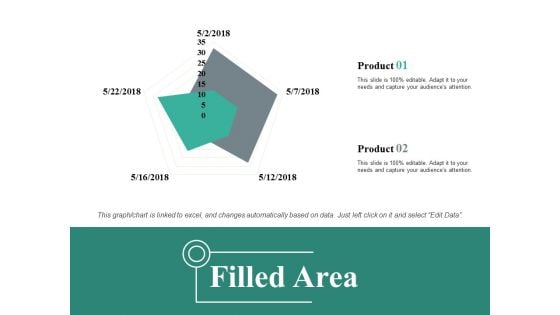
Filled Area Ppt PowerPoint Presentation Portfolio Gallery
This is a filled area ppt powerpoint presentation portfolio gallery. This is a two stage process. The stages in this process are filled area, business, marketing, finance, strategy.
Area Chart Ppt PowerPoint Presentation File Icons
This is a area chart ppt powerpoint presentation file icons. This is a two stage process. The stages in this process are area chart, finance, marketing, strategy, analysis.

Financial Ppt PowerPoint Presentation Model Format Ideas
This is a financial ppt powerpoint presentation model format ideas. This is a three stage process. The stages in this process are business, finance, marketing, strategy, analysis.
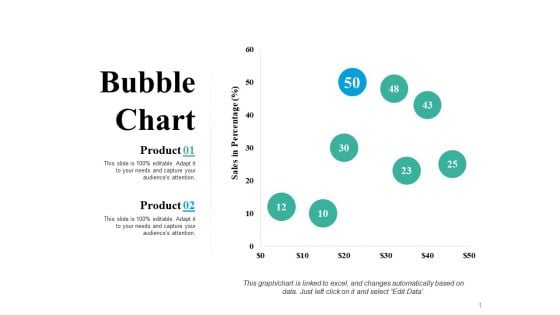
Bubble Chart Product Ppt PowerPoint Presentation Professional Model
This is a bubble chart product ppt powerpoint presentation professional model. This is two stage process. The stages in this process are bubble chart, finance, business, strategy, marketing.
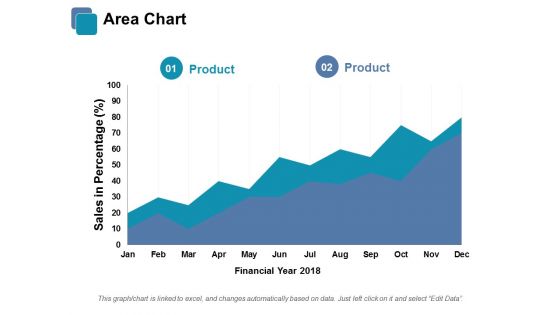
Area Chart Ppt PowerPoint Presentation Model Example
This is a area chart ppt powerpoint presentation model example. This is a two stage process. The stages in this process are area chart, finance, marketing, management, strategy.
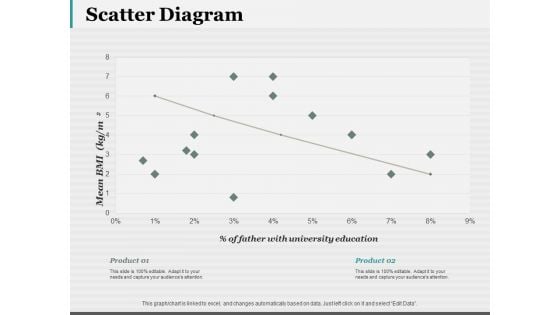
Scatter Diagram Ppt PowerPoint Presentation Model Mockup
This is a scatter diagram ppt powerpoint presentation model mockup. This is a two stage process. The stages in this process are scatter diagram, finance, marketing, strategy, business.
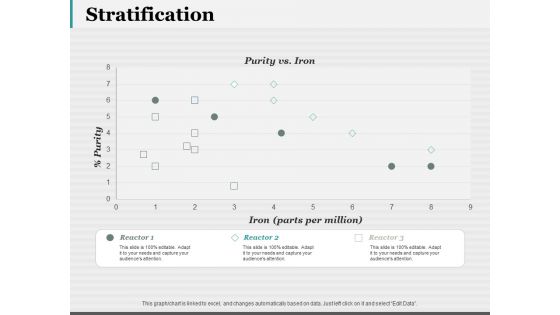
Stratification Ppt PowerPoint Presentation Gallery Graphics Download
This is a stratification ppt powerpoint presentation gallery graphics download. This is a three stage process. The stages in this process are business, finance, marketing, strategy, analysis.
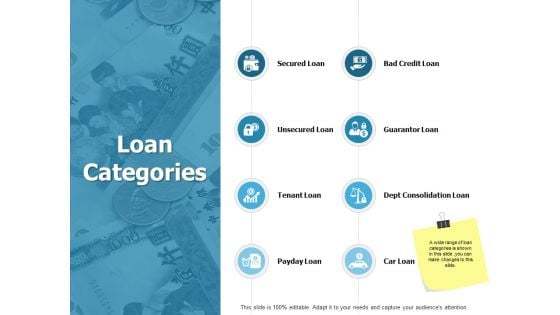
Loan Categories Ppt PowerPoint Presentation Gallery Infographic Template
This is a loan categories ppt powerpoint presentation gallery infographic template. This is a eight stage process. The stages in this process are finance, marketing, management, business, strategy.
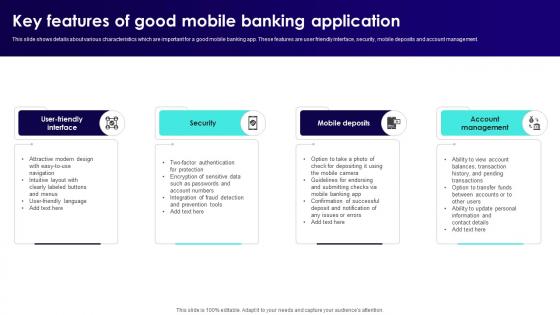
Wireless Banking To Improve Key Features Of Good Mobile Banking Application Fin SS V
This slide shows details about various characteristics which are important for a good mobile banking app. These features are user friendly interface, security, mobile deposits and account management. Create an editable Wireless Banking To Improve Key Features Of Good Mobile Banking Application Fin SS V that communicates your idea and engages your audience. Whether you are presenting a business or an educational presentation, pre-designed presentation templates help save time. Wireless Banking To Improve Key Features Of Good Mobile Banking Application Fin SS V is highly customizable and very easy to edit, covering many different styles from creative to business presentations. Slidegeeks has creative team members who have crafted amazing templates. So, go and get them without any delay. This slide shows details about various characteristics which are important for a good mobile banking app. These features are user friendly interface, security, mobile deposits and account management.
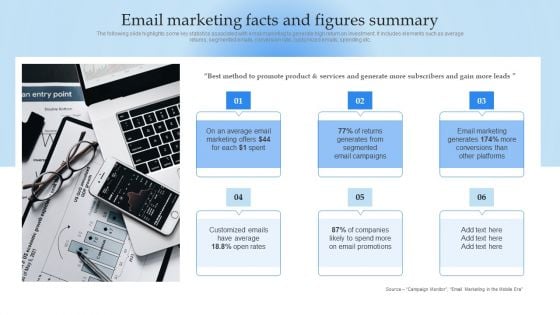
Mobile Promotion Strategic Guide For Micro Businesses Email Marketing Facts And Figures Summary Themes PDF
The following slide highlights some key statistics associated with email marketing to generate high return on investment. It includes elements such as average returns, segmented emails, conversion rate, customized emails, spending etc. Do you have to make sure that everyone on your team knows about any specific topic I yes, then you should give Mobile Promotion Strategic Guide For Micro Businesses Email Marketing Facts And Figures Summary Themes PDF a try. Our experts have put a lot of knowledge and effort into creating this impeccable Mobile Promotion Strategic Guide For Micro Businesses Email Marketing Facts And Figures Summary Themes PDF. You can use this template for your upcoming presentations, as the slides are perfect to represent even the tiniest detail. You can download these templates from the Slidegeeks website and these are easy to edit. So grab these today.
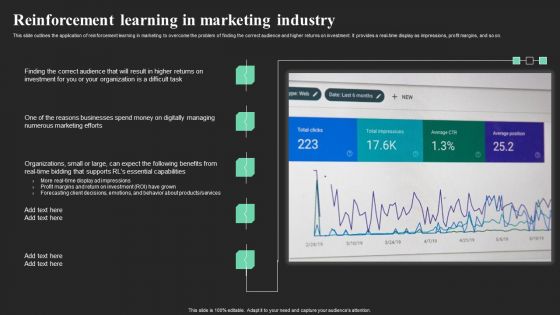
Reinforcement Learning In Marketing Industry Ppt Slides Example PDF
This slide outlines the application of reinforcement learning in marketing to overcome the problem of finding the correct audience and higher returns on investment. It provides a real-time display as impressions, profit margins, and so on. Present like a pro with Reinforcement Learning In Marketing Industry Ppt Slides Example PDF Create beautiful presentations together with your team, using our easy to use presentation slides. Share your ideas in real time and make changes on the fly by downloading our templates. So whether you are in the office, on the go, or in a remote location, you can stay in sync with your team and present your ideas with confidence. With Slidegeeks presentation got a whole lot easier. Grab these presentations today.
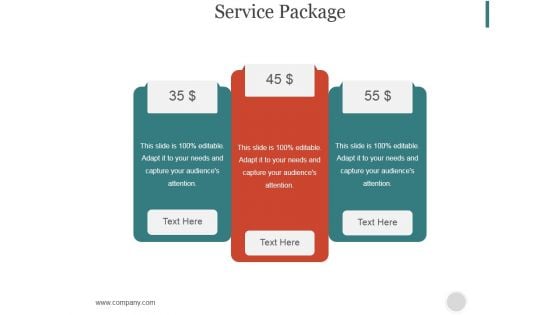
Service Package Slide Ppt PowerPoint Presentation Slide
This is a service package slide ppt powerpoint presentation slide. This is a three stage process. The stages in this process are business, marketing, strategy, finance, analysis.
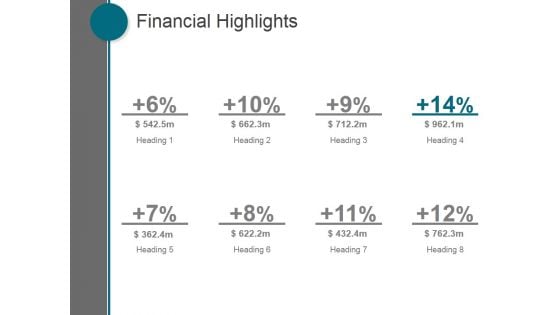
Financial Highlights Ppt PowerPoint Presentation Visual Aids
This is a financial highlights ppt powerpoint presentation visual aids. This is a eight stage process. The stages in this process are business, marketing, management, finance, strategy.
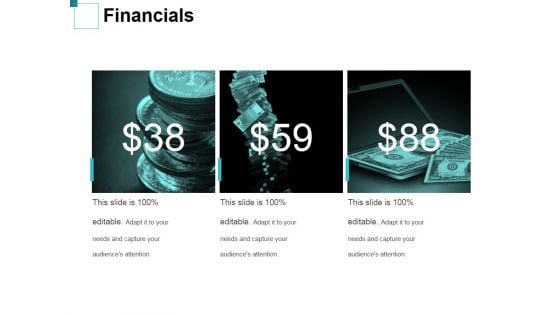
Financials Ppt PowerPoint Presentation Ideas Aids
This is a financials ppt powerpoint presentation ideas aids. This is a three stage process. The stages in this process are business, strategy, analysis, marketing, finance.
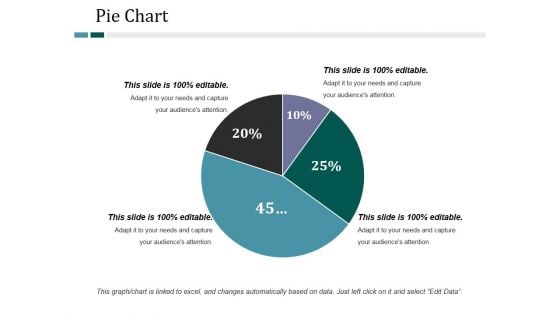
Pie Chart Ppt PowerPoint Presentation Ideas Microsoft
This is a pie chart ppt powerpoint presentation ideas microsoft. This is a four stage process. The stages in this process are pie chart, finance, marketing, strategy, business.
Pie Chart Ppt PowerPoint Presentation Outline Icons
This is a pie chart ppt powerpoint presentation outline icons. This is a three stage process. The stages in this process are pie chart, finance, marketing, strategy, business.
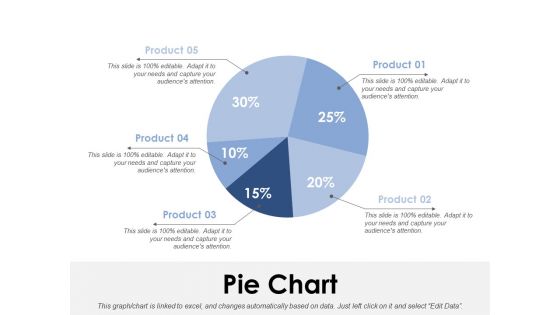
Pie Chart Ppt PowerPoint Presentation Outline Gallery
This is a pie chart ppt powerpoint presentation outline gallery. This is a five stage process. The stages in this process are pie chart, finance, marketing, strategy, analysis.
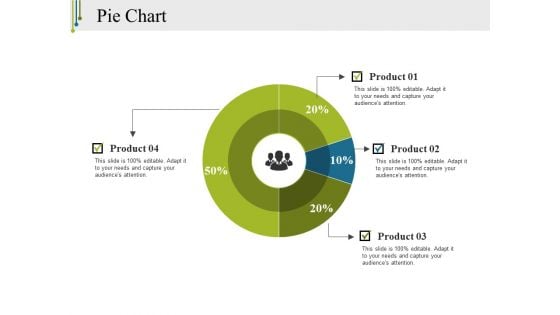
Pie Chart Ppt PowerPoint Presentation Infographics Clipart
This is a pie chart ppt powerpoint presentation infographics clipart. This is a four stage process. The stages in this process are pie chart, finance, marketing, strategy, business.

Overall Impacts Of Implementing Automation On Company Optimizing Automated Supply Chain And Logistics Graphics PDF
This slide covers the positive effects of automation on the overall business performance. It includes impacts on workforce efficiency, cost savings, return on investment, budget, bots in production, daily transactions, employees, operation, etc. This Overall Impacts Of Implementing Automation On Company Optimizing Automated Supply Chain And Logistics Graphics PDF is perfect for any presentation, be it in front of clients or colleagues. It is a versatile and stylish solution for organizing your meetings. The product features a modern design for your presentation meetings. The adjustable and customizable slides provide unlimited possibilities for acing up your presentation. Slidegeeks has done all the homework before launching the product for you. So, do not wait, grab the presentation templates today.
Key Financials Template Ppt PowerPoint Presentation Icon
This is a key financials template ppt powerpoint presentation icon. This is a three stage process. The stages in this process are business, finance, marketing, strategy, success, analysis.


 Continue with Email

 Home
Home


