It Change Management Kpis
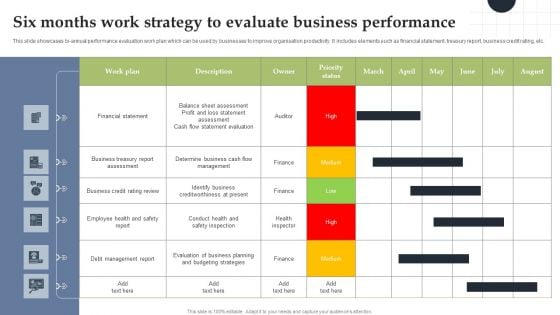
Six Months Work Strategy To Evaluate Business Performance Themes PDF
This slide showcases bi-annual performance evaluation work plan which can be used by businesses to improve organisation productivity. It includes elements such as financial statement, treasury report, business credit rating, etc. Pitch your topic with ease and precision using this Six Months Work Strategy To Evaluate Business Performance Themes PDF. This layout presents information on Financial Statement, Treasury Report, Business Credit Rating. It is also available for immediate download and adjustment. So, changes can be made in the color, design, graphics or any other component to create a unique layout.
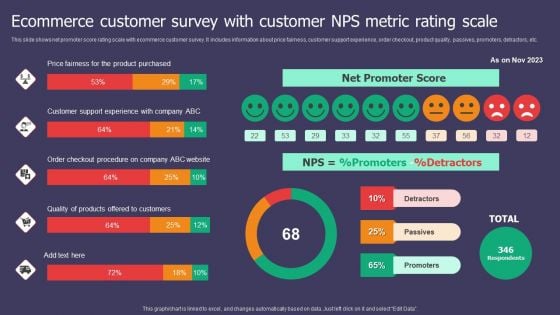
Ecommerce Customer Survey With Customer NPS Metric Rating Scale Ppt Inspiration Visual Aids PDF
This slide shows net promoter score rating scale with ecommerce customer survey. It includes information about price fairness, customer support experience, order checkout, product quality, passives, promoters, detractors, etc. Pitch your topic with ease and precision using this Ecommerce Customer Survey With Customer NPS Metric Rating Scale Ppt Inspiration Visual Aids PDF. This layout presents information on Net Promoter Score, Price Fairness, Product Purchased. It is also available for immediate download and adjustment. So, changes can be made in the color, design, graphics or any other component to create a unique layout.
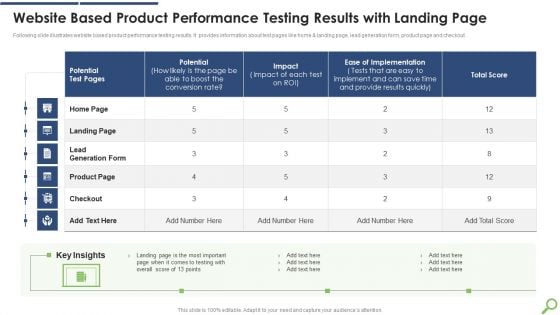
Website Based Product Performance Testing Results With Landing Page Mockup PDF
Following slide illustrates website based product performance testing results. It provides information about test pages like home and landing page, lead generation form, product page and checkout. Pitch your topic with ease and precision using this Website Based Product Performance Testing Results With Landing Page Mockup PDF This layout presents information on Provide Results, Potential Test, Ease Of Implementation It is also available for immediate download and adjustment. So, changes can be made in the color, design, graphics or any other component to create a unique layout.

Comparative Assessment Of Automation Tools For Procedure Enhancement Brochure PDF
The purpose of this slide is to compare various automation tools which can be used for operational process improvement. The key features of tools are AI assisted remediation, visual validation, customized dashboards, automated crash detection etc. Pitch your topic with ease and precision using this comparative assessment of automation tools for procedure enhancement brochure pdf. This layout presents information on comparative assessment of automation tools for procedure enhancement. It is also available for immediate download and adjustment. So, changes can be made in the color, design, graphics or any other component to create a unique layout.
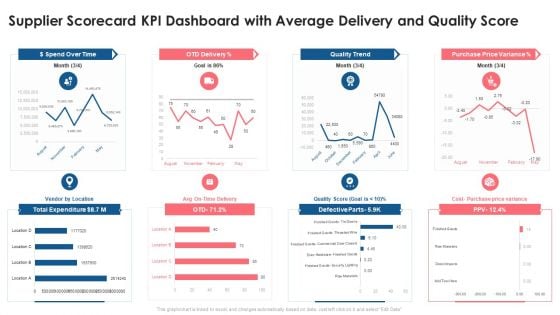
Supplier Scorecard Supplier Scorecard KPI Dashboard With Average Delivery And Quality Score Introduction PDF
This graph or chart is linked to excel, and changes automatically based on data. Just left click on it and select Edit Data. Deliver an awe inspiring pitch with this creative supplier scorecard supplier scorecard kpi dashboard with average delivery and quality score introduction pdf bundle. Topics like dollar spend over time, otd delivery, quality trend, purchase price variance, total expenditure can be discussed with this completely editable template. It is available for immediate download depending on the needs and requirements of the user.
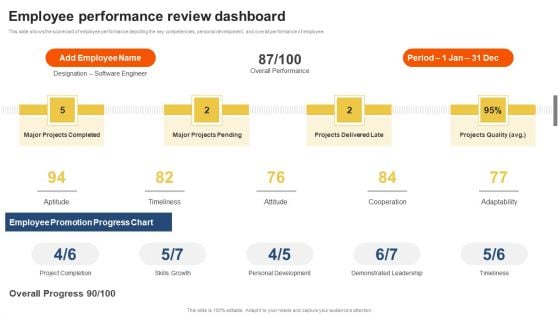
Staff Performance Evaluation Process Employee Performance Review Dashboard Information PDF
This slide shows the scorecard of employee performance depicting the key competencies, personal development, and overall performance of employee. Present like a pro with Staff Performance Evaluation Process Employee Performance Review Dashboard Information PDF Create beautiful presentations together with your team, using our easy to use presentation slides. Share your ideas in real time and make changes on the fly by downloading our templates. So whether you are in the office, on the go, or in a remote location, you can stay in sync with your team and present your ideas with confidence. With Slidegeeks presentation got a whole lot easier. Grab these presentations today.
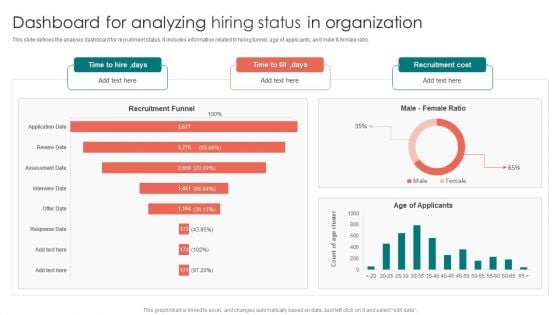
Dashboard For Analyzing Hiring Status In Organization Ppt PowerPoint Presentation Gallery Images PDF
This slide defines the analysis dashboard for recruitment status. It includes information related to hiring funnel, age of applicants, and male and female ratio. Pitch your topic with ease and precision using this Dashboard For Analyzing Hiring Status In Organization Ppt PowerPoint Presentation Gallery Images PDF. This layout presents information on Recruitment Funnel, Time To Hire, Age Applicants. It is also available for immediate download and adjustment. So, changes can be made in the color, design, graphics or any other component to create a unique layout.
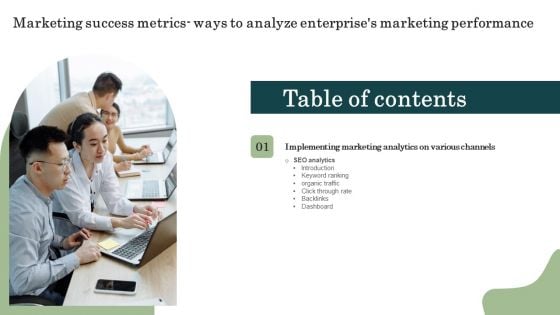
Table Of Contents Marketing Success Metrics Ways To Analyze Enterprises Marketing Performances Introduction PDF
Present like a pro with Table Of Contents Marketing Success Metrics Ways To Analyze Enterprises Marketing Performances Introduction PDF Create beautiful presentations together with your team, using our easy-to-use presentation slides. Share your ideas in real-time and make changes on the fly by downloading our templates. So whether youre in the office, on the go, or in a remote location, you can stay in sync with your team and present your ideas with confidence. With Slidegeeks presentation got a whole lot easier. Grab these presentations today.
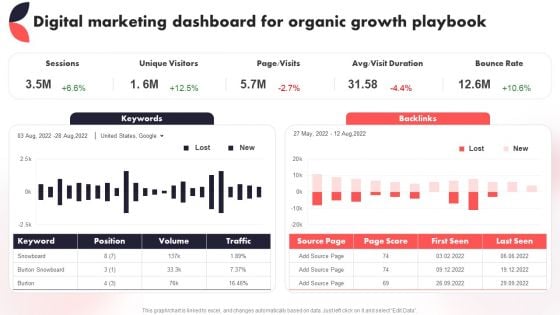
Digital Marketing Dashboard For Organic Growth Playbook Year Over Year Business Success Playbook Themes PDF
This Digital Marketing Dashboard For Organic Growth Playbook Year Over Year Business Success Playbook Themes PDF from Slidegeeks makes it easy to present information on your topic with precision. It provides customization options, so you can make changes to the colors, design, graphics, or any other component to create a unique layout. It is also available for immediate download, so you can begin using it right away. Slidegeeks has done good research to ensure that you have everything you need to make your presentation stand out. Make a name out there for a brilliant performance.
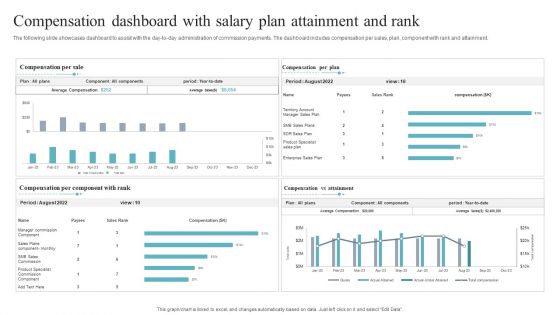
Compensation Dashboard With Salary Plan Attainment And Rank Slides PDF
The following slide showcases dashboard to assist with the day to day administration of commission payments. The dashboard includes compensation per sales, plan, component with rank and attainment. Pitch your topic with ease and precision using this Compensation Dashboard With Salary Plan Attainment And Rank Slides PDF. This layout presents information on Salary Plan Attainment Rank, Compensation Dashboard. It is also available for immediate download and adjustment. So, changes can be made in the color, design, graphics or any other component to create a unique layout.
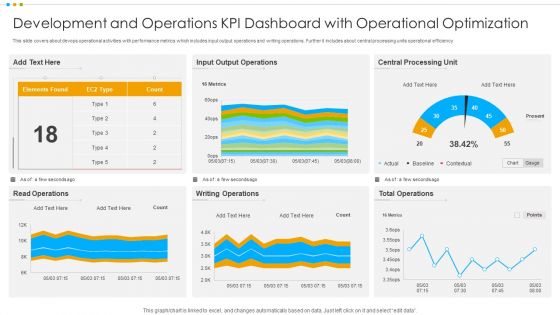
Development And Operations KPI Dashboard With Operational Optimization Pictures PDF
This slide covers about devops operational activities with performance metrics which includes input output operations and writing operations. Further it includes about central processing units operational efficiency.Pitch your topic with ease and precision using this Development And Operations KPI Dashboard With Operational Optimization Pictures PDF This layout presents information on Output Operations, Central Processing, Total Operations It is also available for immediate download and adjustment. So, changes can be made in the color, design, graphics or any other component to create a unique layout.
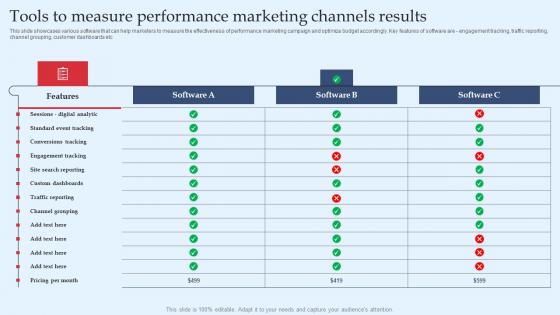
Strategic Performance Marketing Campaign Tools To Measure Performance Marketing Designs Pdf
This slide showcases various software that can help marketers to measure the effectiveness of performance marketing campaign and optimize budget accordingly. Key features of software are engagement tracking, traffic reporting, channel grouping, customer dashboards etc. Present like a pro with Strategic Performance Marketing Campaign Tools To Measure Performance Marketing Designs Pdf Create beautiful presentations together with your team, using our easy-to-use presentation slides. Share your ideas in real-time and make changes on the fly by downloading our templates. So whether you are in the office, on the go, or in a remote location, you can stay in sync with your team and present your ideas with confidence. With Slidegeeks presentation got a whole lot easier. Grab these presentations today. This slide showcases various software that can help marketers to measure the effectiveness of performance marketing campaign and optimize budget accordingly. Key features of software are engagement tracking, traffic reporting, channel grouping, customer dashboards etc.
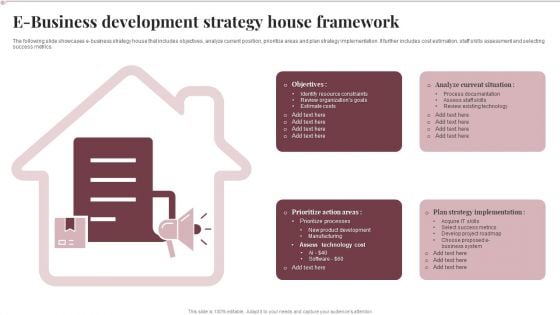
E Business Development Strategy House Framework Diagrams PDF
The following slide showcases e business strategy house that includes objectives, analyze current position, prioritize areas and plan strategy implementation. It further includes cost estimation, staff skills assessment and selecting success metrics. Pitch your topic with ease and precision using this E Business Development Strategy House Framework Diagrams PDF. This layout presents information on Prioritize Processes, Plan Strategy Implementation, Analyze Current Situation. It is also available for immediate download and adjustment. So, changes can be made in the color, design, graphics or any other component to create a unique layout.
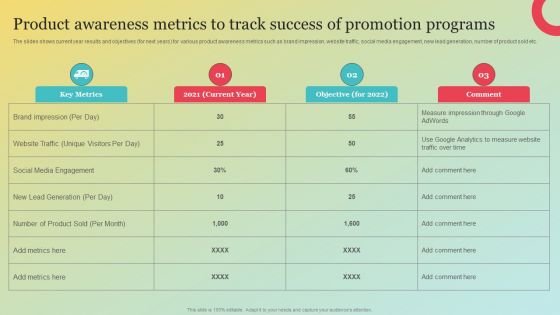
Product Awareness Metrics To Track Success Of Promotion Programs Ideas PDF
The slides shows current year results and objectives for next years for various product awareness metrics such as brand impression, website traffic, social media engagement, new lead generation, number of product sold etc. If your project calls for a presentation, then Slidegeeks is your go to partner because we have professionally designed, easy to edit templates that are perfect for any presentation. After downloading, you can easily edit Product Awareness Metrics To Track Success Of Promotion Programs Ideas PDF and make the changes accordingly. You can rearrange slides or fill them with different images. Check out all the handy templates.
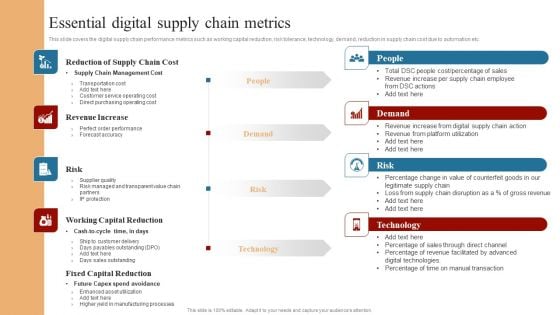
Strategies To Maintain Transportation Essential Digital Supply Chain Metrics Ppt Model Information PDF
This slide covers the digital supply chain performance metrics such as working capital reduction, risk tolerance, technology, demand, reduction in supply chain cost due to automation etc. If your project calls for a presentation, then Slidegeeks is your go-to partner because we have professionally designed, easy-to-edit templates that are perfect for any presentation. After downloading, you can easily edit Strategies To Maintain Transportation Essential Digital Supply Chain Metrics Ppt Model Information PDF and make the changes accordingly. You can rearrange slides or fill them with different images. Check out all the handy templates.
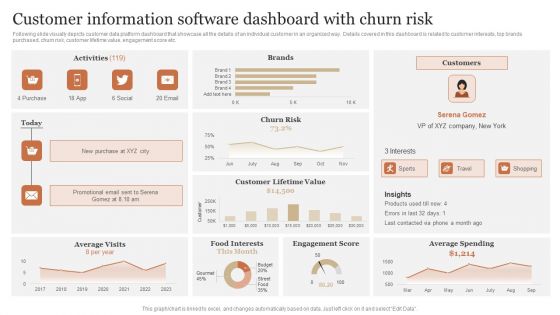
Customer Information Software Dashboard With Churn Risk Information PDF
Following slide visually depicts customer data platform dashboard that showcase all the details of an individual customer in an organized way. Details covered in this dashboard is related to customer interests, top brands purchased, churn risk, customer lifetime value, engagement score etc. Pitch your topic with ease and precision using this Customer Information Software Dashboard With Churn Risk Information PDF. This layout presents information on Customer Lifetime, Engagement Score, Average Spending. It is also available for immediate download and adjustment. So, changes can be made in the color, design, graphics or any other component to create a unique layout.
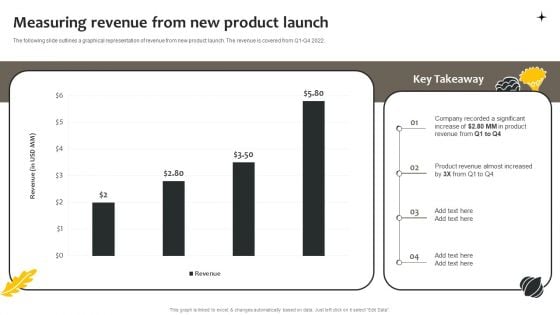
Effective Online And Offline Promotional Measuring Revenue From New Product Launch Template PDF
The following slide outlines a graphical representation of revenue from new product launch. The revenue is covered from Q1-Q4 2022. Present like a pro with Effective Online And Offline Promotional Measuring Revenue From New Product Launch Template PDF Create beautiful presentations together with your team, using our easy-to-use presentation slides. Share your ideas in real-time and make changes on the fly by downloading our templates. So whether youre in the office, on the go, or in a remote location, you can stay in sync with your team and present your ideas with confidence. With Slidegeeks presentation got a whole lot easier. Grab these presentations today.
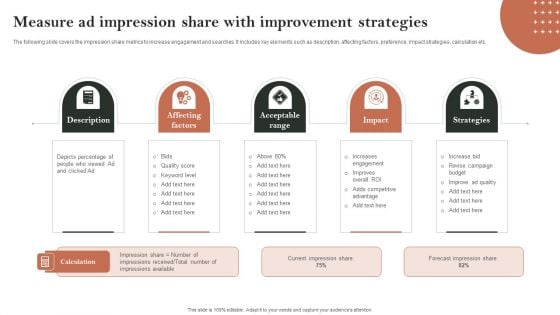
Search Engine Marketing Measure Ad Impression Share With Improvement Strategies Pictures PDF
Present like a pro with Search Engine Marketing Measure Ad Impression Share With Improvement Strategies Pictures PDF Create beautiful presentations together with your team, using our easy-to-use presentation slides. Share your ideas in real-time and make changes on the fly by downloading our templates. So whether youre in the office, on the go, or in a remote location, you can stay in sync with your team and present your ideas with confidence. With Slidegeeks presentation got a whole lot easier. Grab these presentations today.
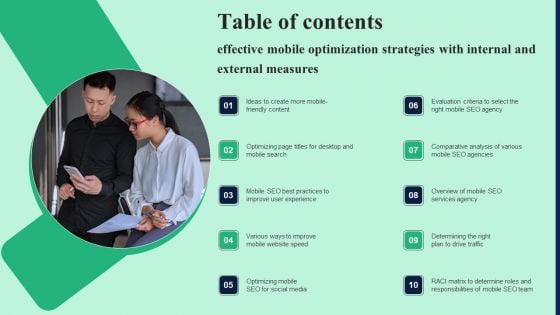
Table Of Contents Effective Mobile Optimization Strategies With Internal And External Measures Graphics PDF
Present like a pro with Table Of Contents Effective Mobile Optimization Strategies With Internal And External Measures Graphics PDF Create beautiful presentations together with your team, using our easy-to-use presentation slides. Share your ideas in real-time and make changes on the fly by downloading our templates. So whether you are in the office, on the go, or in a remote location, you can stay in sync with your team and present your ideas with confidence. With Slidegeeks presentation got a whole lot easier. Grab these presentations today.

How Various Generative AI Models Generative AI For Better Productivity AI SS V
This slide provides information regarding training procedure of various types of generative AI models such as transformer-based model training, GAN model training and diffusion model. This How Various Generative AI Models Generative AI For Better Productivity AI SS V from Slidegeeks makes it easy to present information on your topic with precision. It provides customization options, so you can make changes to the colors, design, graphics, or any other component to create a unique layout. It is also available for immediate download, so you can begin using it right away. Slidegeeks has done good research to ensure that you have everything you need to make your presentation stand out. Make a name out there for a brilliant performance. This slide provides information regarding training procedure of various types of generative AI models such as transformer-based model training, GAN model training and diffusion model.
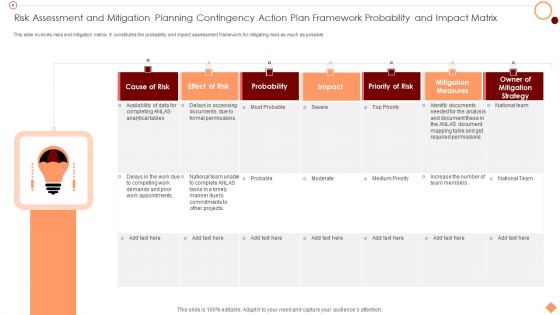
Risk Assessment And Mitigation Planning Contingency Action Plan Framework Probability And Impact Matrix Microsoft PDF
This slide involves risks and mitigation matrix. It constitutes the probability and impact assessment framework for mitigating risks as much as possible.Pitch your topic with ease and precision using this Risk Assessment And Mitigation Planning Contingency Action Plan Framework Probability And Impact Matrix Microsoft PDF. This layout presents information on Mitigation Measures, Priority Of Risk, Effect Of Risk. It is also available for immediate download and adjustment. So, changes can be made in the color, design, graphics or any other component to create a unique layout.
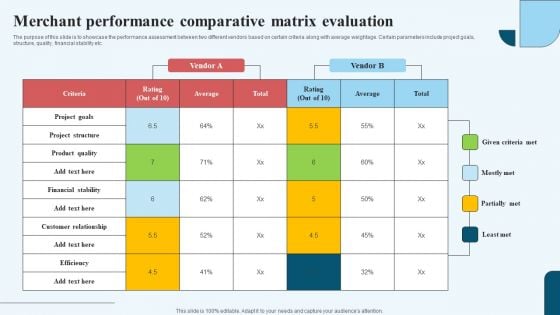
Merchant Performance Comparative Matrix Evaluation Sample PDF
The purpose of this slide is to showcase the performance assessment between two different vendors based on certain criteria along with average weightage. Certain parameters include project goals, structure, quality, financial stability etc. Pitch your topic with ease and precision using this Merchant Performance Comparative Matrix Evaluation Sample PDF. This layout presents information on Product Quality, Project Goals, Financial Stability. It is also available for immediate download and adjustment. So, changes can be made in the color, design, graphics or any other component to create a unique layout.
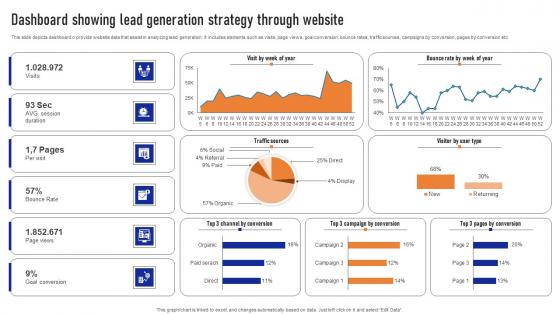
Dashboard Showing Lead Generation Strategy Through Website Ppt Infographic Template Rules Pdf
This slide depicts dashboard o provide website data that assist in analyzing lead generation. It includes elements such as visits, page views, goal conversion, bounce rates, traffic sources, campaigns by conversion, pages by conversion etc. Pitch your topic with ease and precision using this Dashboard Showing Lead Generation Strategy Through Website Ppt Infographic Template Rules Pdf. This layout presents information on Goal Conversion, Bounce Rates, Traffic Sources. It is also available for immediate download and adjustment. So, changes can be made in the color, design, graphics or any other component to create a unique layout. This slide depicts dashboard o provide website data that assist in analyzing lead generation. It includes elements such as visits, page views, goal conversion, bounce rates, traffic sources, campaigns by conversion, pages by conversion etc.
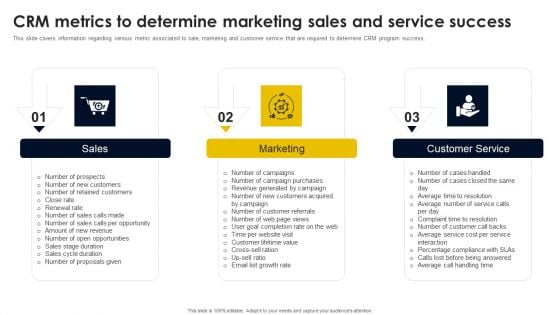
CRM Metrics To Determine Marketing Sales And Service Success Clipart PDF
This slide covers information regarding various metric associated to sale, marketing and customer service that are required to determine CRM program success. If your project calls for a presentation, then Slidegeeks is your go-to partner because we have professionally designed, easy-to-edit templates that are perfect for any presentation. After downloading, you can easily edit CRM Metrics To Determine Marketing Sales And Service Success Clipart PDF and make the changes accordingly. You can rearrange slides or fill them with different images. Check out all the handy templates
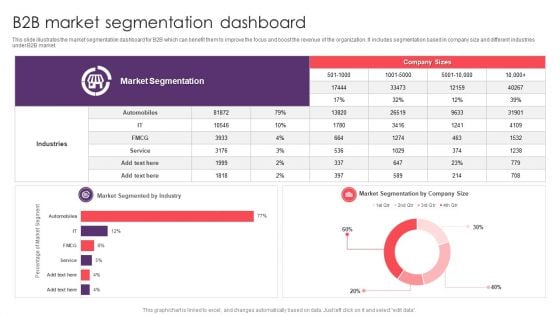
B2B Market Segmentation Dashboard Microsoft PDF
This slide illustrates the market segmentation dashboard for B2B which can benefit them to improve the focus and boost the revenue of the organization. It includes segmentation based in company size and different industries under B2B market. Pitch your topic with ease and precision using this B2B Market Segmentation Dashboard Microsoft PDF. This layout presents information on Industries, Market Segmentation, Service. It is also available for immediate download and adjustment. So, changes can be made in the color, design, graphics or any other component to create a unique layout.
Online Marketing Techniques Assessment Approach Content Performance Tracking Dashboard For Social Media Topics PDF
This Online Marketing Techniques Assessment Approach Content Performance Tracking Dashboard For Social Media Topics PDF from Slidegeeks makes it easy to present information on your topic with precision. It provides customization options, so you can make changes to the colors, design, graphics, or any other component to create a unique layout. It is also available for immediate download, so you can begin using it right away. Slidegeeks has done good research to ensure that you have everything you need to make your presentation stand out. Make a name out there for a brilliant performance.

Performance Analysis Using Operating Revenue Business Operational Expenditure And Income Metrics Diagrams PDF
This slide illustrates performance analysis using operating revenue, operating expenditure opex and income metrics which can be referred by organizations to evaluate their inflows and outflows to make relevant decisions for increasing profitability. It includes information about operating revenue, operating expense and income before taxes. Pitch your topic with ease and precision using this Performance Analysis Using Operating Revenue Business Operational Expenditure And Income Metrics Diagrams PDF. This layout presents information on Taxes, Highest Operating, Recorded. It is also available for immediate download and adjustment. So, changes can be made in the color, design, graphics or any other component to create a unique layout.
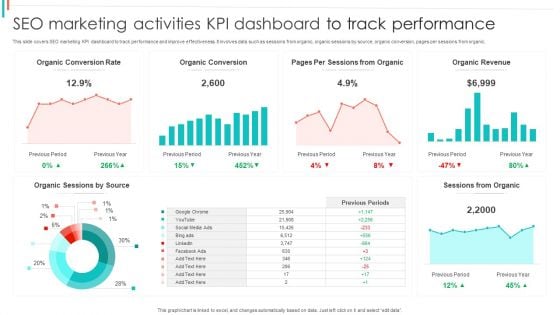
SEO Marketing Activities KPI Dashboard To Track Performance Brochure PDF
This slide covers SEO marketing KPI dashboard to track performance and improve effectiveness. It involves data such as sessions from organic, organic sessions by source, organic conversion, pages per sessions from organic.Pitch your topic with ease and precision using this SEO Marketing Activities KPI Dashboard To Track Performance Brochure PDF. This layout presents information on Organic Conversion, Sessions Organic, Organic Revenue. It is also available for immediate download and adjustment. So, changes can be made in the color, design, graphics or any other component to create a unique layout.
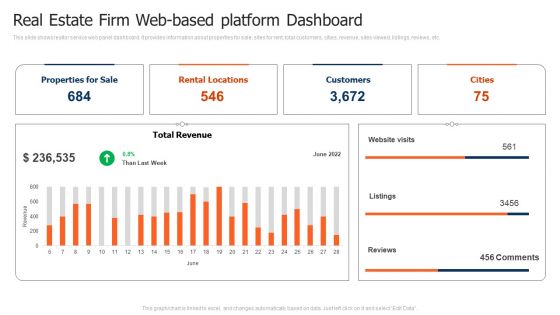
Real Estate Firm Web Based Platform Dashboard Background PDF
This slide shows realtor service web panel dashboard. It provides information about properties for sale, sites for rent, total customers, cities, revenue, sites viewed, listings, reviews, etc. Pitch your topic with ease and precision using this Real Estate Firm Web Based Platform Dashboard Background PDF. This layout presents information on Total Revenue, Rental Locations, Properties For Sale. It is also available for immediate download and adjustment. So, changes can be made in the color, design, graphics or any other component to create a unique layout.
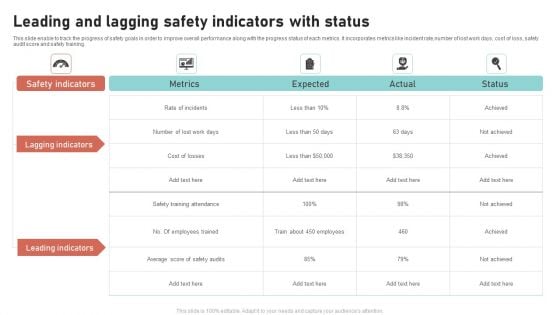
Leading And Lagging Safety Indicators With Status Slides PDF
This slide enable to track the progress of safety goals in order to improve overall performance along with the progress status of each metrics. It incorporates metrics like incident rate,number of lost work days, cost of loss, safety audit score and safety training. Pitch your topic with ease and precision using this Leading And Lagging Safety Indicators With Status Slides PDF. This layout presents information on Safety Indicators, Metrics, Expected, Lagging Indicators. It is also available for immediate download and adjustment. So, changes can be made in the color, design, graphics or any other component to create a unique layout.
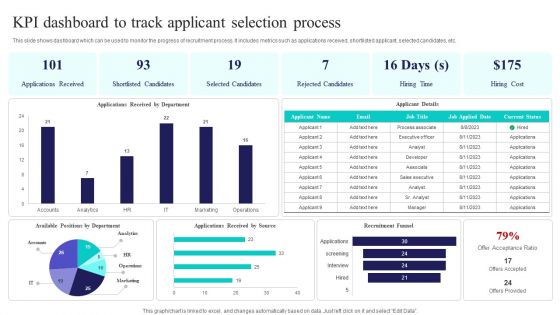
Kpi Dashboard To Track Applicant Selection Process Ppt PowerPoint Presentation File Graphics Template PDF
This slide shows dashboard which can be used to monitor the progress of recruitment process. It includes metrics such as applications received, shortlisted applicant, selected candidates, etc. Pitch your topic with ease and precision using this Kpi Dashboard To Track Applicant Selection Process Ppt PowerPoint Presentation File Graphics Template PDF. This layout presents information on Applications Received, Shortlisted Candidates, Selected Candidates. It is also available for immediate download and adjustment. So, changes can be made in the color, design, graphics or any other component to create a unique layout.
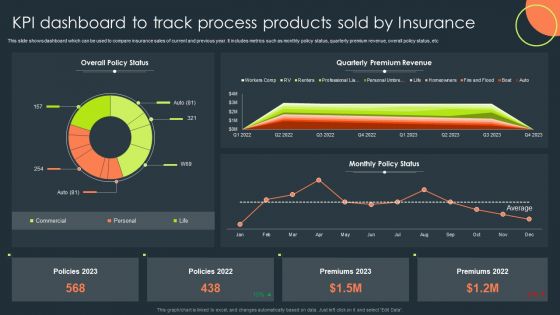
KPI Dashboard To Track Process Products Sold By Insurance Topics PDF
This slide shows dashboard which can be used to compare insurance sales of current and previous year. It includes metrics such as monthly policy status, quarterly premium revenue, overall policy status, etc. Pitch your topic with ease and precision using this KPI Dashboard To Track Process Products Sold By Insurance Topics PDF. This layout presents information on Overall Policy Status, Quarterly Premium Revenue, Monthly Policy Status. It is also available for immediate download and adjustment. So, changes can be made in the color, design, graphics or any other component to create a unique layout.
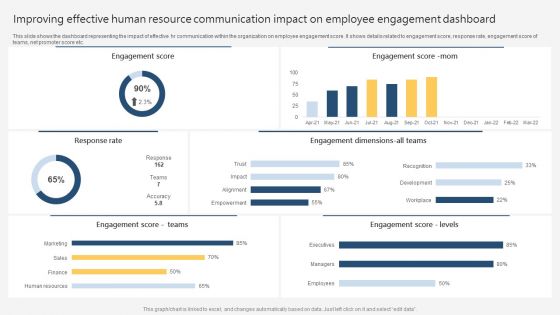
Improving Effective Human Resource Communication Impact On Employee Engagement Dashboard Slides PDF
This slide shows the dashboard representing the impact of effective hr communication within the organization on employee engagement score. It shows details related to engagement score, response rate, engagement score of teams, net promoter score etc. Pitch your topic with ease and precision using this Improving Effective Human Resource Communication Impact On Employee Engagement Dashboard Slides PDF. This layout presents information on Engagement Score, Response Rate, Engagement Score Levels. It is also available for immediate download and adjustment. So, changes can be made in the color, design, graphics or any other component to create a unique layout.
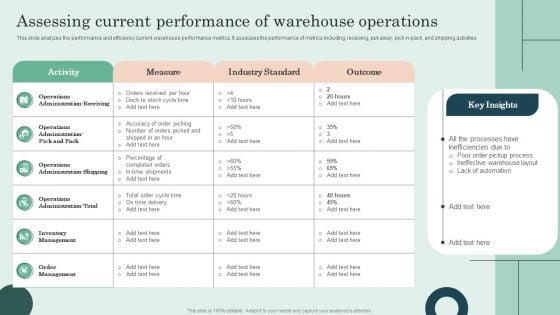
Assessing Current Performance Of Warehouse Operations Graphics PDF
This slide analyzes the performance and efficiency current warehouse performance metrics. It assesses the performance of metrics including, receiving, put-away, pick-n-pack, and shipping activities. Present like a pro with Assessing Current Performance Of Warehouse Operations Graphics PDF Create beautiful presentations together with your team, using our easy-to-use presentation slides. Share your ideas in real-time and make changes on the fly by downloading our templates. So whether you are in the office, on the go, or in a remote location, you can stay in sync with your team and present your ideas with confidence. With Slidegeeks presentation got a whole lot easier. Grab these presentations today.
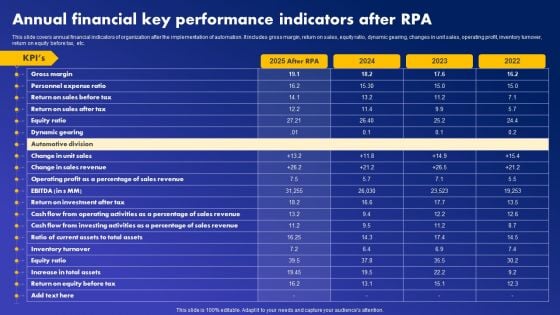
Annual Financial Key Performance Indicators After RPA Guidelines PDF
This slide covers annual financial indicators of organization after the implementation of automation. It includes gross margin, return on sales, equity ratio, dynamic gearing, changes in unit sales, operating profit, inventory turnover, return on equity before tax, etc. Create an editable Annual Financial Key Performance Indicators After RPA Guidelines PDF that communicates your idea and engages your audience. Whether you are presenting a business or an educational presentation, pre-designed presentation templates help save time. Annual Financial Key Performance Indicators After RPA Guidelines PDF is highly customizable and very easy to edit, covering many different styles from creative to business presentations. Slidegeeks has creative team members who have crafted amazing templates. So, go and get them without any delay.
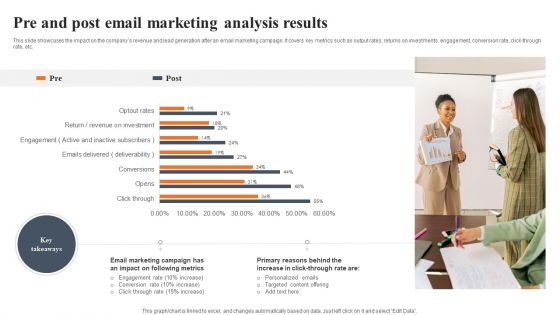
Pre And Post Email Marketing Analysis Results Slides PDF
This slide showcases the impact on the companys revenue and lead generation after an email marketing campaign. It covers key metrics such as output rates, returns on investments, engagement, conversion rate, click through rate, etc. Pitch your topic with ease and precision using this Pre And Post Email Marketing Analysis Results Slides PDF. This layout presents information on Email Marketing Campaign, Following Metrics, Targeted Content Offering. It is also available for immediate download and adjustment. So, changes can be made in the color, design, graphics or any other component to create a unique layout.
Business Event Return On Investment Tracking Tools And Metrics Portrait Pdf
The slide displays event ROI metrics and tools that aid in determining net value and costs contributing to an events success. It contains business goals such as brand awareness. Sales revenue, event engagement, recruitment etc. event goals, ROI metrics, ROI tools, etc. Pitch your topic with ease and precision using this Business Event Return On Investment Tracking Tools And Metrics Portrait Pdf This layout presents information on Building Brand Awareness, Driving Sales Revenue, Driving Recruitment It is also available for immediate download and adjustment. So, changes can be made in the color, design, graphics or any other component to create a unique layout. The slide displays event ROI metrics and tools that aid in determining net value and costs contributing to an events success. It contains business goals such as brand awareness. Sales revenue, event engagement, recruitment etc. event goals, ROI metrics, ROI tools, etc.
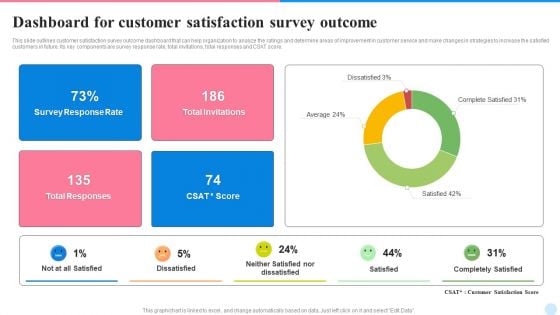
Dashboard For Customer Satisfaction Survey Outcome Demonstration PDF
This slide outlines customer satisfaction survey outcome dashboard that can help organization to analyze the ratings and determine areas of improvement in customer service and make changes in strategies to increase the satisfied customers in future. Its key components are survey response rate, total invitations, total responses and CSAT score. Showcasing this set of slides titled Dashboard For Customer Satisfaction Survey Outcome Demonstration PDF. The topics addressed in these templates are Total Invitations, Survey Response Rate, Total Responses. All the content presented in this PPT design is completely editable. Download it and make adjustments in color, background, font etc. as per your unique business setting.
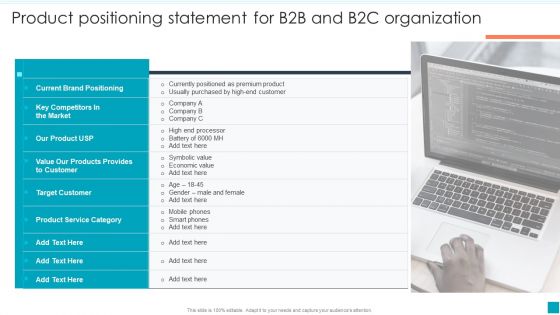
Product Positioning Statement Efficient B2B And B2C Marketing Techniques For Organization Information PDF
This Product Positioning Statement Efficient B2B And B2C Marketing Techniques For Organization Information PDF from Slidegeeks makes it easy to present information on your topic with precision. It provides customization options, so you can make changes to the colors, design, graphics, or any other component to create a unique layout. It is also available for immediate download, so you can begin using it right away. Slidegeeks has done good research to ensure that you have everything you need to make your presentation stand out. Make a name out there for a brilliant performance.
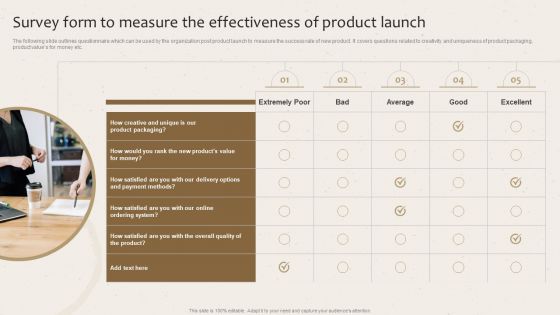
Survey Form To Measure The Effectiveness Of Product Launch Launching New Beverage Product Background PDF
The following slide outlines questionnaire which can be used by the organization post product launch to measure the success rate of new product. It covers questions related to creativity and uniqueness of product packaging, product values for money etc. If your project calls for a presentation, then Slidegeeks is your go-to partner because we have professionally designed, easy-to-edit templates that are perfect for any presentation. After downloading, you can easily edit Survey Form To Measure The Effectiveness Of Product Launch Launching New Beverage Product Background PDF and make the changes accordingly. You can rearrange slides or fill them with different images. Check out all the handy templates.
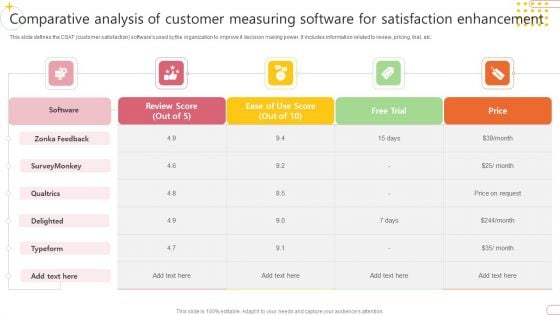
Comparative Analysis Of Customer Measuring Software For Satisfaction Enhancement Mockup PDF
This slide defines the CSAT customer satisfaction softwares used by the organization to improve it decision making power. It includes information related to review, pricing, trial, etc.Pitch your topic with ease and precision using this Comparative Analysis Of Customer Measuring Software For Satisfaction Enhancement Mockup PDF. This layout presents information on Comparative Analysis, Customer Measuring, Software Satisfaction. It is also available for immediate download and adjustment. So, changes can be made in the color, design, graphics or any other component to create a unique layout.
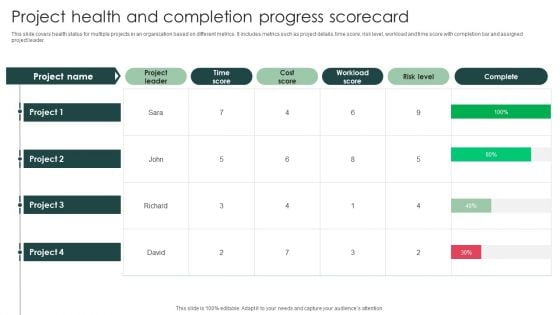
Project Health And Completion Progress Scorecard Designs PDF
This slide covers health status for multiple projects in an organization based on different metrics. It includes metrics such as project details, time score, risk level, workload and time score with completion bar and assigned project leader.Pitch your topic with ease and precision using this Project Health And Completion Progress Scorecard Designs PDF. This layout presents information on Project Leader, Workload Score, Cost Score. It is also available for immediate download and adjustment. So, changes can be made in the color, design, graphics or any other component to create a unique layout.
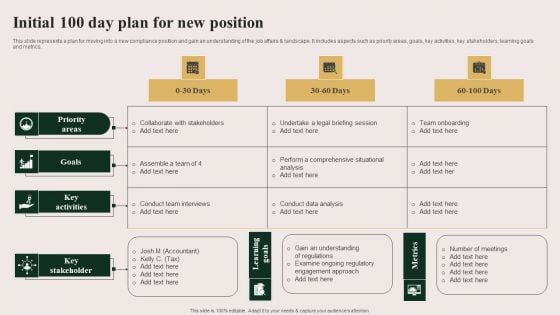
Initial 100 Day Plan For New Position Rules PDF
This slide represents a plan for moving into a new compliance position and gain an understanding of the job affairs and landscape. It includes aspects such as priority areas, goals, key activities, key stakeholders, learning goals and metrics. Pitch your topic with ease and precision using this Initial 100 Day Plan For New Position Rules PDF. This layout presents information on Priority Areas, Goals, Key Activities. It is also available for immediate download and adjustment. So, changes can be made in the color, design, graphics or any other component to create a unique layout.
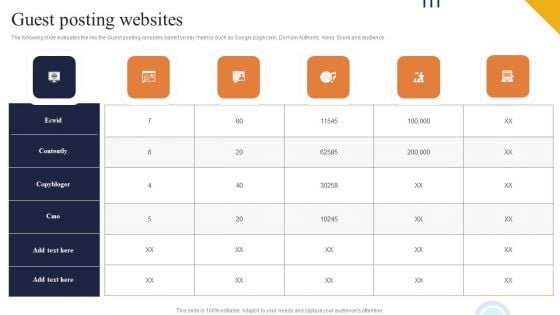
Guest Posting Websites Ppt PowerPoint Presentation File Styles PDF
The following slide evaluates the key the Guest posting variables based on key metrics such as Google page rank, Domain Authority, Alexa Score and audience. Present like a pro with Guest Posting Websites Ppt PowerPoint Presentation File Styles PDF Create beautiful presentations together with your team, using our easy to use presentation slides. Share your ideas in real time and make changes on the fly by downloading our templates. So whether you are in the office, on the go, or in a remote location, you can stay in sync with your team and present your ideas with confidence. With Slidegeeks presentation got a whole lot easier. Grab these presentations today.
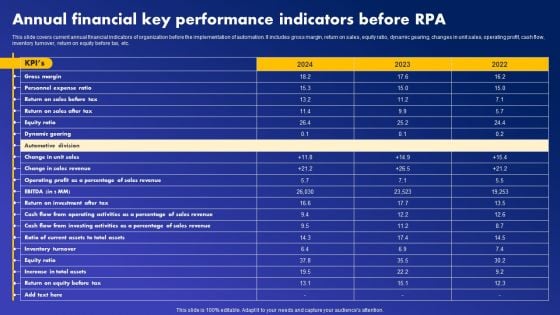
Annual Financial Key Performance Indicators Before RPA Download PDF
This slide covers current annual financial indicators of organization before the implementation of automation. It includes gross margin, return on sales, equity ratio, dynamic gearing, changes in unit sales, operating profit, cash flow, inventory turnover, return on equity before tax, etc. Slidegeeks is one of the best resources for PowerPoint templates. You can download easily and regulate Annual Financial Key Performance Indicators Before RPA Download PDF for your personal presentations from our wonderful collection. A few clicks is all it takes to discover and get the most relevant and appropriate templates. Use our Templates to add a unique zing and appeal to your presentation and meetings. All the slides are easy to edit and you can use them even for advertisement purposes.

Home Insurance Analytics Statistics With Settlement Time Dashboard Ideas PDF
This slide illustrates home insurance facts and figures of the organization. It includes monthly claim volume, claim status, average notification time, acknowledged time, decision time etc. Pitch your topic with ease and precision using this Home Insurance Analytics Statistics With Settlement Time Dashboard Ideas PDF. This layout presents information on Average Acknowledged Time, Average Decision Time, Average Lead Time. It is also available for immediate download and adjustment. So, changes can be made in the color, design, graphics or any other component to create a unique layout.
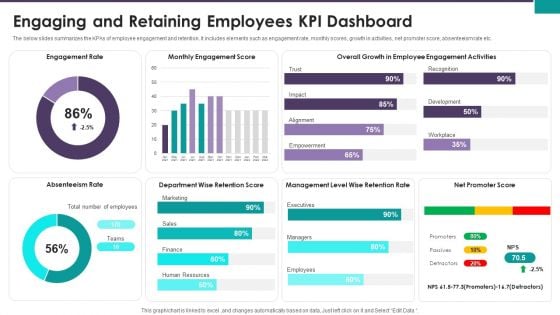
Engaging And Retaining Employees KPI Dashboard Ppt Slides Show PDF
The below slides summarizes the KPAs of employee engagement and retention. It includes elements such as engagement rate, monthly scores, growth in activities, net promoter score, absenteeism rate etc. Pitch your topic with ease and precision using this Engaging And Retaining Employees KPI Dashboard Ppt Slides Show PDF. This layout presents information on Engagement Rate Monthly, Engagement Score Overall, Growth Employee Engagement. It is also available for immediate download and adjustment. So, changes can be made in the color, design, graphics or any other component to create a unique layout.
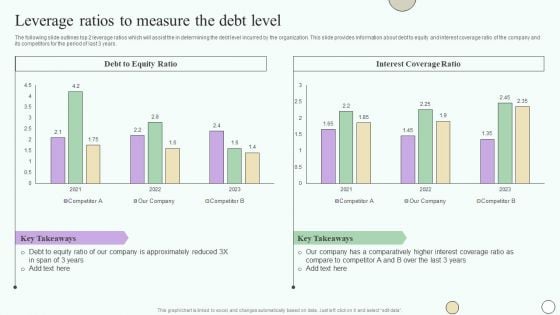
Estimating Business Overall Leverage Ratios To Measure The Debt Level Professional PDF
The following slide outlines top 2 leverage ratios which will assist the in determining the debt level incurred by the organization. This slide provides information about debt to equity and interest coverage ratio of the company and its competitors for the period of last 3 years. If your project calls for a presentation, then Slidegeeks is your go-to partner because we have professionally designed, easy-to-edit templates that are perfect for any presentation. After downloading, you can easily edit Estimating Business Overall Leverage Ratios To Measure The Debt Level Professional PDF and make the changes accordingly. You can rearrange slides or fill them with different images. Check out all the handy templates.
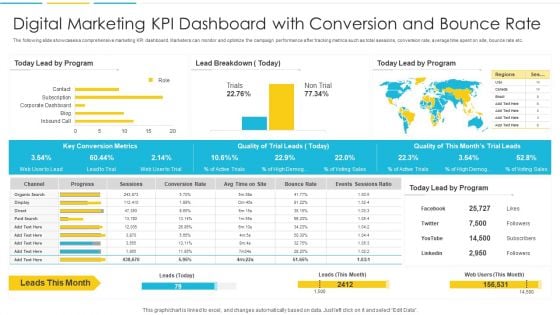
Digital Marketing KPI Dashboard With Conversion And Bounce Rate Introduction PDF
The following slide showcases a comprehensive marketing KPI dashboard. Marketers can monitor and optimize the campaign performance after tracking metrics such as total sessions, conversion rate, average time spent on site, bounce rate etc. Pitch your topic with ease and precision using this Digital Marketing KPI Dashboard With Conversion And Bounce Rate Introduction PDF. This layout presents information on Organic, Progress, Conversion Rate. It is also available for immediate download and adjustment. So, changes can be made in the color, design, graphics or any other component to create a unique layout
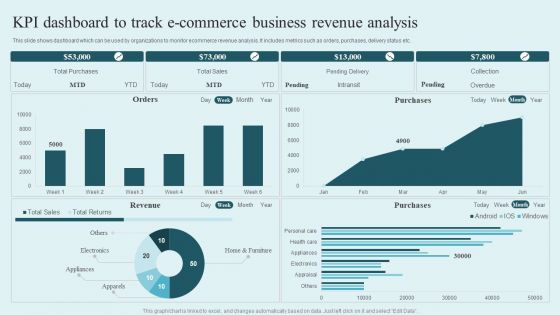
KPI Dashboard To Track E Commerce Business Revenue Analysis Rules PDF
This slide shows dashboard which can be used by organizations to monitor ecommerce revenue analysis. It includes metrics such as orders, purchases, delivery status etc. Pitch your topic with ease and precision using this KPI Dashboard To Track E Commerce Business Revenue Analysis Rules PDF. This layout presents information on Total Purchases, Total Sales, Pending Delivery, Collection. It is also available for immediate download and adjustment. So, changes can be made in the color, design, graphics or any other component to create a unique layout.
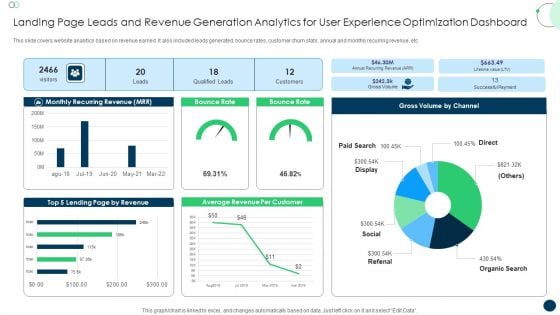
Landing Page Leads And Revenue Generation Analytics For User Experience Optimization Dashboard Formats PDF
This slide covers website analytics based on revenue earned. It also included leads generated, bounce rates, customer churn stats, annual and monthly recurring revenue, etc. Pitch your topic with ease and precision using this Landing Page Leads And Revenue Generation Analytics For User Experience Optimization Dashboard Formats PDF. This layout presents information on Monthly Recurring Revenue, Bounce Rate, Gross Volume. It is also available for immediate download and adjustment. So, changes can be made in the color, design, graphics or any other component to create a unique layout.
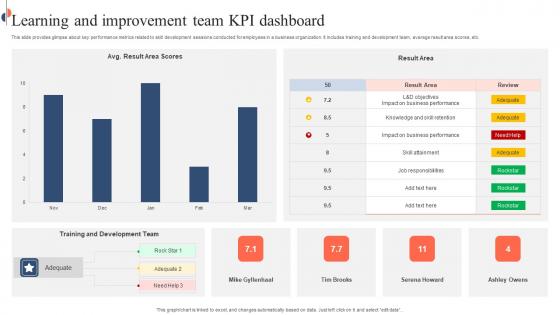
Learning And Improvement Team KPI Dashboard Slides Pdf
This slide provides glimpse about key performance metrics related to skill development sessions conducted for employees in a business organization. It includes training and development team, average result area scores, etc. Pitch your topic with ease and precision using this Learning And Improvement Team KPI Dashboard Slides Pdf. This layout presents information on Learning And Improvement Team, KPI Dashboard, Development Team. It is also available for immediate download and adjustment. So, changes can be made in the color, design, graphics or any other component to create a unique layout. This slide provides glimpse about key performance metrics related to skill development sessions conducted for employees in a business organization. It includes training and development team, average result area scores, etc.

Skill Enhancement Performance Need For Employees Performance Assessment Operation Department
This slide illustrate various need why we should conduct employees performance assessment for operation department to improve product quality. It includes needs such as make efficiency and productivity levels, control quality and assurance etc. Present like a pro with Skill Enhancement Performance Need For Employees Performance Assessment Operation Department. Create beautiful presentations together with your team, using our easy-to-use presentation slides. Share your ideas in real-time and make changes on the fly by downloading our templates. So whether you are in the office, on the go, or in a remote location, you can stay in sync with your team and present your ideas with confidence. With Slidegeeks presentation got a whole lot easier. Grab these presentations today. This slide illustrate various need why we should conduct employees performance assessment for operation department to improve product quality. It includes needs such as make efficiency and productivity levels, control quality and assurance etc.
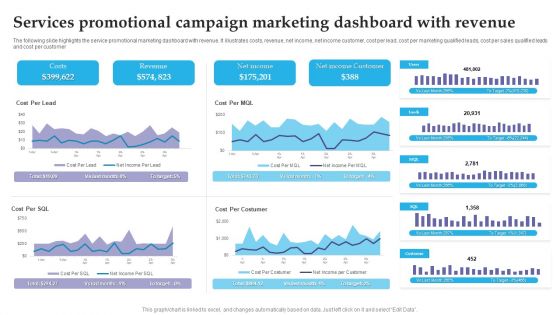
Services Promotional Campaign Marketing Dashboard With Revenue Brochure PDF
The following slide highlights the service promotional marketing dashboard with revenue. It illustrates costs, revenue, net income, net income customer, cost per lead, cost per marketing qualified leads, cost per sales qualified leads and cost per customer. Pitch your topic with ease and precision using this Services Promotional Campaign Marketing Dashboard With Revenue Brochure PDF. This layout presents information on Costs, Revenue, Net Income. It is also available for immediate download and adjustment. So, changes can be made in the color, design, graphics or any other component to create a unique layout.
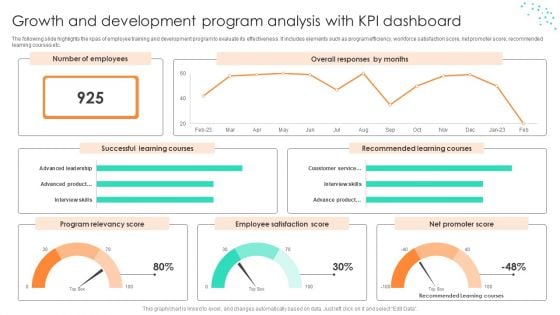
Growth And Development Program Analysis With KPI Dashboard Structure PDF
The following slide highlights the kpas of employee training and development program to evaluate its effectiveness. It includes elements such as program efficiency, workforce satisfaction score, net promoter score, recommended learning courses etc. Pitch your topic with ease and precision using this Growth And Development Program Analysis With KPI Dashboard Structure PDF. This layout presents information on Analysis With KPI Dashboard, Growth And Development Program. It is also available for immediate download and adjustment. So, changes can be made in the color, design, graphics or any other component to create a unique layout.
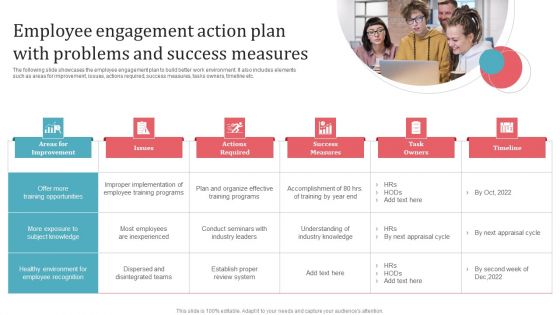
Employee Engagement Action Plan With Problems And Success Measures Summary PDF
The following slide showcases the employee engagement plan to build better work environment. It also includes elements such as areas for improvement, issues, actions required, success measures, tasks owners, timeline etc. Pitch your topic with ease and precision using this Employee Engagement Action Plan With Problems And Success Measures Summary PDF. This layout presents information on Areas Improvement, Actions Required, Task Owners. It is also available for immediate download and adjustment. So, changes can be made in the color, design, graphics or any other component to create a unique layout.
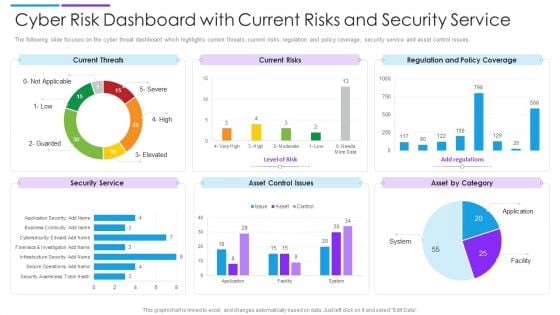
Cyber Risk Dashboard With Current Risks And Security Service Formats PDF
The following slide focuses on the cyber threat dashboard which highlights current threats, current risks, regulation and policy coverage, security service and asset control issues. Pitch your topic with ease and precision using this cyber risk dashboard with current risks and security service formats pdf. This layout presents information on current threats, current risks, regulation and policy coverage. It is also available for immediate download and adjustment. So, changes can be made in the color, design, graphics or any other component to create a unique layout.
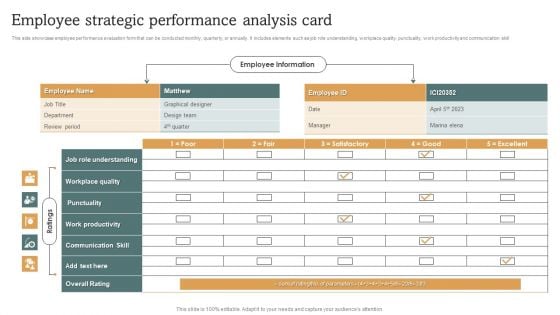
Employee Strategic Performance Analysis Card Information PDF
This side showcase employee performance evaluation form that can be conducted monthly, quarterly, or annually. It includes elements such as job role understanding, workplace quality, punctuality, work productivity and communication skill. Pitch your topic with ease and precision using this Employee Strategic Performance Analysis Card Information PDF. This layout presents information on Workplace Quality, Communication Skill, Employee. It is also available for immediate download and adjustment. So, changes can be made in the color, design, graphics or any other component to create a unique layout.
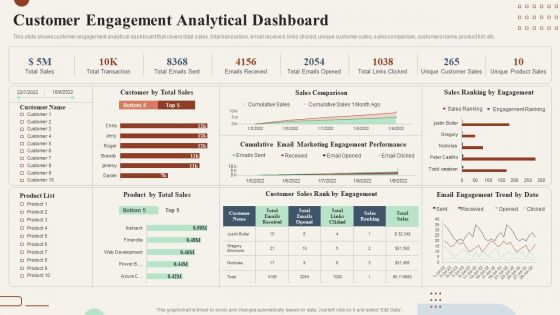
Action Plan To Enhance Customer Engagement Analytical Dashboard Elements PDF
This slide shows customer engagement analytical dashboard that covers total sales, total transaction, email received, links clicked, unique customer sales, sales comparison, customers name, product list. Present like a pro with Action Plan To Enhance Customer Engagement Analytical Dashboard Elements PDF Create beautiful presentations together with your team, using our easy-to-use presentation slides. Share your ideas in real-time and make changes on the fly by downloading our templates. So whether youre in the office, on the go, or in a remote location, you can stay in sync with your team and present your ideas with confidence. With Slidegeeks presentation got a whole lot easier. Grab these presentations today.
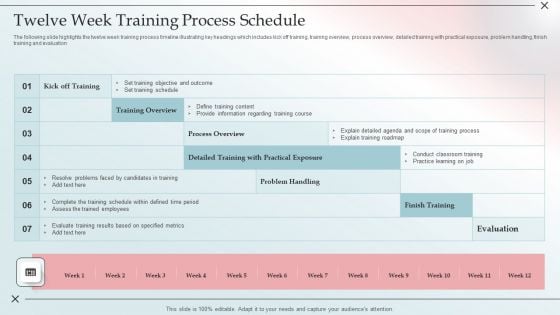
Twelve Week Training Process Schedule Infographics PDF
The following slide highlights the twelve week training process timeline illustrating key headings which includes kick off training, training overview, process overview, detailed training with practical exposure, problem handling, finish training and evaluation Pitch your topic with ease and precision using this Twelve Week Training Process Schedule Infographics PDF. This layout presents information on Evaluation, Training Process, Specified Metrics. It is also available for immediate download and adjustment. So, changes can be made in the color, design, graphics or any other component to create a unique layout.


 Continue with Email

 Home
Home


