It Operations Dashboard
Tracking The Cashflow Improvements With Cash Management Dashboard Download PDF
This slide showcases the KPIs that would help our business organization to track the improvements in the new cash management process. It includes quick ratio, cash balance, current ratio, days inventory outstanding, etc.Take your projects to the next level with our ultimate collection of Tracking The Cashflow Improvements With Cash Management Dashboard Download PDF. Slidegeeks has designed a range of layouts that are perfect for representing task or activity duration, keeping track of all your deadlines at a glance. Tailor these designs to your exact needs and give them a truly corporate look with your own brand colors they all make your projects stand out from the rest.
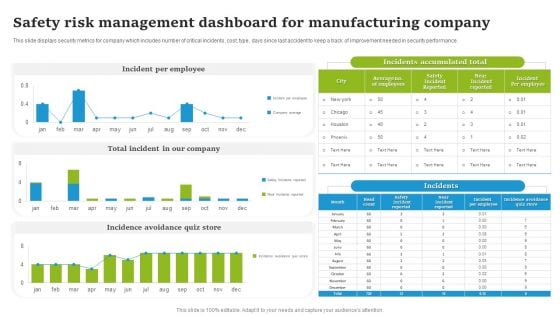
Safety Risk Management Dashboard For Manufacturing Company Introduction PDF
This slide displays security metrics for company which includes number of critical incidents, cost, type, days since last accident to keep a track of Improvement needed in security performance. Showcasing this set of slides titled Safety Risk Management Dashboard For Manufacturing Company Introduction PDF. The topics addressed in these templates are Incident Per Employee, Total Incident Our Company, Incidence Avoidance Quiz Store. All the content presented in this PPT design is completely editable. Download it and make adjustments in color, background, font etc. as per your unique business setting.
Sales Techniques Playbook Sales Management Activities Tracking Dashboard Introduction PDF
This slide provides information regarding various metrics catered to track sales team performance in terms of average revenue per account, win rate, NPS, along with sales representative performance tracking through number of opportunities created, lead response time, etc. Deliver an awe inspiring pitch with this creative sales techniques playbook sales management activities tracking dashboard introduction pdf bundle. Topics like growth, sales can be discussed with this completely editable template. It is available for immediate download depending on the needs and requirements of the user.
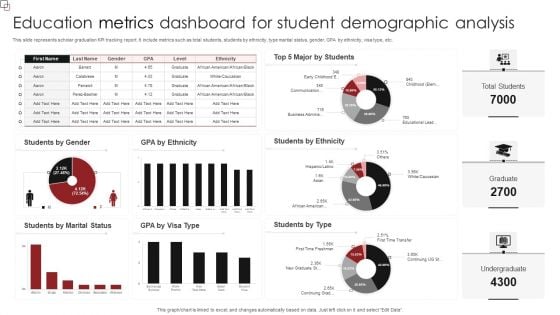
Education Metrics Dashboard For Student Demographic Analysis Diagrams PDF
This slide represents scholar graduation KPI tracking report. It include metrics such as total students, students by ethnicity, type marital status, gender, GPA by ethnicity, visa type, etc. Showcasing this set of slides titled Education Metrics Dashboard For Student Demographic Analysis Diagrams PDF. The topics addressed in these templates are Students Ethnicity, Students Type, Students Marital Status. All the content presented in this PPT design is completely editable. Download it and make adjustments in color, background, font etc. as per your unique business setting.
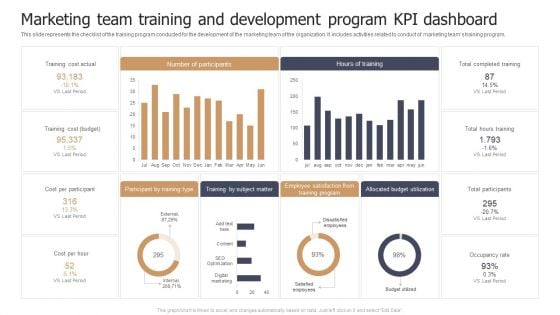
Marketing Team Training And Development Program KPI Dashboard Designs PDF
This slide represents the checklist of the training program conducted for the development of the marketing team of the organization. It includes activities related to conduct of marketing teams training program. Pitch your topic with ease and precision using this Marketing Team Training And Development Program KPI Dashboard Designs PDF. This layout presents information on Training Cost Actual, Cost Per Participant, Cost Per Hour. It is also available for immediate download and adjustment. So, changes can be made in the color, design, graphics or any other component to create a unique layout.
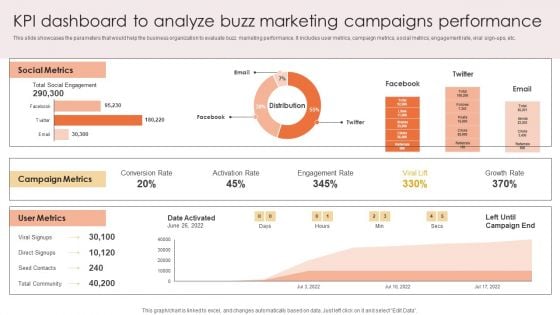
Kpi Dashboard To Analyze Buzz Marketing Campaigns Performance Download PDF
This slide showcases the parameters that would help the business organization to evaluate buzz marketing performance. It includes user metrics, campaign metrics, social metrics, engagement rate, viral sign-ups, etc. Take your projects to the next level with our ultimate collection of Kpi Dashboard To Analyze Buzz Marketing Campaigns Performance Download PDF. Slidegeeks has designed a range of layouts that are perfect for representing task or activity duration, keeping track of all your deadlines at a glance. Tailor these designs to your exact needs and give them a truly corporate look with your own brand colors they will make your projects stand out from the rest.
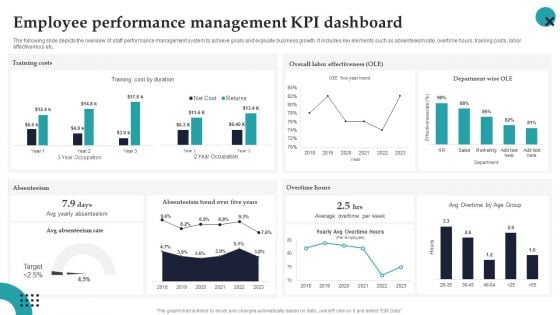
Employee Performance Management Kpi Dashboard Employee Performance Management Portrait PDF
The following slide depicts the overview of staff performance management system to achieve goals and evaluate business growth. It includes key elements such as absenteeism rate, overtime hours, training costs, labor effectiveness etc. Present like a pro with Employee Performance Management Kpi Dashboard Employee Performance Management Portrait PDF Create beautiful presentations together with your team, using our easy-to-use presentation slides. Share your ideas in real-time and make changes on the fly by downloading our templates. So whether you are in the office, on the go, or in a remote location, you can stay in sync with your team and present your ideas with confidence. With Slidegeeks presentation got a whole lot easier. Grab these presentations today.
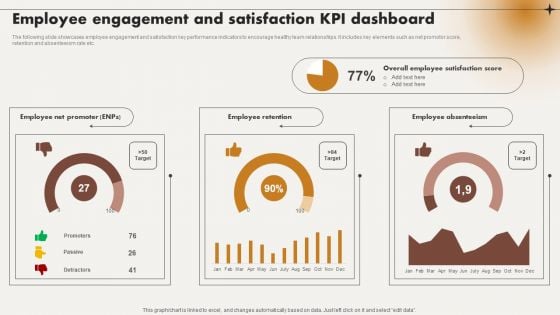
Employee Engagement And Satisfaction Kpi Dashboard Ppt Model Layouts PDF
The following slide showcases employee engagement and satisfaction key performance indicators to encourage healthy team relationships. It includes key elements such as net promotor score, retention and absenteeism rate etc. Do you know about Slidesgeeks Employee Engagement And Satisfaction Kpi Dashboard Ppt Model Layouts PDF These are perfect for delivering any kind od presentation. Using it, create PowerPoint presentations that communicate your ideas and engage audiences. Save time and effort by using our pre designed presentation templates that are perfect for a wide range of topic. Our vast selection of designs covers a range of styles, from creative to business, and are all highly customizable and easy to edit. Download as a PowerPoint template or use them as Google Slides themes.

Human Resource Analytics Dashboard Employee Ppt PowerPoint Presentation Complete Deck
Improve your presentation delivery using this human resource analytics dashboard employee ppt powerpoint presentation complete deck. Support your business vision and objectives using this well-structured PPT deck. This template offers a great starting point for delivering beautifully designed presentations on the topic of your choice. Comprising eleven slides this professionally designed template is all you need to host discussion and meetings with collaborators. Each slide is self-explanatory and equipped with high-quality graphics that can be adjusted to your needs. Therefore, you will face no difficulty in portraying your desired content using this PPT slideshow. This PowerPoint slideshow contains every important element that you need for a great pitch. It is not only editable but also available for immediate download and utilization. The color, font size, background, shapes everything can be modified to create your unique presentation layout. Therefore, download it now.

Employee Hiring Dashboard Ppt PowerPoint Presentation Complete Deck With Slides
If designing a presentation takes a lot of your time and resources and you are looking for a better alternative, then this Employee Hiring Dashboard Ppt PowerPoint Presentation Complete Deck With Slides is the right fit for you. This is a prefabricated set that can help you deliver a great presentation on the topic. All the twelve slides included in this sample template can be used to present a birds-eye view of the topic. These slides are also fully editable, giving you enough freedom to add specific details to make this layout more suited to your business setting. Apart from the content, all other elements like color, design, theme are also replaceable and editable. This helps in designing a variety of presentations with a single layout. Not only this, you can use this PPT design in formats like PDF, PNG, and JPG once downloaded. Therefore, without any further ado, download and utilize this sample presentation as per your liking.
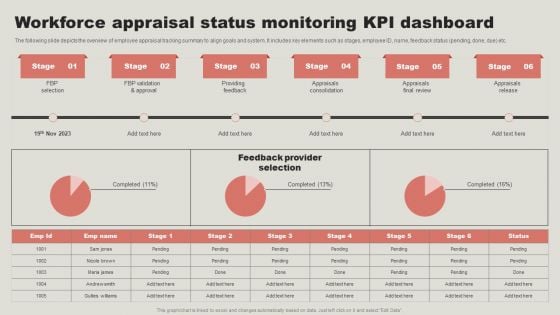
Workforce Appraisal Status Monitoring Kpi Dashboard Template PDF
The following slide depicts the overview of employee appraisal tracking summary to align goals and system. It includes key elements such as stages, employee ID, name, feedback status pending, done, due etc. Slidegeeks is here to make your presentations a breeze with Workforce Appraisal Status Monitoring Kpi Dashboard Template PDF With our easy to use and customizable templates, you can focus on delivering your ideas rather than worrying about formatting. With a variety of designs to choose from, you are sure to find one that suits your needs. And with animations and unique photos, illustrations, and fonts, you can make your presentation pop. So whether you are giving a sales pitch or presenting to the board, make sure to check out Slidegeeks first.
Facilitating IT Intelligence Architecture Tracking Intelligence Infrastructure Activities Dashboard Formats PDF
This slide portrays information regarding tracking essential activities in intelligence infrastructure dashboard in terms of IT operations, security, business analytics, internet of things, etc. Deliver an awe inspiring pitch with this creative Facilitating IT Intelligence Architecture Tracking Intelligence Infrastructure Activities Dashboard Formats PDF bundle. Topics like Tracking Intelligence, Infrastructure, Activities Dashboard can be discussed with this completely editable template. It is available for immediate download depending on the needs and requirements of the user.
Developing Business Analytics Framework Tracking Intelligence Infrastructure Activities Dashboard Brochure PDF
This slide portrays information regarding tracking essential activities in intelligence infrastructure dashboard in terms of IT operations, security, business analytics, internet of things, etc. Deliver an awe inspiring pitch with this creative Developing Business Analytics Framework Tracking Intelligence Infrastructure Activities Dashboard Brochure PDF bundle. Topics like Application Delivery, Business Analytics, Internet Of Things can be discussed with this completely editable template. It is available for immediate download depending on the needs and requirements of the user.
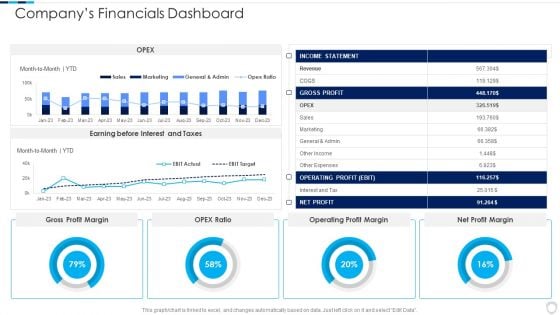
Financial Report Of An IT Firm Companys Financials Dashboard Infographics PDF
Deliver an awe inspiring pitch with this creative Financial Report Of An IT Firm Companys Financials Dashboard Infographics PDF bundle. Topics like Operating Profit, Gross Profit, Income Statement can be discussed with this completely editable template. It is available for immediate download depending on the needs and requirements of the user.
Maintaining And Managing Fixed Assets Metric Dashboard For Tracking Assets And Equipments Designs PDF
This slide represents fixed asset dashboard for asset tracking. It highlights active assets, processors, operating system, devices etc.Deliver and pitch your topic in the best possible manner with this Maintaining And Managing Fixed Assets Metric Dashboard For Tracking Assets And Equipments Designs PDF. Use them to share invaluable insights on Operating Systems, Manufactures Models, Operating System and impress your audience. This template can be altered and modified as per your expectations. So, grab it now.
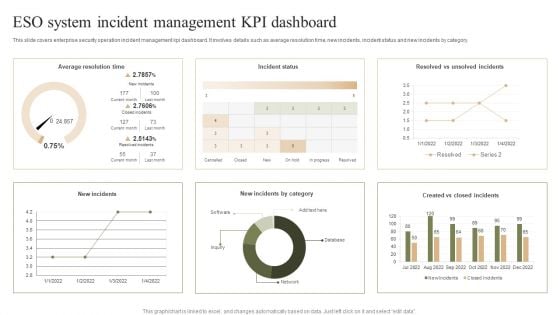
ESO System Incident Management KPI Dashboard Ppt PowerPoint Presentation File Graphic Images PDF
This slide covers enterprise security operation incident management kpi dashboard. It involves details such as average resolution time, new incidents, incident status and new incidents by category. Pitch your topic with ease and precision using this ESO System Incident Management KPI Dashboard Ppt PowerPoint Presentation File Graphic Images PDF. This layout presents information on Average Resolution Time, Incident Status, New Incidents. It is also available for immediate download and adjustment. So, changes can be made in the color, design, graphics or any other component to create a unique layout.
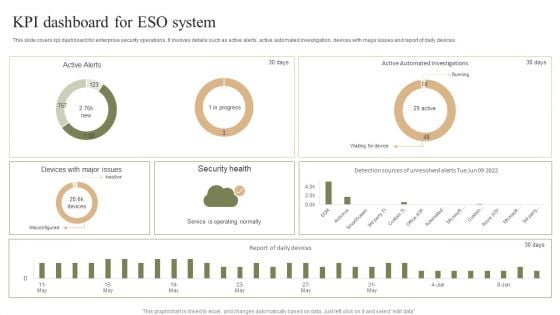
KPI Dashboard For ESO System Ppt PowerPoint Presentation File Template PDF
This slide covers kpi dashboard for enterprise security operations. It involves details such as active alerts, active automated investigation, devices with major issues and report of daily devices. Pitch your topic with ease and precision using this KPI Dashboard For ESO System Ppt PowerPoint Presentation File Template PDF. This layout presents information on Security Health, Misconfigured, Service Operating Normally. It is also available for immediate download and adjustment. So, changes can be made in the color, design, graphics or any other component to create a unique layout.
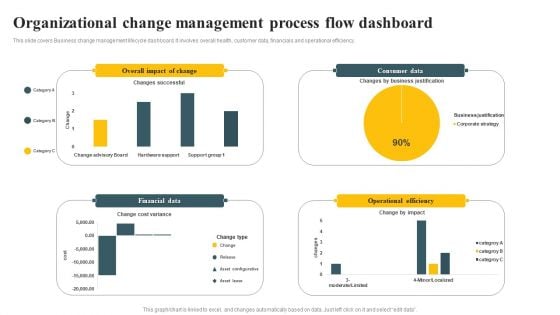
Organizational Change Management Process Flow Dashboard Ppt PowerPoint Presentation Diagram PDF
This slide covers Business change management lifecycle dashboard. It involves overall health, customer data, financials and operational efficiency. Pitch your topic with ease and precision using this Organizational Change Management Process Flow Dashboard Ppt PowerPoint Presentation Diagram PDF. This layout presents information on Financial Data, Operational Efficiency, Consumer Data. It is also available for immediate download and adjustment. So, changes can be made in the color, design, graphics or any other component to create a unique layout.
Fixed Asset Management Framework Implementation Metric Dashboard For Tracking Assets And Equipments Pictures PDF
This slide represents fixed asset dashboard for asset tracking. It highlights active assets, processors, operating system, devices etc.Deliver and pitch your topic in the best possible manner with this Fixed Asset Management Framework Implementation Metric Dashboard For Tracking Assets And Equipments Pictures PDF Use them to share invaluable insights on Active Assets, Operating System, Manufacture Model and impress your audience. This template can be altered and modified as per your expectations. So, grab it now.
Implementing Fixed Asset Management Metric Dashboard For Tracking Assets And Equipments Inspiration PDF
This slide represents fixed asset dashboard for asset tracking. It highlights active assets, processors, operating system, devices etc. Deliver an awe inspiring pitch with this creative Implementing Fixed Asset Management Metric Dashboard For Tracking Assets And Equipments Inspiration PDF bundle. Topics like Operating Systems, Processors, Manufacture can be discussed with this completely editable template. It is available for immediate download depending on the needs and requirements of the user.
Metric Dashboard For Tracking Assets And Equipments Implementing Fixed Asset Tracking Solution Inspiration PDF
This slide represents fixed asset dashboard for asset tracking. It highlights active assets, processors, operating system, devices etc.Deliver and pitch your topic in the best possible manner with this Metric Dashboard For Tracking Assets And Equipments Implementing Fixed Asset Tracking Solution Inspiration PDF. Use them to share invaluable insights on Operating Systems, Processors, Manufactures Models and impress your audience. This template can be altered and modified as per your expectations. So, grab it now.
Fitness Product Promotion Campaigns Sports Team And Brand Engagement Tracking Dashboard Designs PDF
This slide showcases sports team and brand engagement tracking dashboard. It provides details about owned channels, operated channels, images, videos, hashtags, image content, video content, etc. Do you have to make sure that everyone on your team knows about any specific topic I yes, then you should give Fitness Product Promotion Campaigns Sports Team And Brand Engagement Tracking Dashboard Designs PDF a try. Our experts have put a lot of knowledge and effort into creating this impeccable Fitness Product Promotion Campaigns Sports Team And Brand Engagement Tracking Dashboard Designs PDF. You can use this template for your upcoming presentations, as the slides are perfect to represent even the tiniest detail. You can download these templates from the Slidegeeks website and these are easy to edit. So grab these today

Operational Performance Management Powerpoint Layout
This is a operational performance management powerpoint layout. This is a one stage process. The stages in this process are dashboard, measure, business.
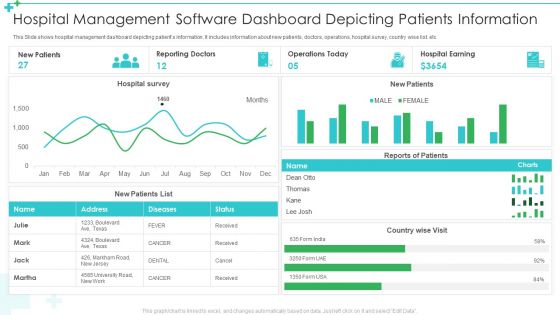
Hospital Management Software Dashboard Depicting Patients Information Ppt Layouts Skills PDF
This Slide shows hospital management dashboard depicting patients information. It includes information about new patients, doctors, operations, hospital survey, country wise list. etc. Showcasing this set of slides titled Hospital Management Software Dashboard Depicting Patients Information Ppt Layouts Skills PDF. The topics addressed in these templates are New Patients, Reporting Doctors, Operations Today. All the content presented in this PPT design is completely editable. Download it and make adjustments in color, background, font etc. as per your unique business setting.
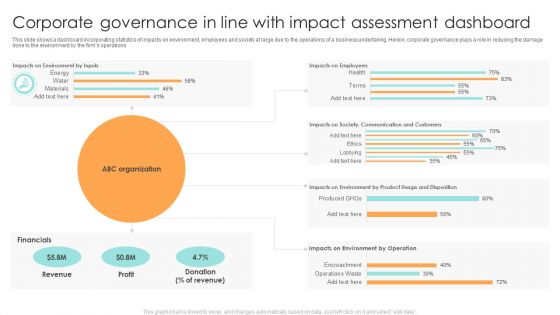
Corporate Governance In Line With Impact Assessment Dashboard Ppt File Backgrounds PDF
This slide shows a dashboard incorporating statistics of impacts on environment, employees and society at large due to the operations of a business undertaking. Herein, corporate governance plays a role in reducing the damage done to the environment by the firms operations. Pitch your topic with ease and precision using this Corporate Governance In Line With Impact Assessment Dashboard Ppt File Backgrounds PDF. This layout presents information on Financials, Profit, ABC Organization. It is also available for immediate download and adjustment. So, changes can be made in the color, design, graphics or any other component to create a unique layout.
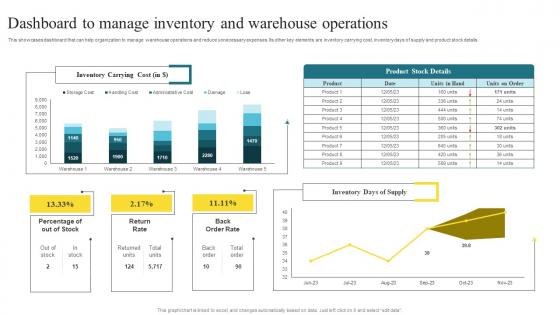
Dashboard To Manage Inventory Methods To Enhance Warehouse Space Utilization Summary Pdf
This showcases dashboard that can help organization to manage warehouse operations and reduce unnecessary expenses. Its other key elements are inventory carrying cost, inventory days of supply and product stock details. There are so many reasons you need a Dashboard To Manage Inventory Methods To Enhance Warehouse Space Utilization Summary Pdf. The first reason is you can not spend time making everything from scratch, Thus, Slidegeeks has made presentation templates for you too. You can easily download these templates from our website easily. This showcases dashboard that can help organization to manage warehouse operations and reduce unnecessary expenses. Its other key elements are inventory carrying cost, inventory days of supply and product stock details.
Modifying Banking Functionalities Dashboard Tracking Total Loans And Deposits Icons PDF
This slide contains dashboard that are used to track the loans and deposits in the bank. Deliver an awe inspiring pitch with this creative enhancing financial institution operations dashboard tracking total loans and deposits graphics pdf bundle. Topics like dashboard tracking total loans and deposits can be discussed with this completely editable template. It is available for immediate download depending on the needs and requirements of the user.
Modifying Banking Functionalities Dashboard Tracking Customer Activities And Revenue Generated Portrait PDF
This slide contains dashboard that will allow bank to track the customer activities in terms of new customer acquired, customer acquisition cost and overall revenue generated. Deliver and pitch your topic in the best possible manner with this enhancing financial institution operations dashboard tracking customer activities and revenue generated microsoft pdf. Use them to share invaluable insights on target, revenue, value, achievement and impress your audience. This template can be altered and modified as per your expectations. So, grab it now.
Modifying Banking Functionalities Dashboard Tracking Customer Retention Rate Partner Structure PDF
This slide contains dashboard that will allow bank to track the retention rate of customer within span of 6 months. Number of accounts that are successfully retained by the bank. It will also bank in tracking accounts that are cancelled. Deliver an awe inspiring pitch with this creative enhancing financial institution operations dashboard tracking customer retention rate partner introduction pdf bundle. Topics like dashboard tracking customer retention rate can be discussed with this completely editable template. It is available for immediate download depending on the needs and requirements of the user.

Patient Health And Risk Key Performance Indicator Dashboard Ppt Infographic Template Summary PDF
The following slide highlights the patient health and safety key performance indicator dashboard illustrating admission by department, admission by cost, patient satisfaction, total patients, operations cost, patient density, total staff, waiting time, treatment satisfaction and treatment confidence. Pitch your topic with ease and precision using this Patient Health And Risk Key Performance Indicator Dashboard Ppt Infographic Template Summary PDF. This layout presents information on Admission By Department, Admission Vs Cost, Patient Satisfaction. It is also available for immediate download and adjustment. So, changes can be made in the color, design, graphics or any other component to create a unique layout.
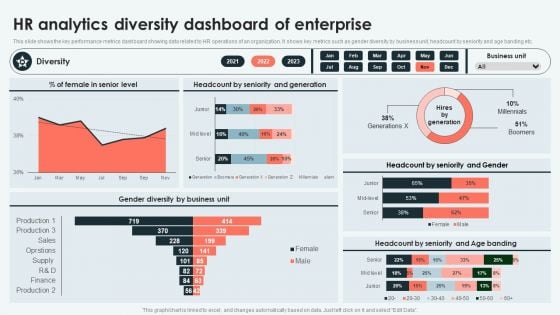
Analyzing And Deploying HR Analytics Diversity Dashboard Of Enterprise Inspiration PDF
This slide shows the key performance metrics dashboard showing data related to HR operations of an organization. It shows key metrics such as gender diversity by business unit, headcount by seniority and age banding etc. Want to ace your presentation in front of a live audience Our Analyzing And Deploying HR Analytics Diversity Dashboard Of Enterprise Inspiration PDF can help you do that by engaging all the users towards you. Slidegeeks experts have put their efforts and expertise into creating these impeccable powerpoint presentations so that you can communicate your ideas clearly. Moreover, all the templates are customizable, and easy-to-edit and downloadable. Use these for both personal and commercial use.
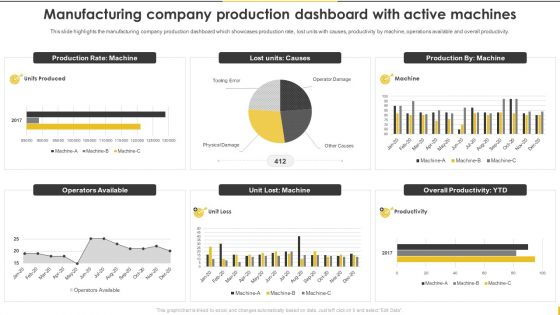
Customer Goods Production Manufacturing Company Production Dashboard With Active Slides PDF
This slide highlights the manufacturing company production dashboard which showcases production rate, lost units with causes, productivity by machine, operations available and overall productivity. Explore a selection of the finest Customer Goods Production Manufacturing Company Production Dashboard With Active Slides PDF here. With a plethora of professionally designed and pre-made slide templates, you can quickly and easily find the right one for your upcoming presentation. You can use our Customer Goods Production Manufacturing Company Production Dashboard With Active Slides PDF to effectively convey your message to a wider audience. Slidegeeks has done a lot of research before preparing these presentation templates. The content can be personalized and the slides are highly editable. Grab templates today from Slidegeeks.
IT Alignment For Strategic Dashboard For Tracking Business And IT Alignment Professional PDF
This slide depicts the dashboard for business and IT alignment by covering details of total sales, customer support service, percentage of business operations aligned IT, usage of communication channels, and top performer associates. Formulating a presentation can take up a lot of effort and time, so the content and message should always be the primary focus. The visuals of the PowerPoint can enhance the presenters message, so our IT Alignment For Strategic Dashboard For Tracking Business And IT Alignment Professional PDF was created to help save time. Instead of worrying about the design, the presenter can concentrate on the message while our designers work on creating the ideal templates for whatever situation is needed. Slidegeeks has experts for everything from amazing designs to valuable content, we have put everything into IT Alignment For Strategic Dashboard For Tracking Business And IT Alignment Professional PDF.
Dashboard For Tracking Business And IT Alignment Ppt PowerPoint Presentation File Background Images PDF
This slide depicts the dashboard for business and IT alignment by covering details of total sales, customer support service, percentage of business operations aligned IT, usage of communication channels, and top performer associates. The Dashboard For Tracking Business And IT Alignment Ppt PowerPoint Presentation File Background Images PDF is a compilation of the most recent design trends as a series of slides. It is suitable for any subject or industry presentation, containing attractive visuals and photo spots for businesses to clearly express their messages. This template contains a variety of slides for the user to input data, such as structures to contrast two elements, bullet points, and slides for written information. Slidegeeks is prepared to create an impression.
IT Business Alignment Framework Dashboard For Tracking Business And IT Alignment Diagrams PDF
This slide depicts the dashboard for business and IT alignment by covering details of total sales, customer support service, percentage of business operations aligned IT, usage of communication channels, and top performer associates.This IT Business Alignment Framework Dashboard For Tracking Business And IT Alignment Diagrams PDF from Slidegeeks makes it easy to present information on your topic with precision. It provides customization options, so you can make changes to the colors, design, graphics, or any other component to create a unique layout. It is also available for immediate download, so you can begin using it right away. Slidegeeks has done good research to ensure that you have everything you need to make your presentation stand out. Make a name out there for a brilliant performance.
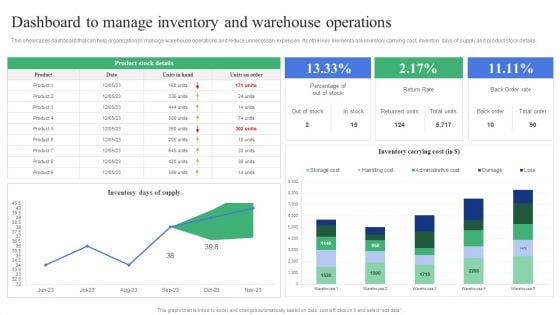
Strategic Guidelines To Administer Dashboard To Manage Inventory And Warehouse Introduction PDF
This showcases dashboard that can help organization to manage warehouse operations and reduce unnecessary expenses. Its other key elements are inventory carrying cost, inventory days of supply and product stock details. This Strategic Guidelines To Administer Dashboard To Manage Inventory And Warehouse Introduction PDF from Slidegeeks makes it easy to present information on your topic with precision. It provides customization options, so you can make changes to the colors, design, graphics, or any other component to create a unique layout. It is also available for immediate download, so you can begin using it right away. Slidegeeks has done good research to ensure that you have everything you need to make your presentation stand out. Make a name out there for a brilliant performance.
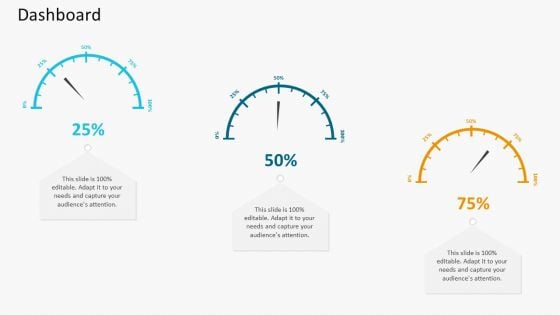
High Employee Attrition Rate In IT Firm Case Competition Dashboard Brochure PDF
Presenting high employee attrition rate in it firm case competition dashboard brochure pdf to provide visual cues and insights. Share and navigate important information on three stages that need your due attention. This template can be used to pitch topics like dashboard. In addtion, this PPT design contains high resolution images, graphics, etc, that are easily editable and available for immediate download.
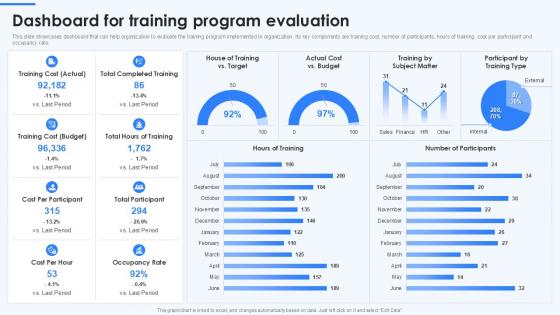
Dashboard For Training Program Evaluation On Job Employee Training Program For Skills
The Dashboard For Training Program Evaluation On Job Employee Training Program For Skills is a compilation of the most recent design trends as a series of slides. It is suitable for any subject or industry presentation, containing attractive visuals and photo spots for businesses to clearly express their messages. This template contains a variety of slides for the user to input data, such as structures to contrast two elements, bullet points, and slides for written information. Slidegeeks is prepared to create an impression. Our Dashboard for Training Program Evaluation on Job Employee Training Program for Skills shall offer a graphical representation providing insights to measure the effectiveness of an organizations training initiatives. This particular slide captures such important performance metrics such as the cost associated with training, number of participants, total hours undertaken in the training program, per participant cost, and occupation rate that help evaluate the entire program conducted.
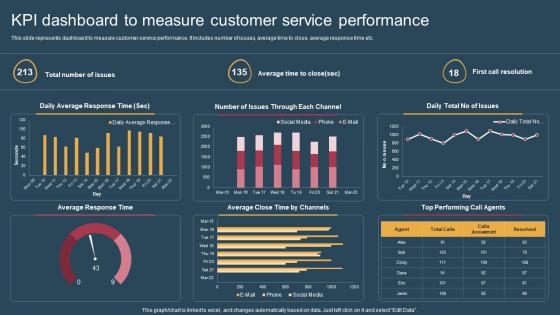
KPI Dashboard To Measure Conversion Of Customer Support Services Graphics Pdf
This slide represents dashboard to measure customer service performance. It includes number of issues, average time to close, average response time etc. Welcome to our selection of the KPI Dashboard To Measure Conversion Of Customer Support Services Graphics Pdf. These are designed to help you showcase your creativity and bring your sphere to life. Planning and Innovation are essential for any business that is just starting out. This collection contains the designs that you need for your everyday presentations. All of our PowerPoints are 100 percent editable, so you can customize them to suit your needs. This multi purpose template can be used in various situations. Grab these presentation templates today. This slide represents dashboard to measure customer service performance. It includes number of issues, average time to close, average response time etc.
Cybersecurity Risk Assessment Program Dashboard For Tracking Cyber Attack Risk Levels
Explore a selection of the finest Cybersecurity Risk Assessment Program Dashboard For Tracking Cyber Attack Risk Levels here. With a plethora of professionally designed and pre-made slide templates, you can quickly and easily find the right one for your upcoming presentation. You can use our Cybersecurity Risk Assessment Program Dashboard For Tracking Cyber Attack Risk Levels to effectively convey your message to a wider audience. Slidegeeks has done a lot of research before preparing these presentation templates. The content can be personalized and the slides are highly editable. Grab templates today from Slidegeeks. This slide represents Cybersecurity Risk Assessment Program Dashboard to effectively track cyber security risk levels. This will provide a structured approach for organizations to review and mitigate cyber threats. It includes multiple threat agents, attack methods, and preventive controls implemented with detailed insights, and it shows critical metrics including risk scores, the number of infected systems, and detected vulnerabilities.
Guide Map Employee Experience Workplace Dashboard Template Ppt Icon Infographics PDF
Presenting this set of slides with name guide map employee experience workplace dashboard template ppt icon infographics pdf. This is a three stage process. The stages in this process are dashboard. This is a completely editable PowerPoint presentation and is available for immediate download. Download now and impress your audience.
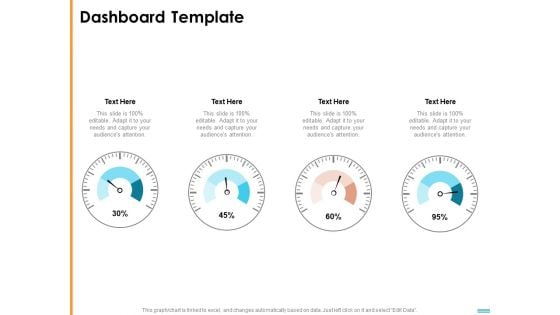
HR Strategy To Transform Employee Experience And Work Culture Dashboard Template Portrait PDF
Presenting hr strategy to transform employee experience and work culture dashboard template portrait pdf. to provide visual cues and insights. Share and navigate important information on three stages that need your due attention. This template can be used to pitch topics like dashboard. In addtion, this PPT design contains high resolution images, graphics, etc, that are easily editable and available for immediate download.
New Hires Data Tracker Dashboard Employee Attraction And Competency Ppt Slide
This slide shows dashboard including date related to new hires for recruitment. It include data related to new hires per month, new hires for various departments and by sources, etc. Coming up with a presentation necessitates that the majority of the effort goes into the content and the message you intend to convey. The visuals of a PowerPoint presentation can only be effective if it supplements and supports the story that is being told. Keeping this in mind our experts created New Hires Data Tracker Dashboard Employee Attraction And Competency Ppt Slide to reduce the time that goes into designing the presentation. This way, you can concentrate on the message while our designers take care of providing you with the right template for the situation. This slide shows dashboard including date related to new hires for recruitment. It include data related to new hires per month, new hires for various departments and by sources, etc.
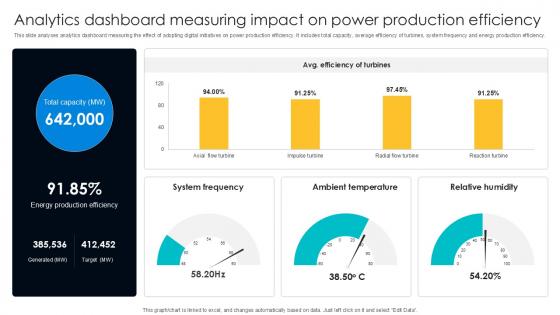
Analytics Dashboard Measuring Digital Transformation Journey PPT Slide DT SS V
This slide analyses analytics dashboard measuring the effect of adopting digital initiatives on power production efficiency. It includes total capacity, average efficiency of turbines, system frequency and energy production efficiency. Do you have to make sure that everyone on your team knows about any specific topic I yes, then you should give Analytics Dashboard Measuring Digital Transformation Journey PPT Slide DT SS V a try. Our experts have put a lot of knowledge and effort into creating this impeccable Analytics Dashboard Measuring Digital Transformation Journey PPT Slide DT SS V. You can use this template for your upcoming presentations, as the slides are perfect to represent even the tiniest detail. You can download these templates from the Slidegeeks website and these are easy to edit. So grab these today This slide analyses analytics dashboard measuring the effect of adopting digital initiatives on power production efficiency. It includes total capacity, average efficiency of turbines, system frequency and energy production efficiency.
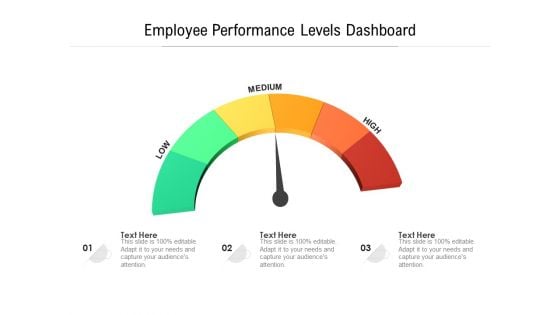
Employee Performance Levels Dashboard Ppt PowerPoint Presentation Slides Design Templates PDF
Presenting employee performance levels dashboard ppt powerpoint presentation slides design templates pdf to dispense important information. This template comprises three stages. It also presents valuable insights into the topics including low, medium, high. This is a completely customizable PowerPoint theme that can be put to use immediately. So, download it and address the topic impactfully.
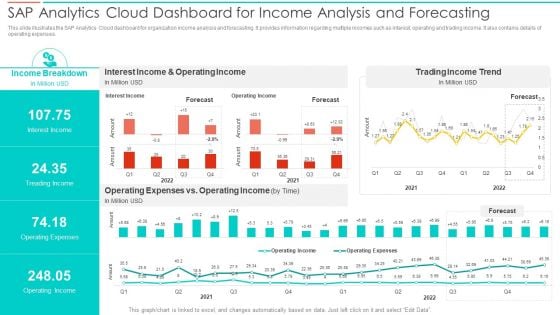
SAC Planning And Implementation SAP Analytics Cloud Dashboard For Income Analysis Summary PDF
This slide illustrates the SAP Analytics Cloud dashboard for organization income analysis and forecasting. It provides information regarding multiple incomes such as interest, operating and trading income. It also contains details of operating expenses. Deliver an awe inspiring pitch with this creative SAC Planning And Implementation SAP Analytics Cloud Dashboard For Income Analysis Summary PDF bundle. Topics like Income Breakdown, Interest Income, Operating Income, Trading Income Trend can be discussed with this completely editable template. It is available for immediate download depending on the needs and requirements of the user.
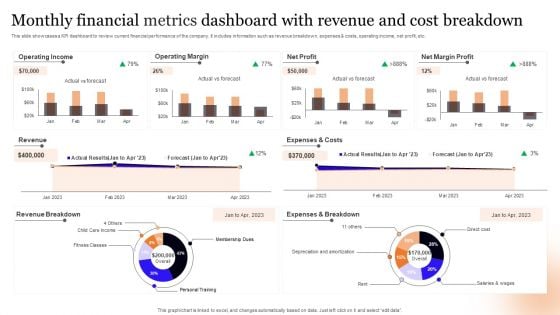
Monthly Financial Metrics Dashboard With Revenue And Cost Breakdown Information PDF
This slide showcases a KPI dashboard to review current financial performance of the company. It includes information such as revenue breakdown, expenses and costs, operating income, net profit, etc. Pitch your topic with ease and precision using this Monthly Financial Metrics Dashboard With Revenue And Cost Breakdown Information PDF. This layout presents information on Operating Income, Operating Margin, Net Profit. It is also available for immediate download and adjustment. So, changes can be made in the color, design, graphics or any other component to create a unique layout.
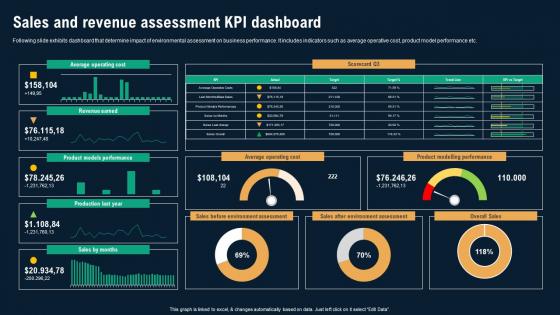
Sales And Revenue Assessment KPI Dashboard Business Environmental Analysis Ideas Pdf
Following slide exhibits dashboard that determine impact of environmental assessment on business performance. It includes indicators such as average operative cost, product model performance etc. There are so many reasons you need a Sales And Revenue Assessment KPI Dashboard Business Environmental Analysis Ideas Pdf The first reason is you can not spend time making everything from scratch, Thus, Slidegeeks has made presentation templates for you too. You can easily download these templates from our website easily. Following slide exhibits dashboard that determine impact of environmental assessment on business performance. It includes indicators such as average operative cost, product model performance etc.
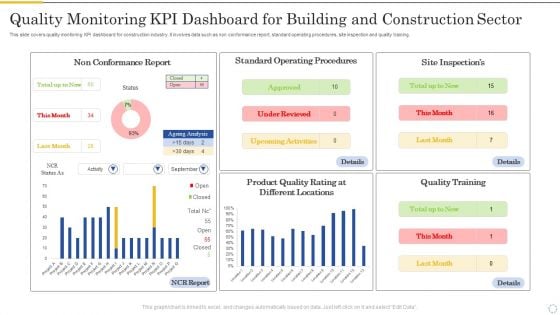
Quality Monitoring Kpi Dashboard For Building And Construction Sector Portrait PDF
This slide covers quality monitoring KPI dashboard for construction industry. It involves data such as non conformance report, standard operating procedures, site inspection and quality training. Showcasing this set of slides titled Quality Monitoring Kpi Dashboard For Building And Construction Sector Portrait PDF. The topics addressed in these templates are Non Conformance Report, Standard Operating, Procedures. All the content presented in this PPT design is completely editable. Download it and make adjustments in color, background, font etc. as per your unique business setting.
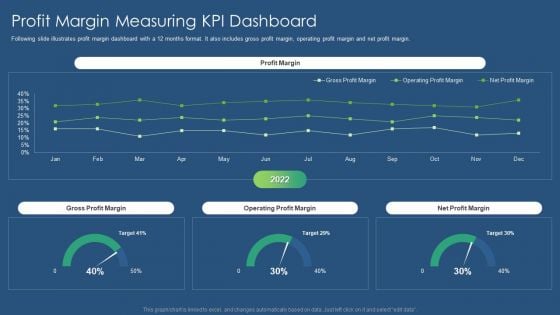
Sustainability Calculation With KPI Profit Margin Measuring Kpi Dashboard Inspiration PDF Topics PDF
Following slide illustrates profit margin dashboard with a 12 months format. It also includes gross profit margin, operating profit margin and net profit margin. Deliver and pitch your topic in the best possible manner with this sustainability calculation with kpi profit margin measuring kpi dashboard inspiration pdf. Use them to share invaluable insights on net profit margin, operating profit margin, gross profit margin and impress your audience. This template can be altered and modified as per your expectations. So, grab it now.
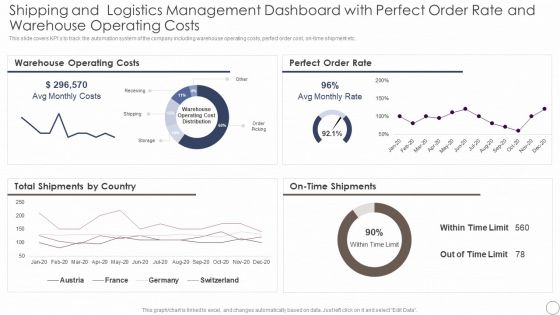
Shipping And Logistics Management Dashboard With Perfect Order Rate And Warehouse Background PDF
This slide covers KPIs to track the automation system of the company including warehouse operating costs, perfect order cost, on time shipment etc. Deliver and pitch your topic in the best possible manner with this Shipping And Logistics Management Dashboard With Perfect Order Rate And Warehouse Background PDF. Use them to share invaluable insights on Warehouse Operating Costs, Perfect Order Rate and impress your audience. This template can be altered and modified as per your expectations. So, grab it now.
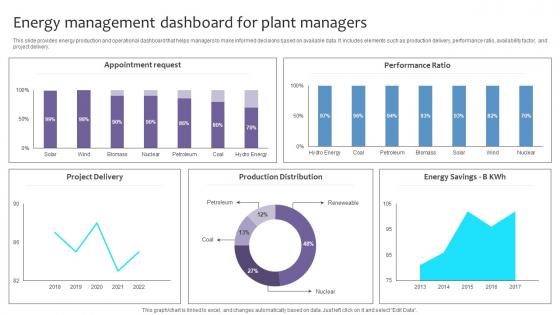
Empowering The Future Energy Management Dashboard For Plant Managers IoT SS V
This slide provides energy production and operational dashboard that helps managers to make informed decisions based on available data. It includes elements such as production delivery, performance ratio, availability factor, and project delivery. Crafting an eye-catching presentation has never been more straightforward. Let your presentation shine with this tasteful yet straightforward Empowering The Future Energy Management Dashboard For Plant Managers IoT SS V template. It offers a minimalistic and classy look that is great for making a statement. The colors have been employed intelligently to add a bit of playfulness while still remaining professional. Construct the ideal Empowering The Future Energy Management Dashboard For Plant Managers IoT SS V that effortlessly grabs the attention of your audience Begin now and be certain to wow your customers This slide provides energy production and operational dashboard that helps managers to make informed decisions based on available data. It includes elements such as production delivery, performance ratio, availability factor, and project delivery.
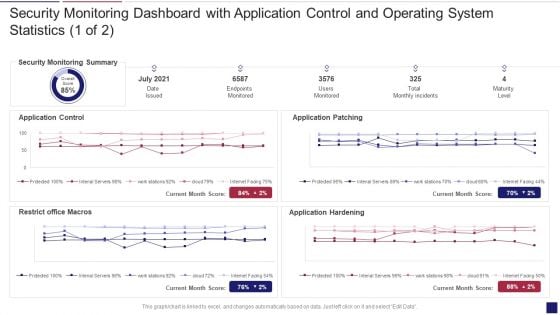
Continuous Development Evaluation Plan Eliminate Cyber Attacks Security Monitoring Dashboard Security Brochure PDF
Deliver an awe inspiring pitch with this creative continuous development evaluation plan eliminate cyber attacks security monitoring dashboard security brochure pdf bundle. Topics like security monitoring dashboard with application control and operating system statistics can be discussed with this completely editable template. It is available for immediate download depending on the needs and requirements of the user.
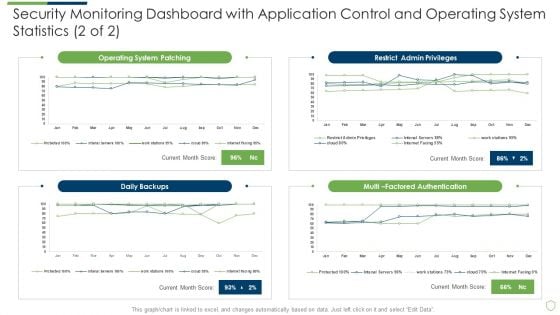
Modern Security Observation Plan To Eradicate Cybersecurity Risk And Data Breach Security Monitoring Dashboard Sample PDF
Deliver an awe inspiring pitch with this creative modern security observation plan to eradicate cybersecurity risk and data breach security monitoring dashboard sample pdf bundle. Topics like security monitoring dashboard with application control and operating system statistics can be discussed with this completely editable template. It is available for immediate download depending on the needs and requirements of the user.
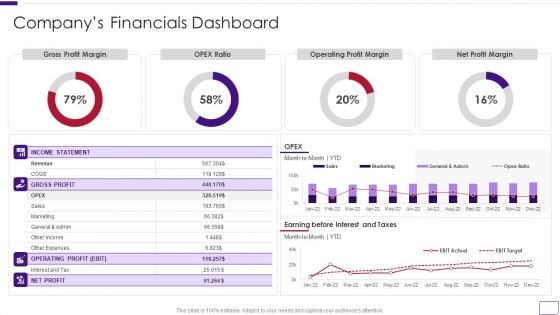
Business Overview Of A Technology Firm Companys Financials Dashboard Sample PDF
Deliver and pitch your topic in the best possible manner with this Business Overview Of A Technology Firm Companys Financials Dashboard Sample PDF. Use them to share invaluable insights on Financials Dashboard, Operating Profit Margin, Net Profit Margin and impress your audience. This template can be altered and modified as per your expectations. So, grab it now.
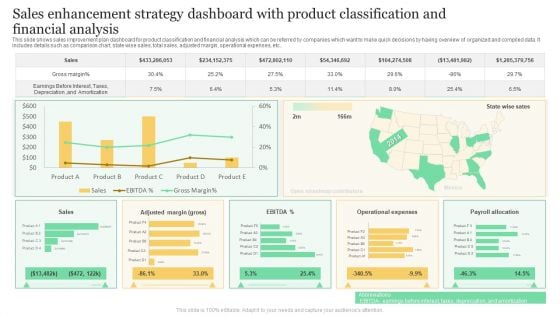
Sales Enhancement Strategy Dashboard With Product Classification And Financial Analysis Formats PDF
This slide shows sales improvement plan dashboard for product classification and financial analysis which can be referred by companies which want to make quick decisions by having overview of organized and compiled data. It includes details such as comparison chart, state wise sales, total sales, adjusted margin, operational expenses, etc. Showcasing this set of slides titled Sales Enhancement Strategy Dashboard With Product Classification And Financial Analysis Formats PDF. The topics addressed in these templates are Gross Margin, Sales, Operational Expenses. All the content presented in this PPT design is completely editable. Download it and make adjustments in color, background, font etc. as per your unique business setting.
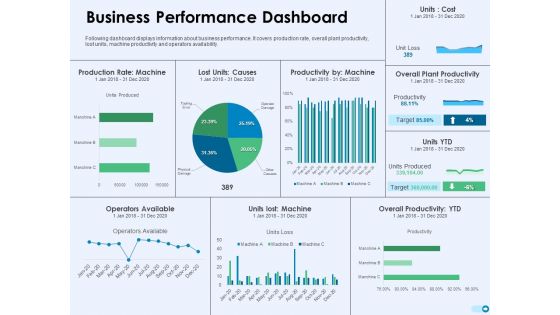
Tools For Prioritization Business Performance Dashboard Ppt PowerPoint Presentation Portfolio Clipart PDF
Following dashboard displays information about business performance. It covers production rate, overall plant productivity, lost units, machine productivity and operators availability. Deliver an awe-inspiring pitch with this creative tools for prioritization business performance dashboard ppt powerpoint presentation portfolio clipart pdf bundle. Topics like production rate machine, lost units causes, productivity by machine, overall plant productivity, units lost machine, overall productivity ytd, operators available can be discussed with this completely editable template. It is available for immediate download depending on the needs and requirements of the user.
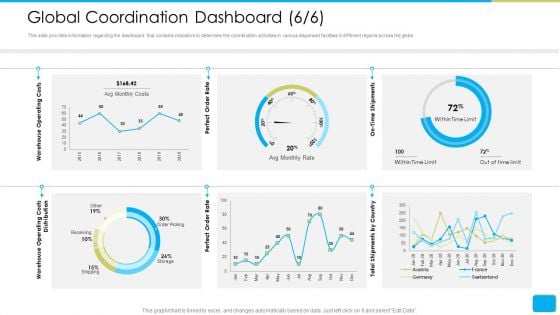
Cross Border Integration In Multinational Corporation Global Coordination Dashboard Costs Topics PDF
This slide provides information regarding the dashboard that contains indicators to determine the coordination activities in various dispersed facilities in different regions across the globe. Deliver and pitch your topic in the best possible manner with this cross border integration in multinational corporation global coordination dashboard costs topics pdf. Use them to share invaluable insights on perfect order rate, on time shipments, total shipments country, warehouse operating costs distribution, warehouse operating costs and impress your audience. This template can be altered and modified as per your expectations. So, grab it now.
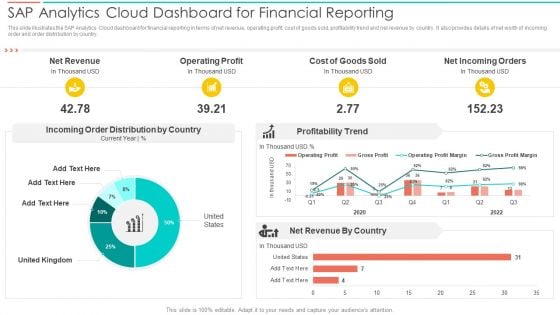
SAC Planning And Implementation SAP Analytics Cloud Dashboard For Financial Reporting Introduction PDF
This slide illustrates the SAP Analytics Cloud dashboard for financial reporting in terms of net revenue, operating profit, cost of goods sold, profitability trend and net revenue by country. It also provides details of net worth of incoming order and order distribution by country. Deliver an awe inspiring pitch with this creative SAC Planning And Implementation SAP Analytics Cloud Dashboard For Financial Reporting Introduction PDF bundle. Topics like Net Revenue, Operating Profit, Cost Goods Sold can be discussed with this completely editable template. It is available for immediate download depending on the needs and requirements of the user.
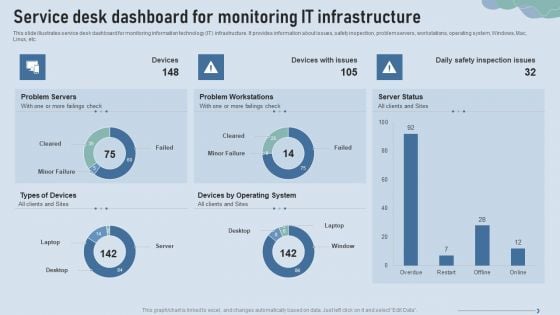
Improve IT Service Desk Service Desk Dashboard For Monitoring IT Infrastructure Introduction PDF
This slide illustrates service desk dashboard for monitoring information technology IT infrastructure. It provides information about issues, safety inspection, problem servers, workstations, operating system, Windows, Mac, Linux, etc.Deliver and pitch your topic in the best possible manner with this Improve IT Service Desk Service Desk Dashboard For Monitoring IT Infrastructure Introduction PDF. Use them to share invaluable insights on Problem Servers, Problem Workstations, Operating System and impress your audience. This template can be altered and modified as per your expectations. So, grab it now.


 Continue with Email

 Home
Home


