It Operations Dashboard
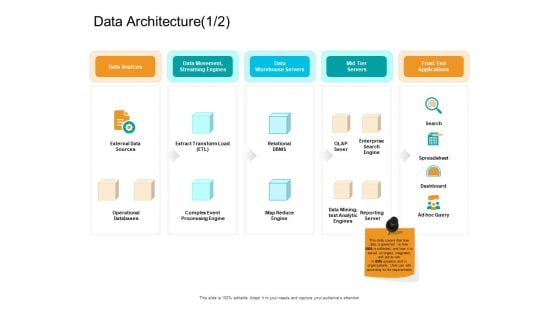
Facts Assessment Data Architecture Databases Ppt PowerPoint Presentation Show Deck PDF
Presenting this set of slides with name facts assessment data architecture databases ppt powerpoint presentation show deck pdf. This is a five stage process. The stages in this process are data sources, data movement, streaming engines, data warehouse servers, mid tier servers, front end applications, operational databases. This is a completely editable PowerPoint presentation and is available for immediate download. Download now and impress your audience.
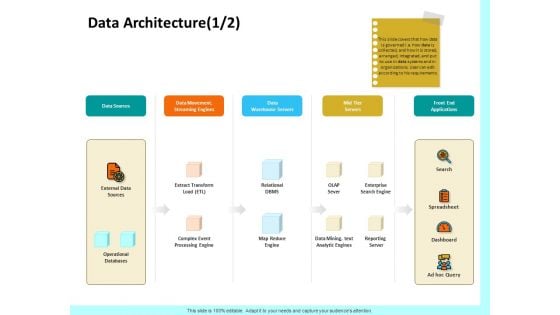
Firm Productivity Administration Data Architecture Servers Ppt PowerPoint Presentation Gallery Vector PDF
Presenting this set of slides with name firm productivity administration data architecture servers ppt powerpoint presentation gallery vector pdf. This is a five stage process. The stages in this process are data sources, data movement, streaming engines, data warehouse servers, mid tier servers, front end applications, operational databases. This is a completely editable PowerPoint presentation and is available for immediate download. Download now and impress your audience.
Enterprise Data Storage Management With Icons Ppt PowerPoint Presentation Gallery Graphics PDF
Persuade your audience using this enterprise data storage management with icons ppt powerpoint presentation gallery graphics pdf. This PPT design covers three stages, thus making it a great tool to use. It also caters to a variety of topics including enterprise data warehouse, operational data store, data mart. Download this PPT design now to present a convincing pitch that not only emphasizes the topic but also showcases your presentation skills.
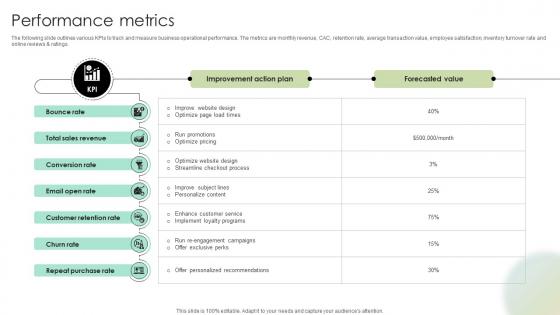
Performance Metrics Digital Fashion Brand Portal Market Entry Plan GTM SS V
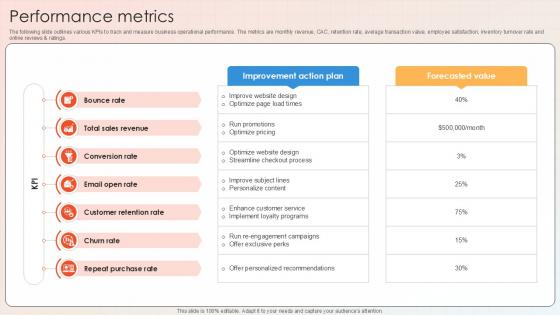
The following slide outlines various KPIs to track and measure business operational performance. The metrics are monthly revenue, CAC, retention rate, average transaction value, employee satisfaction, inventory turnover rate and online reviews and ratings.Crafting an eye-catching presentation has never been more straightforward. Let your presentation shine with this tasteful yet straightforward Performance Metrics Digital Fashion Brand Portal Market Entry Plan GTM SS V template. It offers a minimalistic and classy look that is great for making a statement. The colors have been employed intelligently to add a bit of playfulness while still remaining professional. Construct the ideal Performance Metrics Digital Fashion Brand Portal Market Entry Plan GTM SS V that effortlessly grabs the attention of your audience Begin now and be certain to wow your customers The following slide outlines various KPIs to track and measure business operational performance. The metrics are monthly revenue, CAC, retention rate, average transaction value, employee satisfaction, inventory turnover rate and online reviews and ratings.
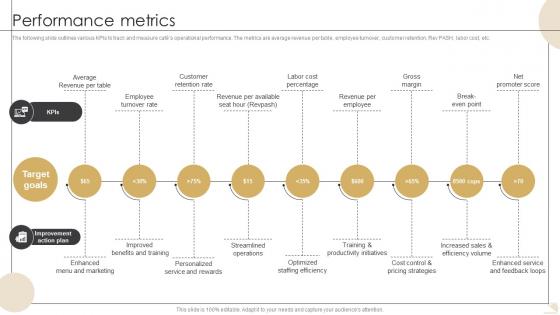
Performance Metrics Bistro Startup GTM Strategy GTM SS V
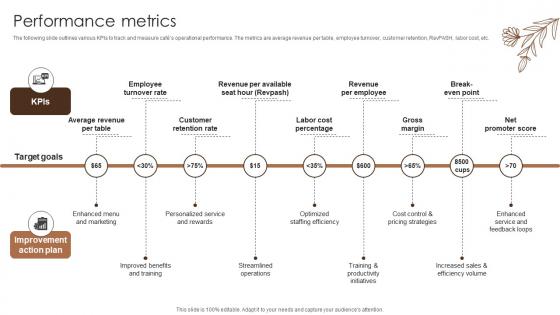
The following slide outlines various KPIs to track and measure cafes operational performance. The metrics are average revenue per table, employee turnover, customer retention, RevPASH, labor cost, etc.Formulating a presentation can take up a lot of effort and time, so the content and message should always be the primary focus. The visuals of the PowerPoint can enhance the presenters message, so our Performance Metrics Bistro Startup GTM Strategy GTM SS V was created to help save time. Instead of worrying about the design, the presenter can concentrate on the message while our designers work on creating the ideal templates for whatever situation is needed. Slidegeeks has experts for everything from amazing designs to valuable content, we have put everything into Performance Metrics Bistro Startup GTM Strategy GTM SS V. The following slide outlines various KPIs to track and measure cafes operational performance. The metrics are average revenue per table, employee turnover, customer retention, RevPASH, labor cost, etc.
Performance Metrics Coffee Bar Go To Market Strategy GTM SS V
The following slide outlines various KPIs to track and measure cafes operational performance. The metrics are average revenue per table, employee turnover, customer retention, RevPASH, labor cost, etc.Coming up with a presentation necessitates that the majority of the effort goes into the content and the message you intend to convey. The visuals of a PowerPoint presentation can only be effective if it supplements and supports the story that is being told. Keeping this in mind our experts created Performance Metrics Coffee Bar Go To Market Strategy GTM SS V to reduce the time that goes into designing the presentation. This way, you can concentrate on the message while our designers take care of providing you with the right template for the situation. The following slide outlines various KPIs to track and measure cafes operational performance. The metrics are average revenue per table, employee turnover, customer retention, RevPASH, labor cost, etc.

Executive Summary C2C Ecommerce Platform Company Profile CP SS V
The slide showcases the executive summary to provide brief insights into eBay company, including a quick overview, global presence, customer segments, employee count, key competitors and operational KPIs.If your project calls for a presentation, then Slidegeeks is your go-to partner because we have professionally designed, easy-to-edit templates that are perfect for any presentation. After downloading, you can easily edit Executive Summary C2C Ecommerce Platform Company Profile CP SS V and make the changes accordingly. You can rearrange slides or fill them with different images. Check out all the handy templates The slide showcases the executive summary to provide brief insights into eBay company, including a quick overview, global presence, customer segments, employee count, key competitors and operational KPIs.
Business Future Outlook Enterprise Software Solution Providing Company Profile CP SS V
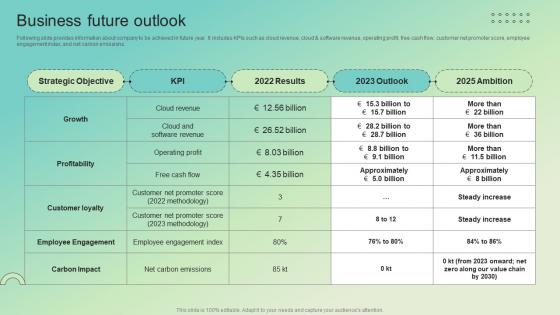
Following slide provides information about company to be achieved in future year. It includes KPIs such as cloud revenue, cloud and software revenue, operating profit, free cash flow, customer net promoter score, employee engagement index, and net carbon emissions.Boost your pitch with our creative Business Future Outlook Enterprise Software Solution Providing Company Profile CP SS V. Deliver an awe-inspiring pitch that will mesmerize everyone. Using these presentation templates you will surely catch everyones attention. You can browse the ppts collection on our website. We have researchers who are experts at creating the right content for the templates. So you do not have to invest time in any additional work. Just grab the template now and use them. Following slide provides information about company to be achieved in future year. It includes KPIs such as cloud revenue, cloud and software revenue, operating profit, free cash flow, customer net promoter score, employee engagement index, and net carbon emissions.
Performance Metrics Apparel And Shoes E Commerce Market PPT Slide GTM SS V
The following slide outlines various KPIs to track and measure business operational performance. The metrics are monthly revenue, CAC, retention rate, average transaction value, employee satisfaction, inventory turnover rate and online reviews and ratings. Crafting an eye-catching presentation has never been more straightforward. Let your presentation shine with this tasteful yet straightforward Performance Metrics Apparel And Shoes E Commerce Market PPT Slide GTM SS V template. It offers a minimalistic and classy look that is great for making a statement. The colors have been employed intelligently to add a bit of playfulness while still remaining professional. Construct the ideal Performance Metrics Apparel And Shoes E Commerce Market PPT Slide GTM SS V that effortlessly grabs the attention of your audience Begin now and be certain to wow your customers The following slide outlines various KPIs to track and measure business operational performance. The metrics are monthly revenue, CAC, retention rate, average transaction value, employee satisfaction, inventory turnover rate and online reviews and ratings.
Competitor Business Comparative Assessment Based On Product Quality Ppt Inspiration Styles Pdf
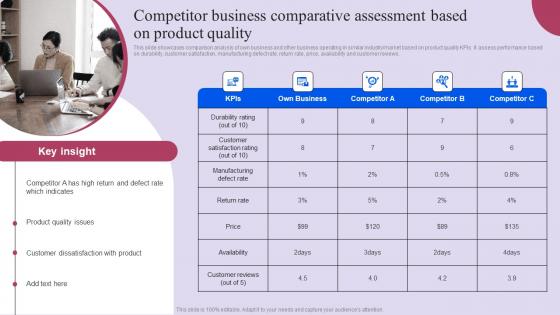
This slide showcases comparison analysis of own business and other business operating in similar industrymarket based on product quality KPIs. It assess performance based on durability, customer satisfaction, manufacturing defect rate, return rate, price, availability and customer reviews. From laying roadmaps to briefing everything in detail, our templates are perfect for you. You can set the stage with your presentation slides. All you have to do is download these easy to edit and customizable templates. Competitor Business Comparative Assessment Based On Product Quality Ppt Inspiration Styles Pdf will help you deliver an outstanding performance that everyone would remember and praise you for. Do download this presentation today. This slide showcases comparison analysis of own business and other business operating in similar industrymarket based on product quality KPIs. It assess performance based on durability, customer satisfaction, manufacturing defect rate, return rate, price, availability and customer reviews.
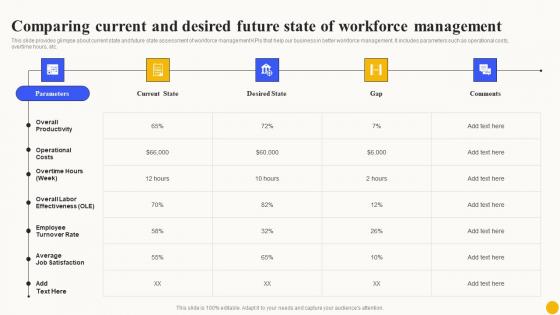
Comparing Current And Desired Planned Workforce Enhancement Demonstration Pdf
This slide provides glimpse about current state and future state assessment of workforce management KPIs that help our business in better workforce management. It includes parameters such as operational costs, overtime hours, etc.Present like a pro with Comparing Current And Desired Planned Workforce Enhancement Demonstration Pdf Create beautiful presentations together with your team, using our easy-to-use presentation slides. Share your ideas in real-time and make changes on the fly by downloading our templates. So whether you are in the office, on the go, or in a remote location, you can stay in sync with your team and present your ideas with confidence. With Slidegeeks presentation got a whole lot easier. Grab these presentations today. This slide provides glimpse about current state and future state assessment of workforce management KPIs that help our business in better workforce management. It includes parameters such as operational costs, overtime hours, etc.
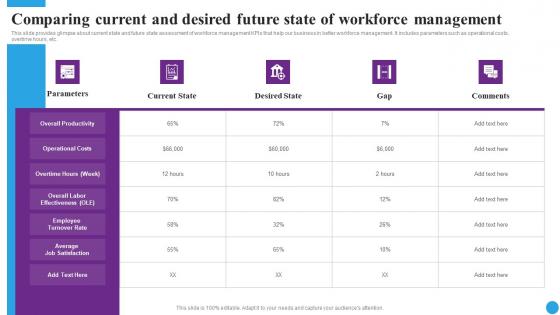
Comparing Current And Desired Future State Strategic Approaches To Streamline Slides Pdf
This slide provides glimpse about current state and future state assessment of workforce management KPIs that help our business in better workforce management. It includes parameters such as operational costs, overtime hours, etc.Present like a pro with Comparing Current And Desired Future State Strategic Approaches To Streamline Slides Pdf Create beautiful presentations together with your team, using our easy-to-use presentation slides. Share your ideas in real-time and make changes on the fly by downloading our templates. So whether you are in the office, on the go, or in a remote location, you can stay in sync with your team and present your ideas with confidence. With Slidegeeks presentation got a whole lot easier. Grab these presentations today. This slide provides glimpse about current state and future state assessment of workforce management KPIs that help our business in better workforce management. It includes parameters such as operational costs, overtime hours, etc.
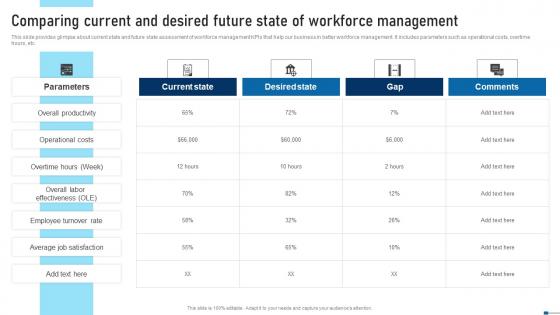
Comparing Current And Desired Future State Of Strategic Talent Recruitment Demonstration Pdf
This slide provides glimpse about current state and future state assessment of workforce management KPIs that help our business in better workforce management. It includes parameters such as operational costs, overtime hours, etc. Present like a pro with Comparing Current And Desired Future State Of Strategic Talent Recruitment Demonstration Pdf Create beautiful presentations together with your team, using our easy-to-use presentation slides. Share your ideas in real-time and make changes on the fly by downloading our templates. So whether you are in the office, on the go, or in a remote location, you can stay in sync with your team and present your ideas with confidence. With Slidegeeks presentation got a whole lot easier. Grab these presentations today. This slide provides glimpse about current state and future state assessment of workforce management KPIs that help our business in better workforce management. It includes parameters such as operational costs, overtime hours, etc.
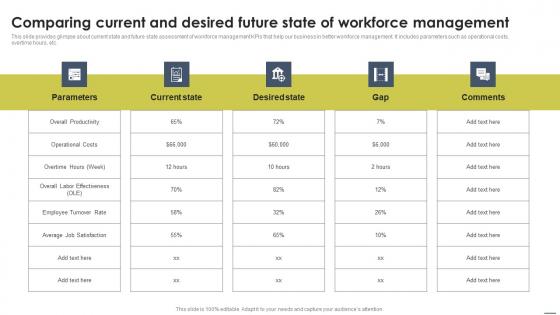
Comparing Current And Desired Future State Of Staff Management Approache Themes Pdf
This slide provides glimpse about current state and future state assessment of workforce management KPIs that help our business in better workforce management. It includes parameters such as operational costs, overtime hours, etc. Present like a pro with Comparing Current And Desired Future State Of Staff Management Approache Themes Pdf Create beautiful presentations together with your team, using our easy-to-use presentation slides. Share your ideas in real-time and make changes on the fly by downloading our templates. So whether you are in the office, on the go, or in a remote location, you can stay in sync with your team and present your ideas with confidence. With Slidegeeks presentation got a whole lot easier. Grab these presentations today. This slide provides glimpse about current state and future state assessment of workforce management KPIs that help our business in better workforce management. It includes parameters such as operational costs, overtime hours, etc.
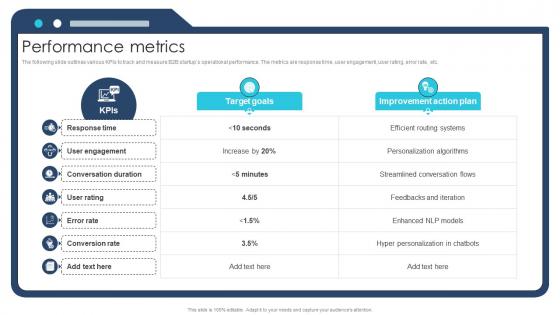
Performance Metrics Ai Chatbot Service Market Entry Strategy
The following slide outlines various KPIs to track and measure B2B startups operational performance. The metrics are response time, user engagement, user rating, error rate, etc.Crafting an eye-catching presentation has never been more straightforward. Let your presentation shine with this tasteful yet straightforward Performance Metrics Ai Chatbot Service Market Entry Strategy template. It offers a minimalistic and classy look that is great for making a statement. The colors have been employed intelligently to add a bit of playfulness while still remaining professional. Construct the ideal Performance Metrics Ai Chatbot Service Market Entry Strategy that effortlessly grabs the attention of your audience Begin now and be certain to wow your customers The following slide outlines various KPIs to track and measure B2B startups operational performance. The metrics are response time, user engagement, user rating, error rate, etc.

Performance Metrics Digital Physical Training Business Market Entry Plan GTM SS V
The following slide outlines various KPIs to track and measure business operational performance The metrics are conversion rate, churn rate, retention rate, engagement rate, social media reach and engagement and average session durationMake sure to capture your audiences attention in your business displays with our gratis customizable Performance Metrics Digital Physical Training Business Market Entry Plan GTM SS V. These are great for business strategies, office conferences, capital raising or task suggestions. If you desire to acquire more customers for your tech business and ensure they stay satisfied, create your own sales presentation with these plain slides. The following slide outlines various KPIs to track and measure business operational performance The metrics are conversion rate, churn rate, retention rate, engagement rate, social media reach and engagement and average session duration.

Performance Metrics Domotics Go To Market Strategy GTM SS V
The following slide outlines various KPIs to track and measure smart home automation startup operational performance. The metrics are CAC, CLTV, churn rate MRR, ARPU, etc.This modern and well-arranged Performance Metrics Domotics Go To Market Strategy GTM SS V provides lots of creative possibilities. It is very simple to customize and edit with the Powerpoint Software. Just drag and drop your pictures into the shapes. All facets of this template can be edited with Powerpoint, no extra software is necessary. Add your own material, put your images in the places assigned for them, adjust the colors, and then you can show your slides to the world, with an animated slide included. The following slide outlines various KPIs to track and measure smart home automation startup operational performance. The metrics are CAC, CLTV, churn rate MRR, ARPU, etc.
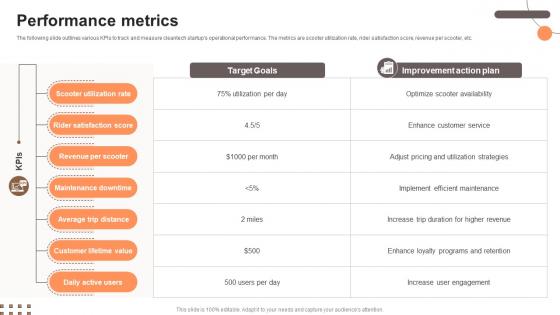
Performance Metrics Electric Scooter Rental Go To Market Strategy GTM SS V
The following slide outlines various KPIs to track and measure cleantech startups operational performance. The metrics are scooter utilization rate, rider satisfaction score, revenue per scooter, etc.This Performance Metrics Electric Scooter Rental Go To Market Strategy GTM SS V is perfect for any presentation, be it in front of clients or colleagues. It is a versatile and stylish solution for organizing your meetings. The Performance Metrics Electric Scooter Rental Go To Market Strategy GTM SS V features a modern design for your presentation meetings. The adjustable and customizable slides provide unlimited possibilities for acing up your presentation. Slidegeeks has done all the homework before launching the product for you. So, do not wait, grab the presentation templates today The following slide outlines various KPIs to track and measure cleantech startups operational performance. The metrics are scooter utilization rate, rider satisfaction score, revenue per scooter, etc.

Performance Metrics Smart Home Startup GTM Strategy GTM SS V
The following slide outlines various KPIs to track and measure smart home automation startup operational performance. The metrics are CAC, CLTV, churn rate MRR, ARPU, etc.Welcome to our selection of the Performance Metrics Smart Home Startup GTM Strategy GTM SS V. These are designed to help you showcase your creativity and bring your sphere to life. Planning and Innovation are essential for any business that is just starting out. This collection contains the designs that you need for your everyday presentations. All of our PowerPoints are 100 percent editable, so you can customize them to suit your needs. This multi-purpose template can be used in various situations. Grab these presentation templates today. The following slide outlines various KPIs to track and measure smart home automation startup operational performance. The metrics are CAC, CLTV, churn rate MRR, ARPU, etc.
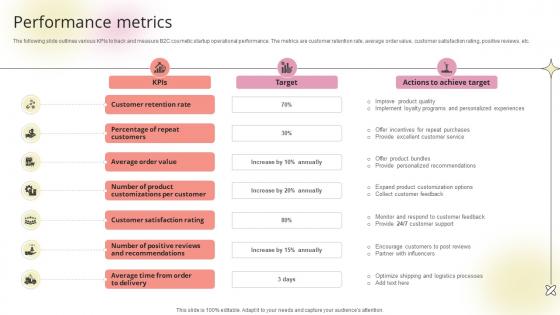
Performance Metrics Beauty Product Company Go To Market Strategy GTM SS V
The following slide outlines various KPIs to track and measure B2C cosmetic startup operational performance. The metrics are customer retention rate, average order value, customer satisfaction rating, positive reviews, etc.The best PPT templates are a great way to save time, energy, and resources. Slidegeeks have 100 percent editable powerpoint slides making them incredibly versatile. With these quality presentation templates, you can create a captivating and memorable presentation by combining visually appealing slides and effectively communicating your message. Download Performance Metrics Beauty Product Company Go To Market Strategy GTM SS V from Slidegeeks and deliver a wonderful presentation. The following slide outlines various KPIs to track and measure B2C cosmetic startup operational performance. The metrics are customer retention rate, average order value, customer satisfaction rating, positive reviews, etc.

Performance Metrics P2p Payment Startup Go To Market Strategy GTM SS V
The following slide outlines various KPIs to track and measure innovative fintech startups operational performance. The metrics are transaction volume, time spent on app, conversion rate, etc.Are you in need of a template that can accommodate all of your creative concepts This one is crafted professionally and can be altered to fit any style. Use it with Google Slides or PowerPoint. Include striking photographs, symbols, depictions, and other visuals. Fill, move around, or remove text boxes as desired. Test out color palettes and font mixtures. Edit and save your work, or work with colleagues. Download Performance Metrics P2p Payment Startup Go To Market Strategy GTM SS V and observe how to make your presentation outstanding. Give an impeccable presentation to your group and make your presentation unforgettable. The following slide outlines various KPIs to track and measure innovative fintech startups operational performance. The metrics are transaction volume, time spent on app, conversion rate, etc.

Performance Metrics Blind Shipping GTM Strategy GTM SS V
The following slide outlines various KPIs to track and measure drop shipping startups operational performance. The metrics are conversion rate, subscriptions, CAC, CLV, etc.Crafting an eye-catching presentation has never been more straightforward. Let your presentation shine with this tasteful yet straightforward Performance Metrics Blind Shipping GTM Strategy GTM SS V template. It offers a minimalistic and classy look that is great for making a statement. The colors have been employed intelligently to add a bit of playfulness while still remaining professional. Construct the ideal Performance Metrics Blind Shipping GTM Strategy GTM SS V that effortlessly grabs the attention of your audience Begin now and be certain to wow your customers The following slide outlines various KPIs to track and measure drop shipping startups operational performance. The metrics are conversion rate, subscriptions, CAC, CLV, etc.

Performance Metrics Information Technology Startup Go To Market Strategy GTM SS V
The following slide outlines various KPIs to track and measure IT startup operational performance. The metrics are response time, user satisfaction, error rate, time to resolution, capacity utilization, etc.Make sure to capture your audiences attention in your business displays with our gratis customizable Performance Metrics Information Technology Startup Go To Market Strategy GTM SS V. These are great for business strategies, office conferences, capital raising or task suggestions. If you desire to acquire more customers for your tech business and ensure they stay satisfied, create your own sales presentation with these plain slides. The following slide outlines various KPIs to track and measure IT startup operational performance. The metrics are response time, user satisfaction, error rate, time to resolution, capacity utilization, etc.

Performance Metrics E Scooter Business Market Entry Strategy
The following slide outlines various KPIs to track and measure cleantech startups operational performance. The metrics are scooter utilization rate, rider satisfaction score, revenue per scooter, etc.Crafting an eye-catching presentation has never been more straightforward. Let your presentation shine with this tasteful yet straightforward Performance Metrics E Scooter Business Market Entry Strategy template. It offers a minimalistic and classy look that is great for making a statement. The colors have been employed intelligently to add a bit of playfulness while still remaining professional. Construct the ideal Performance Metrics E Scooter Business Market Entry Strategy that effortlessly grabs the attention of your audience Begin now and be certain to wow your customers The following slide outlines various KPIs to track and measure cleantech startups operational performance. The metrics are scooter utilization rate, rider satisfaction score, revenue per scooter, etc.
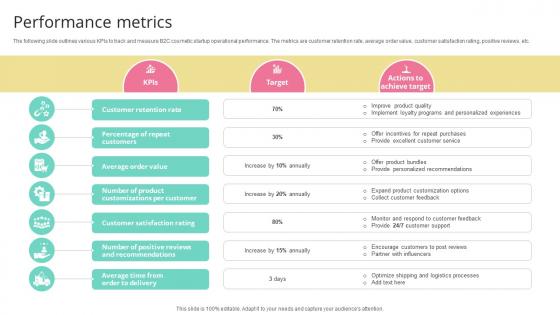
Performance Metrics Skincare Startup GTM Strategy GTM SS V
The following slide outlines various KPIs to track and measure B2C cosmetic startup operational performance. The metrics are customer retention rate, average order value, customer satisfaction rating, positive reviews, etc.Make sure to capture your audiences attention in your business displays with our gratis customizable Performance Metrics Skincare Startup GTM Strategy GTM SS V. These are great for business strategies, office conferences, capital raising or task suggestions. If you desire to acquire more customers for your tech business and ensure they stay satisfied, create your own sales presentation with these plain slides. The following slide outlines various KPIs to track and measure B2C cosmetic startup operational performance. The metrics are customer retention rate, average order value, customer satisfaction rating, positive reviews, etc.
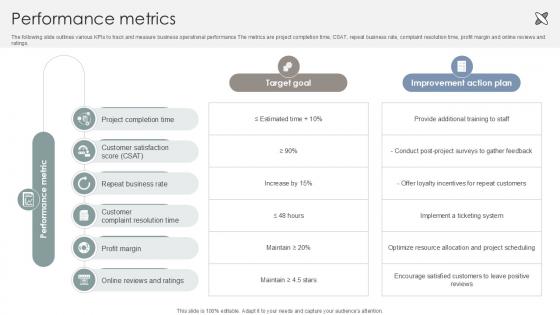
Performance Metrics Interior Design Company Market Entry Plan PPT PowerPoint GTM SS V
The following slide outlines various KPIs to track and measure business operational performance The metrics are project completion time, CSAT, repeat business rate, complaint resolution time, profit margin and online reviews and ratings. Crafting an eye-catching presentation has never been more straightforward. Let your presentation shine with this tasteful yet straightforward Performance Metrics Interior Design Company Market Entry Plan PPT PowerPoint GTM SS V template. It offers a minimalistic and classy look that is great for making a statement. The colors have been employed intelligently to add a bit of playfulness while still remaining professional. Construct the ideal Performance Metrics Interior Design Company Market Entry Plan PPT PowerPoint GTM SS V that effortlessly grabs the attention of your audience Begin now and be certain to wow your customers The following slide outlines various KPIs to track and measure business operational performance The metrics are project completion time, CSAT, repeat business rate, complaint resolution time, profit margin and online reviews and ratings.
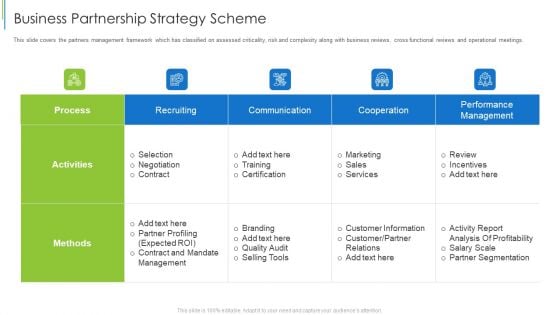
Business Partnership Strategy Scheme Ppt Infographics Demonstration PDF
This slide covers the partners management framework which has classified on assessed criticality, risk and complexity along with business reviews, cross functional reviews and operational meetings. Deliver and pitch your topic in the best possible manner with this business partnership strategy scheme ppt infographics demonstration pdf. Use them to share invaluable insights on recruiting, communication, cooperation, performance management and impress your audience. This template can be altered and modified as per your expectations. So, grab it now.
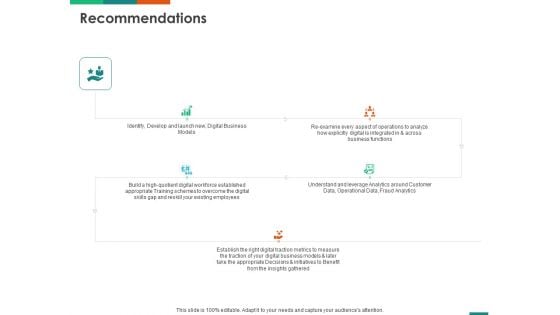
Transforming Enterprise Digitally Recommendations Business Ppt Professional Format Ideas PDF
Presenting this set of slides with name transforming enterprise digitally recommendations business ppt professional format ideas pdf. This is a five stage process. The stages in this process are identify, develop and launch new, digital business models, understand and leverage analytics around customer data, operational data, fraud analytics. This is a completely editable PowerPoint presentation and is available for immediate download. Download now and impress your audience.

Fixed Asset Management Framework Implementation Feature 2 Fixed Asset Lifecycle Management Infographics PDF
This slide represents fixed asst lifecycle management. It covers asset compliance management, asset visibility, asset disposal, optimum utilization of assets etc.Deliver and pitch your topic in the best possible manner with this Fixed Asset Management Framework Implementation Feature 2 Fixed Asset Lifecycle Management Infographics PDF Use them to share invaluable insights on Optimizing Asset, Operational Performance, Compliance Management and impress your audience. This template can be altered and modified as per your expectations. So, grab it now.
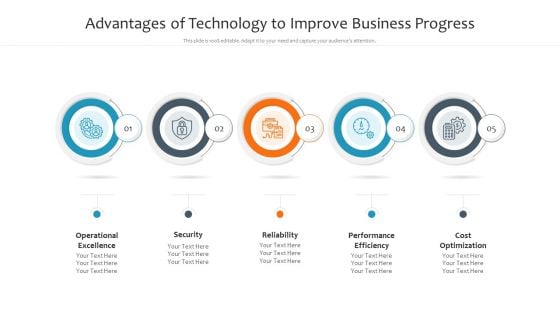
Advantages Of Technology To Improve Business Progress Ppt Infographics Structure PDF
Persuade your audience using this advantages of technology to improve business progress ppt infographics structure pdf.This PPT design covers five stages, thus making it a great tool to use. It also caters to a variety of topics including operational excellence, security, reliability, performance efficiency. Download this PPT design now to present a convincing pitch that not only emphasizes the topic but also showcases your presentation skills.
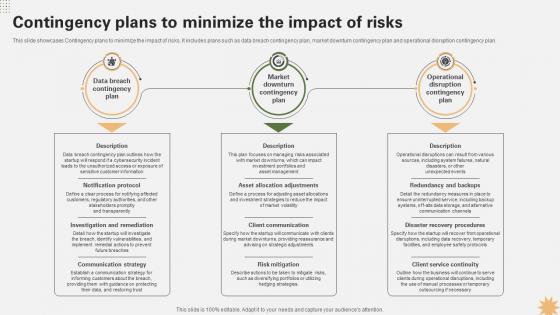
Contingency Plans To Minimize The Impact Strategy For Launching A Financial Strategy SS V
This slide showcases Contingency plans to minimize the impact of risks. It includes plans such as data breach contingency plan, market downturn contingency plan and operational disruption contingency plan. Want to ace your presentation in front of a live audience Our Contingency Plans To Minimize The Impact Strategy For Launching A Financial Strategy SS V can help you do that by engaging all the users towards you. Slidegeeks experts have put their efforts and expertise into creating these impeccable powerpoint presentations so that you can communicate your ideas clearly. Moreover, all the templates are customizable, and easy-to-edit and downloadable. Use these for both personal and commercial use. This slide showcases Contingency plans to minimize the impact of risks. It includes plans such as data breach contingency plan, market downturn contingency plan and operational disruption contingency plan.
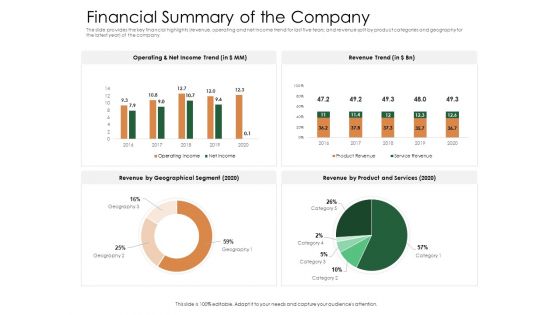
Substitute Financing Pitch Deck Financial Summary Of The Company Template PDF
the slide provides the key financial highlights revenue, operating and net income trend for last five tears and revenue split by product categories and geography for the latest year of the company. Deliver an awe inspiring pitch with this creative substitute financing pitch deck financial summary of the company template pdf bundle. Topics like services, revenue, product ,income can be discussed with this completely editable template. It is available for immediate download depending on the needs and requirements of the user.

ISO 9001 Standard For Quality Control Results After Implementation Of ISO 9001 Quality Systems Demonstration PDF
This template covers results of implication QMS ISO 9001 certification such as increasing customer satisfaction, operational efficiency, profitability, and export sales. Deliver an awe inspiring pitch with this creative ISO 9001 Standard For Quality Control Results After Implementation Of ISO 9001 Quality Systems Demonstration PDF bundle. Topics like Report Marketing Benefits, Report Increased Profitability, Report Improved Export Sales can be discussed with this completely editable template. It is available for immediate download depending on the needs and requirements of the user.
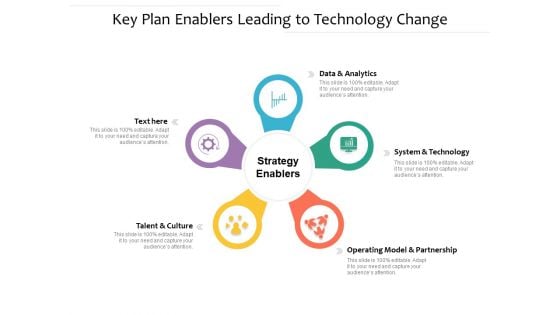
Key Plan Enablers Leading To Technology Change Ppt PowerPoint Presentation Ideas Layout PDF
Persuade your audience using this key plan enablers leading to technology change ppt powerpoint presentation ideas layout pdf. This PPT design covers five stages, thus making it a great tool to use. It also caters to a variety of topics including data and analytics, system and technology, operating model and partnership, strategy enablers, talent and culture. Download this PPT design now to present a convincing pitch that not only emphasizes the topic but also showcases your presentation skills.
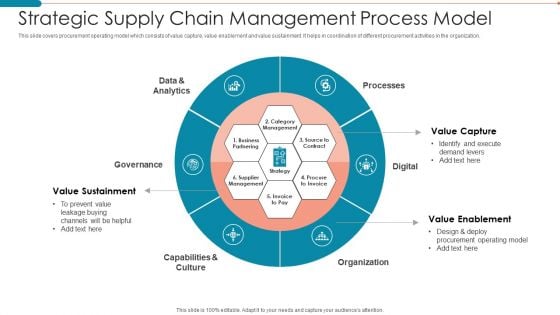
Strategic Supply Chain Management Process Model Mockup PDF
This slide covers procurement operating model which consists of value capture, value enablement and value sustainment. It helps in coordination of different procurement activities in the organization.Presenting Strategic Supply Chain Management Process Model Mockup PDF to dispense important information. This template comprises six stages. It also presents valuable insights into the topics including Data And Analytics, Value Capture, Value Enablement. This is a completely customizable PowerPoint theme that can be put to use immediately. So, download it and address the topic impactfully.
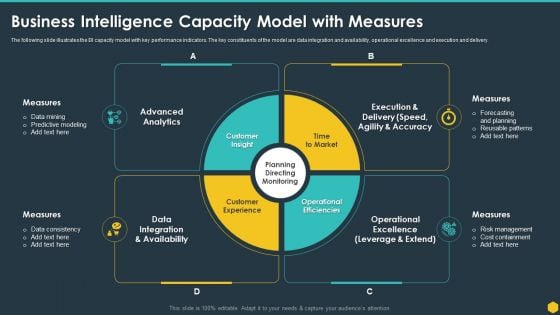
Business Intelligence Capacity Model With Measures BI Transformation Toolset Diagrams PDF
Presenting Business Intelligence Capacity Model With Measures BI Transformation Toolset Diagrams PDF to provide visual cues and insights. Share and navigate important information on four stages that need your due attention. This template can be used to pitch topics like Measures, Advanced Analytics, Data Mining, Customer Insight, Operational Efficiencies. In addtion, this PPT design contains high resolution images, graphics, etc, that are easily editable and available for immediate download.
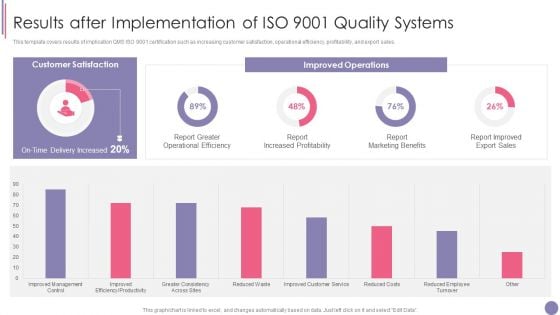
ISO 9001 Quality Assurance Software Accreditation Results After Implementation Of ISO 9001 Quality Systems Summary PDF
This template covers results of implication QMS ISO 9001 certification such as increasing customer satisfaction, operational efficiency, profitability, and export sales. Deliver and pitch your topic in the best possible manner with this ISO 9001 Quality Assurance Software Accreditation Results After Implementation Of ISO 9001 Quality Systems Summary PDF. Use them to share invaluable insights on Report Increased Profitability, Report Marketing Benefits, Quality Systems and impress your audience. This template can be altered and modified as per your expectations. So, grab it now.
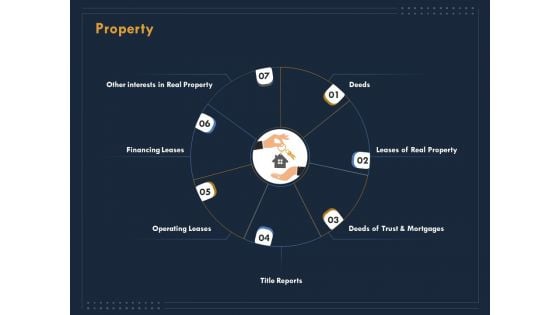
Enterprise Review Property Ppt Summary Portfolio PDF
This is a enterprise review property ppt summary portfolio pdf template with various stages. Focus and dispense information on seven stages using this creative set, that comes with editable features. It contains large content boxes to add your information on topics like financing leases, operating leases, title reports, deeds, mortgages. You can also showcase facts, figures, and other relevant content using this PPT layout. Grab it now.
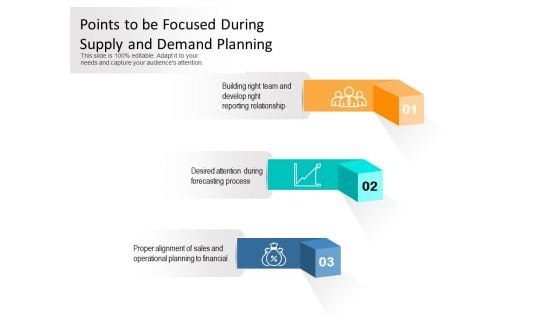
Points To Be Focused During Supply And Demand Planning Ppt PowerPoint Presentation Slides Shapes PDF
Presenting points to be focused during supply and demand planning ppt powerpoint presentation slides shapes pdf to dispense important information. This template comprises three stages. It also presents valuable insights into the topics including building right team and develop right reporting relationship, desired attention during forecasting process, proper alignment of sales and operational planning to financial. This is a completely customizable PowerPoint theme that can be put to use immediately. So, download it and address the topic impactfully.
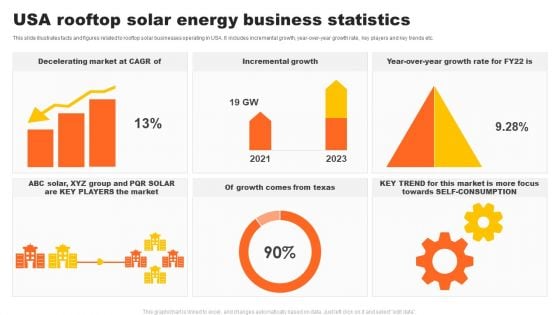
USA Rooftop Solar Energy Business Statistics Brochure PDF
This slide illustrates facts and figures related to rooftop solar businesses operating in USA. It includes incremental growth, year-over-year growth rate, key players and key trends etc. Showcasing this set of slides titled USA Rooftop Solar Energy Business Statistics Brochure PDF. The topics addressed in these templates are Decelerating Market, Incremental Growth, More Focus. All the content presented in this PPT design is completely editable. Download it and make adjustments in color, background, font etc. as per your unique business setting.
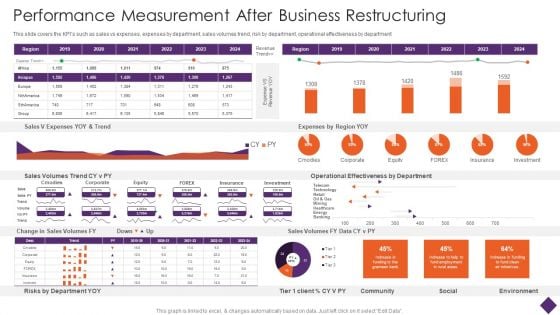
Business Restructuring Performance Measurement After Business Restructuring Themes PDF
This slide covers the KPIs such as sales vs expenses, expenses by department, sales volumes trend, risk by department, operational effectiveness by department. Deliver an awe inspiring pitch with this creative Business Restructuring Performance Measurement After Business Restructuring Themes PDF bundle. Topics like Sales V Expenses, YOY And Trend, Expenses Region YOY can be discussed with this completely editable template. It is available for immediate download depending on the needs and requirements of the user.
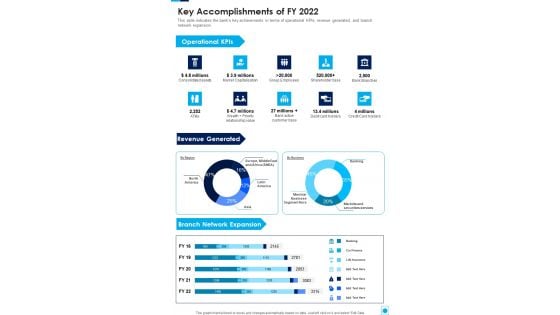
Key Accomplishments Of FY 2022 One Pager Documents
This slide indicates the banks key achievements in terms of operational KPIs, revenue generated, and branch network expansion. Presenting you a fantastic Key Accomplishments Of FY 2022 One Pager Documents. This piece is crafted on hours of research and professional design efforts to ensure you have the best resource. It is completely editable and its design allow you to rehash its elements to suit your needs. Get this Key Accomplishments Of FY 2022 One Pager Documents A4 One-pager now.
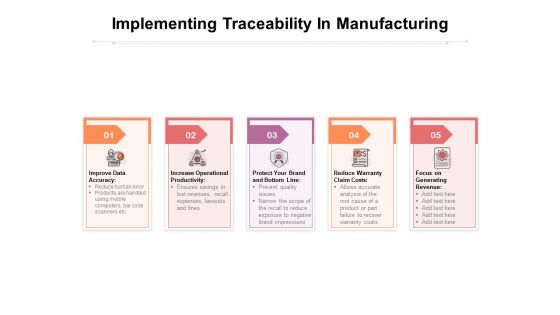
Implementing Traceability In Manufacturing Ppt PowerPoint Presentation Inspiration Example Topics PDF
Presenting this set of slides with name implementing traceability in manufacturing ppt powerpoint presentation inspiration example topics pdf. This is a five stage process. The stages in this process are improve data accuracy, increase operational productivity, protect your brand and bottom line reduce warranty claim costs, focus on generating revenue. This is a completely editable PowerPoint presentation and is available for immediate download. Download now and impress your audience.
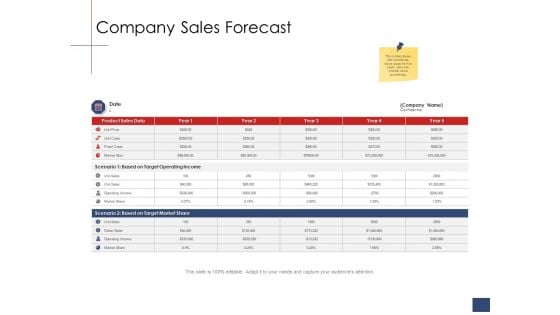
Business Assessment Outline Company Sales Forecast Ppt Layouts Ideas PDF
Deliver and pitch your topic in the best possible manner with this business assessment outline company sales forecast ppt layouts ideas pdf. Use them to share invaluable insights on product sales data, based target operating income, based target market share, unit sales, market share, dollar sales and impress your audience. This template can be altered and modified as per your expectations. So, grab it now.
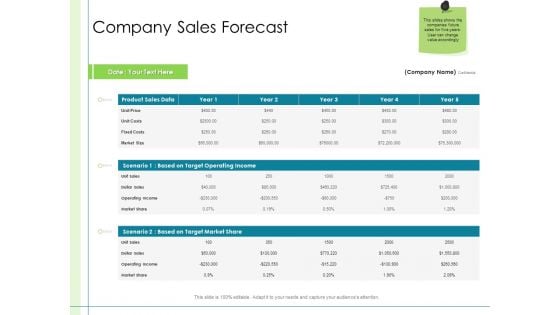
In Depth Business Assessment Company Sales Forecast Ppt PowerPoint Presentation Slides Guide PDF
Deliver and pitch your topic in the best possible manner with this in depth business assessment company sales forecast ppt powerpoint presentation slides guide pdf. Use them to share invaluable insights on product sales data, based target operating income, based target market share, unit sales, market share, dollar sales and impress your audience. This template can be altered and modified as per your expectations. So, grab it now.
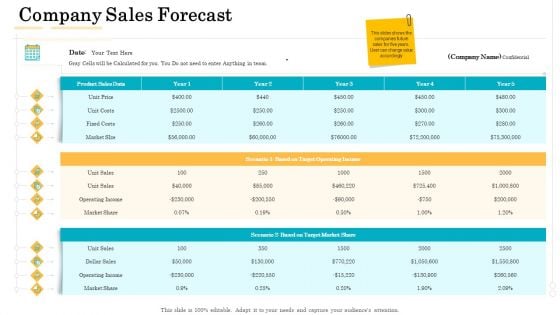
Administrative Regulation Company Sales Forecast Ppt PowerPoint Presentation Ideas Diagrams PDF
Deliver and pitch your topic in the best possible manner with this administrative regulation company sales forecast ppt powerpoint presentation ideas diagrams pdf. Use them to share invaluable insights on product sales data, based target operating income, based target market share, unit sales, market share, dollar sales and impress your audience. This template can be altered and modified as per your expectations. So, grab it now.

Implementation Of Sales Functions Infinity Loop Ppt PowerPoint Presentation Infographic Template Show PDF
Presenting implementation of sales functions infinity loop ppt powerpoint presentation infographic template show pdf to dispense important information. This template comprises six stages. It also presents valuable insights into the topics including manage customer data, sales strategy and planning, build agility to respond to changing market conditions, right information to the right role, improve productivity, gain operating intelligence. This is a completely customizable PowerPoint theme that can be put to use immediately. So, download it and address the topic impactfully.
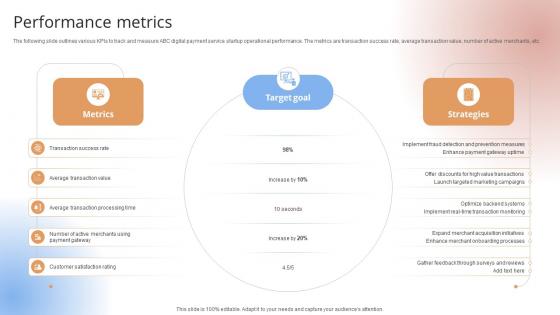
Performance Metrics Payment Gateway Provider Startup GTM Strategy GTM SS V
The following slide outlines various KPIs to track and measure ABC digital payment service startup operational performance. The metrics are transaction success rate, average transaction value, number of active merchants, etc.The following slide outlines various KPIs to track and measure ABC digital payment service startup operational performance. The metrics are transaction success rate, average transaction value, number of active merchants, etc.Coming up with a presentation necessitates that the majority of the effort goes into the content and the message you intend to convey. The visuals of a PowerPoint presentation can only be effective if it supplements and supports the story that is being told. Keeping this in mind our experts created Performance Metrics Payment Gateway Provider Startup GTM Strategy GTM SS V to reduce the time that goes into designing the presentation. This way, you can concentrate on the message while our designers take care of providing you with the right template for the situation. The following slide outlines various KPIs to track and measure ABC digital payment service startup operational performance. The metrics are transaction success rate, average transaction value, number of active merchants, etc.
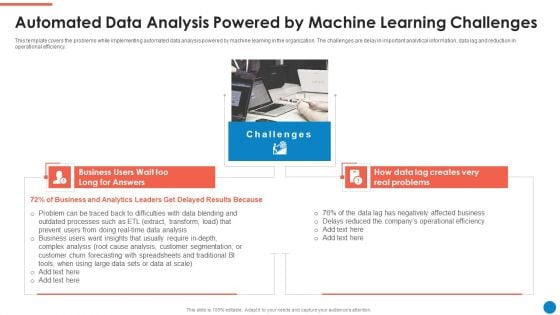
Data And Analytics Playbook Automated Data Analysis Powered By Machine Themes PDF
This template covers the problems while implementing automated data analysis powered by machine learning in the organization. The challenges are delay in important analytical information, data lag and reduction in operational efficiency. Presenting Data And Analytics Playbook Automated Data Analysis Powered By Machine Themes PDF to provide visual cues and insights. Share and navigate important information on two stages that need your due attention. This template can be used to pitch topics like Challenges, Data Lag Creates, Real Problems, Business Users. In addtion, this PPT design contains high resolution images, graphics, etc, that are easily editable and available for immediate download.
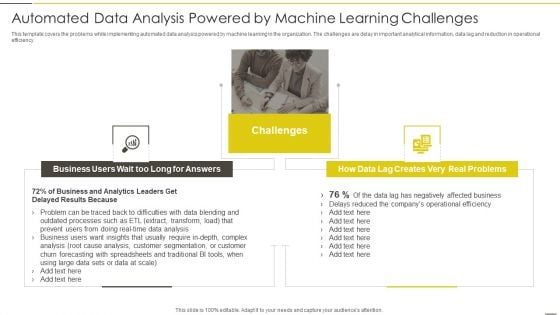
Administered Data And Analytic Quality Playbook Automated Data Analysis Powered Structure PDF
This template covers the problems while implementing automated data analysis powered by machine learning in the organization. The challenges are delay in important analytical information, data lag and reduction in operational efficiency.This is a Administered Data And Analytic Quality Playbook Automated Data Analysis Powered Structure PDF template with various stages. Focus and dispense information on two stages using this creative set, that comes with editable features. It contains large content boxes to add your information on topics like Business Analytics, Challenges Negatively, Affected Business You can also showcase facts, figures, and other relevant content using this PPT layout. Grab it now.
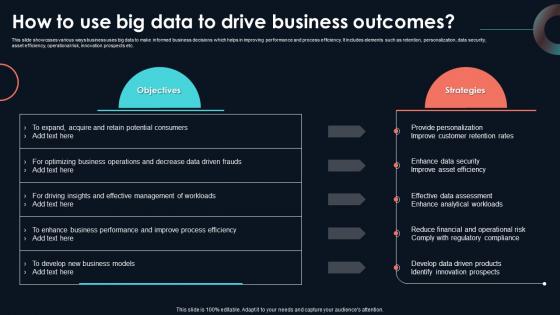
How To Use Big Data To Drive Business Developing Strategic Insights Using Big Data Analytics SS V
This slide showcases various ways business uses big data to make informed business decisions which helps in improving performance and process efficiency. It includes elements such as retention, personalization, data security, asset efficiency, operational risk, innovation prospects etc. Here you can discover an assortment of the finest PowerPoint and Google Slides templates. With these templates, you can create presentations for a variety of purposes while simultaneously providing your audience with an eye-catching visual experience. Download How To Use Big Data To Drive Business Developing Strategic Insights Using Big Data Analytics SS V to deliver an impeccable presentation. These templates will make your job of preparing presentations much quicker, yet still, maintain a high level of quality. Slidegeeks has experienced researchers who prepare these templates and write high-quality content for you. Later on, you can personalize the content by editing the How To Use Big Data To Drive Business Developing Strategic Insights Using Big Data Analytics SS V. This slide showcases various ways business uses big data to make informed business decisions which helps in improving performance and process efficiency. It includes elements such as retention, personalization, data security, asset efficiency, operational risk, innovation prospects etc.
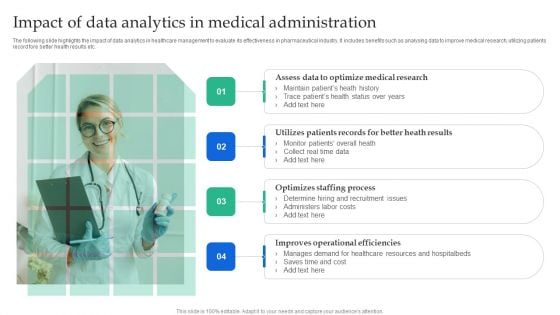
Impact Of Data Analytics In Medical Administration Pictures PDF
The following slide highlights the impact of data analytics in healthcare management to evaluate its effectiveness in pharmaceutical industry. It includes benefits such as analysing data to improve medical research, utilizing patients record fore better health results etc.Pitch your topic with ease and precision using this Impact Of Data Analytics In Medical Administration Pictures PDF. This layout presents information on Determine Hiring, Administers Labor, Operational Efficiencies. It is also available for immediate download and adjustment. So, changes can be made in the color, design, graphics or any other component to create a unique layout.
Business To Business Digital Google Data Studio Reports Icons PDF
This template covers tools to measure marketing analytics such as google analytics for all web tracking, google data studio to build real-time reporting dashboards and google data studio reports. Whether you have daily or monthly meetings, a brilliant presentation is necessary. Business To Business Digital Google Data Studio Reports Icons PDF can be your best option for delivering a presentation. Represent everything in detail using Business To Business Digital Google Data Studio Reports Icons PDF and make yourself stand out in meetings. The template is versatile and follows a structure that will cater to your requirements. All the templates prepared by Slidegeeks are easy to download and edit. Our research experts have taken care of the corporate themes as well. So, give it a try and see the results.
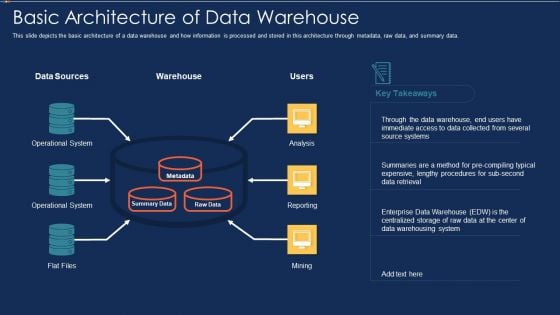
Data Warehousing IT Basic Architecture Of Data Warehouse Ppt Show Example PDF
This slide depicts the basic architecture of a data warehouse and how information is processed and stored in this architecture through metadata, raw data, and summary data. This is a data warehousing it basic architecture of data warehouse ppt show example pdf template with various stages. Focus and dispense information on six stages using this creative set, that comes with editable features. It contains large content boxes to add your information on topics like operational system, analysis, reporting, mining, flat files. You can also showcase facts, figures, and other relevant content using this PPT layout. Grab it now.
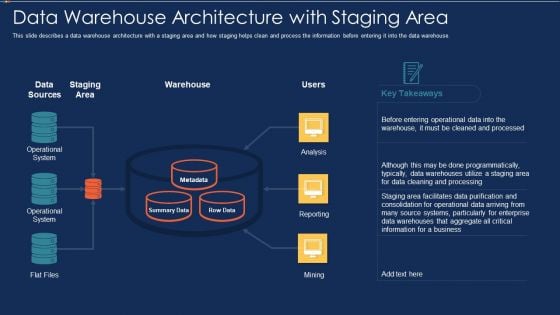
Data Warehousing IT Data Warehouse Architecture With Staging Area Ppt Styles Objects PDF
This slide describes a data warehouse architecture with a staging area and how staging helps clean and process the information before entering it into the data warehouse. Presenting data warehousing it data warehouse architecture with staging area ppt styles objects pdf to provide visual cues and insights. Share and navigate important information on three stages that need your due attention. This template can be used to pitch topics like operational system, analysis, reporting, mining, flat files. In addtion, this PPT design contains high resolution images, graphics, etc, that are easily editable and available for immediate download.
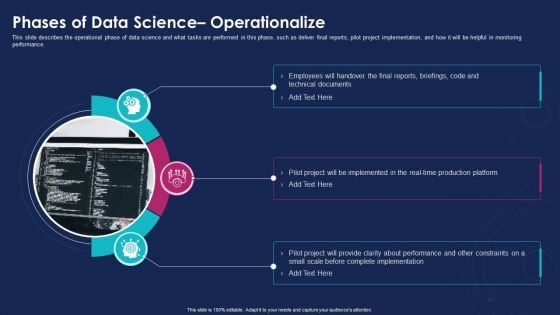
Data Analytics IT Phases Of Data Science Operationalize Ppt Summary Clipart PDF
This slide describes the operational phase of data science and what tasks are performed in this phase, such as deliver final reports, pilot project implementation, and how it will be helpful in monitoring performance. This is a data analytics it phases of data science operationalize ppt summary clipart pdf template with various stages. Focus and dispense information on three stages using this creative set, that comes with editable features. It contains large content boxes to add your information on topics like technical, implemented, performance. You can also showcase facts, figures, and other relevant content using this PPT layout. Grab it now.
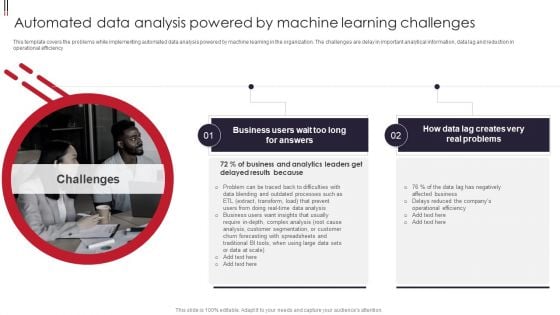
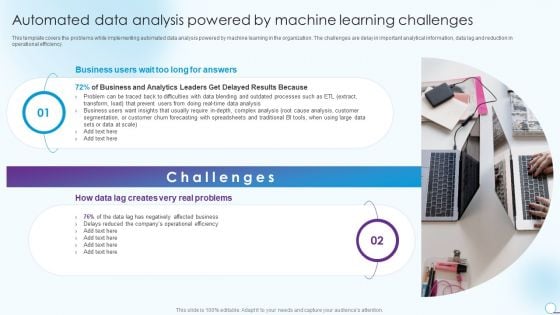
Automated Data Analysis Powered By Machine Learning Challenges Microsoft PDF
This template covers the problems while implementing automated data analysis powered by machine learning in the organization. The challenges are delay in important analytical information, data lag and reduction in operational efficiency. This is a Automated Data Analysis Powered By Machine Learning Challenges Microsoft PDF template with various stages. Focus and dispense information on two stages using this creative set, that comes with editable features. It contains large content boxes to add your information on topics like Business And Analytics, Customer Segmentation, Complex Analysis. You can also showcase facts, figures, and other relevant content using this PPT layout. Grab it now.
Automated Data Analysis Powered By Machine Learning Challenges Ideas PDF
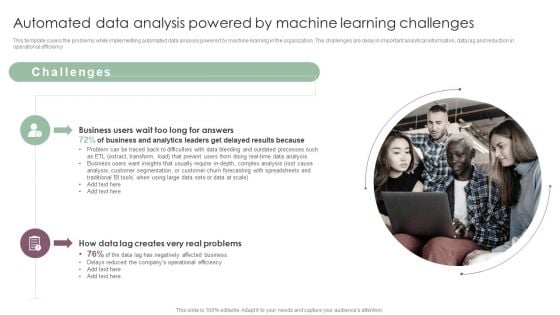
This template covers the problems while implementing automated data analysis powered by machine learning in the organization. The challenges are delay in important analytical information, data lag and reduction in operational efficiency. Presenting Automated Data Analysis Powered By Machine Learning Challenges Ideas PDF to provide visual cues and insights. Share and navigate important information on two stages that need your due attention. This template can be used to pitch topics like Data Analysis Business, Complex Analysis, Root Cause Analysis. In addtion, this PPT design contains high resolution images, graphics, etc, that are easily editable and available for immediate download.
Automated Data Analysis Powered By Machine Learning Challenges Pictures PDF
This template covers the problems while implementing automated data analysis powered by machine learning in the organization. The challenges are delay in important analytical information, data lag and reduction in operational efficiency. Find a pre designed and impeccable Automated Data Analysis Powered By Machine Learning Challenges Pictures PDF. The templates can ace your presentation without additional effort. You can download these easy to edit presentation templates to make your presentation stand out from others. So, what are you waiting for Download the template from Slidegeeks today and give a unique touch to your presentation.
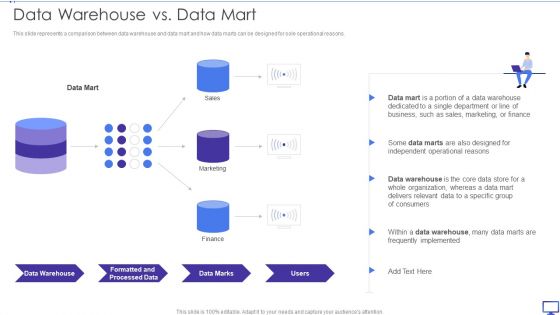
Decision Support System Data Warehouse Vs Data Mart Ppt Gallery Portrait PDF
This slide represents a comparison between data warehouse and data mart and how data marts can be designed for sole operational reasons. This is a Decision Support System Data Warehouse Vs Data Mart Ppt Gallery Portrait PDF template with various stages. Focus and dispense information on one stages using this creative set, that comes with editable features. It contains large content boxes to add your information on topics like Data Mart, Sales, Marketing, Finance. You can also showcase facts, figures, and other relevant content using this PPT layout. Grab it now.


 Continue with Email

 Home
Home


