It Operations Dashboard

Devops Project Incident Administration Dashboard Diagrams PDF
This slide depicts developer operations DevOps project incident management dashboard. It provides information about after hour, daytime, escalation policy, escalations made, etc. Showcasing this set of slides titled Devops Project Incident Administration Dashboard Diagrams PDF. The topics addressed in these templates are Devops Project Incident, Administration Dashboard. All the content presented in this PPT design is completely editable. Download it and make adjustments in color, background, font etc. as per your unique business setting.
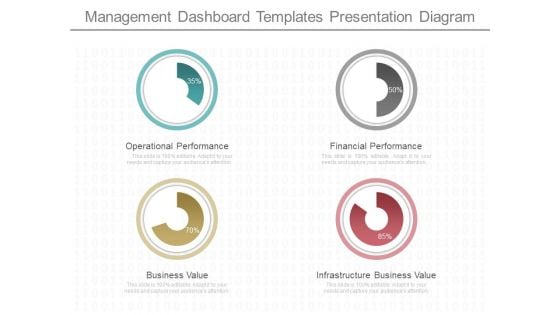
Management Dashboard Templates Presentation Diagram
This is a management dashboard templates presentation diagram. This is a four stage process. The stages in this process are operational performance, business value, financial performance, infrastructure business value.
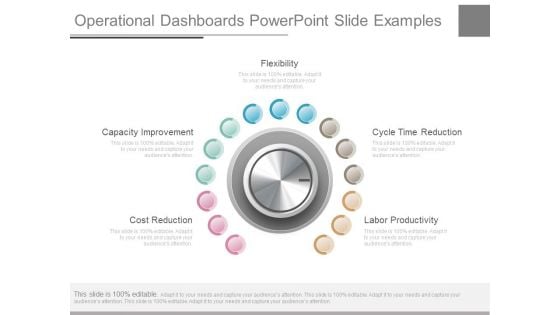
Operational Dashboards Powerpoint Slide Examples
This is a operational dashboards powerpoint slide examples. This is a five stage process. The stages in this process are cost reduction, capacity improvement, flexibility, cycle time reduction, labor productivity.
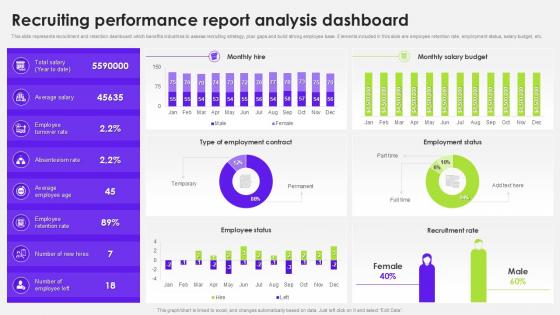
Recruiting Performance Report Analysis Dashboard
Welcome to our selection of the Recruiting Performance Report Analysis Dashboard. These are designed to help you showcase your creativity and bring your sphere to life. Planning and Innovation are essential for any business that is just starting out. This collection contains the designs that you need for your everyday presentations. All of our PowerPoints are 100Percent editable, so you can customize them to suit your needs. This multi-purpose template can be used in various situations. Grab these presentation templates today. This slide illustrates a recruitment and retention dashboard, which benefits industries by allowing them to assess recruiting strategy, plan gaps, and build a strong employee base. It includes employee retention rate, employment status, salary budget, etc.
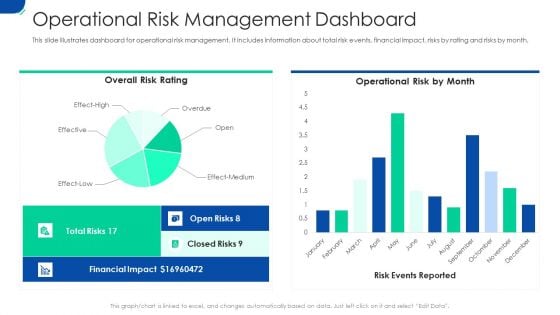
Initiating Hazard Managing Structure Firm Operational Risk Management Dashboard Brochure PDF
This slide illustrates dashboard for operational risk management. It includes information about total risk events, financial impact, risks by rating and risks by month. Deliver an awe-inspiring pitch with this creative initiating hazard managing structure firm operational risk management dashboard brochure pdf bundle. Topics like financial impact, operational risk, risk events, risk rating can be discussed with this completely editable template. It is available for immediate download depending on the needs and requirements of the user.
Operational Risk Assessment And Management Plan Operational Risk Management Key Metrics Dashboard Icons PDF
This slide represents dashboard representing the key metrics of operational risk management. It includes KPIs such as operational risk by rating, by month, operational risk list etc. The Operational Risk Assessment And Management Plan Operational Risk Management Key Metrics Dashboard Icons PDF is a compilation of the most recent design trends as a series of slides. It is suitable for any subject or industry presentation, containing attractive visuals and photo spots for businesses to clearly express their messages. This template contains a variety of slides for the user to input data, such as structures to contrast two elements, bullet points, and slides for written information. Slidegeeks is prepared to create an impression.
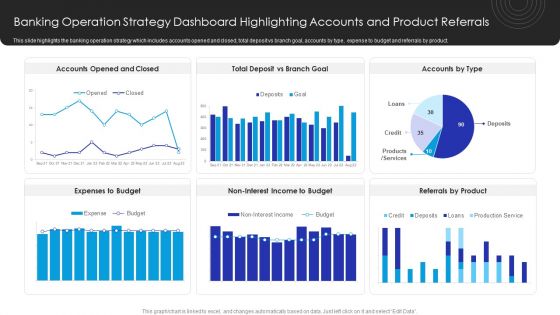
Operational Innovation In Banking Banking Operation Strategy Dashboard Highlighting Inspiration PDF
This slide highlights the banking operation strategy which includes accounts opened and closed, total deposit vs branch goal, accounts by type, expense to budget and referrals by product. Create an editable Operational Innovation In Banking Banking Operation Strategy Dashboard Highlighting Inspiration PDF that communicates your idea and engages your audience. Whether youre presenting a business or an educational presentation, pre-designed presentation templates help save time. Operational Innovation In Banking Banking Operation Strategy Dashboard Highlighting Inspiration PDF is highly customizable and very easy to edit, covering many different styles from creative to business presentations. Slidegeeks has creative team members who have crafted amazing templates. So, go and get them without any delay.
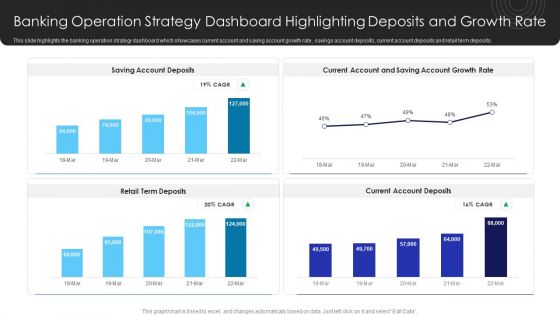
Operational Innovation In Banking Banking Operation Strategy Dashboard Highlighting Deposits Clipart PDF
This slide highlights the banking operation strategy dashboard which showcases current account and saving account growth rate, savings account deposits, current account deposits and retail term deposits. Boost your pitch with our creative Operational Innovation In Banking Banking Operation Strategy Dashboard Highlighting Deposits Clipart PDF. Deliver an awe-inspiring pitch that will mesmerize everyone. Using these presentation templates you will surely catch everyones attention. You can browse the ppts collection on our website. We have researchers who are experts at creating the right content for the templates. So you dont have to invest time in any additional work. Just grab the template now and use them.
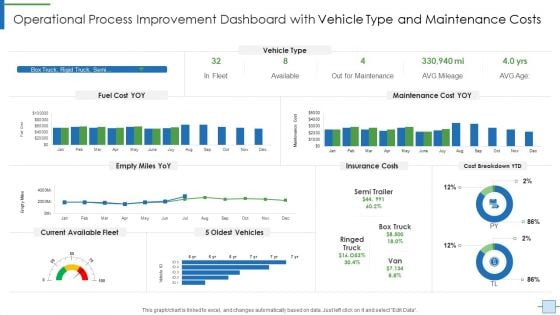
Operational Efficiency Execution Strategy Improve Quality Operational Process Improvement Dashboard Microsoft PDF
Deliver an awe inspiring pitch with this creative operational efficiency execution strategy improve quality operational process improvement dashboard microsoft pdf bundle. Topics like fuel cost, maintenance cost, insurance costs can be discussed with this completely editable template. It is available for immediate download depending on the needs and requirements of the user.
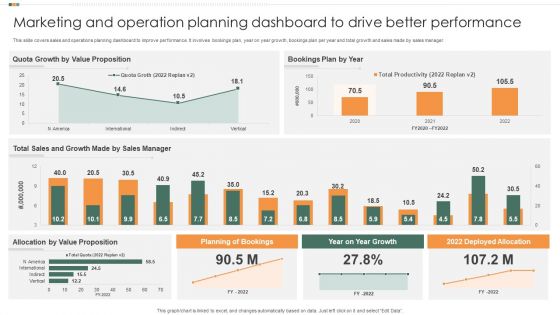
Marketing And Operation Planning Dashboard To Drive Better Performance Graphics PDF
This slide covers sales and operations planning dashboard to improve performance. It involves bookings plan, year on year growth, bookings plan per year and total growth and sales made by sales manager. Showcasing this set of slides titled Marketing And Operation Planning Dashboard To Drive Better Performance Graphics PDF. The topics addressed in these templates are Sales Manager, Growth Made, Bookings Plan By Year. All the content presented in this PPT design is completely editable. Download it and make adjustments in color, background, font etc. as per your unique business setting.
Marketing Business Operational Excellence Plan KPI Dashboard Ppt Icon Design Ideas PDF
This slide shows marketing KPIs dashboard for operational excellence strategy of an organization. It includes metrics such as total spending, total clicks, cost per acquisition, and campaigns. Showcasing this set of slides titled Marketing Business Operational Excellence Plan KPI Dashboard Ppt Icon Design Ideas PDF. The topics addressed in these templates are Daily Impressions, Acquisitions Campaign. All the content presented in this PPT design is completely editable. Download it and make adjustments in color, background, font etc. as per your unique business setting.
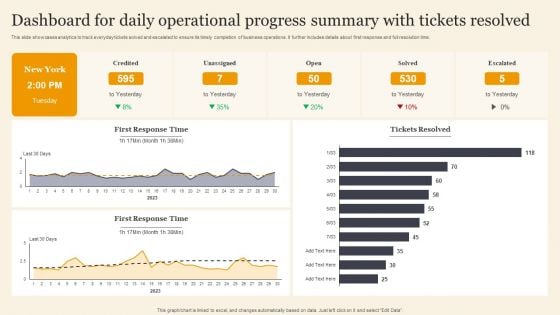
Dashboard For Daily Operational Progress Summary With Tickets Resolved Background PDF
This slide showcases analytics to track everyday tickets solved and escalated to ensure its timely completion of business operations. It further includes details about first response and full resolution time. Pitch your topic with ease and precision using this Dashboard For Daily Operational Progress Summary With Tickets Resolved Background PDF. This layout presents information on Dashboard For Daily Operational, Progress Summary, Tickets Resolved. It is also available for immediate download and adjustment. So, changes can be made in the color, design, graphics or any other component to create a unique layout.
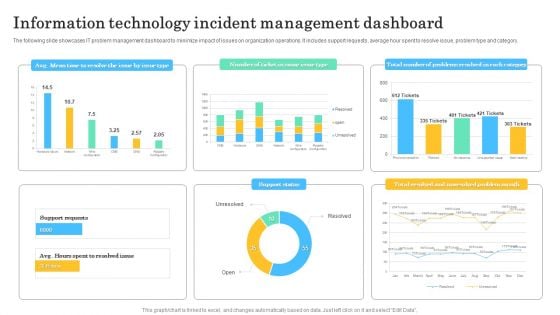
Information Technology Incident Management Dashboard Infographics PDF
The following slide showcases IT problem management dashboard to minimize impact of issues on organization operations. It includes support requests, average hour spent to resolve issue, problem type and category. Showcasing this set of slides titled Information Technology Incident Management Dashboard Infographics PDF. The topics addressed in these templates are Avg Mean Time, Resolve The Issue, Issue Type. All the content presented in this PPT design is completely editable. Download it and make adjustments in color, background, font etc. as per your unique business setting.
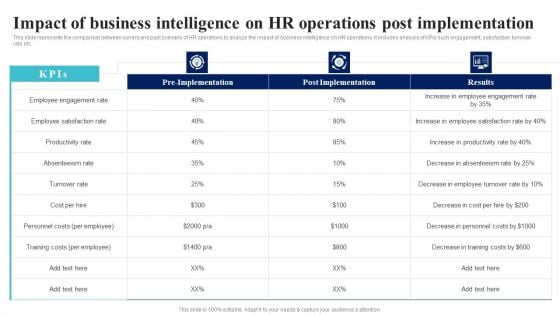
BI Implementation To Enhance Hiring Process Impact Of Business Intelligence On Hr Operations Post Implementation Microsoft PDF
This slide represents the comparison between current and past scenario of HR operations to analyze the impact of business intelligence on HR operations. It includes analysis of KPIs such engagement, satisfaction, turnover rate etc.Explore a selection of the finest BI Implementation To Enhance Hiring Process Impact Of Business Intelligence On Hr Operations Post Implementation Microsoft PDF here. With a plethora of professionally designed and pre-made slide templates, you can quickly and easily find the right one for your upcoming presentation. You can use our BI Implementation To Enhance Hiring Process Impact Of Business Intelligence On Hr Operations Post Implementation Microsoft PDF to effectively convey your message to a wider audience. Slidegeeks has done a lot of research before preparing these presentation templates. The content can be personalized and the slides are highly editable. Grab templates today from Slidegeeks.
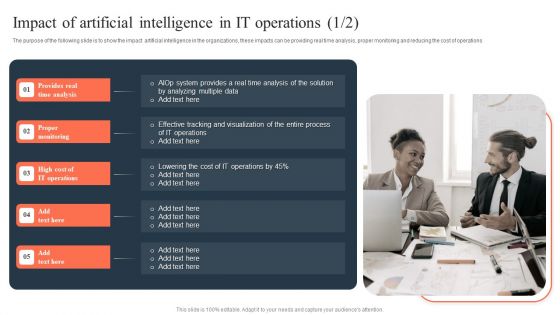
Ml And Big Data In Information Technology Processes Impact Of Artificial Intelligence In IT Operations Professional PDF
The purpose of the following slide is to show the impact artificial intelligence in the organizations, these impacts can be providing real time analysis, proper monitoring and reducing the cost of operations Get a simple yet stunning designed Ml And Big Data In Information Technology Processes Impact Of Artificial Intelligence In IT Operations Professional PDF. It is the best one to establish the tone in your meetings. It is an excellent way to make your presentations highly effective. So, download this PPT today from Slidegeeks and see the positive impacts. Our easy to edit Ml And Big Data In Information Technology Processes Impact Of Artificial Intelligence In IT Operations Professional PDF can be your go to option for all upcoming conferences and meetings. So, what are you waiting for Grab this template today.
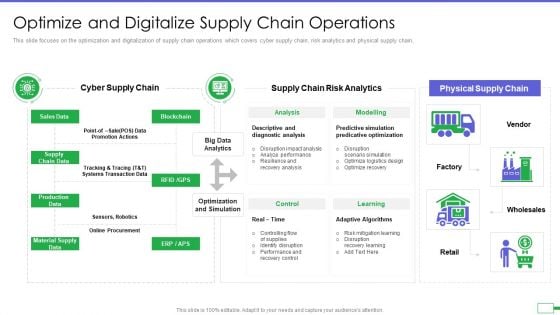
Iot And Digital Twin To Reduce Costs Post Covid Optimize And Digitalize Supply Chain Operations Demonstration PDF
This slide focuses on the optimization and digitalization of supply chain operations which covers cyber supply chain, risk analytics and physical supply chain. Deliver an awe inspiring pitch with this creative iot and digital twin to reduce costs post covid optimize and digitalize supply chain operations demonstration pdf bundle. Topics like sales data, material supply data, production data, supply chain data can be discussed with this completely editable template. It is available for immediate download depending on the needs and requirements of the user.
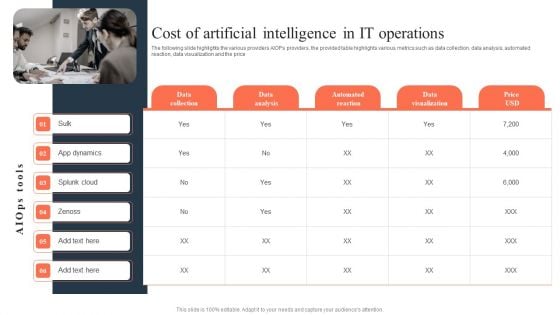
Ml And Big Data In Information Technology Processes Cost Of Artificial Intelligence In IT Operations Infographics PDF
The following slide highlights the various providers AIOPs providers, the provided table highlights various metrics such as data collection, data analysis, automated reaction, data visualization and the price Do you have to make sure that everyone on your team knows about any specific topic I yes, then you should give Ml And Big Data In Information Technology Processes Cost Of Artificial Intelligence In IT Operations Infographics PDF a try. Our experts have put a lot of knowledge and effort into creating this impeccable Ml And Big Data In Information Technology Processes Cost Of Artificial Intelligence In IT Operations Infographics PDF. You can use this template for your upcoming presentations, as the slides are perfect to represent even the tiniest detail. You can download these templates from the Slidegeeks website and these are easy to edit. So grab these today.

Ways To Design Impactful Trading Solution Sales Operations Strategy Scorecard Ppt PowerPoint Presentation Show Slide Portrait PDF
Presenting this set of slides with name ways to design impactful trading solution sales operations strategy scorecard ppt powerpoint presentation show slide portrait pdf. The topics discussed in these slides are programs, initiatives, and actions, key performance indicators and metrics, target timeframe to achieve goals, sales compensation plan redesign, sales skills assessment. This is a completely editable PowerPoint presentation and is available for immediate download. Download now and impress your audience.
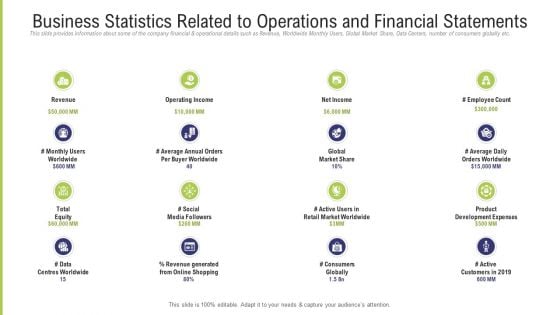
Funding Pitch Deck To Obtain Long Term Debt From Banks Business Statistics Related To Operations And Financial Statements Graphics PDF
This slide provides information about some of the company financial and operational details such as Revenue, Worldwide Monthly Users, Global Market Share, Data Centers, number of consumers globally etc. This is a funding pitch deck to obtain long term debt from banks business statistics related to operations and financial statements graphics pdf template with various stages. Focus and dispense information on one stage using this creative set, that comes with editable features. It contains large content boxes to add your information on topics like revenue, social media, net income, global market share, data centres worldwide. You can also showcase facts, figures, and other relevant content using this PPT layout. Grab it now.
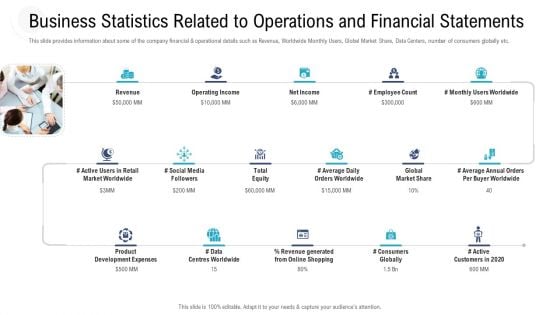
Investor Pitch Deck Procure Federal Debt From Banks Business Statistics Related To Operations And Financial Statements Download PDF
This slide provides information about some of the company financial and operational details such as Revenue, Worldwide Monthly Users, Global Market Share, Data Centers, number of consumers globally etc. This is a investor pitch deck procure federal debt from banks business statistics related to operations and financial statements download pdf template with various stages. Focus and dispense information on one stage using this creative set, that comes with editable features. It contains large content boxes to add your information on topics like revenue, operating income, data centres worldwide, product development expenses, social media. You can also showcase facts, figures, and other relevant content using this PPT layout. Grab it now.
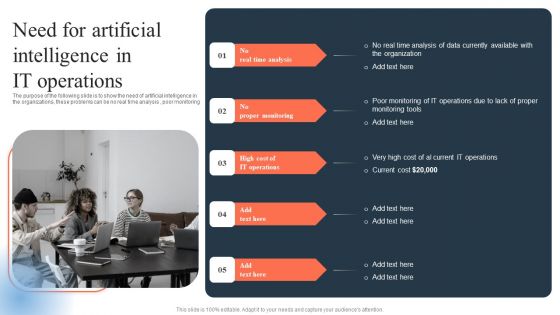
Ml And Big Data In Information Technology Processes Need For Artificial Intelligence In IT Operations Structure PDF
The purpose of the following slide is to show the need of artificial intelligence in the organizations, these problems can be no real time analysis , poor monitoring From laying roadmaps to briefing everything in detail, our templates are perfect for you. You can set the stage with your presentation slides. All you have to do is download these easy to edit and customizable templates. Ml And Big Data In Information Technology Processes Need For Artificial Intelligence In IT Operations Structure PDF will help you deliver an outstanding performance that everyone would remember and praise you for. Do download this presentation today.
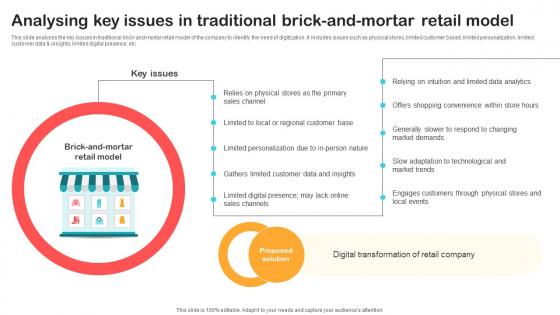
Analysing Key Issues In Traditional Brick And Mortar Retail Optimizing Retail Operations With Digital DT SS V
This slide analyses the key issues in traditional brick-and-mortar retail model of the company to identify the need of digitization. It includes issues such as physical stores, limited customer based, limited personalization, limited customer data and insights, limited digital presence, etc.Do you have to make sure that everyone on your team knows about any specific topic I yes, then you should give Analysing Key Issues In Traditional Brick And Mortar Retail Optimizing Retail Operations With Digital DT SS V a try. Our experts have put a lot of knowledge and effort into creating this impeccable Analysing Key Issues In Traditional Brick And Mortar Retail Optimizing Retail Operations With Digital DT SS V. You can use this template for your upcoming presentations, as the slides are perfect to represent even the tiniest detail. You can download these templates from the Slidegeeks website and these are easy to edit. So grab these today This slide analyses the key issues in traditional brick-and-mortar retail model of the company to identify the need of digitization. It includes issues such as physical stores, limited customer based, limited personalization, limited customer data and insights, limited digital presence, etc.
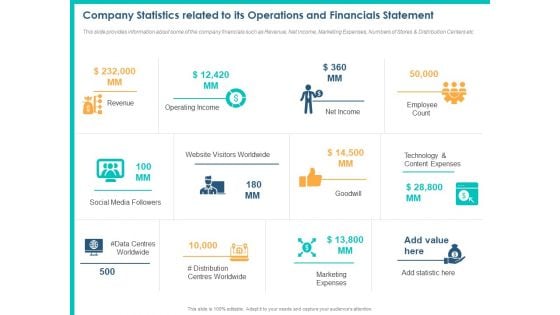
PPM Private Equity Company Statistics Related To Its Operations And Financials Statement Ppt PowerPoint Presentation Show Portrait PDF
This slide provides information about some of the company financials such as Revenue, Net Income, Marketing Expenses, Numbers of Stores and Distribution Centers etc. This is a ppm private equity company statistics related to its operations and financials statement ppt powerpoint presentation show portrait pdf template with various stages. Focus and dispense information on one stages using this creative set, that comes with editable features. It contains large content boxes to add your information on topics like revenue, operating income, net income, employee count, website visitors worldwide, technology and content expenses, social media followers, data centres worldwide, distribution centres worldwide, marketing expenses. You can also showcase facts, figures, and other relevant content using this PPT layout. Grab it now.
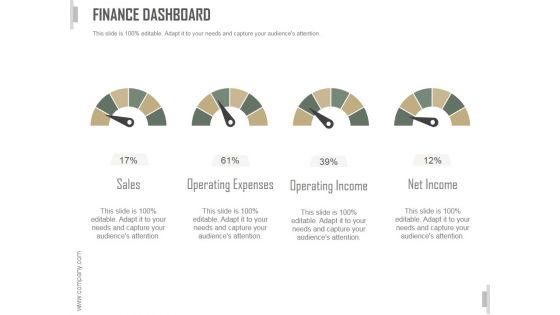
Finance Dashboard Ppt PowerPoint Presentation Clipart
This is a finance dashboard ppt powerpoint presentation clipart. This is a four stage process. The stages in this process are sales, operating expenses, operating income, net income.
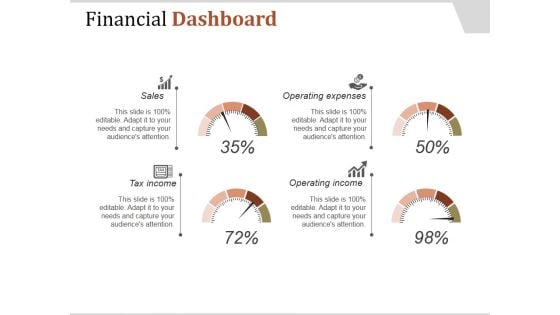
Financial Dashboard Ppt PowerPoint Presentation Influencers
This is a financial dashboard ppt powerpoint presentation influencers. This is a four stage process. The stages in this process are sales, tax income, operating income, operating expenses.
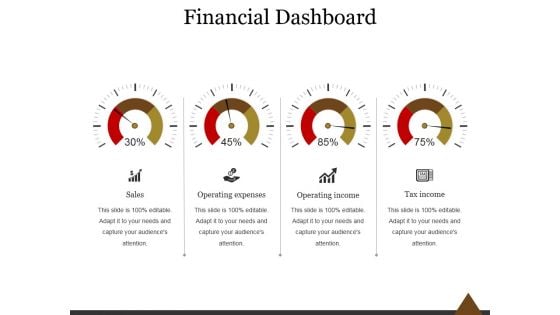
Financial Dashboard Ppt PowerPoint Presentation Information
This is a financial dashboard ppt powerpoint presentation information. This is a four stage process. The stages in this process are sales, operating expenses, operating income, tax income.
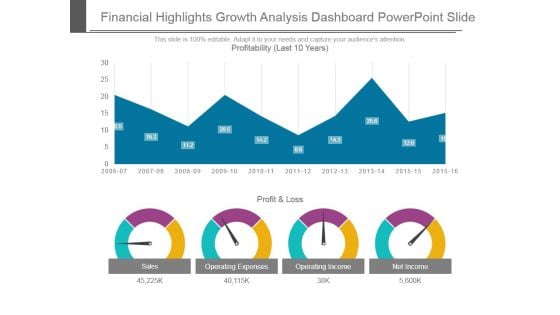
Financial Highlights Growth Analysis Dashboard Powerpoint Slide
This is a financial highlights growth analysis dashboard powerpoint slide. This is a four stage process. The stages in this process are profit and loss, sales, operating expenses, operating income, net income, profitability.
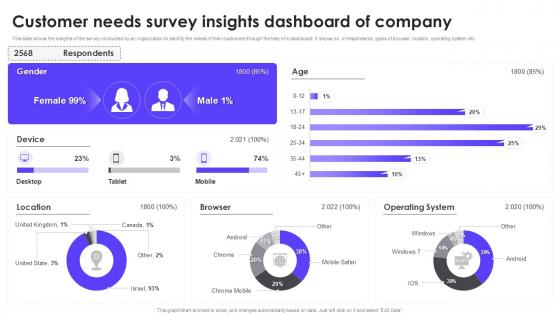
Customer Needs Survey Insights Dashboard Of Company
This Customer Needs Survey Insights Dashboard Of Company is perfect for any presentation, be it in front of clients or colleagues. It is a versatile and stylish solution for organizing your meetings. The Customer Needs Survey Insights Dashboard Of Company features a modern design for your presentation meetings. The adjustable and customizable slides provide unlimited possibilities for acing up your presentation. Slidegeeks has done all the homework before launching the product for you. So, do not wait, grab the presentation templates today This slide showcases insights from survey conducted by the organization to understand customer needs. The dashboard showcases key data, including the number of respondents, browser types, location, operating system, and other valuable factors to guide customer-focused decisions.
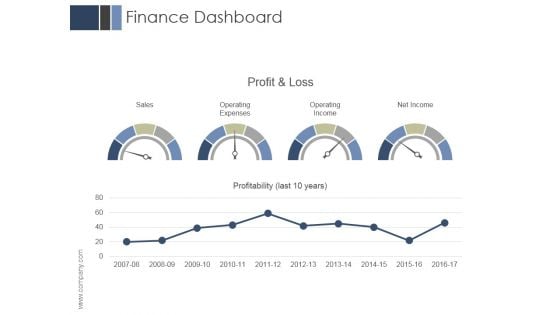
Finance Dashboard Ppt PowerPoint Presentation Design Ideas
This is a finance dashboard ppt powerpoint presentation design ideas. This is a two stage process. The stages in this process are sales, operating expenses, operating income, net income.
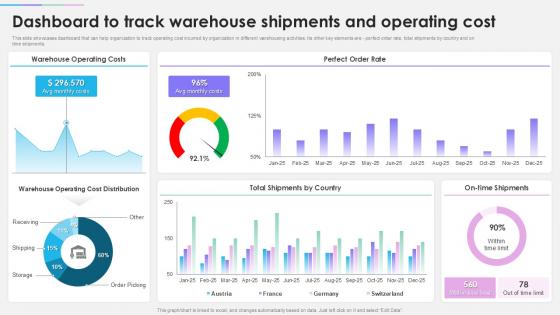
Techniques To Optimize Warehouse Dashboard To Track Warehouse Shipments And Operating Cost
Do you know about Slidesgeeks Techniques To Optimize Warehouse Dashboard To Track Warehouse Shipments And Operating Cost These are perfect for delivering any kind od presentation. Using it, create PowerPoint presentations that communicate your ideas and engage audiences. Save time and effort by using our pre-designed presentation templates that are perfect for a wide range of topic. Our vast selection of designs covers a range of styles, from creative to business, and are all highly customizable and easy to edit. Download as a PowerPoint template or use them as Google Slides themes. This slide depicts a warehouse dashboard that can assist businesses in tracking operating costs incurred by the company. It includes perfect order rate, total shipments by country, and on-time shipments.
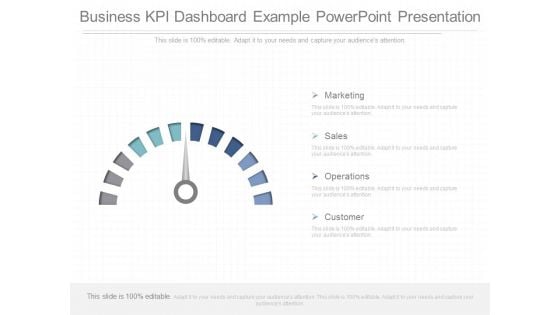
Business Kpi Dashboard Example Powerpoint Presentation
This is a business kpi dashboard example powerpoint presentation. This is a four stage process. The stages in this process are marketing, sales, operations, customer.
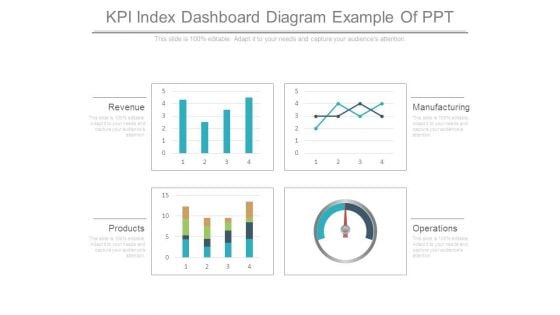
Kpi Index Dashboard Diagram Example Of Ppt
This is a kpi index dashboard diagram example of ppt. This is a four stage process. The stages in this process are revenue, products, operations, manufacturing.

Revenue Kpi Dashboard Ppt Infographic Template
This is a revenue kpi dashboard ppt infographic template. This is a five stage process. The stages in this process are outcasts, successful adverts, earned revenue, sold products, operations.
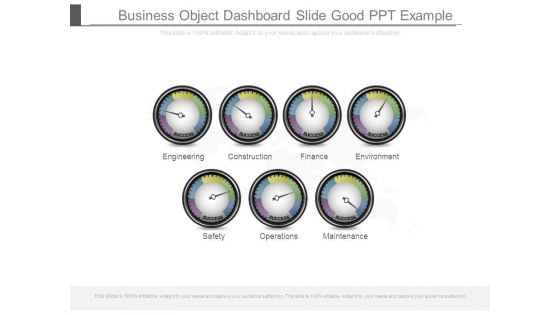
Business Object Dashboard Slide Good Ppt Example
This is a business object dashboard slide good ppt example. This is a seven stage process. The stages in this process are engineering, construction, finance, environment, safety, operations, maintenance.
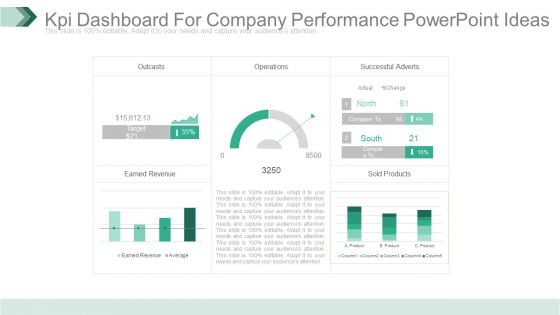
Kpi Dashboard For Company Performance Powerpoint Ideas
This is a kpi dashboard for company performance powerpoint ideas. This is a five stage process. The stages in this process are outcasts, operations, successful adverts, earned revenue, sold products.

Energy Consumption Dashboard With Yearly Savings
Create an editable Energy Consumption Dashboard With Yearly Savings that communicates your idea and engages your audience. Whether you are presenting a business or an educational presentation, pre-designed presentation templates help save time. Energy Consumption Dashboard With Yearly Savings is highly customizable and very easy to edit, covering many different styles from creative to business presentations. Slidegeeks has creative team members who have crafted amazing templates. So, go and get them without any delay. Use our professionally designed PowerPoint presentation Energy Consumption Dashboard With Yearly Savings that serves as engaging and efficient tool for any presentation topic.
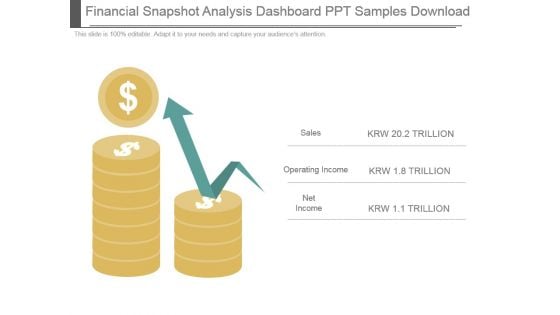
Financial Snapshot Analysis Dashboard Ppt Samples Download
This is a financial snapshot analysis dashboard ppt samples download. This is a two stage process. The stages in this process are sales, operating income, net income.
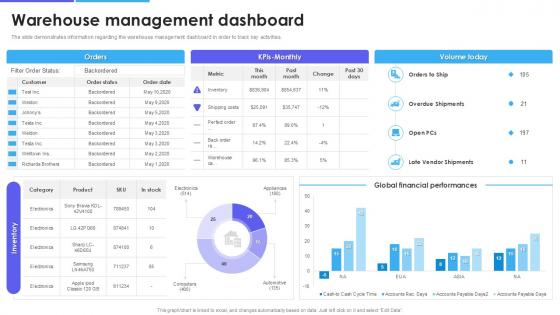
Warehouse Management Inventory Control Warehouse Management Dashboard
Do you have an important presentation coming up Are you looking for something that will make your presentation stand out from the rest Look no further than Warehouse Management Inventory Control Warehouse Management Dashboard. With our professional designs, you can trust that your presentation will pop and make delivering it a smooth process. And with Slidegeeks, you can trust that your presentation will be unique and memorable. So why wait Grab Warehouse Management Inventory Control Warehouse Management Dashboard today and make your presentation stand out from the rest The slide highlights an overview of the warehouse management dashboard, designed to monitor and track critical activities effectively. It includes key operational metrics such as order status, shipping cost, volume, financial performance, overdue shipments etc.
Employee Performance Measures Dashboard Diagram Presentation Ideas
This is a employee performance measures dashboard diagram presentation ideas. This is a one stage process. The stages in this process are business, marketing, dashboard, measuring.
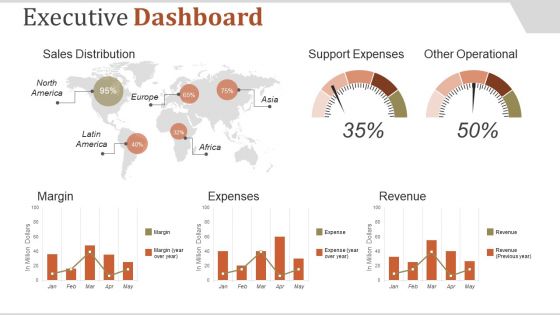
Executive Dashboard Ppt PowerPoint Presentation Introduction
This is a executive dashboard ppt powerpoint presentation introduction. This is a five stage process. The stages in this process are sales distribution, support expenses, other operational, margin, expenses.
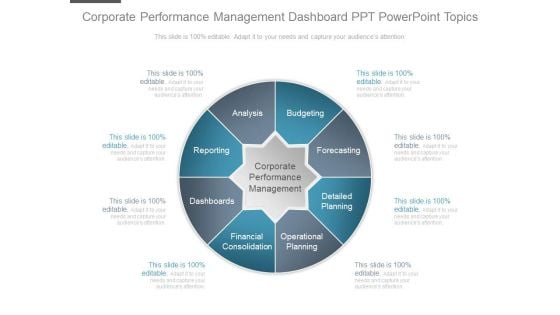
Corporate Performance Management Dashboard Ppt Powerpoint Topics
This is a corporate performance management dashboard ppt powerpoint topics. This is a eight stage process. The stages in this process are analysis, reporting, dashboards, financial consolidation, budgeting, forecasting, detailed planning, operational planning, corporate performance management.
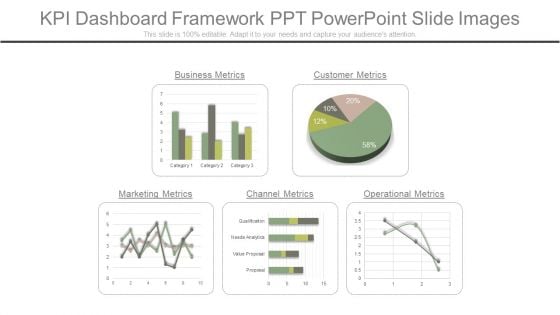
Kpi Dashboard Framework Ppt Powerpoint Slide Images
This is a kpi dashboard framework ppt powerpoint slide images. This is a five stage process. The stages in this process are business metrics, customer metrics, operational metrics, channel metrics, marketing metrics.
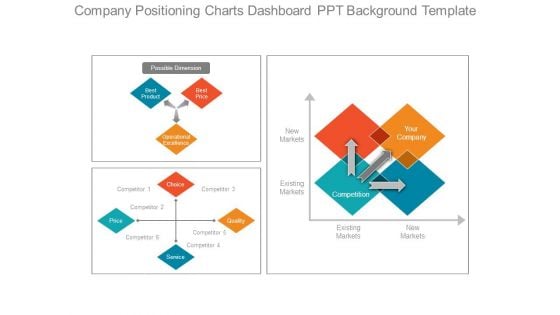
Company Positioning Charts Dashboard Ppt Background Template
This is a company positioning charts dashboard ppt background template. This is a four stage process. The stages in this process are possible dimension, best product, best price, operational excellence, choice, service, quality, competition, your company.
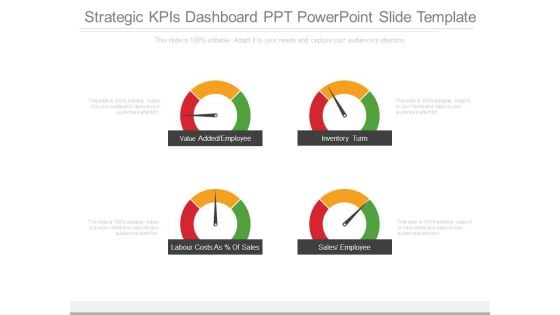
Strategic Kpis Dashboard Ppt Powerpoint Slide Template
This is a strategic kpis dashboard ppt powerpoint slide template. This is a four stage process. The stages in this process are value added employee, inventory turn, labour costs as of sales, sales employee.
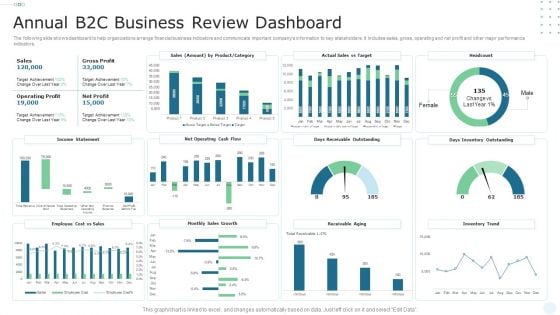
Annual B2C Business Review Dashboard Microsoft PDF
The following slide shows dashboard to help organizations arrange financial business indicators and communicate important companys information to key stakeholders. It includes sales, gross, operating and net profit and other major performance indicators. Showcasing this set of slides titled Annual B2C Business Review Dashboard Microsoft PDF. The topics addressed in these templates are Gross Profit, Sales, Operating Profit. All the content presented in this PPT design is completely editable. Download it and make adjustments in color, background, font etc. as per your unique business setting.
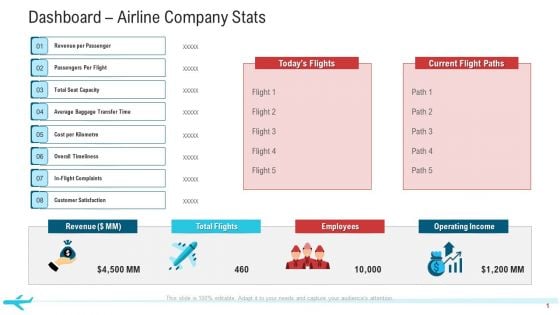
Dashboard Airline Company Stats Structure PDF
Deliver an awe-inspiring pitch with this creative dashboard airline company stats structure pdf. bundle. Topics like revenue, employees, operating income can be discussed with this completely editable template. It is available for immediate download depending on the needs and requirements of the user.
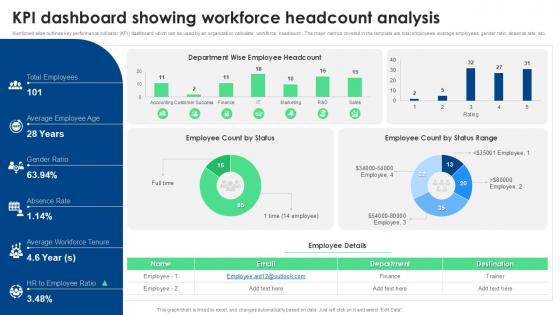
KPI Dashboard Snapshot Showing Workforce Headcount Analysis
From laying roadmaps to briefing everything in detail, our templates are perfect for you. You can set the stage with your presentation slides. All you have to do is download these easy-to-edit and customizable templates. KPI Dashboard Snapshot Showing Workforce Headcount Analysis will help you deliver an outstanding performance that everyone would remember and praise you for. Do download this presentation today. The KPI Dashboard Snapshot Showing Workforce Headcount Analysis is a visually compelling PowerPoint template designed to present key metrics related to workforce composition. It includes dynamic charts and graphs showcasing headcount trends, department breakdowns, gender ratios, and more. This template is perfect for HR teams and executives who need a concise overview of workforce analytics for strategic decision-making and operational efficiency.
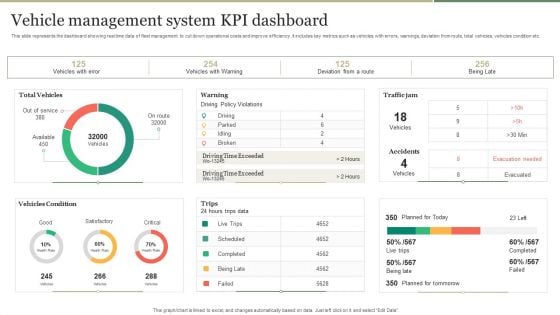
Vehicle Management System KPI Dashboard Introduction PDF
This slide represents the dashboard showing real time data of fleet management to cut down operational costs and improve efficiency. It includes key metrics such as vehicles with errors, warnings, deviation from route, total vehicles, vehicles condition etc. Pitch your topic with ease and precision using this Vehicle Management System KPI Dashboard Introduction PDF. This layout presents information on Vehicle Management System, KPI Dashboard. It is also available for immediate download and adjustment. So, changes can be made in the color, design, graphics or any other component to create a unique layout.
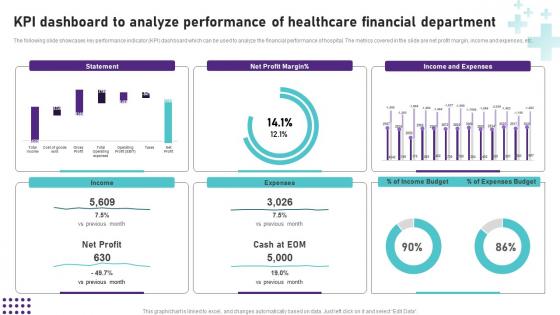
KPI Dashboard To Analyze Performance Of Healthcare Operational Areas Healthcare Clipart PDF
Are you searching for a KPI Dashboard To Analyze Performance Of Healthcare Operational Areas Healthcare Clipart PDF that is uncluttered, straightforward, and original Its easy to edit, and you can change the colors to suit your personal or business branding. For a presentation that expresses how much effort you have put in, this template is ideal With all of its features, including tables, diagrams, statistics, and lists, its perfect for a business plan presentation. Make your ideas more appealing with these professional slides. Download Kpi Dashboard To Analyze Performance Of Healthcare Operational Areas Healthcare Clipart PDF from Slidegeeks today. The following slide showcases key performance indicator KPI dashboard which can be used to analyze the financial performance of hospital. The metrics covered in the slide are net profit margin, income and expenses, etc.
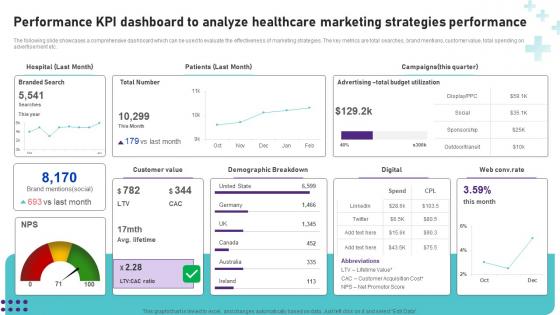
Performance KPI Dashboard To Analyze Healthcare Operational Areas Healthcare Rules PDF
Do you know about Slidesgeeks Performance KPI Dashboard To Analyze Healthcare Operational Areas Healthcare Rules PDF These are perfect for delivering any kind od presentation. Using it, create PowerPoint presentations that communicate your ideas and engage audiences. Save time and effort by using our pre-designed presentation templates that are perfect for a wide range of topic. Our vast selection of designs covers a range of styles, from creative to business, and are all highly customizable and easy to edit. Download as a PowerPoint template or use them as Google Slides themes. The following slide showcases a comprehensive dashboard which can be used to evaluate the effectiveness of marketing strategies. The key metrics are total searches, brand mentions, customer value, total spending on advertisement etc.
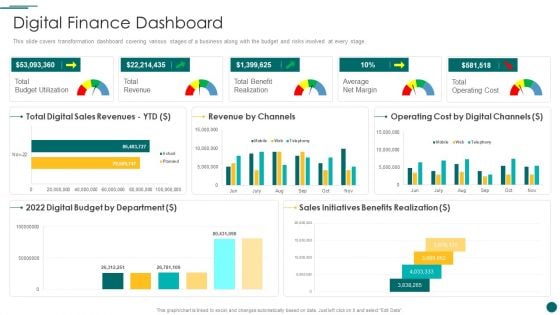
Organization Reinvention Digital Finance Dashboard Clipart PDF
This slide covers the advanced technologies entering the market from past few decades. The combinatorial effects of base technologies, such as mobile, cloud, sensors, analytics and the Internet of Things IoT, are accelerating progress exponentially. This slide covers transformation dashboard covering various stages of a business along with the budget and risks involved at every stage. Deliver and pitch your topic in the best possible manner with this Organization Reinvention Digital Finance Dashboard Clipart PDF. Use them to share invaluable insights on Revenue By Channels, Operating Cost, Digital Budget and impress your audience. This template can be altered and modified as per your expectations. So, grab it now.
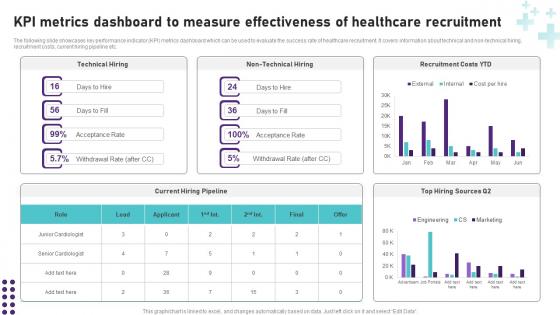
KPI Metrics Dashboard To Measure Healthcare Operational Areas Healthcare Brochure PDF
Retrieve professionally designed KPI Metrics Dashboard To Measure Healthcare Operational Areas Healthcare Brochure PDF to effectively convey your message and captivate your listeners. Save time by selecting pre-made slideshows that are appropriate for various topics, from business to educational purposes. These themes come in many different styles, from creative to corporate, and all of them are easily adjustable and can be edited quickly. Access them as PowerPoint templates or as Google Slides themes. You do not have to go on a hunt for the perfect presentation because Slidegeeks got you covered from everywhere. The following slide showcases key performance indicator KPI metrics dashboard which can be used to evaluate the success rate of healthcare recruitment. It covers information about technical and non-technical hiring, recruitment costs, current hiring pipeline etc.
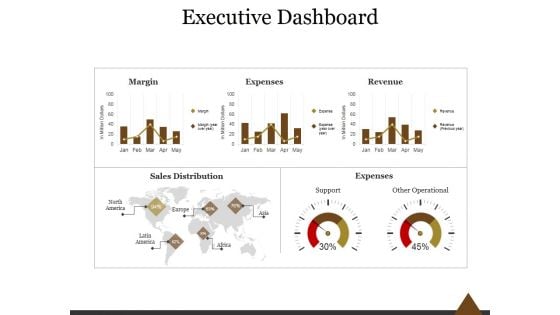
Executive Dashboard Ppt PowerPoint Presentation Professional
This is a executive dashboard ppt powerpoint presentation professional. This is a five stage process. The stages in this process are margin, expenses, revenue, sales distribution, expenses, support, other operational.
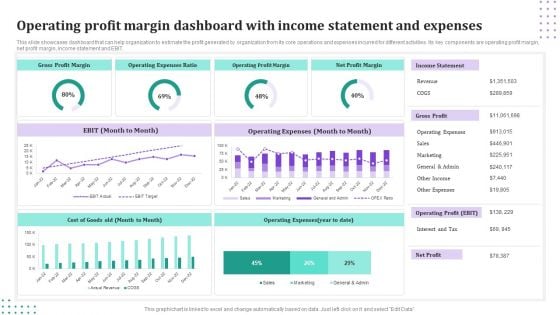
Operating Profit Margin Dashboard With Income Statement And Expenses Brochure PDF
This slide showcases dashboard that can help organization to estimate the profit generated by organization from its core operations and expenses incurred for different activities. Its key components are operating profit margin, net profit margin, income statement and EBIT. Showcasing this set of slides titled Operating Profit Margin Dashboard With Income Statement And Expenses Brochure PDF. The topics addressed in these templates are Operating Expenses, Income Statement, Gross Profit. All the content presented in this PPT design is completely editable. Download it and make adjustments in color, background, font etc. as per your unique business setting.
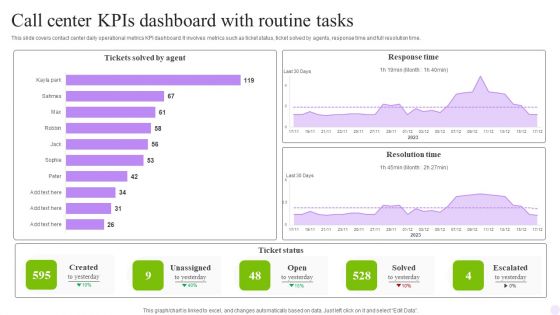
Call Center Kpis Dashboard With Routine Tasks Structure PDF
This slide covers contact center daily operational metrics KPI dashboard. It involves metrics such as ticket status, ticket solved by agents, response time and full resolution time. Pitch your topic with ease and precision using this Call Center Kpis Dashboard With Routine Tasks Structure PDF. This layout presents information on Agent, Response Time, Routine Tasks. It is also available for immediate download and adjustment. So, changes can be made in the color, design, graphics or any other component to create a unique layout.
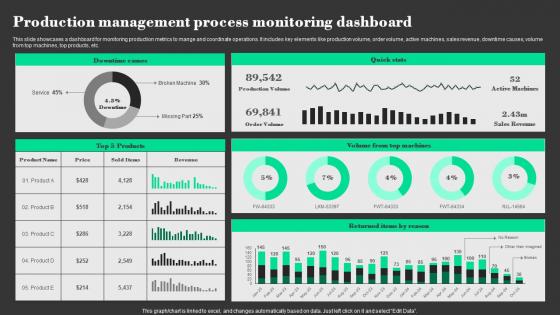
Production Management Process Monitoring Dashboard Designs Pdf
This slide showcases a dashboard for monitoring production metrics to mange and coordinate operations. It includes key elements like production volume, order volume, active machines, sales revenue, downtime causes, volume from top machines, top products, etc. Showcasing this set of slides titled Production Management Process Monitoring Dashboard Designs Pdf The topics addressed in these templates are Downtime Causes, Products, Volume From Top Machines All the content presented in this PPT design is completely editable. Download it and make adjustments in color, background, font etc. as per your unique business setting. This slide showcases a dashboard for monitoring production metrics to mange and coordinate operations. It includes key elements like production volume, order volume, active machines, sales revenue, downtime causes, volume from top machines, top products, etc.

Continuous Development Evaluation Plan Eliminate Cyber Attacks Security Monitoring Dashboard Operating Designs PDF
Deliver an awe inspiring pitch with this creative continuous development evaluation plan eliminate cyber attacks security monitoring dashboard operating designs pdf bundle. Topics like security monitoring dashboard with application control and operating system statistics can be discussed with this completely editable template. It is available for immediate download depending on the needs and requirements of the user.
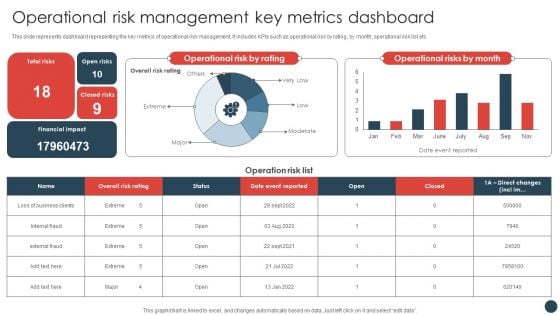
Strategic Risk Management Plan Operational Risk Management Key Metrics Dashboard Structure PDF
This slide represents dashboard representing the key metrics of operational risk management. It includes KPIs such as operational risk by rating, by month, operational risk list etc.Create an editable Strategic Risk Management Plan Operational Risk Management Key Metrics Dashboard Structure PDF that communicates your idea and engages your audience. Whether you are presenting a business or an educational presentation, pre-designed presentation templates help save time. Strategic Risk Management Plan Operational Risk Management Key Metrics Dashboard Structure PDF is highly customizable and very easy to edit, covering many different styles from creative to business presentations. Slidegeeks has creative team members who have crafted amazing templates. So, go and get them without any delay.
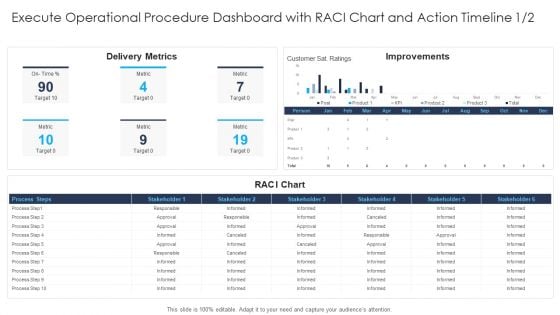
Execute Operational Procedure Dashboard With Raci Chart And Action Timeline Metric Designs PDF
Deliver and pitch your topic in the best possible manner with this execute operational procedure dashboard with raci chart and action timeline metric designs pdf. Use them to share invaluable insights on execute operational procedure dashboard with raci chart and action timeline and impress your audience. This template can be altered and modified as per your expectations. So, grab it now.
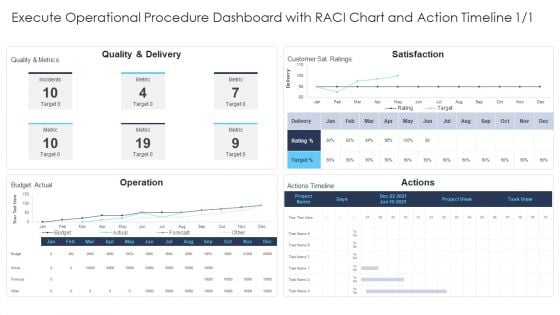
Execute Operational Procedure Dashboard With Raci Chart And Action Timeline Quality Structure PDF
Deliver an awe inspiring pitch with this creative execute operational procedure dashboard with raci chart and action timeline quality structure pdf bundle. Topics like execute operational procedure dashboard with raci chart and action timeline 1 or 2 can be discussed with this completely editable template. It is available for immediate download depending on the needs and requirements of the user.


 Continue with Email

 Home
Home


