It Project Discovery Phase
Icons Slide For Predictive Analytics Methods Themes PDF
Presenting our innovatively structured Icons Slide For Predictive Analytics Methods Themes PDF set of slides. The slides contain a hundred percent editable icons. You can replace these icons without any inconvenience. Therefore, pick this set of slides and create a striking presentation.
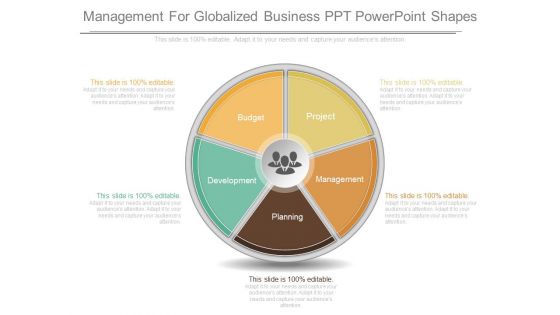
Management For Globalized Business Ppt Powerpoint Shapes
This is a management for globalized business ppt powerpoint shapes. This is a five stage process. The stages in this process are project, management, planning, development, budget.
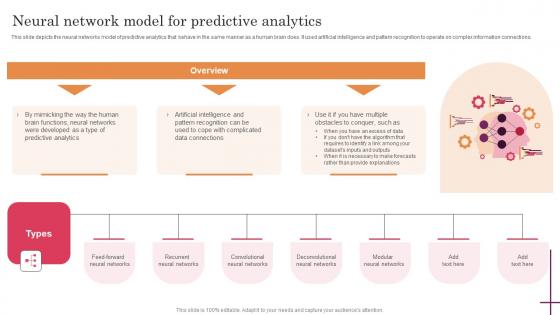
Neural Network Model For Predictive Analytics Predictive Analytics For Improved Clipart Pdf
This slide depicts the neural networks model of predictive analytics that behave in the same manner as a human brain does. It used artificial intelligence and pattern recognition to operate on complex information connections. Whether you have daily or monthly meetings, a brilliant presentation is necessary. Neural Network Model For Predictive Analytics Predictive Analytics For Improved Clipart Pdf can be your best option for delivering a presentation. Represent everything in detail using Neural Network Model For Predictive Analytics Predictive Analytics For Improved Clipart Pdf and make yourself stand out in meetings. The template is versatile and follows a structure that will cater to your requirements. All the templates prepared by Slidegeeks are easy to download and edit. Our research experts have taken care of the corporate themes as well. So, give it a try and see the results. This slide depicts the neural networks model of predictive analytics that behave in the same manner as a human brain does. It used artificial intelligence and pattern recognition to operate on complex information connections.
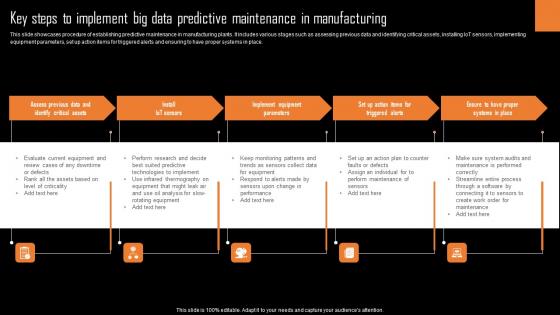
Key Steps To Implement Big Data Predictive Maintenance In Manufacturing Diagrams Pdf
This slide showcases procedure of establishing predictive maintenance in manufacturing plants. It includes various stages such as assessing previous data and identifying critical assets, installing IoT sensors, implementing equipment parameters, set up action items for triggered alerts and ensuring to have proper systems in place.Pitch your topic with ease and precision using this Key Steps To Implement Big Data Predictive Maintenance In Manufacturing Diagrams Pdf This layout presents information on Implement Equipment Parameters, Ensure Proper, Systems Place It is also available for immediate download and adjustment. So, changes can be made in the color, design, graphics or any other component to create a unique layout. This slide showcases procedure of establishing predictive maintenance in manufacturing plants. It includes various stages such as assessing previous data and identifying critical assets, installing IoT sensors, implementing equipment parameters, set up action items for triggered alerts and ensuring to have proper systems in place.
Departmental Tracking Goals Progress Dashboard Diagrams PDF
This slide depicts a progress chart for maintaining transparency and alignment in tracking cross-functional goals. It also includes organizational objective details such as total on track objectives, recently updated, overall progress, etc. Showcasing this set of slides titled Departmental Tracking Goals Progress Dashboard Diagrams PDF. The topics addressed in these templates are Departmental Tracking Goals, Progress Dashboard . All the content presented in this PPT design is completely editable. Download it and make adjustments in color, background, font etc. as per your unique business setting.
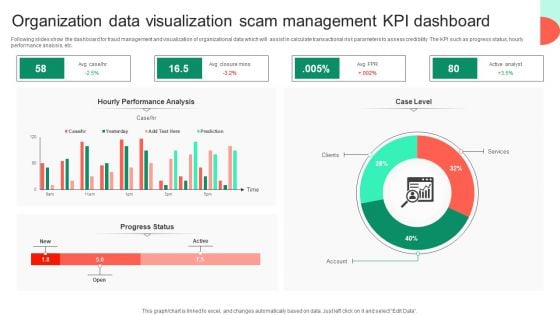
Organization Data Visualization Scam Management KPI Dashboard Rules PDF
Following slides show the dashboard for fraud management and visualization of organizational data which will assist in calculate transactional risk parameters to assess credibility. The KPI such as progress status, hourly performance analysis, etc. Showcasing this set of slides titled Organization Data Visualization Scam Management KPI Dashboard Rules PDF. The topics addressed in these templates are Hourly Performance Analysis, Services, Organization Data Visualization. All the content presented in this PPT design is completely editable. Download it and make adjustments in color, background, font etc. as per your unique business setting.
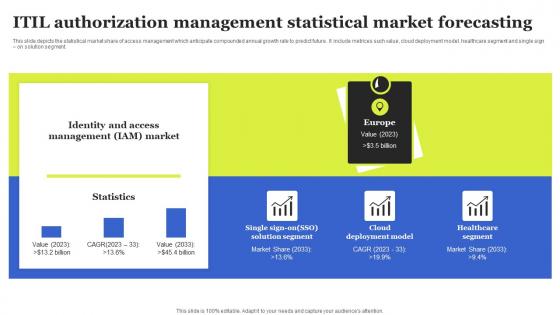
ITIL Authorization Management Statistical Market Forecasting Diagrams Pdf
This slide depicts the statistical market share of access management which anticipate compounded annual growth rate to predict future. It include metrices such value, cloud deployment model, healthcare segment and single sign on solution segment. Pitch your topic with ease and precision using this ITIL Authorization Management Statistical Market Forecasting Diagrams Pdf This layout presents information on Statistics, Cloud Deployment Model, Healthcare Segment It is also available for immediate download and adjustment. So, changes can be made in the color, design, graphics or any other component to create a unique layout. This slide depicts the statistical market share of access management which anticipate compounded annual growth rate to predict future. It include metrices such value, cloud deployment model, healthcare segment and single sign on solution segment.
HR Department Staffing Forecast Icon Mockup Pdf
Pitch your topic with ease and precision using this HR Department Staffing Forecast Icon Mockup Pdf. This layout presents information on HR Department, Staffing Forecast Icon. It is also available for immediate download and adjustment. So, changes can be made in the color, design, graphics or any other component to create a unique layout. Our HR Department Staffing Forecast Icon Mockup Pdf are topically designed to provide an attractive backdrop to any subject. Use them to look like a presentation pro.
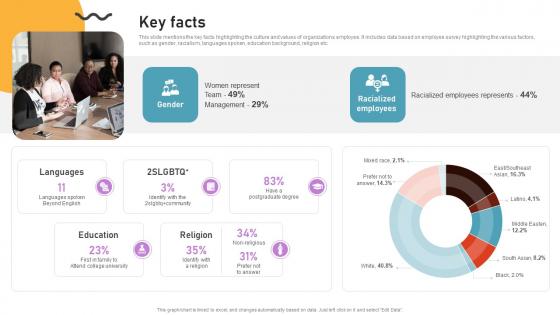
Key Facts Cloud Based Predictive Analytics Software Pitch Deck
This slide mentions the key facts highlighting the culture and values of organizations employee. It includes data based on employee survey highlighting the various factors, such as gender, racialism, languages spoken, education background, religion etc. Find highly impressive Key Facts Cloud Based Predictive Analytics Software Pitch Deck on Slidegeeks to deliver a meaningful presentation. You can save an ample amount of time using these presentation templates. No need to worry to prepare everything from scratch because Slidegeeks experts have already done a huge research and work for you. You need to download Key Facts Cloud Based Predictive Analytics Software Pitch Deck for your upcoming presentation. All the presentation templates are 100 percent editable and you can change the color and personalize the content accordingly. Download now This slide mentions the key facts highlighting the culture and values of organizations employee. It includes data based on employee survey highlighting the various factors, such as gender, racialism, languages spoken, education background, religion etc.
Financial Analysis Calculator With Dollar Symbol Vector Icon Ppt PowerPoint Presentation File Example Topics PDF
Presenting this set of slides with name financial analysis calculator with dollar symbol vector icon ppt powerpoint presentation file example topics pdf. This is a three stage process. The stages in this process are financial analysis calculator with dollar symbol vector icon. This is a completely editable PowerPoint presentation and is available for immediate download. Download now and impress your audience.
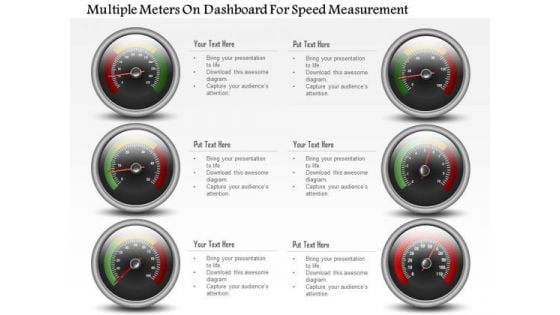
Business Diagram Multiple Meters On Dashboard For Speed Measurement PowerPoint Slide
This business diagram has been designed with multiple meters on dashboard. This slide can be used for business planning and progress. Use this diagram for your business and success milestones related presentations.
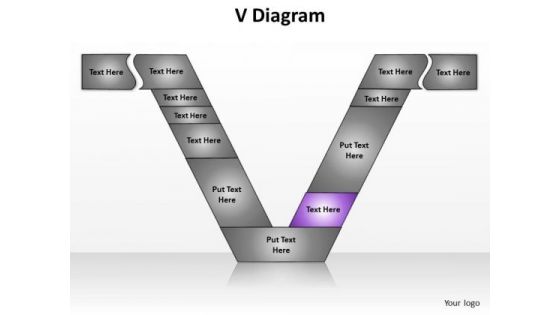
PowerPoint Designs Chart V Diagram Ppt Theme
PowerPoint Designs Chart V Diagram PPT Theme--Acceptance, Architecture,Chart,Cycle,Deployment, Design, Detail, Detailed, Development, Diagram, Engineering, Function, functional, Implement, Implementation, Management, model, Process, Project,Quality, Requirements, Software, Specification, steps, System, Test, Achieve any feat you desire to. Our PowerPoint Designs Chart V Diagram Ppt Theme are extremely facilitating.
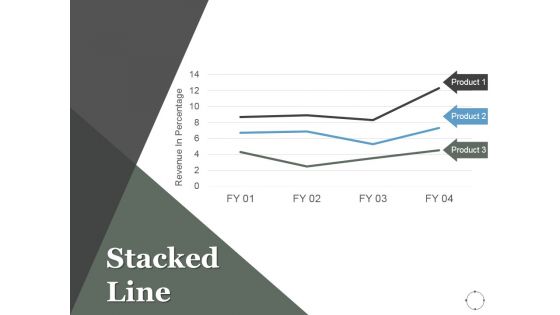
Stacked Line Ppt PowerPoint Presentation Outline
This is a stacked line ppt powerpoint presentation outline. This is a three stage process. The stages in this process are projects, marketing, stacked line, finance, product.

Predictive Maintained Dashboard To Determine Engine Details Optimizing Inventory Management IoT SS V
This slide provides an overview of the predictive maintenance dashboard used to track engine status. The dashboard includes normal, warning and critical engines, optimal condition, etc. Explore a selection of the finest Predictive Maintained Dashboard To Determine Engine Details Optimizing Inventory Management IoT SS V here. With a plethora of professionally designed and pre-made slide templates, you can quickly and easily find the right one for your upcoming presentation. You can use our Predictive Maintained Dashboard To Determine Engine Details Optimizing Inventory Management IoT SS V to effectively convey your message to a wider audience. Slidegeeks has done a lot of research before preparing these presentation templates. The content can be personalized and the slides are highly editable. Grab templates today from Slidegeeks. This slide provides an overview of the predictive maintenance dashboard used to track engine status. The dashboard includes normal, warning and critical engines, optimal condition, etc.
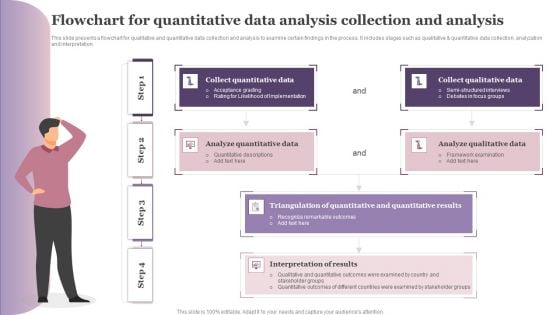
Flowchart For Quantitative Data Analysis Collection And Analysis Professional PDF
This slide presents a flowchart for qualitative and quantitative data collection and analysis to examine certain findings in the process. It includes stages such as qualitative and quantitative data collection, analyzation and interpretation. Presenting Flowchart For Quantitative Data Analysis Collection And Analysis Professional PDF to dispense important information. This template comprises one stages. It also presents valuable insights into the topics including Interpretation Results, Analyze Qualitative Data, Collect Qualitative Data. This is a completely customizable PowerPoint theme that can be put to use immediately. So, download it and address the topic impactfully.
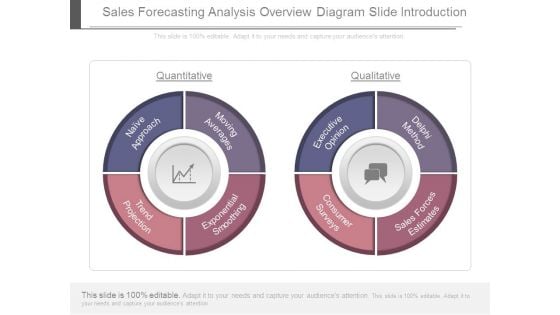
Sales Forecasting Analysis Overview Diagram Slide Introduction
This is a sales forecasting analysis overview diagram slide introduction. This is a two stage process. The stages in this process are quantitative, naive approach, moving averages, trend projection, exponential smoothing, executive opinion, delphi method, consumer surveys, sales forces estimates.
Data Interpretation Percentage Analysis Ppt Powerpoint Presentation Summary Icon
This is a data interpretation percentage analysis ppt powerpoint presentation summary icon. This is a six stage process. The stages in this process are data presentation, content presentation, information presentation.
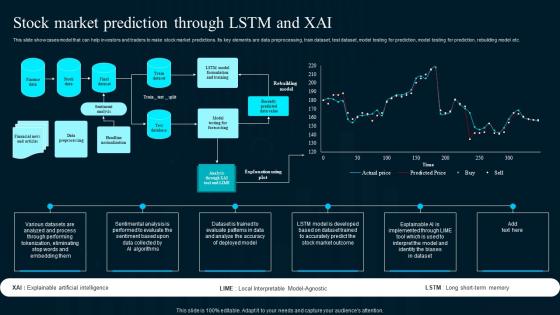
Stock Market Prediction Through LSTM And XAI Artificial Intelligence Applications Summary Pdf
This slide showcases model that can help investors and traders to make stock market predictions. Its key elements are data preprocessing, train dataset, test dataset, model testing for prediction, model testing for prediction, rebuilding model etc.Find highly impressive Stock Market Prediction Through LSTM And XAI Artificial Intelligence Applications Summary Pdf on Slidegeeks to deliver a meaningful presentation. You can save an ample amount of time using these presentation templates. No need to worry to prepare everything from scratch because Slidegeeks experts have already done a huge research and work for you. You need to download Stock Market Prediction Through LSTM And XAI Artificial Intelligence Applications Summary Pdf for your upcoming presentation. All the presentation templates are 100Precent editable and you can change the color and personalize the content accordingly. Download now. This slide showcases model that can help investors and traders to make stock market predictions. Its key elements are data preprocessing, train dataset, test dataset, model testing for prediction, model testing for prediction, rebuilding model etc.
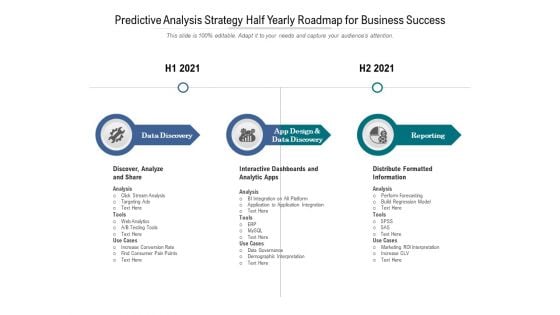
Predictive Analysis Strategy Half Yearly Roadmap For Business Success Microsoft
Presenting our innovatively-structured predictive analysis strategy half yearly roadmap for business success microsoft Template. Showcase your roadmap process in different formats like PDF, PNG, and JPG by clicking the download button below. This PPT design is available in both Standard Screen and Widescreen aspect ratios. It can also be easily personalized and presented with modified font size, font type, color, and shapes to measure your progress in a clear way.
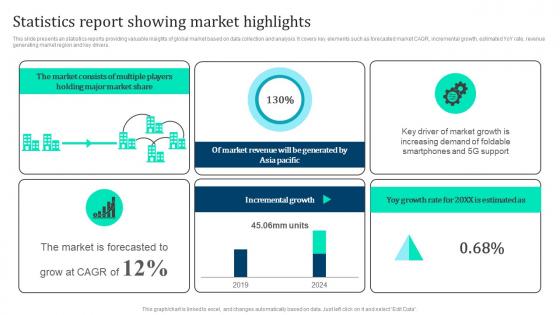
Statistics Report Showing Marketing Intelligence Guide Data Gathering Slides Pdf
This slide presents an statistics reports providing valuable insights of global market based on data collection and analysis. It covers key elements such as forecasted market CAGR, incremental growth, estimated YoY rate, revenue generating market region and key drivers. Get a simple yet stunning designed Statistics Report Showing Marketing Intelligence Guide Data Gathering Slides Pdf. It is the best one to establish the tone in your meetings. It is an excellent way to make your presentations highly effective. So, download this PPT today from Slidegeeks and see the positive impacts. Our easy to edit Statistics Report Showing Marketing Intelligence Guide Data Gathering Slides Pdf can be your go to option for all upcoming conferences and meetings. So, what are you waiting for Grab this template today. This slide presents an statistics reports providing valuable insights of global market based on data collection and analysis. It covers key elements such as forecasted market CAGR, incremental growth, estimated YoY rate, revenue generating market region and key drivers.
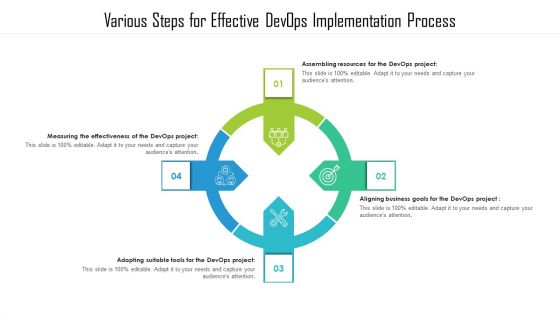
Various Steps For Effective Devops Implementation Process Information PDF
Presenting various steps for effective devops implementation process information pdf. to dispense important information. This template comprises four stages. It also presents valuable insights into the topics including measuring the effectiveness of the devops project, assembling resources for the devops project, aligning business goals for the devops project. This is a completely customizable PowerPoint theme that can be put to use immediately. So, download it and address the topic impactfully.

Software Program Execution Strategy Flow Portrait PDF
This slide illustrates process flow of usual software program implementation. It includes pre-project, planning, designing, implementation action, validation etc.Presenting Software Program Execution Strategy Flow Portrait PDF to dispense important information. This template comprises six stages. It also presents valuable insights into the topics including Schedule The Project, Configure The Project, Implementation This is a completely customizable PowerPoint theme that can be put to use immediately. So, download it and address the topic impactfully.
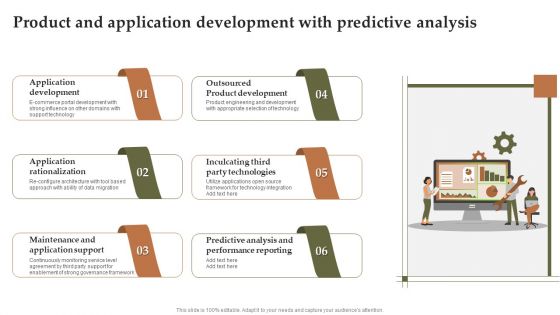
Product And Application Development With Predictive Analysis Themes PDF
Persuade your audience using this Product And Application Development With Predictive Analysis Themes PDF. This PPT design covers six stages, thus making it a great tool to use. It also caters to a variety of topics including Application Rationalization, Application Support, Performance Reporting. Download this PPT design now to present a convincing pitch that not only emphasizes the topic but also showcases your presentation skills.
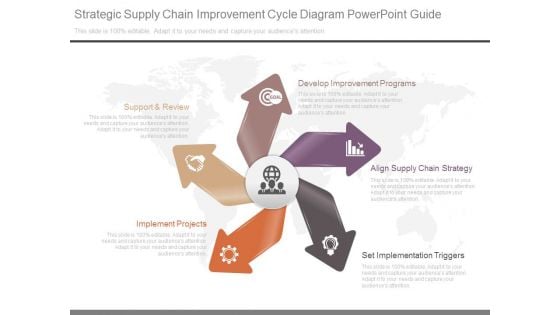
Strategic Supply Chain Improvement Cycle Diagram Powerpoint Guide
This is a strategic supply chain improvement cycle diagram powerpoint guide. This is a five stage process. The stages in this process are support and review, implement projects, develop improvement programs, align supply chain strategy, set implementation triggers.
Predictive Analytics For Empowering Predictive Analytics Model Performance Tracking Brochure Pdf
This slide represents the predictive analytics model performance tracking dashboard, and it covers the details of total visitors, total buyers, total products added to the cart, filters by date and category, visitors to clients conversion rate, and so on. Retrieve professionally designed Predictive Analytics For Empowering Predictive Analytics Model Performance Tracking Brochure Pdf to effectively convey your message and captivate your listeners. Save time by selecting pre-made slideshows that are appropriate for various topics, from business to educational purposes. These themes come in many different styles, from creative to corporate, and all of them are easily adjustable and can be edited quickly. Access them as PowerPoint templates or as Google Slides themes. You do not have to go on a hunt for the perfect presentation because Slidegeeks got you covered from everywhere. This slide represents the predictive analytics model performance tracking dashboard, and it covers the details of total visitors, total buyers, total products added to the cart, filters by date and category, visitors to clients conversion rate, and so on.
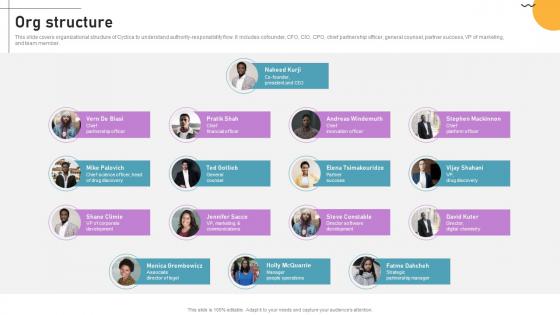
Org Structure Cloud Based Predictive Analytics Software Pitch Deck
This slide covers organizational structure of Cyclica to understand authority-responsibility flow. It includes cofounder, CFO, CIO, CPO, chief partnership officer, general counsel, partner success, VP of marketing, and team member. Are you in need of a template that can accommodate all of your creative concepts This one is crafted professionally and can be altered to fit any style. Use it with Google Slides or PowerPoint. Include striking photographs, symbols, depictions, and other visuals. Fill, move around, or remove text boxes as desired. Test out color palettes and font mixtures. Edit and save your work, or work with colleagues. Download Org Structure Cloud Based Predictive Analytics Software Pitch Deck and observe how to make your presentation outstanding. Give an impeccable presentation to your group and make your presentation unforgettable. This slide covers organizational structure of Cyclica to understand authority-responsibility flow. It includes cofounder, CFO, CIO, CPO, chief partnership officer, general counsel, partner success, VP of marketing, and team member.
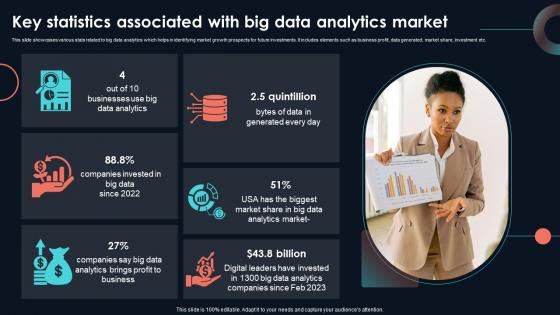
Key Statistics Associated With Big Data Developing Strategic Insights Using Big Data Analytics SS V
This slide showcases various stats related to big data analytics which helps in identifying market growth prospects for future investments. It includes elements such as business profit, data generated, market share, investment etc. If you are looking for a format to display your unique thoughts, then the professionally designed Key Statistics Associated With Big Data Developing Strategic Insights Using Big Data Analytics SS V is the one for you. You can use it as a Google Slides template or a PowerPoint template. Incorporate impressive visuals, symbols, images, and other charts. Modify or reorganize the text boxes as you desire. Experiment with shade schemes and font pairings. Alter, share or cooperate with other people on your work. Download Key Statistics Associated With Big Data Developing Strategic Insights Using Big Data Analytics SS V and find out how to give a successful presentation. Present a perfect display to your team and make your presentation unforgettable. This slide showcases various stats related to big data analytics which helps in identifying market growth prospects for future investments. It includes elements such as business profit, data generated, market share, investment etc.
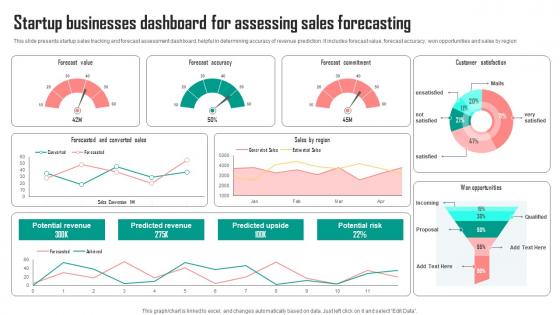
Startup Businesses Dashboard For Assessing Sales Forecasting Background Pdf
This slide presents startup sales tracking and forecast assessment dashboard, helpful in determining accuracy of revenue prediction. It includes forecast value, forecast accuracy, won opportunities and sales by region Pitch your topic with ease and precision using this Startup Businesses Dashboard For Assessing Sales Forecasting Background Pdf. This layout presents information on Forecast Value, Accuracy, Commitment. It is also available for immediate download and adjustment. So, changes can be made in the color, design, graphics or any other component to create a unique layout. This slide presents startup sales tracking and forecast assessment dashboard, helpful in determining accuracy of revenue prediction. It includes forecast value, forecast accuracy, won opportunities and sales by region

Performance Chart Business PowerPoint Templates And PowerPoint Backgrounds 0311
Microsoft PowerPoint Template and Background with business picture about analysis graph arrow and target Illustrate the essential elements of the project. Delve into the basic nature with our Performance Chart Business PowerPoint Templates And PowerPoint Backgrounds 0311.
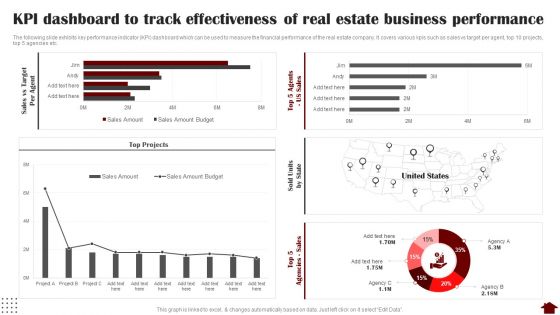
KPI Dashboard To Track Effectiveness Of Real Estate Business Performance Slides PDF
The following slide exhibits key performance indicator KPI dashboard which can be used to measure the financial performance of the real estate company. It covers various kpis such as sales vs target per agent, top 10 projects, top 5 agencies etc. Deliver an awe inspiring pitch with this creative KPI Dashboard To Track Effectiveness Of Real Estate Business Performance Slides PDF bundle. Topics like KPI Dashboard, Track Effectiveness, Real Estate Business Performance can be discussed with this completely editable template. It is available for immediate download depending on the needs and requirements of the user.
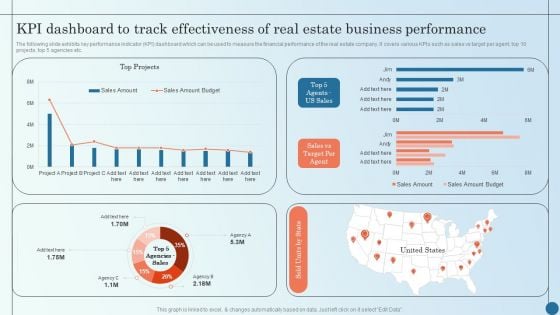
KPI Dashboard To Track Effectiveness Of Real Estate Business Managing Commercial Property Risks Demonstration PDF
The following slide exhibits key performance indicator KPI dashboard which can be used to measure the financial performance of the real estate company. It covers various KPIs such as sales vs target per agent, top 10 projects, top 5 agencies etc.Deliver an awe inspiring pitch with this creative KPI Dashboard To Track Effectiveness Of Real Estate Business Managing Commercial Property Risks Demonstration PDF bundle. Topics like Kpi Dashboard, Track Effectiveness, Estate Business can be discussed with this completely editable template. It is available for immediate download depending on the needs and requirements of the user.
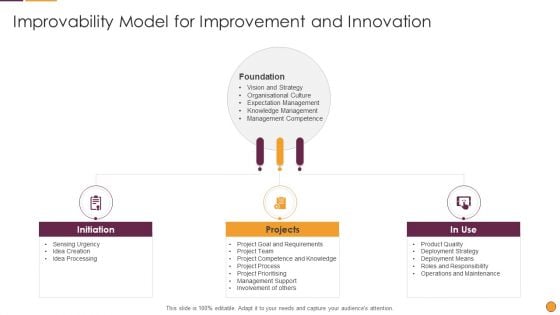
Process Enhancement Program Success Improvability Model For Improvement And Innovation Clipart PDF
This is a Process Enhancement Program Success Improvability Model For Improvement And Innovation Clipart PDF template with various stages. Focus and dispense information on three stages using this creative set, that comes with editable features. It contains large content boxes to add your information on topics like Initiation Projects, Idea Creation, Idea Processing. You can also showcase facts, figures, and other relevant content using this PPT layout. Grab it now.
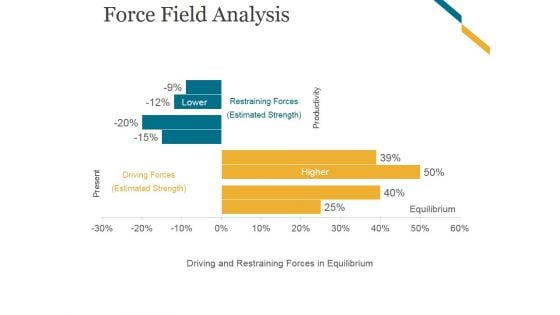
Force Field Analysis Template 2 Ppt PowerPoint Presentation Themes
This is a force field analysis template 2 ppt powerpoint presentation themes. This is a two stage process. The stages in this process are restraining forces, driving forces, estimated strength, equilibrium.
Icons Slide For Effective Data Migration Using Cloud Service Offerings
Slidegeeks is here to make your presentations a breeze with Icons Slide For Effective Data Migration Using Cloud Service Offerings With our easy-to-use and customizable templates, you can focus on delivering your ideas rather than worrying about formatting. With a variety of designs to choose from, you are sure to find one that suits your needs. And with animations and unique photos, illustrations, and fonts, you can make your presentation pop. So whether you are giving a sales pitch or presenting to the board, make sure to check out Slidegeeks first Our Icons Slide For Effective Data Migration Using Cloud Service Offerings are topically designed to provide an attractive backdrop to any subject. Use them to look like a presentation pro.
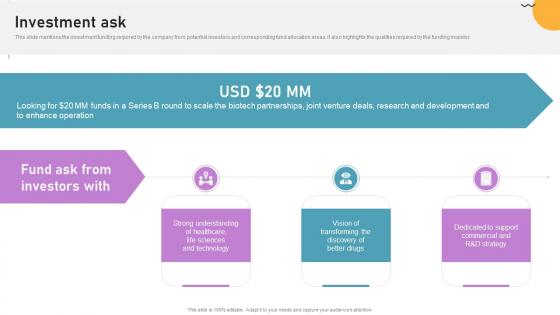
Investment Ask Cloud Based Predictive Analytics Software Pitch Deck
This slide mentions the investment funding required by the company from potential investors and corresponding fund allocation areas. It also highlights the qualities required by the funding investor. Whether you have daily or monthly meetings, a brilliant presentation is necessary. Investment Ask Cloud Based Predictive Analytics Software Pitch Deck can be your best option for delivering a presentation. Represent everything in detail using Investment Ask Cloud Based Predictive Analytics Software Pitch Deck and make yourself stand out in meetings. The template is versatile and follows a structure that will cater to your requirements. All the templates prepared by Slidegeeks are easy to download and edit. Our research experts have taken care of the corporate themes as well. So, give it a try and see the results. This slide mentions the investment funding required by the company from potential investors and corresponding fund allocation areas. It also highlights the qualities required by the funding investor.
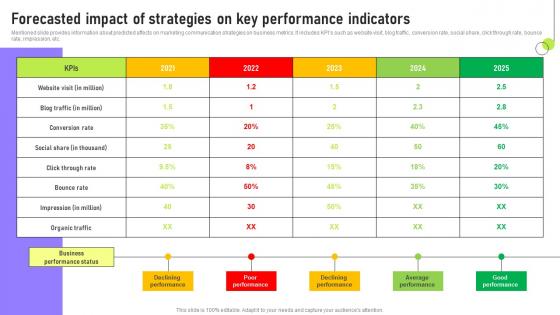
Forecasted Impact Of Strategies On Deployment Of Marketing Communication Portrait Pdf
Mentioned slide provides information about predicted affects on marketing communication strategies on business metrics. It includes KPIs such as website visit, blog traffic, conversion rate, social share, click through rate, bounce rate, impression, etc. Whether you have daily or monthly meetings, a brilliant presentation is necessary. Forecasted Impact Of Strategies On Deployment Of Marketing Communication Portrait Pdf can be your best option for delivering a presentation. Represent everything in detail using Forecasted Impact Of Strategies On Deployment Of Marketing Communication Portrait Pdf and make yourself stand out in meetings. The template is versatile and follows a structure that will cater to your requirements. All the templates prepared by Slidegeeks are easy to download and edit. Our research experts have taken care of the corporate themes as well. So, give it a try and see the results. Mentioned slide provides information about predicted affects on marketing communication strategies on business metrics. It includes KPIs such as website visit, blog traffic, conversion rate, social share, click through rate, bounce rate, impression, etc.
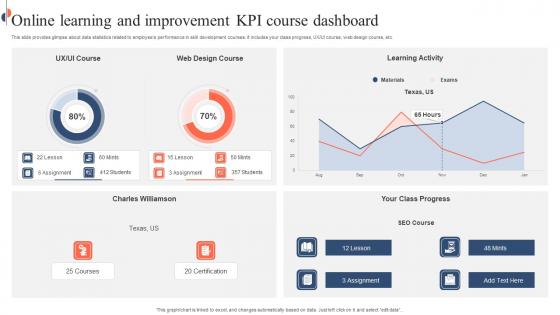
Online Learning And Improvement KPI Course Dashboard Mockup Pdf
This slide provides glimpse about data statistics related to employee performance in skill development courses. It includes your class progress, UX or UI course, web design course, etc. Showcasing this set of slides titled Online Learning And Improvement KPI Course Dashboard Mockup Pdf. The topics addressed in these templates are Online Learning, KPI Course Dashboard, Skill Development Courses. All the content presented in this PPT design is completely editable. Download it and make adjustments in color, background, font etc. as per your unique business setting. This slide provides glimpse about data statistics related to employee performance in skill development courses. It includes your class progress, UX or UI course, web design course, etc.
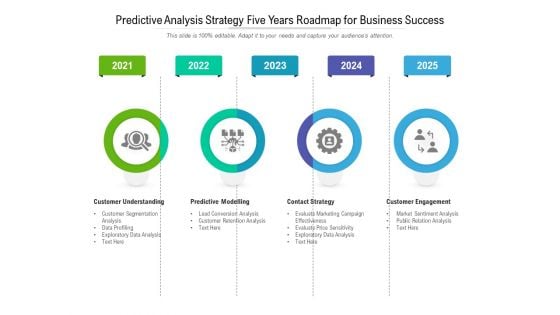
Predictive Analysis Strategy Five Years Roadmap For Business Success Rules
Presenting our jaw-dropping predictive analysis strategy five years roadmap for business success rules. You can alternate the color, font size, font type, and shapes of this PPT layout according to your strategic process. This PPT presentation is compatible with Google Slides and is available in both standard screen and widescreen aspect ratios. You can also download this well-researched PowerPoint template design in different formats like PDF, JPG, and PNG. So utilize this visually-appealing design by clicking the download button given below.
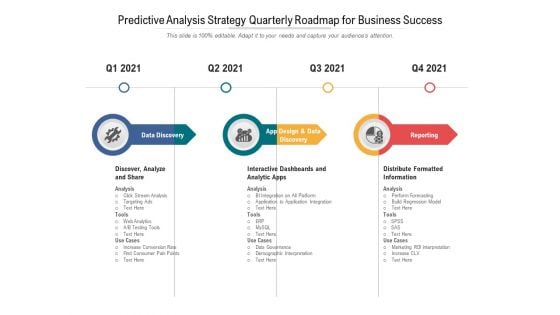
Predictive Analysis Strategy Quarterly Roadmap For Business Success Inspiration
Presenting our jaw-dropping predictive analysis strategy quarterly roadmap for business success inspiration. You can alternate the color, font size, font type, and shapes of this PPT layout according to your strategic process. This PPT presentation is compatible with Google Slides and is available in both standard screen and widescreen aspect ratios. You can also download this well-researched PowerPoint template design in different formats like PDF, JPG, and PNG. So utilize this visually-appealing design by clicking the download button given below.
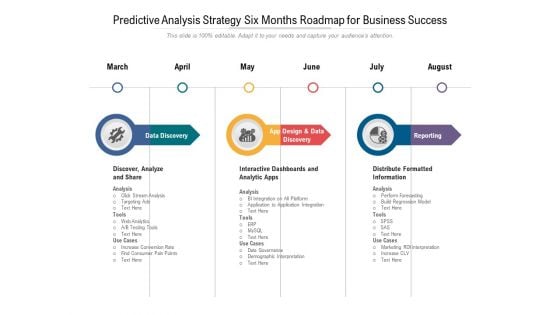
Predictive Analysis Strategy Six Months Roadmap For Business Success Rules
Introducing our predictive analysis strategy six months roadmap for business success rules. This PPT presentation is Google Slides compatible, therefore, you can share it easily with the collaborators for measuring the progress. Also, the presentation is available in both standard screen and widescreen aspect ratios. So edit the template design by modifying the font size, font type, color, and shapes as per your requirements. As this PPT design is fully editable it can be presented in PDF, JPG and PNG formats.
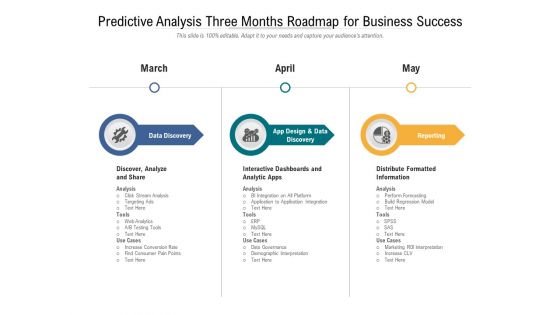
Predictive Analysis Three Months Roadmap For Business Success Infographics
Introducing our predictive analysis three months roadmap for business success infographics. This PPT presentation is Google Slides compatible, therefore, you can share it easily with the collaborators for measuring the progress. Also, the presentation is available in both standard screen and widescreen aspect ratios. So edit the template design by modifying the font size, font type, color, and shapes as per your requirements. As this PPT design is fully editable it can be presented in PDF, JPG and PNG formats.
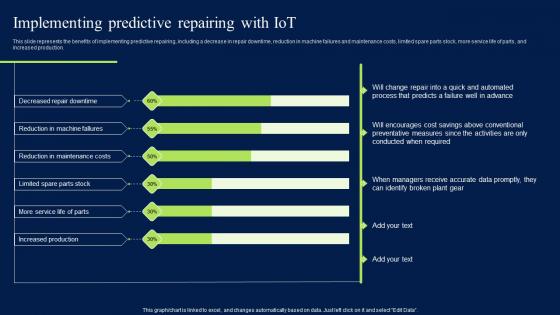
Implementing Predictive Repairing With Iot Artificial Intelligence Impact Graphics PDF
This slide represents the benefits of implementing predictive repairing, including a decrease in repair downtime, reduction in machine failures and maintenance costs, limited spare parts stock, more service life of parts, and increased production. There are so many reasons you need a Implementing Predictive Repairing With Iot Artificial Intelligence Impact Graphics PDF. The first reason is you can not spend time making everything from scratch, Thus, Slidegeeks has made presentation templates for you too. You can easily download these templates from our website easily. This slide represents the benefits of implementing predictive repairing, including a decrease in repair downtime, reduction in machine failures and maintenance costs, limited spare parts stock, more service life of parts, and increased production.
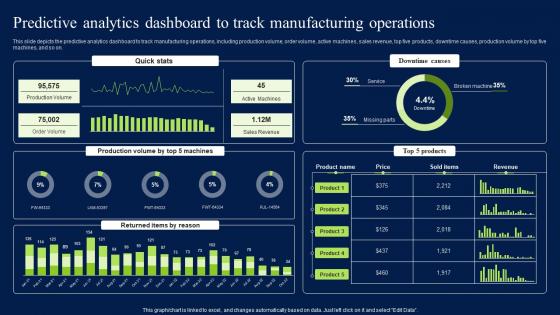
Predictive Analytics Dashboard To Track Manufacturing Operations Download PDF
This slide depicts the predictive analytics dashboard to track manufacturing operations, including production volume, order volume, active machines, sales revenue, top five products, downtime causes, production volume by top five machines, and so on. Present like a pro with Predictive Analytics Dashboard To Track Manufacturing Operations Download PDF Create beautiful presentations together with your team, using our easy-to-use presentation slides. Share your ideas in real-time and make changes on the fly by downloading our templates. So whether you are in the office, on the go, or in a remote location, you can stay in sync with your team and present your ideas with confidence. With Slidegeeks presentation got a whole lot easier. Grab these presentations today. This slide depicts the predictive analytics dashboard to track manufacturing operations, including production volume, order volume, active machines, sales revenue, top five products, downtime causes, production volume by top five machines, and so on.
Bar Graph Business PowerPoint Templates And PowerPoint Themes 0212
Microsoft Powerpoint Templates and Background with chart from blocks Illustrate the essential elements of the project. Delve into the basic nature with our Bar Graph Business PowerPoint Templates And PowerPoint Themes 0212.
Icons Slide For Data Security In Cloud Computing Ppt Presentation
Download our innovative and attention grabbing Icons Slide For Data Security In Cloud Computing Ppt Presentation template. The set of slides exhibit completely customizable icons. These icons can be incorporated into any business presentation. So download it immediately to clearly communicate with your clientele. Our Icons Slide For Data Security In Cloud Computing Ppt Presentation are topically designed to provide an attractive backdrop to any subject. Use them to look like a presentation pro.
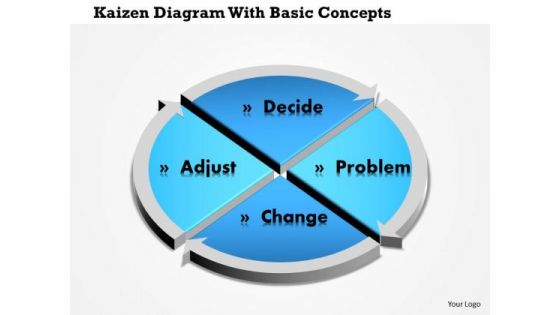
Business Diagram Kaizen Diagram With Basic Concepts Presentation Template
This diagram is kaizen diagram with basic concepts. This diagram designed to help instruct, construct and present an improvement project. You may create memorable and attractive powerPoint presentations with this professionally designed diagram.
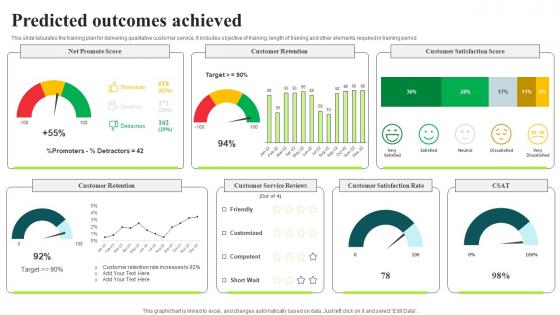
Client Feedback Strategies Predicted Outcomes Achieved Rules Pdf
This slide tabulates the training plan for delivering qualitative customer service. It includes objective of training, length of training and other elements required in training period This Client Feedback Strategies Predicted Outcomes Achieved Rules Pdf from Slidegeeks makes it easy to present information on your topic with precision. It provides customization options, so you can make changes to the colors, design, graphics, or any other component to create a unique layout. It is also available for immediate download, so you can begin using it right away. Slidegeeks has done good research to ensure that you have everything you need to make your presentation stand out. Make a name out there for a brilliant performance. This slide tabulates the training plan for delivering qualitative customer service. It includes objective of training, length of training and other elements required in training period
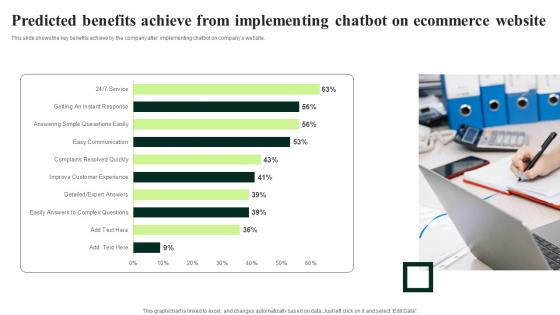
Predicted Benefits Achieve From Implementing Chatbot On Ecommerce Inspiration Pdf
This slide shows the key benefits achieve by the company after implementing chatbot on companys website. Present like a pro with Predicted Benefits Achieve From Implementing Chatbot On Ecommerce Inspiration Pdf Create beautiful presentations together with your team, using our easy to use presentation slides. Share your ideas in real time and make changes on the fly by downloading our templates. So whether you are in the office, on the go, or in a remote location, you can stay in sync with your team and present your ideas with confidence. With Slidegeeks presentation got a whole lot easier. Grab these presentations today. This slide shows the key benefits achieve by the company after implementing chatbot on companys website.
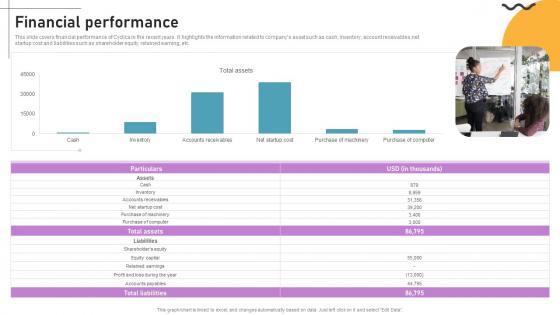
Financial Performance Cloud Based Predictive Analytics Software Pitch Deck
This slide covers financial performance of Cyclica in the recent years. It highlights the information related to companys asset such as cash, inventory, account receivables,net startup cost and liabilities such as shareholder equity, retained earning, etc. From laying roadmaps to briefing everything in detail, our templates are perfect for you. You can set the stage with your presentation slides. All you have to do is download these easy-to-edit and customizable templates. Financial Performance Cloud Based Predictive Analytics Software Pitch Deck will help you deliver an outstanding performance that everyone would remember and praise you for. Do download this presentation today. This slide covers financial performance of Cyclica in the recent years. It highlights the information related to companys asset such as cash, inventory, account receivables,net startup cost and liabilities such as shareholder equity, retained earning, etc.
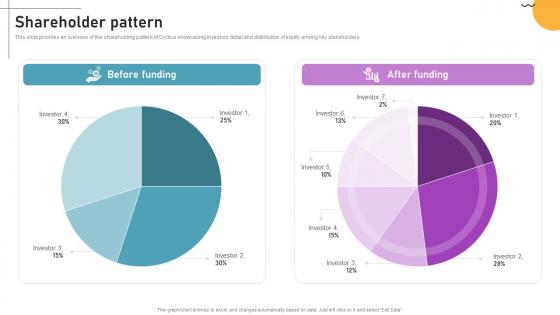
Shareholder Pattern Cloud Based Predictive Analytics Software Pitch Deck
This slide provides an overview of the shareholding pattern of Cyclica showcasing investors detail and distribution of equity among key stakeholders. This modern and well-arranged Shareholder Pattern Cloud Based Predictive Analytics Software Pitch Deck provides lots of creative possibilities. It is very simple to customize and edit with the Powerpoint Software. Just drag and drop your pictures into the shapes. All facets of this template can be edited with Powerpoint, no extra software is necessary. Add your own material, put your images in the places assigned for them, adjust the colors, and then you can show your slides to the world, with an animated slide included. This slide provides an overview of the shareholding pattern of Cyclica showcasing investors detail and distribution of equity among key stakeholders.
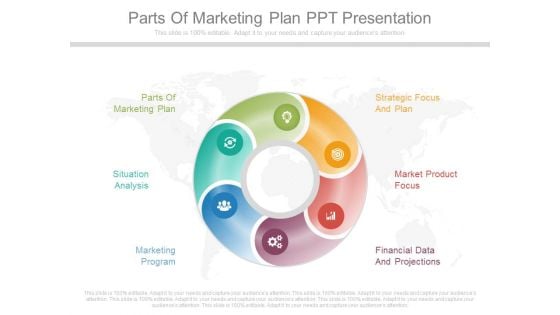
Parts Of Marketing Plan Ppt Presentation
This is a parts of marketing plan ppt presentation. This is a six stage process. The stages in this process are parts of marketing plan, strategic focus and plan, situation analysis, market product focus, marketing program, financial data and projections.
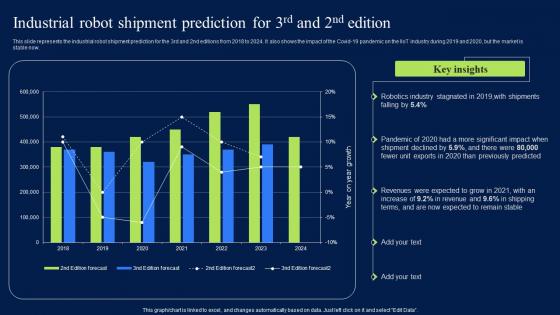
Industrial Robot Shipment Prediction For 3Rd And 2Nd Edition Formats PDF
This slide represents the industrial robot shipment prediction for the 3rd and 2nd editions from 2018 to 2024. It also shows the impact of the Covid-19 pandemic on the IoT industry during 2019 and 2020, but the market is stable now. Do you have to make sure that everyone on your team knows about any specific topic I yes, then you should give Industrial Robot Shipment Prediction For 3Rd And 2Nd Edition Formats PDF a try. Our experts have put a lot of knowledge and effort into creating this impeccable Industrial Robot Shipment Prediction For 3Rd And 2Nd Edition Formats PDF. You can use this template for your upcoming presentations, as the slides are perfect to represent even the tiniest detail. You can download these templates from the Slidegeeks website and these are easy to edit. So grab these today This slide represents the industrial robot shipment prediction for the 3rd and 2nd editions from 2018 to 2024. It also shows the impact of the Covid-19 pandemic on the IIoT industry during 2019 and 2020, but the market is stable now.
Calculating Customer Lifetime Value Clv Ppt PowerPoint Presentation Show Icon
This is a calculating customer lifetime value clv ppt powerpoint presentation show icon. This is a five stage process. The stages in this process are average acquisition cost, average customer revenue, average customer costs, average customer profit, customer retention rate.
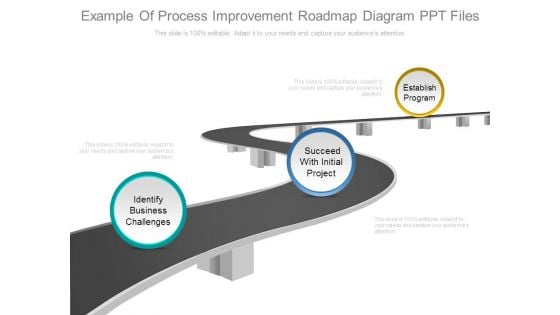
Example Of Process Improvement Roadmap Diagram Ppt Files
This is a example of process improvement roadmap diagram ppt files. This is a three stage process. The stages in this process are identify business challenges, succeed with initial project, establish program.
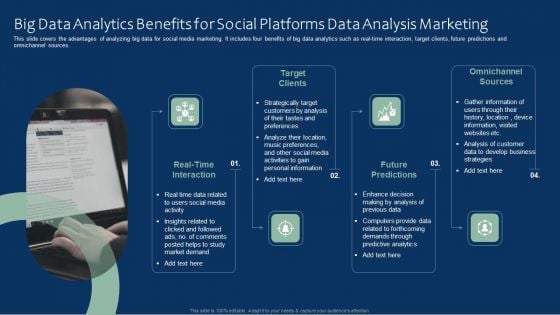
Big Data Analytics Benefits For Social Platforms Data Analysis Marketing Mockup PDF
This slide covers the advantages of analyzing big data for social media marketing. It includes four benefits of big data analytics such as real-time interaction, target clients, future predictions and omnichannel sources. Presenting Big Data Analytics Benefits For Social Platforms Data Analysis Marketing Mockup PDF to dispense important information. This template comprises four stages. It also presents valuable insights into the topics including Target Clients, Future Predictions, Omnichannel Sources. This is a completely customizable PowerPoint theme that can be put to use immediately. So, download it and address the topic impactfully.
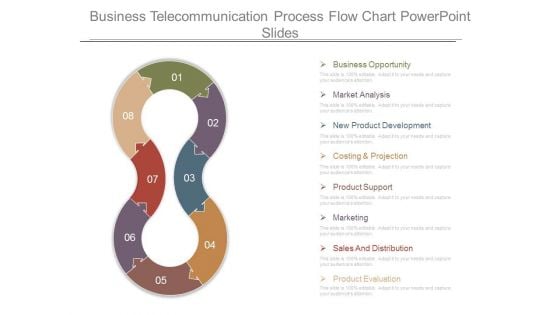
Business Telecommunication Process Flow Chart Powerpoint Slides
This is a business telecommunication process flow chart powerpoint slides. This is a eight stage process. The stages in this process are business opportunity, market analysis, new product development, costing and projection, product support, marketing, sales and distribution, product evaluation.
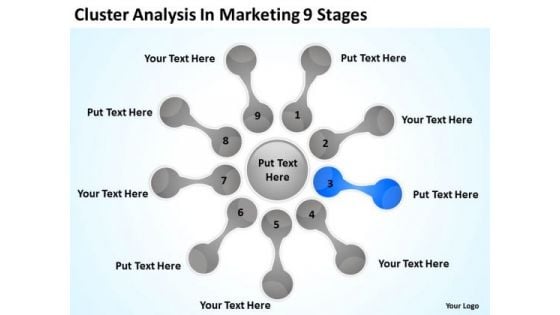
Cluster Analysis In Marketing 9 Stages Good Business Plan PowerPoint Templates
We present our cluster analysis in marketing 9 stages good business plan PowerPoint templates.Download our Flow Charts PowerPoint Templates because It can Conjure up grand ideas with our magical PowerPoint Templates and Slides. Leave everyone awestruck by the end of your presentation. Download our Business PowerPoint Templates because Our PowerPoint Templates and Slides are specially created by a professional team with vast experience. They diligently strive to come up with the right vehicle for your brilliant Ideas. Use our Shapes PowerPoint Templates because You should Kick up a storm with our PowerPoint Templates and Slides. The heads of your listeners will swirl with your ideas. Use our Process and Flows PowerPoint Templates because It will Raise the bar of your Thoughts. They are programmed to take you to the next level. Use our Circle Charts PowerPoint Templates because Our PowerPoint Templates and Slides will let you meet your Deadlines.Use these PowerPoint slides for presentations relating to Mapping, vector, chart, flow, flowchart, process, model, step, tool, blank, processdiagram, concept, topic, presentation, relate, circle, graphic, data, report, marketing, idea, circlepattern, team, management, graph, cycle, illustration, connection, processchart,direction, plans, color, text, phase, organization, control, connect, link, explanation, mapping, present. The prominent colors used in the PowerPoint template are Blue, Black, Gray. Our Cluster Analysis In Marketing 9 Stages Good Business Plan PowerPoint Templates save time creating a mind blowing presentation. With our money back guarantee you have nothing to lose.
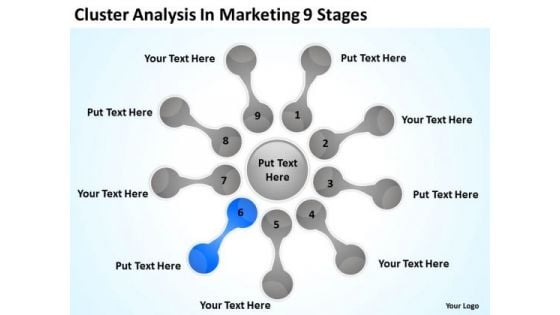
Cluster Analysis In Marketing 9 Stages How To Business Plans PowerPoint Slides
We present our cluster analysis in marketing 9 stages how to business plans PowerPoint Slides.Present our Business PowerPoint Templates because Your audience will believe you are the cats whiskers. Download and present our Shapes PowerPoint Templates because Our PowerPoint Templates and Slides will let you Hit the target. Go the full distance with ease and elan. Download and present our Process and Flows PowerPoint Templates because You can Hit the nail on the head with our PowerPoint Templates and Slides. Embed your ideas in the minds of your audience. Download our Circle Charts PowerPoint Templates because You can Bask in the warmth of our PowerPoint Templates and Slides. Enjoy the heartfelt glowing response of your listeners. Present our Flow Charts PowerPoint Templates because Our PowerPoint Templates and Slides will provide the perfect balance. Your weighty ideas will get the ideal impetus.Use these PowerPoint slides for presentations relating to Mapping, vector, chart, flow, flowchart, process, model, step, tool, blank, processdiagram, concept, topic, presentation, relate, circle, graphic, data, report, marketing, idea, circlepattern, team, management, graph, cycle, illustration, connection, processchart,direction, plans, color, text, phase, organization, control, connect, link, explanation, mapping, present. The prominent colors used in the PowerPoint template are Black, Gray, Blue. Have a 'Eureka"moment with our Cluster Analysis In Marketing 9 Stages How To Business Plans PowerPoint Slides. Discover new depths to your thoughts.
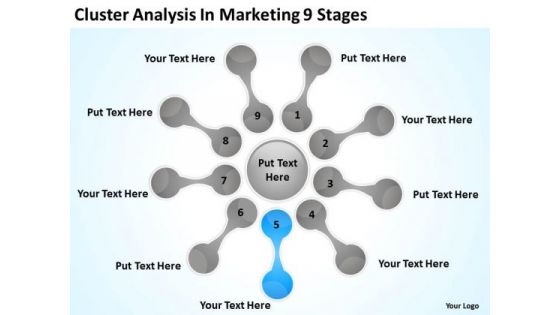
Cluster Analysis In Marketing 9 Stages Ppt Business Plan Format PowerPoint Templates
We present our cluster analysis in marketing 9 stages ppt business plan format PowerPoint templates.Download and present our Flow Charts PowerPoint Templates because Your ideas provide food for thought. Our PowerPoint Templates and Slides will help you create a dish to tickle the most discerning palate. Present our Process and Flows PowerPoint Templates because Our PowerPoint Templates and Slides help you pinpoint your timelines. Highlight the reasons for your deadlines with their use. Download and present our Shapes PowerPoint Templates because you can Break through with our PowerPoint Templates and Slides. Bring down the mental barriers of your audience. Use our Circle Charts PowerPoint Templates because Our PowerPoint Templates and Slides will let you Hit the target. Go the full distance with ease and elan. Download our Marketing PowerPoint Templates because our PowerPoint Templates and Slides will give your ideas the shape.Use these PowerPoint slides for presentations relating to Mapping, vector, chart, flow, flowchart, process, model, step, tool, blank, processdiagram, concept, topic, presentation, relate, circle, graphic, data, report, marketing, idea, circlepattern, team, management, graph, cycle, illustration, connection, processchart,direction, plans, color, text, phase, organization, control, connect, link, explanation, mapping, present. The prominent colors used in the PowerPoint template are Blue light, White, Gray. Lean is in, fat is out. Our Cluster Analysis In Marketing 9 Stages Ppt Business Plan Format PowerPoint Templates achieve the desired look.
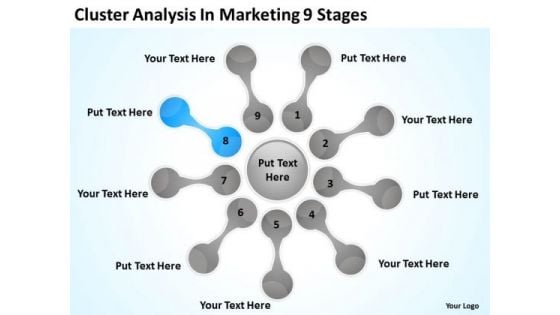
Cluster Analysis In Marketing 9 Stages Ppt Fill The Blank Business Plan PowerPoint Slides
We present our cluster analysis in marketing 9 stages ppt fill the blank business plan PowerPoint Slides.Download and present our Flow Charts PowerPoint Templates because Our PowerPoint Templates and Slides are focused like a searchlight beam. They highlight your ideas for your target audience. Use our Process and Flows PowerPoint Templates because They will Put your wonderful verbal artistry on display. Our PowerPoint Templates and Slides will provide you the necessary glam and glitter. Use our Shapes PowerPoint Templates because They will Put your wonderful verbal artistry on display. Our PowerPoint Templates and Slides will provide you the necessary glam and glitter. Use our Circle Charts PowerPoint Templates because Our PowerPoint Templates and Slides will weave a web of your great ideas. They are gauranteed to attract even the most critical of your colleagues. Use our Marketing PowerPoint Templates because These PowerPoint Templates and Slides will give the updraft to your ideas. See them soar to great heights with ease.Use these PowerPoint slides for presentations relating to Mapping, vector, chart, flow, flowchart, process, model, step, tool, blank, processdiagram, concept, topic, presentation, relate, circle, graphic, data, report, marketing, idea, circlepattern, team, management, graph, cycle, illustration, connection, processchart,direction, plans, color, text, phase, organization, control, connect, link, explanation, mapping, present. The prominent colors used in the PowerPoint template are Blue light, White, Gray. An array of colors give our Cluster Analysis In Marketing 9 Stages Ppt Fill The Blank Business Plan PowerPoint Slides an alluring blend. They make your thoughts very enticing.


 Continue with Email

 Home
Home


