Justice Icon
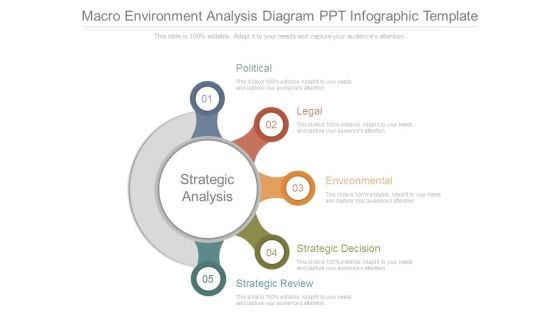
Macro Environment Analysis Diagram Ppt Infographic Template
This is a macro environment analysis diagram ppt infographic template. This is a five stage process. The stages in this process are political, legal, environmental, strategic decision, strategic review, strategic analysis.
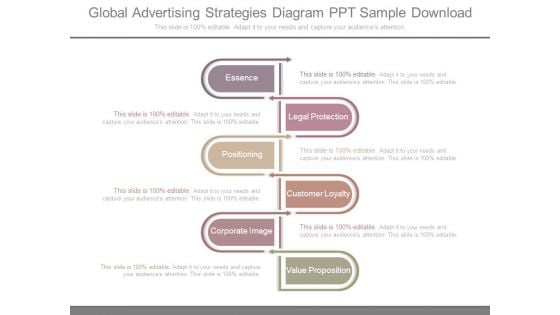
Global Advertising Strategies Diagram Ppt Sample Download
This is a global advertising strategies diagram ppt sample download. This is a six stage process. The stages in this process are essence, legal protection, positioning, customer loyalty, corporate image, value proposition.
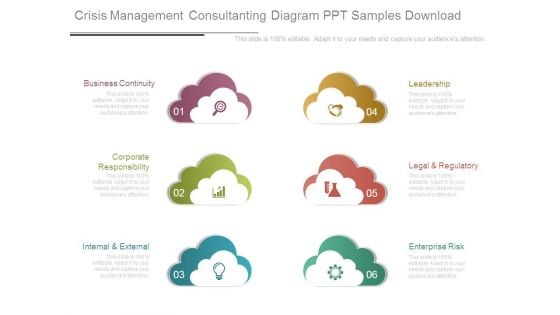
Crisis Management Consultanting Diagram Ppt Samples Download
This is a crisis management consultanting diagram ppt samples download. This is a six stage process. The stages in this process are business continuity, corporate responsibility, internal and external, leadership, legal and regulatory, enterprise risk.
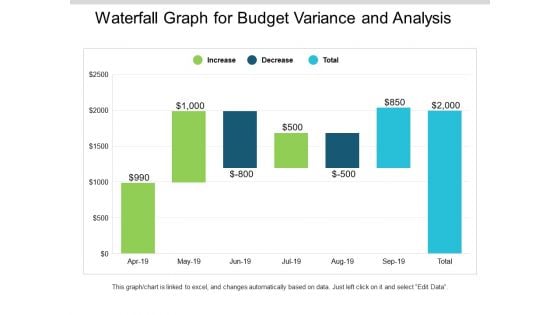
Waterfall Graph For Budget Variance And Analysis Ppt PowerPoint Presentation Slides Mockup
This is a waterfall graph for budget variance and analysis ppt powerpoint presentation slides mockup. This is a three stage process. The stages in this process are profit and loss, balance sheet, income statement, benefit and loss.
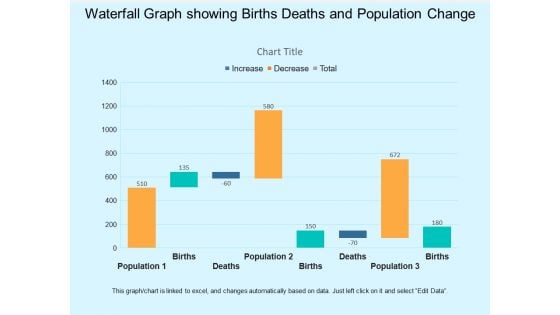
Waterfall Graph Showing Births Deaths And Population Change Ppt PowerPoint Presentation Infographic Template Visual Aids
This is a waterfall graph showing births deaths and population change ppt powerpoint presentation infographic template visual aids. This is a three stage process. The stages in this process are profit and loss, balance sheet, income statement, benefit and loss.
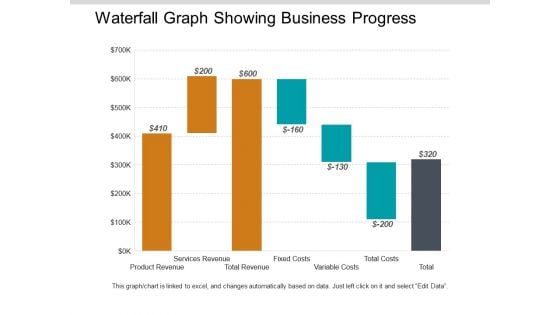
Waterfall Graph Showing Business Progress Ppt PowerPoint Presentation Styles Model
This is a waterfall graph showing business progress ppt powerpoint presentation styles model. This is a three stage process. The stages in this process are profit and loss, balance sheet, income statement, benefit and loss.
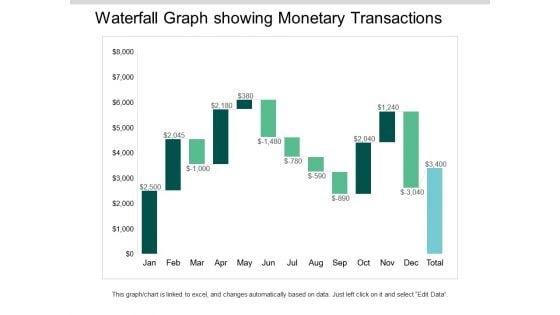
Waterfall Graph Showing Monetary Transactions Ppt PowerPoint Presentation Ideas Visuals
This is a waterfall graph showing monetary transactions ppt powerpoint presentation ideas visuals. This is a three stage process. The stages in this process are profit and loss, balance sheet, income statement, benefit and loss.
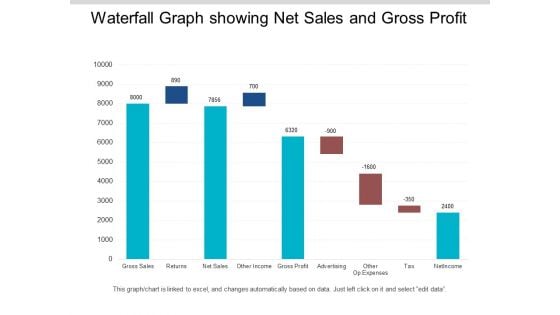
Waterfall Graph Showing Net Sales And Gross Profit Ppt PowerPoint Presentation Infographics Format
This is a waterfall graph showing net sales and gross profit ppt powerpoint presentation infographics format. This is a three stage process. The stages in this process are profit and loss, balance sheet, income statement, benefit and loss.
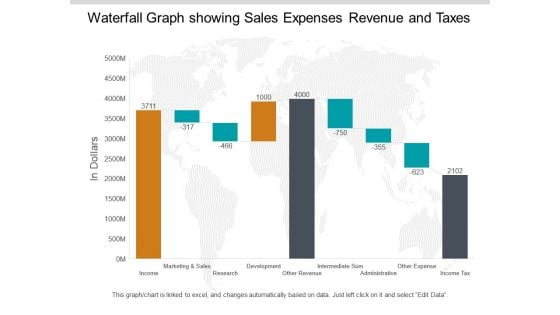
Waterfall Graph Showing Sales Expenses Revenue And Taxes Ppt PowerPoint Presentation Pictures Summary
This is a waterfall graph showing sales expenses revenue and taxes ppt powerpoint presentation pictures summary. This is a three stage process. The stages in this process are profit and loss, balance sheet, income statement, benefit and loss.
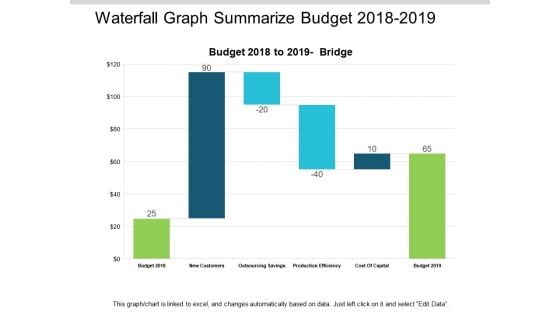
Waterfall Graph Summarize Budget 2018 To 2019 Ppt PowerPoint Presentation Summary Slides
This is a waterfall graph summarize budget 2018 to 2019 ppt powerpoint presentation summary slides. This is a three stage process. The stages in this process are profit and loss, balance sheet, income statement, benefit and loss.
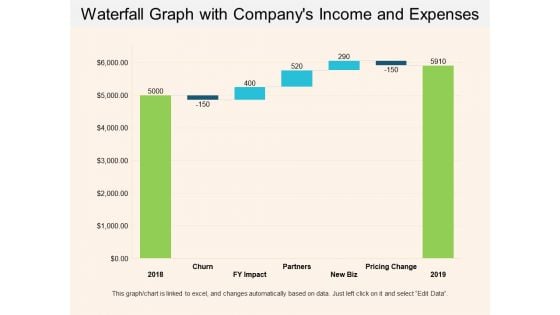
Waterfall Graph With Companys Income And Expenses Ppt PowerPoint Presentation Show Example Introduction
This is a waterfall graph with companys income and expenses ppt powerpoint presentation show example introduction. This is a three stage process. The stages in this process are profit and loss, balance sheet, income statement, benefit and loss.
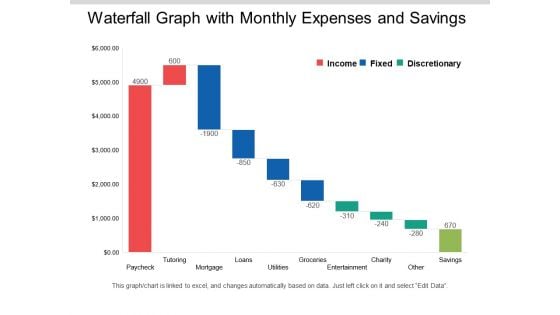
Waterfall Graph With Monthly Expenses And Savings Ppt PowerPoint Presentation Layouts Clipart Images
This is a waterfall graph with monthly expenses and savings ppt powerpoint presentation layouts clipart images. This is a three stage process. The stages in this process are profit and loss, balance sheet, income statement, benefit and loss.
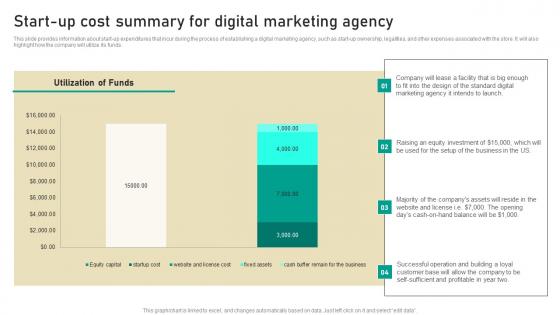
Start Up Cost Summary For Digital Marketing Agency Digital Marketing Business Diagrams Pdf
This slide provides information about start-up expenditures that incur during the process of establishing a digital marketing agency, such as start-up ownership, legalities, and other expenses associated with the store. It will also highlight how the company will utilize its funds. This Start Up Cost Summary For Digital Marketing Agency Digital Marketing Business Diagrams Pdf from Slidegeeks makes it easy to present information on your topic with precision. It provides customization options, so you can make changes to the colors, design, graphics, or any other component to create a unique layout. It is also available for immediate download, so you can begin using it right away. Slidegeeks has done good research to ensure that you have everything you need to make your presentation stand out. Make a name out there for a brilliant performance. This slide provides information about start-up expenditures that incur during the process of establishing a digital marketing agency, such as start-up ownership, legalities, and other expenses associated with the store. It will also highlight how the company will utilize its funds.
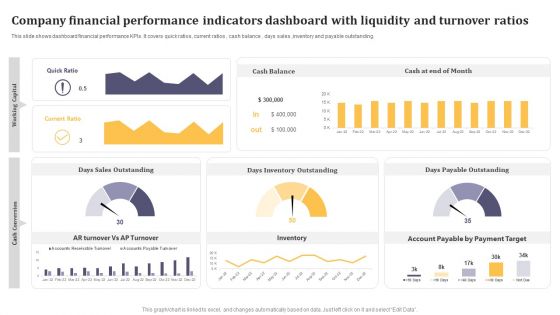
Company Financial Performance Indicators Dashboard With Liquidity And Turnover Ratios Formats PDF
This graph or chart is linked to excel, and changes automatically based on data. Just left click on it and select Edit Data. Pitch your topic with ease and precision using this Company Financial Performance Indicators Dashboard With Liquidity And Turnover Ratios Formats PDF. This layout presents information on Cash Balance, Days Inventory Outstanding, Days Payable Outstanding. It is also available for immediate download and adjustment. So, changes can be made in the color, design, graphics or any other component to create a unique layout.
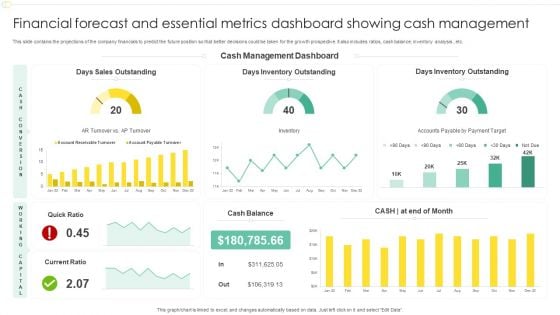
Financial Forecast And Essential Metrics Dashboard Showing Cash Management Designs PDF
This slide contains the projections of the company financials to predict the future position so that better decisions could be taken for the growth prospective. It also includes ratios, cash balance, inventory analysis , etc. Showcasing this set of slides titled Financial Forecast And Essential Metrics Dashboard Showing Cash Management Designs PDF. The topics addressed in these templates are Days Sales Outstanding, Cash Management Dashboard, Days Inventory Outstanding. All the content presented in this PPT design is completely editable. Download it and make adjustments in color, background, font etc. as per your unique business setting.
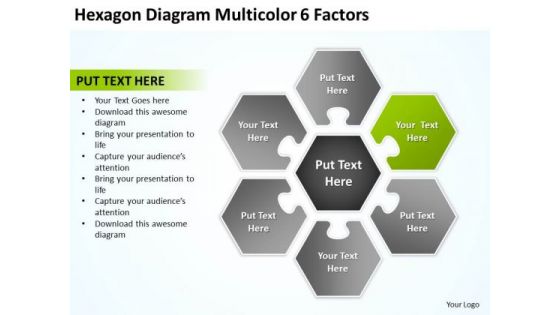
Hexagon Diagram Multicolor 6 Factors Business Plan PowerPoint Slides
We present our hexagon diagram multicolor 6 factors business plan PowerPoint Slides.Download our Process and Flows PowerPoint Templates because It is Aesthetically crafted by artistic young minds. Our PowerPoint Templates and Slides are designed to display your dexterity. Present our Flow Charts PowerPoint Templates because Our PowerPoint Templates and Slides will let you Hit the target. Go the full distance with ease and elan. Use our Business PowerPoint Templates because Our PowerPoint Templates and Slides come in all colours, shades and hues. They help highlight every nuance of your views. Use our Marketing PowerPoint Templates because Our PowerPoint Templates and Slides will fulfill your every need. Use them and effectively satisfy the desires of your audience. Download our Finance PowerPoint Templates because Our PowerPoint Templates and Slides will provide the perfect balance. Your weighty ideas will get the ideal impetus.Use these PowerPoint slides for presentations relating to Process, chart, market, website, network, cross, statistics, model, document, junction, business, plan, presentation, glossy, diagram, circle, brochure, data, marketing, management, multicolored, six, box, sphere, options, catalog, shiny, direction, design, text,company, navigation, financial, structure, multiple, button, results. The prominent colors used in the PowerPoint template are Green lime, Gray, White. Award yourself with our Hexagon Diagram Multicolor 6 Factors Business Plan PowerPoint Slides. Your thoughts deserve the distinction.
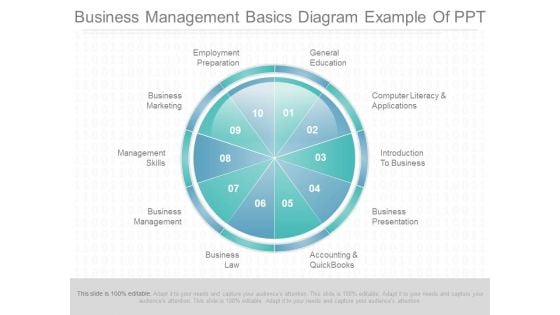
Business Management Basics Diagram Example Of Ppt
This is a business management basics diagram example of ppt. This is a ten stage process. The stages in this process are general education, computer literacy and applications, introduction to business, business presentation, accounting and quickbooks, business law, business management, management skills, business marketing, employment preparation.
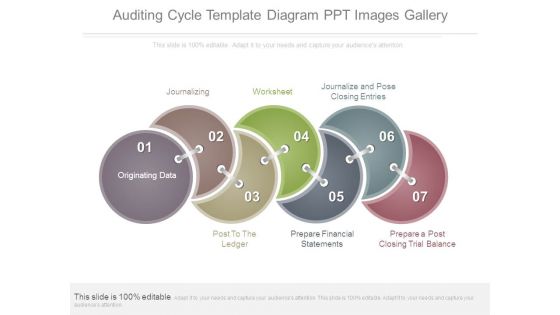
Auditing Cycle Template Diagram Ppt Images Gallery
This is a auditing cycle template diagram ppt images gallery. This is a seven stage process. The stages in this process are journalizing, worksheet, journalize and pose closing entries, post to the ledger, prepare financial statements, prepare a post closing trial balance, originating data.
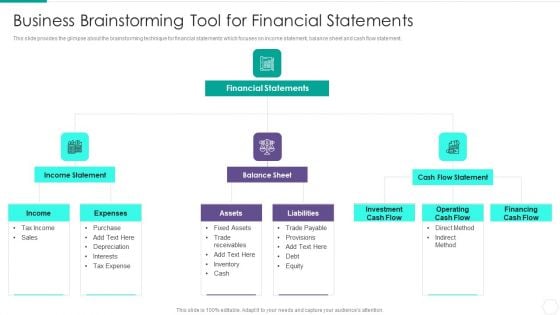
Quantitative Risk Assessment Business Brainstorming Tool For Financial Statements Introduction PDF
This slide provides the glimpse about the brainstorming technique for financial statements which focuses on income statement, balance sheet and cash flow statement. Presenting Quantitative Risk Assessment Business Brainstorming Tool For Financial Statements Introduction PDF to provide visual cues and insights. Share and navigate important information on three stages that need your due attention. This template can be used to pitch topics like Financial Statements, Expenses, Purchase, Tax Income, Sales. In addtion, this PPT design contains high resolution images, graphics, etc, that are easily editable and available for immediate download.
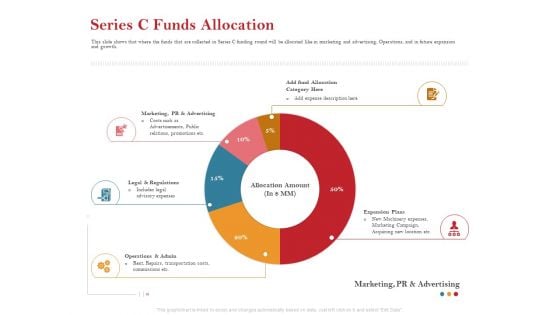
Pitch Deck For Raising Capital For Inorganic Growth Series C Funds Allocation Diagrams PDF
This slide shows that where the funds that are collected in Series C funding round will be allocated like in marketing and advertising, Operations, and in future expansion and growth. Deliver and pitch your topic in the best possible manner with this pitch deck for raising capital for inorganic growth series c funds allocation diagrams pdf. Use them to share invaluable insights on marketing, allocation, expansion plans, legal and regulations, operations and admin and impress your audience. This template can be altered and modified as per your expectations. So, grab it now.
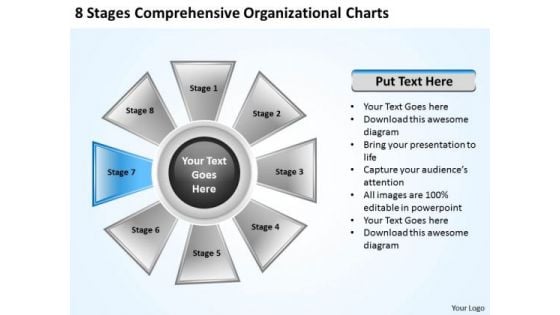
Business Intelligence Strategy Comprehensive Organizational Charts Ppt Company
We present our business intelligence strategy comprehensive organizational charts ppt company.Use our Circle Charts PowerPoint Templates because Our PowerPoint Templates and Slides have the Brilliant backdrops. Guaranteed to illuminate the minds of your audience. Use our Flow Charts PowerPoint Templates because They will bring a lot to the table. Their alluring flavours will make your audience salivate. Use our Marketing PowerPoint Templates because Our PowerPoint Templates and Slides are endowed to endure. Ideas conveyed through them will pass the test of time. Present our Business PowerPoint Templates because Our PowerPoint Templates and Slides are created with admirable insight. Use them and give your group a sense of your logical mind. Download our Shapes PowerPoint Templates because Our PowerPoint Templates and Slides will provide the perfect balance. Your weighty ideas will get the ideal impetus.Use these PowerPoint slides for presentations relating to Arrow, art, blank, business, chart, circular, clip, clipart, clockwise, colorful,copyspace, corporate, curving, cycle, diagram, directional, eight,financial, flow, graph,graphic, illustration, infographic, modern, pie, process, round,segments, shape, slices, stages, steps, wheel, work. The prominent colors used in the PowerPoint template are Blue, Gray, Black. Our Business Intelligence Strategy Comprehensive Organizational Charts Ppt Company will corroborate your thoughts. Add to the authenticity of your ideas.

HR Scoreboard Metrics With Perspectives Themes PDF
The purpose of this slide is to illustrate the HR balanced scorecard based on certain business perceptive that incorporates business goals and human resource strategic objectives. The perceptive include financial, customer, and operations along with objectives and measurements. Showcasing this set of slides titled HR Scoreboard Metrics With Perspectives Themes PDF. The topics addressed in these templates are Financia, Customer, Operations. All the content presented in this PPT design is completely editable. Download it and make adjustments in color, background, font etc. as per your unique business setting.
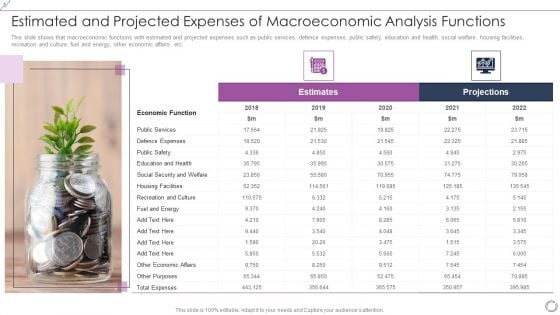
Estimated And Projected Expenses Of Macroeconomic Analysis Functions Elements PDF
This slide shows that macroeconomic functions with estimated and projected expenses such as public services, defence expenses, public safety, education and health, social welfare, housing facilities, recreation and culture, fuel and energy, other economic affairs, etc. Presenting Estimated And Projected Expenses Of Macroeconomic Analysis Functions Elements PDF to dispense important information. This template comprises two stages. It also presents valuable insights into the topics including Economic Function, Public Services, Defence Expenses, Education And Health. This is a completely customizable PowerPoint theme that can be put to use immediately. So, download it and address the topic impactfully.
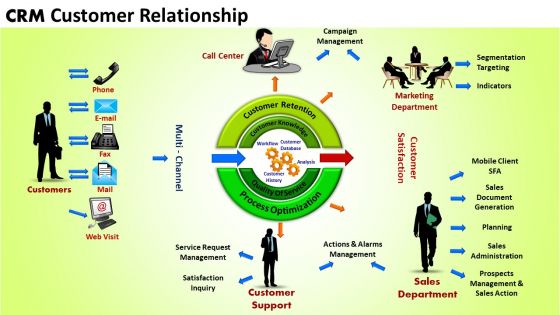
Business Circle Charts PowerPoint Templates Business Crm Customer Relationship Ppt Slides
Business Circle Charts PowerPoint Templates Business crm customer relationship PPT Slides-Use this CRM Diagram in PowerPoint with different circles and colors for customer relationship management projects.-Business Circle Charts PowerPoint Templates Business crm customer relationship PPT Slides-This template can be used for presentations relating to Analysis, Brainstorming, Business, Chart, Concept, Creative, Creativity, Crm, Customer, Diagram, Executive, Flowchart,Hand, Idea, Inspire, Interface, Layout, Legal, Management, Manager, Meeting, Note, Office, Pen, Plan, Presentation, Program, Relationship, Student, Teach, Teamwork, Technical Equip your thoughts with our Business Circle Charts PowerPoint Templates Business Crm Customer Relationship Ppt Slides. They will prove a worthwhile accessory.
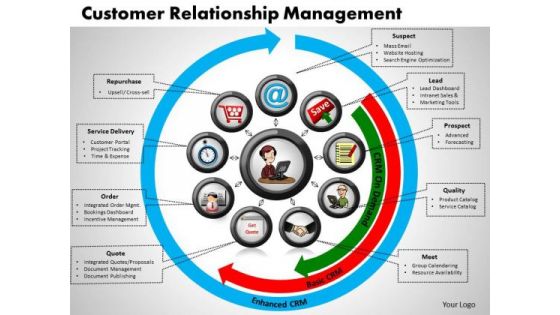
Business Circle Charts PowerPoint Templates Process Customer Relationship Management Ppt Slides
Business Circle Charts PowerPoint Templates Process customer relationship management PPT Slides-This CRM diagram can be used for understanding the way customers think and for adapting to their needs and demands in order to put more emphasis on the business-Business Circle Charts PowerPoint Templates Process customer relationship management PPT Slides-This template can be used for presentations relating to Analysis, Brainstorming, Business, Chart, Concept, Creative, Creativity, Crm, Customer, Diagram, Executive, Flowchart,Hand, Idea, Inspire, Interface, Layout, Legal, Management, Manager, Meeting, Note, Office, Pen, Plan, Presentation, Program, Relationship, Student, Teach, Teamwork, Technical Our Business Circle Charts PowerPoint Templates Process Customer Relationship Management Ppt Slides are high fidelity. They accurately convey your thoughts to your listeners.
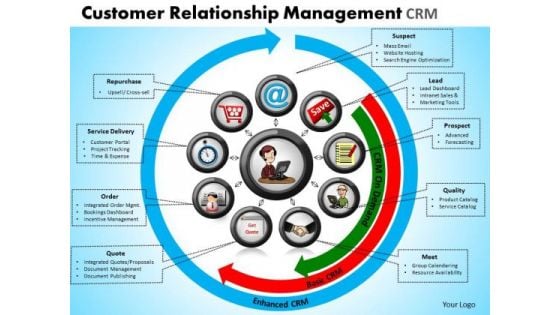
Business Circle Charts PowerPoint Templates Success Customer Relationship Management Ppt Slides
Business Circle Charts PowerPoint Templates Success customer relationship management PPT Slides-CRM systems are designed to help you identify, acquire and retain customers.This diagram demonstrates how the roles in the company work together to perform .-Business Circle Charts PowerPoint Templates Success customer relationship management PPT Slides-This template can be used for presentations relating to Analysis, Brainstorming, Business, Chart, Concept, Creative, Creativity, Crm, Customer, Diagram, Executive, Flowchart,Hand, Idea, Inspire, Interface, Layout, Legal, Management, Manager, Meeting, Note, Office, Pen, Plan, Presentation, Program, Relationship, Student, Teach, Teamwork, Technical Be expressive with our Business Circle Charts PowerPoint Templates Success Customer Relationship Management Ppt Slides. Bring in feeling to your thoughts.
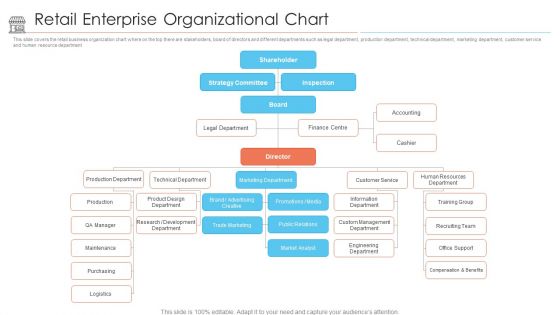
Positioning Store Brands Retail Enterprise Organizational Chart Brochure PDF
This slide covers the retail business organization chart where on the top there are stakeholders, board of directors and different departments such as legal department, production department, technical department, marketing department, customer service and human resource department. This is a positioning store brands retail enterprise organizational chart brochure pdf template with various stages. Focus and dispense information on eleven stages using this creative set, that comes with editable features. It contains large content boxes to add your information on topics like production department, technical department, marketing department, customer service, human resource department. You can also showcase facts, figures, and other relevant content using this PPT layout. Grab it now.
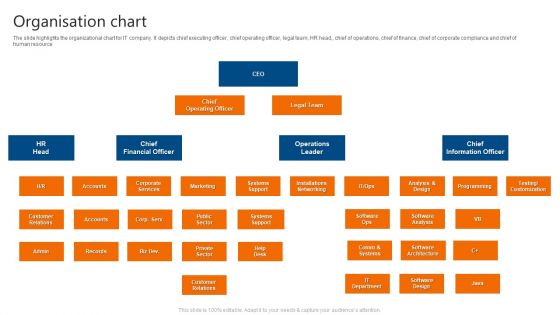
Organisation Chart IT Software Development Company Profile Structure PDF
The slide highlights the organizational chart for IT company. It depicts chief executing officer, chief operating officer, legal team, HR head,, chief of operations, chief of finance, chief of corporate compliance and chief of human resource. This is a Organisation Chart IT Software Development Company Profile Structure PDF template with various stages. Focus and dispense information on one stage using this creative set, that comes with editable features. It contains large content boxes to add your information on topics like Financial Officer, Operations Leader, Information Officer. You can also showcase facts, figures, and other relevant content using this PPT layout. Grab it now.
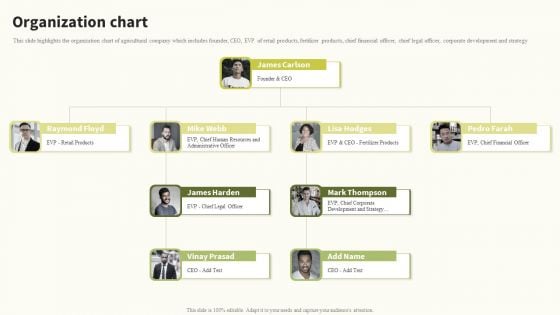
Organization Chart Global Food Products Company Profile Brochure PDF
This slide highlights the organization chart of agricultural company which includes founder, CEO, EVP of retail products, fertilizer products, chief financial officer, chief legal officer, corporate development and strategy. Slidegeeks is one of the best resources for PowerPoint templates. You can download easily and regulate Organization Chart Global Food Products Company Profile Brochure PDF for your personal presentations from our wonderful collection. A few clicks is all it takes to discover and get the most relevant and appropriate templates. Use our Templates to add a unique zing and appeal to your presentation and meetings. All the slides are easy to edit and you can use them even for advertisement purposes.
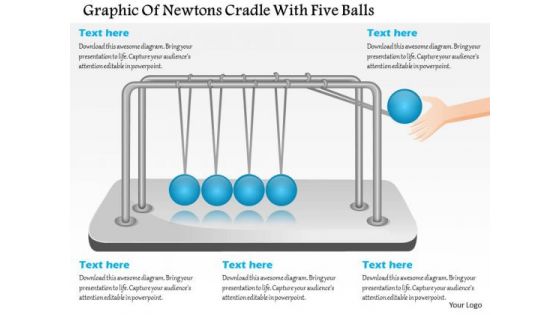
Business Diagram Graphic Of Newtons Cradle With Five Balls Presentation Template
This diagram displays five balls of newtons cradle with five balls. Download this diagram to depict newtons third law of action and reaction. Create professional presentations using this diagram slide.
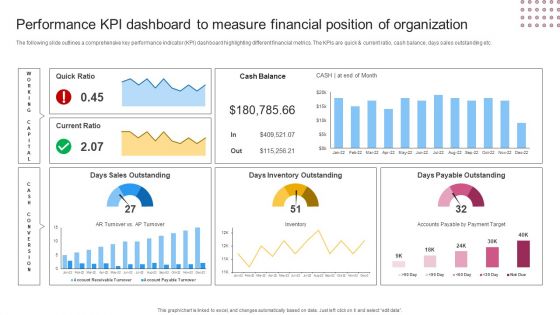
Performance KPI Dashboard To Measure Financial Position Of Organization Pictures PDF
The following slide outlines a comprehensive key performance indicator KPI dashboard highlighting different financial metrics. The KPIs are quick and current ratio, cash balance, days sales outstanding etc. Slidegeeks is here to make your presentations a breeze with Performance KPI Dashboard To Measure Financial Position Of Organization Pictures PDF With our easy to use and customizable templates, you can focus on delivering your ideas rather than worrying about formatting. With a variety of designs to choose from, you are sure to find one that suits your needs. And with animations and unique photos, illustrations, and fonts, you can make your presentation pop. So whether you are giving a sales pitch or presenting to the board, make sure to check out Slidegeeks first.
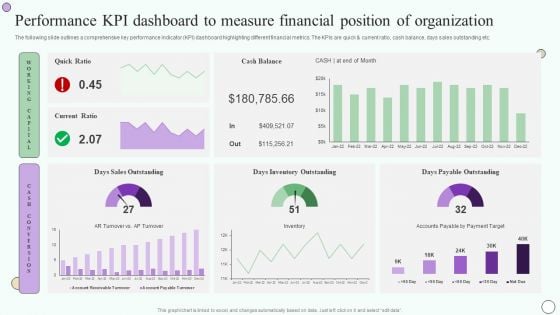
Estimating Business Overall Performance Kpi Dashboard To Measure Financial Position Inspiration PDF
The following slide outlines a comprehensive key performance indicator KPI dashboard highlighting different financial metrics. The KPIs are quick and current ratio, cash balance, days sales outstanding etc. Welcome to our selection of the Estimating Business Overall Performance Kpi Dashboard To Measure Financial Position Inspiration PDF. These are designed to help you showcase your creativity and bring your sphere to life. Planning and Innovation are essential for any business that is just starting out. This collection contains the designs that you need for your everyday presentations. All of our PowerPoints are 100 percent editable, so you can customize them to suit your needs. This multi-purpose template can be used in various situations. Grab these presentation templates today.
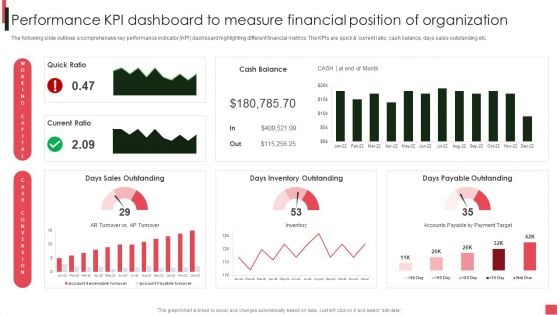
Overview Of Organizational Performance Kpi Dashboard To Measure Financial Position Sample PDF
The following slide outlines a comprehensive key performance indicator KPI dashboard highlighting different financial metrics. The KPIs are quick and current ratio, cash balance, days sales outstanding etc. Welcome to our selection of the Overview Of Organizational Performance Kpi Dashboard To Measure Financial Position Sample PDF. These are designed to help you showcase your creativity and bring your sphere to life. Planning and Innovation are essential for any business that is just starting out. This collection contains the designs that you need for your everyday presentations. All of our PowerPoints are 100 percent editable, so you can customize them to suit your needs. This multi-purpose template can be used in various situations. Grab these presentation templates today.
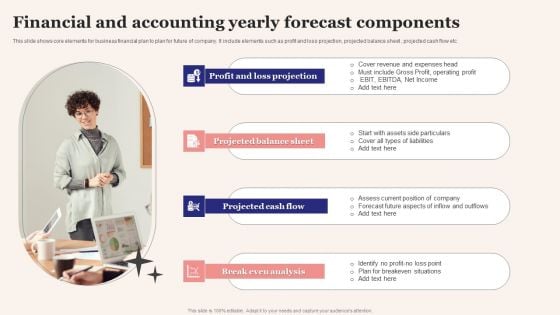
Financial And Accounting Yearly Forecast Components Topics PDF
This slide shows core elements for business financial plan to plan for future of company. It include elements such as profit and loss projection, projected balance sheet , projected cash flow etc. Presenting Financial And Accounting Yearly Forecast Components Topics PDF to dispense important information. This template comprises Four stages. It also presents valuable insights into the topics including Profit And Loss Projection, Projected Balance Sheet, Projected Cash Flow. This is a completely customizable PowerPoint theme that can be put to use immediately. So, download it and address the topic impactfully.
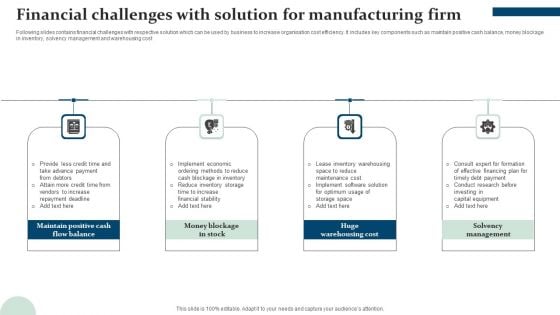
Financial Challenges With Solution For Manufacturing Firm Information PDF
Following slides contains financial challenges with respective solution which can be used by business to increase organisation cost efficiency. It includes key components such as maintain positive cash balance, money blockage in inventory, solvency management and warehousing cost. Presenting Financial Challenges With Solution For Manufacturing Firm Information PDF to dispense important information. This template comprises four stages. It also presents valuable insights into the topics including Maintain Positive, Cash Flow Balance, Money Blockage In Stock, Huge Warehousing Cost, Solvency Management . This is a completely customizable PowerPoint theme that can be put to use immediately. So, download it and address the topic impactfully.
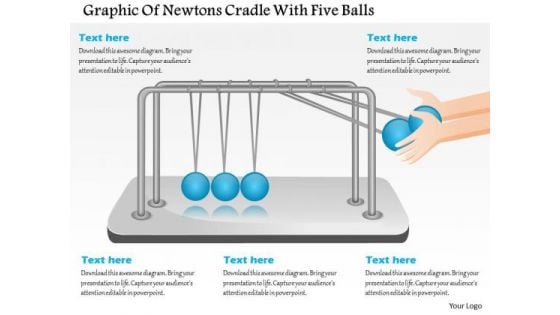
Business Diagram Design Of Newtons Cradle With Five Balls Presentation Template
This diagram displays five balls of newtons cradle with five balls. Download this diagram to depict newtons third law of action and reaction. Present your views using this innovative slide and be assured of leaving a lasting impression.
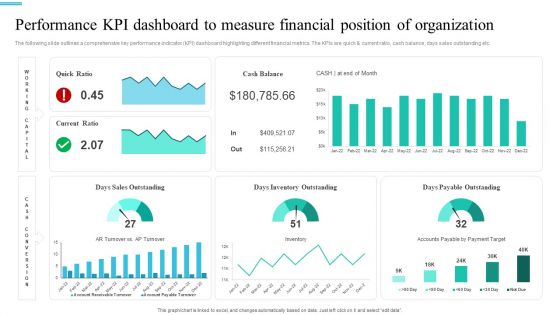
Monetary Planning And Evaluation Guide Performance KPI Dashboard To Measure Financial Position Of Organization Ppt File Slides PDF
The following slide outlines a comprehensive key performance indicator KPI dashboard highlighting different financial metrics. The KPIs are quick and current ratio, cash balance, days sales outstanding etc. The best PPT templates are a great way to save time, energy, and resources. Slidegeeks have 100 percent editable powerpoint slides making them incredibly versatile. With these quality presentation templates, you can create a captivating and memorable presentation by combining visually appealing slides and effectively communicating your message. Download Monetary Planning And Evaluation Guide Performance KPI Dashboard To Measure Financial Position Of Organization Ppt File Slides PDF from Slidegeeks and deliver a wonderful presentation.
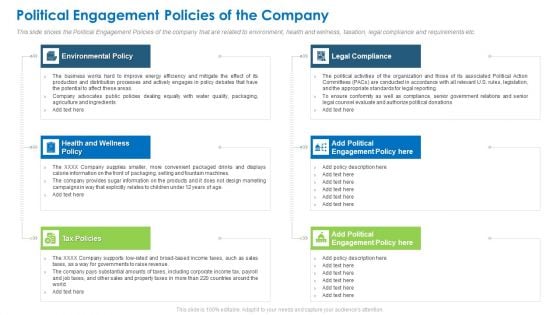
Political Engagement Policies Of The Company Themes PDF
This slide shows the Political Engagement Policies of the company that are related to environment, health and wellness, taxation, legal compliance and requirements etc. Presenting political engagement policies of the company themes pdf to provide visual cues and insights. Share and navigate important information on six stages that need your due attention. This template can be used to pitch topics like environmental policy, legal compliance, health and wellness policy. In addtion, this PPT design contains high resolution images, graphics, etc, that are easily editable and available for immediate download.
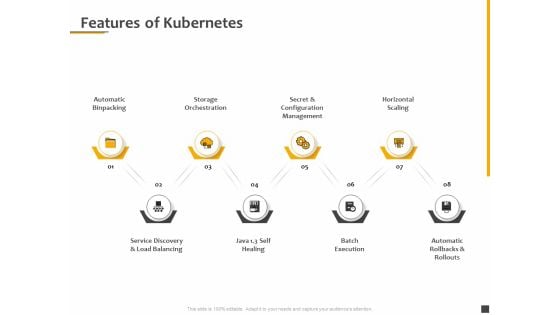
Understanding The Kubernetes Components Through Diagram Features Of Kubernetes Ppt Portfolio Layouts PDF
Presenting this set of slides with name understanding the kubernetes components through diagram features of kubernetes ppt portfolio layouts pdf. This is a eight stage process. The stages in this process are automatic binpacking, storage orchestration, secret and configuration management, horizontal scaling, service discovery and load balancing, self healing, batch execution, automatic rollbacks and rollouts. This is a completely editable PowerPoint presentation and is available for immediate download. Download now and impress your audience.
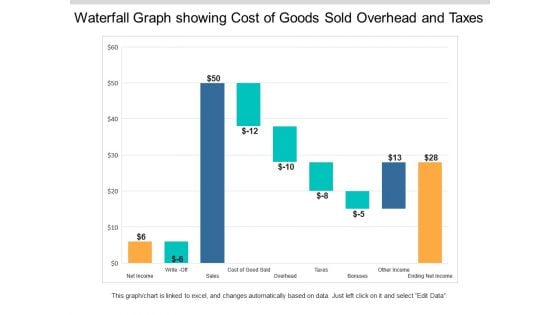
Waterfall Graph Showing Cost Of Goods Sold Overhead And Taxes Ppt PowerPoint Presentation Styles Example Topics
This is a waterfall graph showing cost of goods sold overhead and taxes ppt powerpoint presentation styles example topics. This is a three stage process. The stages in this process are profit and loss, balance sheet, income statement, benefit and loss.

Management For Product Managers Diagram Example Of Ppt
This is a management for product managers diagram example of ppt. This is a ten stage process. The stages in this process are technical debt, infrastructure, security, technology, business, sales, finance, legal, operations support, product manager.
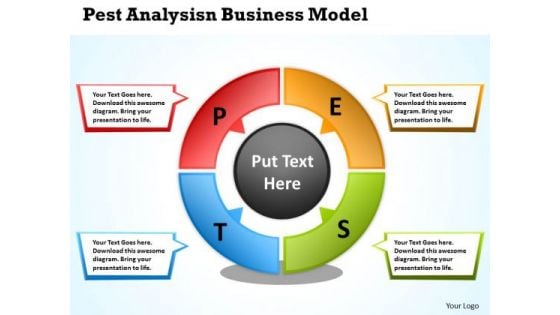
Pest Analysis Business Model Cycle Process Chart PowerPoint Templates
We present our pest analysis business model Cycle Process Chart PowerPoint templates.Download and present our Marketing PowerPoint Templates because customer satisfaction is a mantra of the marketplace. Building a loyal client base is an essential element of your business. Download our Business PowerPoint Templates because this slide represents the tools of the trade. Download and present our Leadership PowerPoint Templates because the mind is always whirring with new ideas. Present our Circle Charts PowerPoint Templates because you can Place them where they need to be. Download and present our Shapes PowerPoint Templates because you can Focus on each one and investigate which one would be the best fit for your needs.Use these PowerPoint slides for presentations relating to Analysis, Analyze, Blackboard, Board, Business, Chalk, Chalkboard, Chart, Component, Concept, Diagram, Direction, Economic, Education, Environmental, Factors, Framework, Graph, Graphics, Illustration, Law, Leadership, Management, Market, Market, Research, Model, Operations, Pest, Political, Position, Potential. The prominent colors used in the PowerPoint template are Red, Yellow, Green. We assure you our pest analysis business model Cycle Process Chart PowerPoint templates are Lush. Customers tell us our Board PowerPoint templates and PPT Slides are incredible easy to use. The feedback we get is that our pest analysis business model Cycle Process Chart PowerPoint templates are Fantastic. We assure you our Blackboard PowerPoint templates and PPT Slides are Perfect. People tell us our pest analysis business model Cycle Process Chart PowerPoint templates are the best it can get when it comes to presenting. We assure you our Chalk PowerPoint templates and PPT Slides look good visually. Assist the audience to comprehend with our Pest Analysis Business Model Cycle Process Chart PowerPoint Templates. They will always be in your debt.
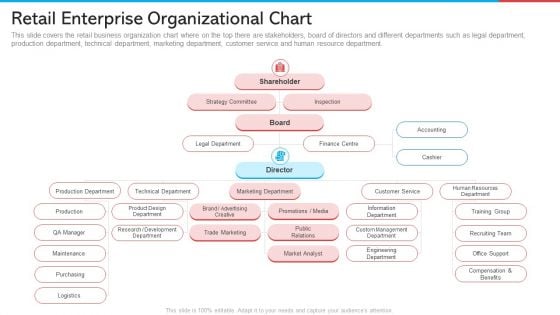
Retail Enterprise Organizational Chart Retail Marketing Demonstration PDF
This slide covers the retail business organization chart where on the top there are stakeholders, board of directors and different departments such as legal department, production department, technical department, marketing department, customer service and human resource department. Deliver an awe inspiring pitch with this creative retail enterprise organizational chart retail marketing demonstration pdf bundle. Topics like marketing department, trade marketing, development, strategy committee, accounting can be discussed with this completely editable template. It is available for immediate download depending on the needs and requirements of the user.

Property And Casualties Insurance Business Profile Organisation Chart Sample PDF
The slide depicts the company hierarchical chart to define the various management positions in organization. It depicts chief executive officer, chief financial officer, executive vice president, sales and marketing director, legal advisor, actuary and IT consultant. It also shows board of directors, risk management committee and office of compliance. Deliver an awe inspiring pitch with this creative Property And Casualties Insurance Business Profile Organisation Chart Sample PDF bundle. Topics like Chief Executive Officer, Executive Of Directors, Board Of Directors can be discussed with this completely editable template. It is available for immediate download depending on the needs and requirements of the user.
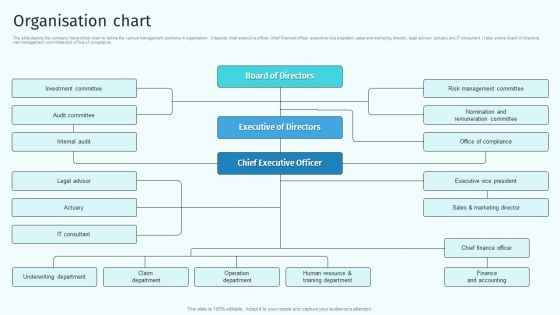
Organisation Chart Health And Property Insurance Company Profile Structure PDF
The slide depicts the company hierarchical chart to define the various management positions in organization. It depicts chief executive officer, chief financial officer, executive vice president, sales and marketing director, legal advisor, actuary and IT consultant. It also shows board of directors, risk management committee and office of compliance. Deliver an awe inspiring pitch with this creative Organisation Chart Health And Property Insurance Company Profile Structure PDF bundle. Topics like Board Of Directors, Executive Of Directors, Chief Executive Officer can be discussed with this completely editable template. It is available for immediate download depending on the needs and requirements of the user.
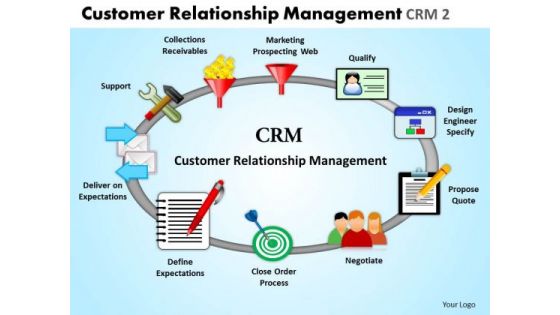
Business Circle Charts PowerPoint Templates Business Customer Relationship Management Ppt Slides
Business Circle Charts PowerPoint Templates Business customer relationship management PPT Slides-This CRM ppt template is amazingly designed to make wonderful CRM PowerPoint Presentations-Business Circle Charts PowerPoint Templates Business customer relationship management PPT Slides-This template can be used for presentations relating to Analysis, Brainstorming, Business, Chart, Concept, Creative, Creativity, Crm, Customer, Diagram, Executive, Flowchart,Hand, Idea, Inspire, Interface, Layout, Legal, Management, Manager, Meeting, Note, Office, Pen, Plan, Presentation, Program, Relationship, Student, Teach, Teamwork, Technical Get the right fabric for your thoughts. Our Business Circle Charts PowerPoint Templates Business Customer Relationship Management Ppt Slides will provide a fitting color.
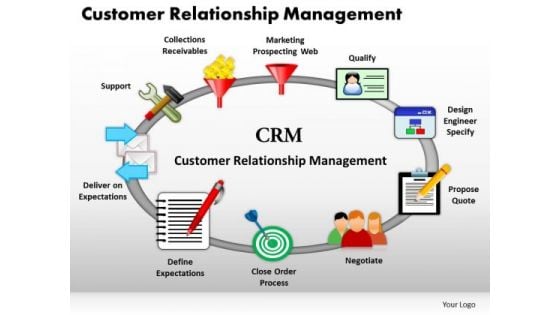
Business Circle Charts PowerPoint Templates Sales Customer Relationship Management Ppt Slides
Business Circle Charts PowerPoint Templates Sales customer relationship management PPT Slides-Use this graphics to discuss the main functions and various models of CRM;. Explain the role of salespeople as relationship developers.-Business Circle Charts PowerPoint Templates Sales customer relationship management PPT Slides-This template can be used for presentations relating to Analysis, Brainstorming, Business, Chart, Concept, Creative, Creativity, Crm, Customer, Diagram, Executive, Flowchart,Hand, Idea, Inspire, Interface, Layout, Legal, Management, Manager, Meeting, Note, Office, Pen, Plan, Presentation, Program, Relationship, Student, Teach, Teamwork, Technical Our Business Circle Charts PowerPoint Templates Sales Customer Relationship Management Ppt Slides aredelightfully crafted. Designed to charm the biggest disbelievers.

Ppt Straight Flow To Present Business PowerPoint Theme Steps Four Templates
PPT straight flow to present business powerpoint theme steps four Templates-Create visually stunning PPT Presentations and define message in a unique and inspiring manner with this PPt slide. Use this to enthuse your colleagues.-PPT straight flow to present business powerpoint theme steps four Templates-achieve, achievement, axis, background, banking, budget, business, chart, company, concept, corporate, director, economic, economy, firm, flow, ftse, goal, graph, green, human, increase, law, line, management, maths, money, national, personel, plan, profit, resources, retail, revenue, shop, statistic, straight, success, target Be a breath of fresh air with our Ppt Straight Flow To Present Business PowerPoint Theme Steps Four Templates. You will come out on top.
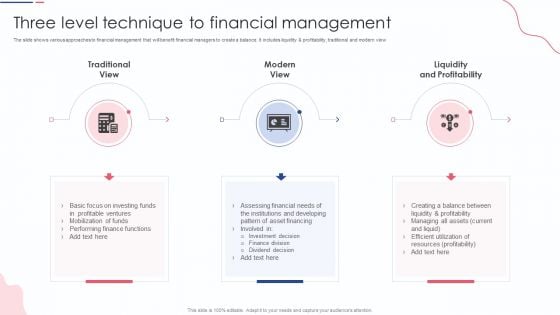
Three Level Technique To Financial Management Guidelines PDF
The slide shows various approaches to financial management that will benefit financial managers to create a balance. It includes liquidity and profitability, traditional and modern view. Presenting Three Level Technique To Financial Management Guidelines PDF to dispense important information. This template comprises three stages. It also presents valuable insights into the topics including Traditional View, Modern View, Liquidity And Profitability. This is a completely customizable PowerPoint theme that can be put to use immediately. So, download it and address the topic impactfully.
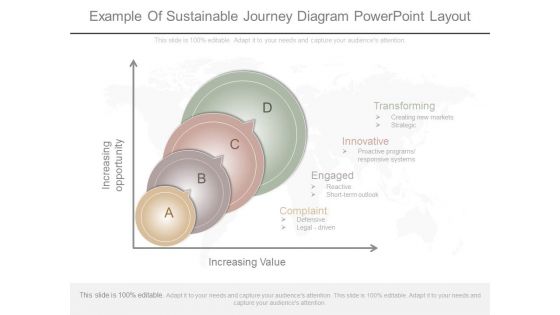
Example Of Sustainable Journey Diagram Powerpoint Layout
This is a example of sustainable journey diagram powerpoint layout. This is a four stage process. The stages in this process are increasing opportunity, transforming, innovative, engaged, complaint, increasing value, creating new markets, strategic, proactive programs responsive systems, reactive, short term outlook, defensive, legal driven.
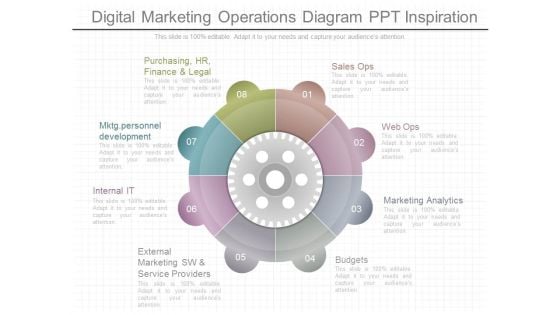
Digital Marketing Operations Diagram Ppt Inspiration
This is a digital marketing operations diagram ppt inspiration. This is a eight stage process. The stages in this process are purchasing, hr, finance and legal, mktg personnel development, sales ops, web ops, marketing analytics, budgets, external marketing sw and service providers.\n\n\n\n
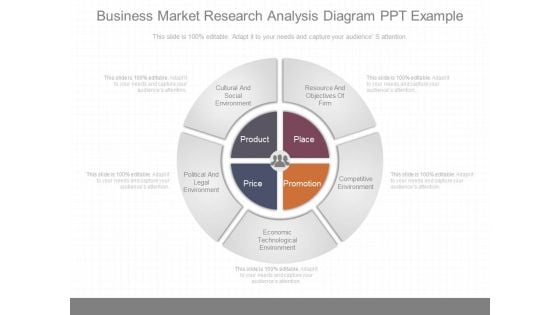
Business Market Research Analysis Diagram Ppt Example
This is a business market research analysis diagram ppt example. This is a five stage process. The stages in this process are cultural and social environment, resource and objectives of firm, competitive environment, economic technological environment, political and legal environment, product, place, price, promotion.
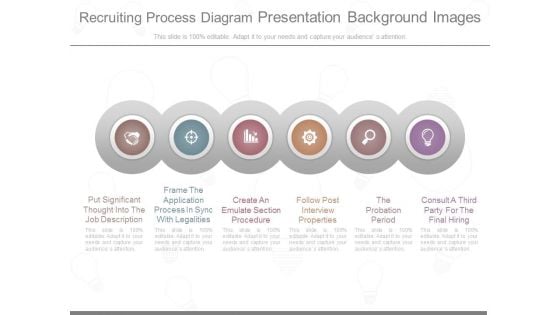
Recruiting Process Diagram Presentation Background Images
This is a recruiting process diagram presentation background images. This is a six stage process. The stages in this process are put significant thought into the job description, frame the application process in sync with legalities, create an emulate section procedure, follow post interview properties, the probation period, consult a third party for the final hiring.
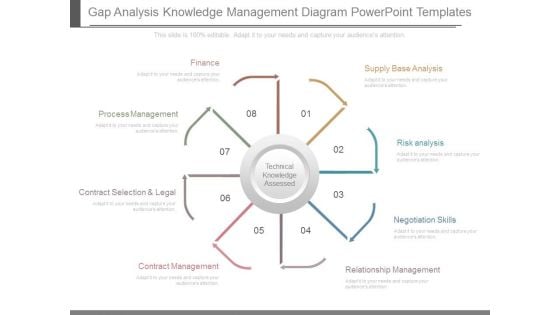
Gap Analysis Knowledge Management Diagram Powerpoint Templates
This is a gap analysis knowledge management diagram powerpoint templates. This is a eight stage process. The stages in this process are technical knowledge assessed, finance, process management, contract selection and legal, contract management, relationship management, negotiation skills, risk analysis, supply base analysis.
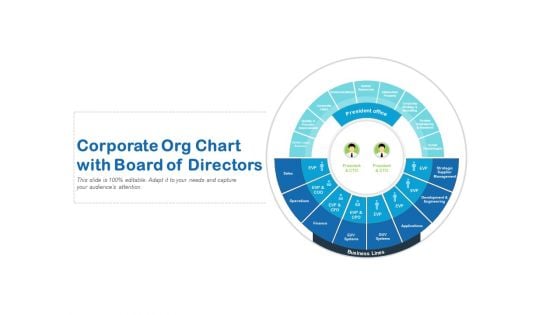
Corporate Org Chart With Board Of Directors Ppt PowerPoint Presentation Pictures Maker
Presenting this set of slides with name corporate org chart with board of directors ppt powerpoint presentation pictures maker. This is a one stage process. The stages in this process are operations, sales, finance, corporate legal, communications, human resources. This is a completely editable PowerPoint presentation and is available for immediate download. Download now and impress your audience.
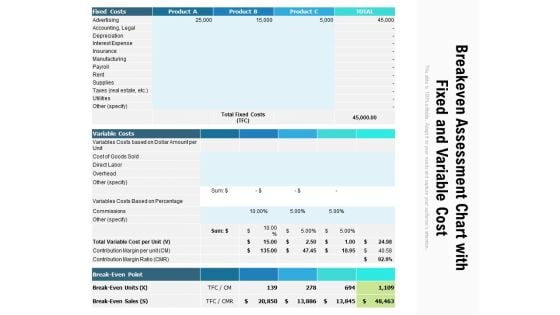
Breakeven Assessment Chart With Fixed And Variable Cost Ppt PowerPoint Presentation File Shapes PDF
Showcasing this set of slides titled breakeven assessment chart with fixed and variable cost ppt powerpoint presentation file shapes pdf. The topics addressed in these templates are advertising, accounting, legal, depreciation, interest expense, insurance. All the content presented in this PPT design is completely editable. Download it and make adjustments in color, background, font etc. as per your unique business setting.
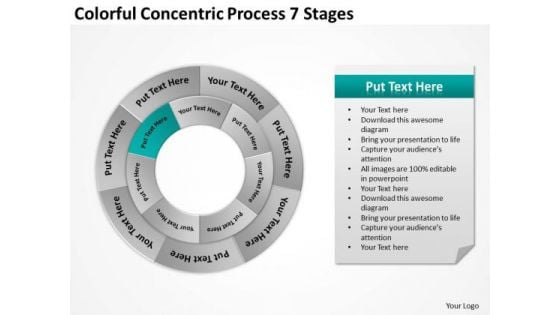
Colorful Concentric Process 7 Stages Business Plan Financial Projections PowerPoint Slides
We present our colorful concentric process 7 stages business plan financial projections PowerPoint Slides.Download our Advertising PowerPoint Templates because Our PowerPoint Templates and Slides will definately Enhance the stature of your presentation. Adorn the beauty of your thoughts with their colourful backgrounds. Download our Shapes PowerPoint Templates because Our PowerPoint Templates and Slides will provide the perfect balance. Your weighty ideas will get the ideal impetus. Present our Business PowerPoint Templates because Our PowerPoint Templates and Slides team portray an attitude of elegance. Personify this quality by using them regularly. Use our Process and Flows PowerPoint Templates because It will Give impetus to the hopes of your colleagues. Our PowerPoint Templates and Slides will aid you in winning their trust. Download our Circle Charts PowerPoint Templates because It will mark the footprints of your journey. Illustrate how they will lead you to your desired destination.Use these PowerPoint slides for presentations relating to Text, Website, Speech, Form, Green, Special, Corporate, Order, Red, Business, Concept, Arrow, Vector, Bright, Symbol, Template, Circle, Match, Usable, Graphic, Process, Old, Element, Different, Idea, Shape, Abstract, Cycle, Creative, Illustration, Piece, Connection, Chart, Strategy, Place, Frame, Web, Solution, Design, Group, Color, Colorful, Empty, Banner, Access, Part, Background, Conceptual, Message. The prominent colors used in the PowerPoint template are Green, Gray, White. At times activity can be at a fever pitch. Be calm,cool and collected with our Colorful Concentric Process 7 Stages Business Plan Financial Projections PowerPoint Slides.
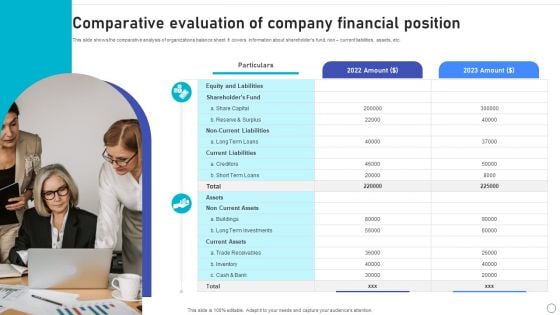
Comparative Evaluation Of Company Financial Position Ideas PDF
This slide shows the comparative analysis of organizations balance sheet. It covers information about shareholders fund, non current liabilities, assets, etc. Presenting Comparative Evaluation Of Company Financial Position Ideas PDF to dispense important information. This template comprises two stages. It also presents valuable insights into the topics including Equity And Labilities, Shareholders Fund, Share Capital. This is a completely customizable PowerPoint theme that can be put to use immediately. So, download it and address the topic impactfully.
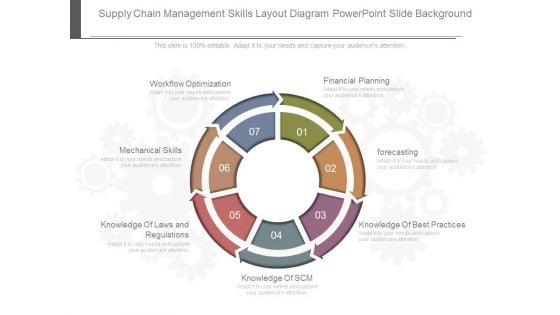
Supply Chain Management Skills Layout Diagram Powerpoint Slides Background
This is a supply chain management skills layout diagram powerpoint slides background. This is a seven stage process. The stages in this process are financial planning, forecasting, knowledge of best practices, knowledge of scm, knowledge of laws and regulations, mechanical skills, workflow optimization.
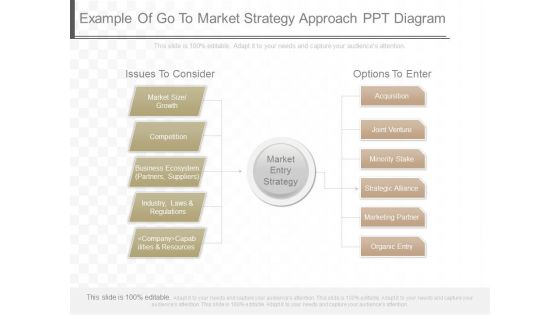
Example Of Go To Market Strategy Approach Ppt Diagram
This is an example of go to market strategy approach ppt diagram. This is a four stage process. The stages in this process are issues to consider, market size growth, competition, business ecosystem partners, suppliers, industry, laws and regulations, company capabilities and resources, market entry strategy, options to enter, acquisition, minority stake, strategic alliance, marketing partner, organic entry.

 Home
Home