Key Performance Indicators
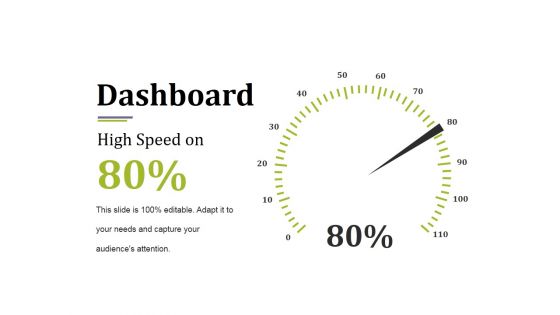
Dashboard Ppt PowerPoint Presentation Show Model
This is a dashboard ppt powerpoint presentation show model. This is a one stage process. The stages in this process are dashboard, business, marketing, strategy, planning.
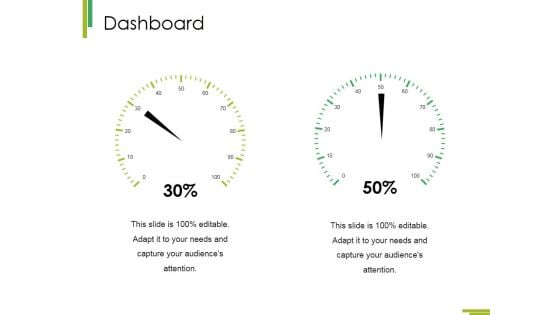
Dashboard Ppt PowerPoint Presentation Show Graphics Design
This is a dashboard ppt powerpoint presentation show graphics design. This is a two stage process. The stages in this process are dashboard, business, marketing, strategy, management.
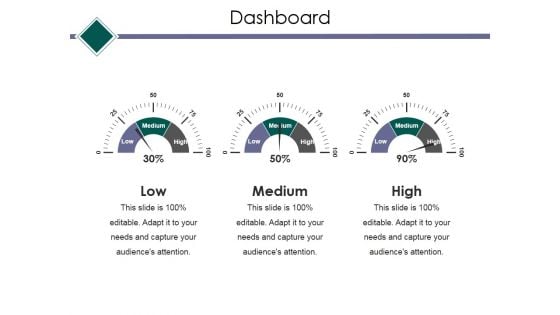
Dashboard Ppt PowerPoint Presentation Ideas Model
This is a dashboard ppt powerpoint presentation ideas model. This is a three stage process. The stages in this process are dashboard, low, medium, high, business.
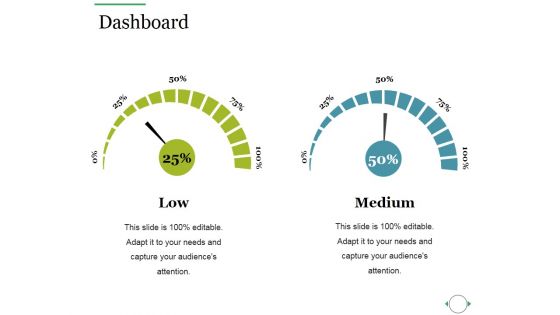
Dashboard Ppt PowerPoint Presentation Summary Model
This is a dashboard ppt powerpoint presentation summary model. This is a two stage process. The stages in this process are dashboard, low, medium.
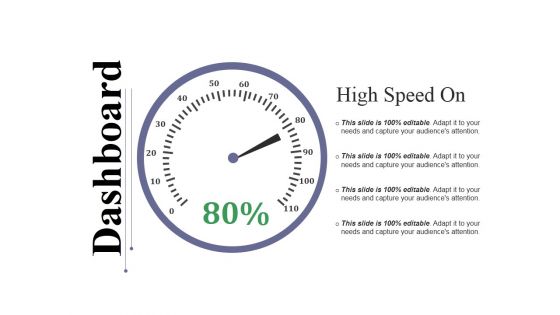
Dashboard Ppt PowerPoint Presentation Styles Inspiration
This is a dashboard ppt powerpoint presentation styles inspiration. This is a one stage process. The stages in this process are dashboard, high, low, medium, business.
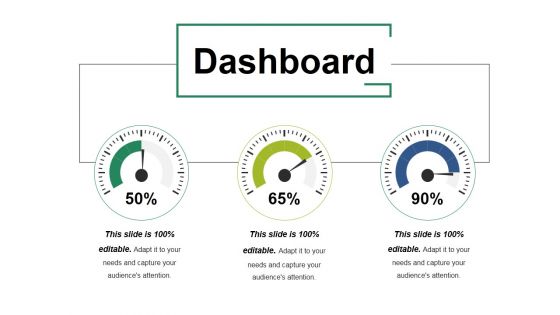
Dashboard Ppt PowerPoint Presentation Pictures Example Introduction
This is a dashboard ppt powerpoint presentation pictures example introduction. This is a three stage process. The stages in this process are low, medium, high, dashboard, measurement.

dashboard ppt powerpoint presentation model images
This is a dashboard ppt powerpoint presentation model images. This is a two stage process. The stages in this process are dashboard, low, high, speed, business.
Dashboard Ppt PowerPoint Presentation Icon Background
This is a dashboard ppt powerpoint presentation icon background. This is a one stage process. The stages in this process are dashboard, measurement, marketing, strategy, business.
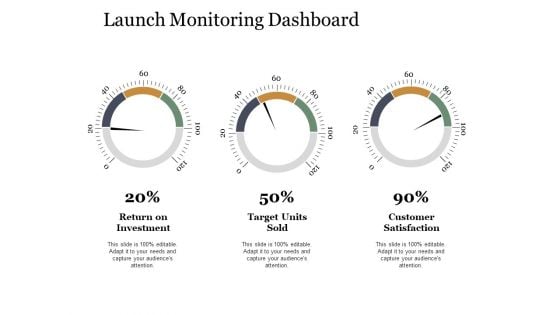
Launch Monitoring Dashboard Ppt PowerPoint Presentation Templates
This is a launch monitoring dashboard ppt powerpoint presentation templates. This is a three stage process. The stages in this process are Low, Medium, High, Dashboard, Measurement.
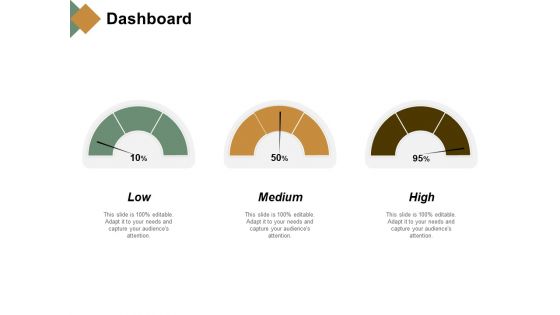
Dashboard Medium Ppt PowerPoint Presentation Gallery Good
This is a dashboard medium ppt powerpoint presentation gallery good. This is a three stage process. The stages in this process are dashboard, business, management, planning, strategy.
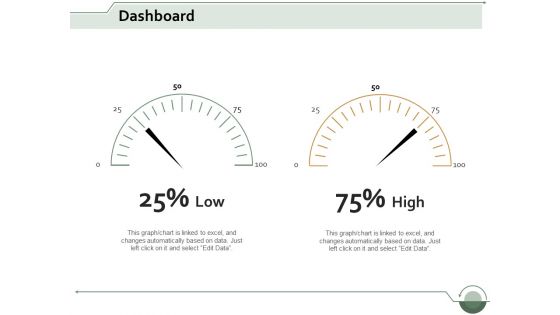
Dashboard Measure Ppt Powerpoint Presentation File Inspiration
This is a dashboard measure ppt powerpoint presentation file inspiration. This is a two stage process. The stages in this process are dashboard, business, marketing, management, planning.
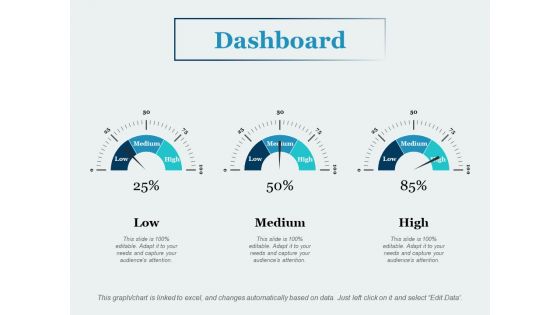
Dashboard Medium Ppt PowerPoint Presentation Model Guide
This is a dashboard medium ppt powerpoint presentation model guide. This is a three stage process. The stages in this process are dashboard, business, management, marketing.
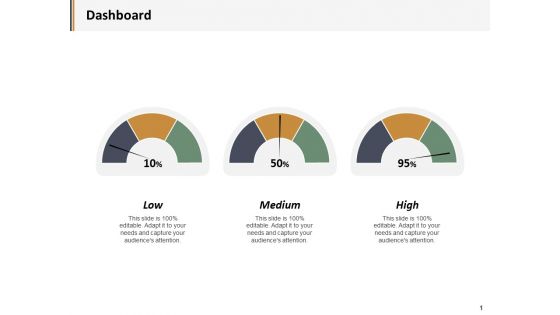
Dashboard Medium Ppt PowerPoint Presentation Gallery Templates
This is a dashboard medium ppt powerpoint presentation gallery templates. This is a three stage process. The stages in this process are business, management, marketing, dashboard.
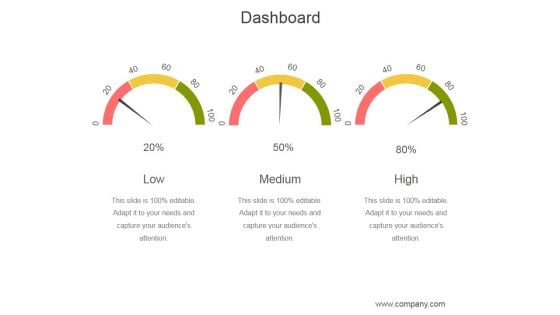
Dashboard Ppt PowerPoint Presentation Examples
This is a dashboard ppt powerpoint presentation examples. This is a three stage process. The stages in this process are low, medium, high.
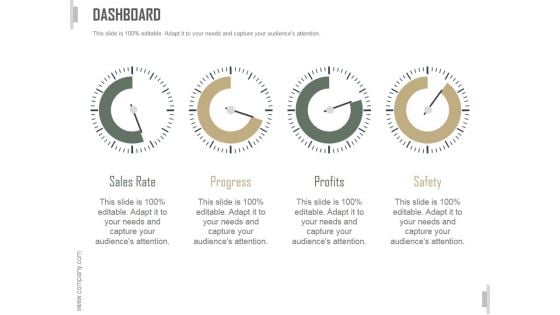
Dashboard Ppt PowerPoint Presentation Files
This is a dashboard ppt powerpoint presentation files. This is a four stage process. The stages in this process are sales rate, progress, profits, safety.
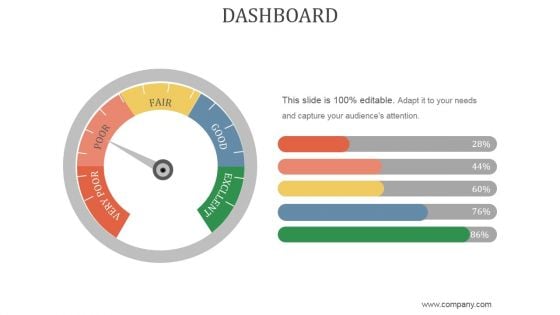
Dashboard Ppt PowerPoint Presentation Shapes
This is a dashboard ppt powerpoint presentation shapes. This is a five stage process. The stages in this process are very poor, poor, fair, good, excllent.
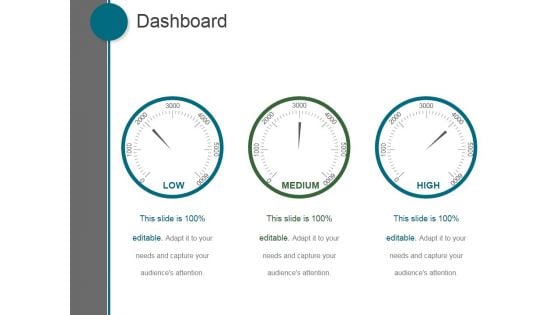
Dashboard Ppt PowerPoint Presentation Gallery
This is a dashboard ppt powerpoint presentation gallery. This is a three stage process. The stages in this process are low, medium, high.
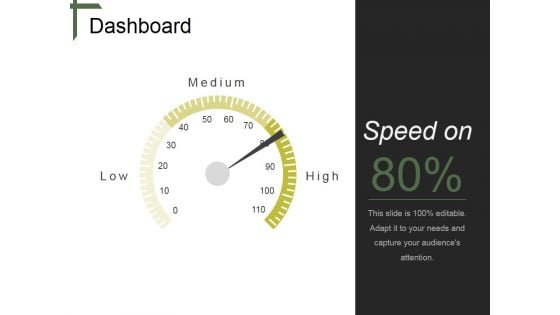
Dashboard Ppt PowerPoint Presentation Outline
This is a dashboard ppt powerpoint presentation outline. This is a one stage process. The stages in this process are medium, low, high.
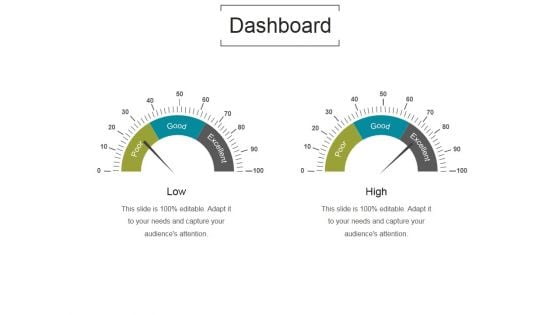
Dashboard Ppt PowerPoint Presentation Themes
This is a dashboard ppt powerpoint presentation themes. This is a two stage process. The stages in this process are low, high, poor, good, excellent.
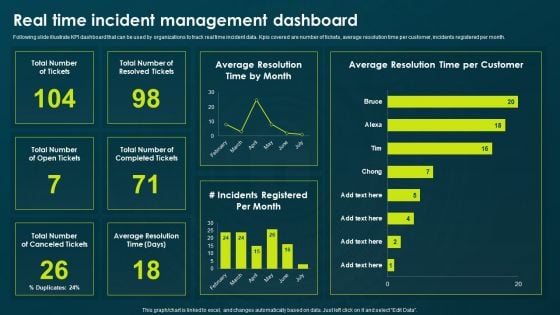
IT Threats Response Playbook Real Time Incident Management Dashboard Formats PDF
Following slide illustrate KPI dashboard that can be used by organizations to track real time incident data. Kpis covered are number of tickets, average resolution time per customer, incidents registered per month. Presenting IT Threats Response Playbook Real Time Incident Management Dashboard Formats PDF to provide visual cues and insights. Share and navigate important information on four stages that need your due attention. This template can be used to pitch topics like Resolved Tickets, Average Resolution, Incidents Registered. In addtion, this PPT design contains high resolution images, graphics, etc, that are easily editable and available for immediate download.
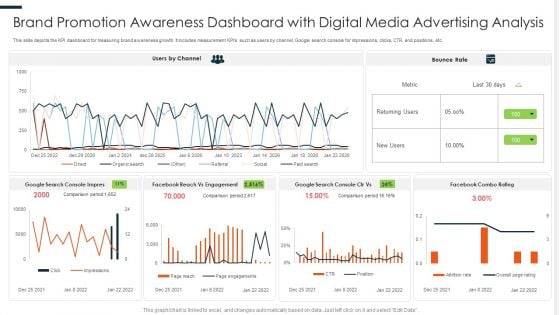
Brand Promotion Awareness Dashboard With Digital Media Advertising Analysis Ppt PowerPoint Presentation Design Ideas PDF
This slide depicts the KPI dashboard for measuring brand awareness growth. It includes measurement KPIs such as users by channel, Google search console for impressions, clicks, CTR, and positions, etc. Pitch your topic with ease and precision using this Brand Promotion Awareness Dashboard With Digital Media Advertising Analysis Ppt PowerPoint Presentation Design Ideas PDF. This layout presents information on Console Impress, Reach Engagement, Combo Rating. It is also available for immediate download and adjustment. So, changes can be made in the color, design, graphics or any other component to create a unique layout.
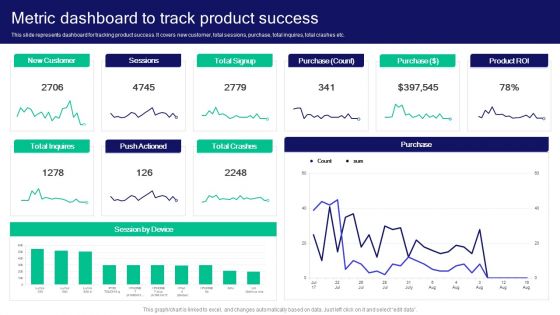
Strategies For Effective Product Metric Dashboard To Track Product Success Elements PDF
This slide represents dashboard for tracking product success. It covers new customer, total sessions, purchase, total inquires, total crashes etc. Explore a selection of the finest Strategies For Effective Product Metric Dashboard To Track Product Success Elements PDF here. With a plethora of professionally designed and pre-made slide templates, you can quickly and easily find the right one for your upcoming presentation. You can use our Strategies For Effective Product Metric Dashboard To Track Product Success Elements PDF to effectively convey your message to a wider audience. Slidegeeks has done a lot of research before preparing these presentation templates. The content can be personalized and the slides are highly editable. Grab templates today from Slidegeeks.
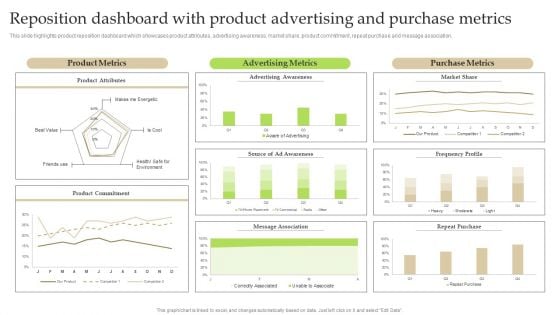
Reposition Dashboard With Product Advertising And Purchase Metrics Ppt PowerPoint Presentation File Show PDF
This slide highlights product reposition dashboard which showcases product attributes, advertising awareness, market share, product commitment, repeat purchase and message association. Formulating a presentation can take up a lot of effort and time, so the content and message should always be the primary focus. The visuals of the PowerPoint can enhance the presenters message, so our Reposition Dashboard With Product Advertising And Purchase Metrics Ppt PowerPoint Presentation File Show PDF was created to help save time. Instead of worrying about the design, the presenter can concentrate on the message while our designers work on creating the ideal templates for whatever situation is needed. Slidegeeks has experts for everything from amazing designs to valuable content, we have put everything into Reposition Dashboard With Product Advertising And Purchase Metrics Ppt PowerPoint Presentation File Show PDF
Customer Relationship Management Software CRM Dashboard For Tracking Sales Pipeline Background PDF
This slide covers the CRM KPI dashboard for monitoring lead status in the sales funnel. It includes metrics such as open pipeline value, open pipeline by product package, pipeline value forecast, etc. Deliver and pitch your topic in the best possible manner with this Customer Relationship Management Software CRM Dashboard For Tracking Sales Pipeline Background PDF. Use them to share invaluable insights on Product Package, Pipeline Value, Value Forecast and impress your audience. This template can be altered and modified as per your expectations. So, grab it now.
CRM System Implementation Stages CRM Dashboard For Tracking Sales Pipeline Background PDF
This slide covers the CRM KPI dashboard for monitoring lead status in the sales funnel. It includes metrics such as open pipeline value, open pipeline by product package, pipeline value forecast, etc. Deliver and pitch your topic in the best possible manner with this CRM System Implementation Stages CRM Dashboard For Tracking Sales Pipeline Background PDF. Use them to share invaluable insights on Pipeline Value, Value Forecast, Sales Opportunities and impress your audience. This template can be altered and modified as per your expectations. So, grab it now.
CRM System Deployment Plan CRM Dashboard For Tracking Sales Pipeline Pictures PDF
This slide covers the CRM KPI dashboard for monitoring lead status in the sales funnel. It includes metrics such as open pipeline value, open pipeline by product package, pipeline value forecast, etc. Deliver an awe inspiring pitch with this creative CRM System Deployment Plan CRM Dashboard For Tracking Sales Pipeline Pictures PDF bundle. Topics like Pipeline Value Forecast, Open Pipeline Value, Branding can be discussed with this completely editable template. It is available for immediate download depending on the needs and requirements of the user.
Client Retargeting Strategy Dashboard For Tracking Impact Of Customer Retargeting Professional PDF
This slide covers a KPI dashboard for analyzing consumer retargeting advertisements. It includes metrics such as total clicks before retargeting, after retargeting, top references by share, and top retargeting regions. Take your projects to the next level with our ultimate collection of Client Retargeting Strategy Dashboard For Tracking Impact Of Customer Retargeting Professional PDF. Slidegeeks has designed a range of layouts that are perfect for representing task or activity duration, keeping track of all your deadlines at a glance. Tailor these designs to your exact needs and give them a truly corporate look with your own brand colors theyll make your projects stand out from the rest.
Ultimate Guide To Improve Customer Support And Services Dashboard For Tracking Aftersales Customer Sample PDF
This slide covers the KPI dashboard for ticket tracking. It includes metrics such as tickets by month, service level, and details of customer service department agents. If your project calls for a presentation, then Slidegeeks is your go to partner because we have professionally designed, easy to edit templates that are perfect for any presentation. After downloading, you can easily edit Ultimate Guide To Improve Customer Support And Services Dashboard For Tracking Aftersales Customer Sample PDF and make the changes accordingly. You can rearrange slides or fill them with different images. Check out all the handy templates
Effective Lead Generation For Higher Conversion Rates Dashboard For Tracking Lead Generation And Conversion Structure PDF
This slide covers the KPI dashboard for analyzing metrics such as cost per lead, cost per conversion, average time conversion, conversion rate, monthly new leads, and qualified leads per month. Boost your pitch with our creative Effective Lead Generation For Higher Conversion Rates Dashboard For Tracking Lead Generation And Conversion Structure PDF. Deliver an awe-inspiring pitch that will mesmerize everyone. Using these presentation templates you will surely catch everyones attention. You can browse the ppts collection on our website. We have researchers who are experts at creating the right content for the templates. So you do not have to invest time in any additional work. Just grab the template now and use them.
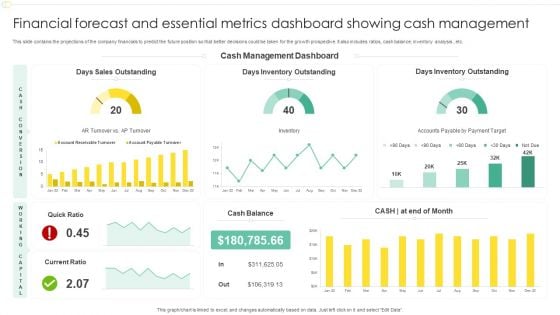
Financial Forecast And Essential Metrics Dashboard Showing Cash Management Designs PDF
This slide contains the projections of the company financials to predict the future position so that better decisions could be taken for the growth prospective. It also includes ratios, cash balance, inventory analysis , etc. Showcasing this set of slides titled Financial Forecast And Essential Metrics Dashboard Showing Cash Management Designs PDF. The topics addressed in these templates are Days Sales Outstanding, Cash Management Dashboard, Days Inventory Outstanding. All the content presented in this PPT design is completely editable. Download it and make adjustments in color, background, font etc. as per your unique business setting.
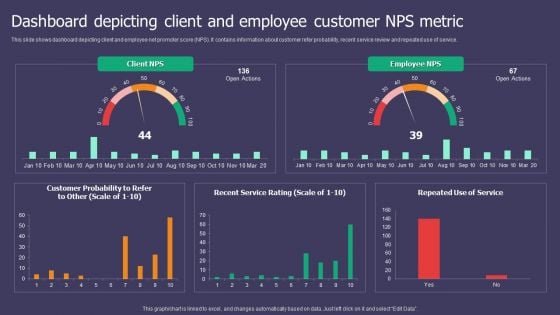
Dashboard Depicting Client And Employee Customer NPS Metric Ppt Gallery Deck PDF
This slide shows dashboard depicting client and employee net promoter score NPS. It contains information about customer refer probability, recent service review and repeated use of service. Showcasing this set of slides titled Dashboard Depicting Client And Employee Customer NPS Metric Ppt Gallery Deck PDF. The topics addressed in these templates are Client NPS, Employee NPS, Customer Probability. All the content presented in this PPT design is completely editable. Download it and make adjustments in color, background, font etc. as per your unique business setting.
Finance Metrics Dashboard Illustrating Gross And Operating Profit Margin Icons PDF
This graph or chart is linked to excel, and changes automatically based on data. Just left click on it and select edit data. Showcasing this set of slides titled Finance Metrics Dashboard Illustrating Gross And Operating Profit Margin Icons PDF. The topics addressed in these templates are Gross Profit Margin, Operating Profit Margin, Net Profit Margin. All the content presented in this PPT design is completely editable. Download it and make adjustments in color, background, font etc. as per your unique business setting.
CRM Dashboard For Tracking Sales Pipeline Brochure PDF
This slide covers the CRM KPI dashboard for monitoring lead status in the sales funnel. It includes metrics such as open pipeline value, open pipeline by product package, pipeline value forecast, etc. Crafting an eye catching presentation has never been more straightforward. Let your presentation shine with this tasteful yet straightforward CRM Dashboard For Tracking Sales Pipeline Brochure PDF template. It offers a minimalistic and classy look that is great for making a statement. The colors have been employed intelligently to add a bit of playfulness while still remaining professional. Construct the ideal CRM Dashboard For Tracking Sales Pipeline Brochure PDF that effortlessly grabs the attention of your audience Begin now and be certain to wow your customers.
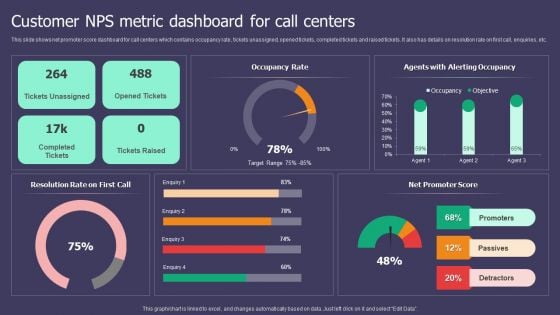
Customer NPS Metric Dashboard For Call Centers Ppt Inspiration Smartart PDF
This slide shows net promoter score dashboard for call centers which contains occupancy rate, tickets unassigned, opened tickets, completed tickets and raised tickets. It also has details on resolution rate on first call, enquiries, etc. Pitch your topic with ease and precision using this Customer NPS Metric Dashboard For Call Centers Ppt Inspiration Smartart PDF. This layout presents information on Occupancy Rate, Resolution Rate, Net Promoter Score. It is also available for immediate download and adjustment. So, changes can be made in the color, design, graphics or any other component to create a unique layout.
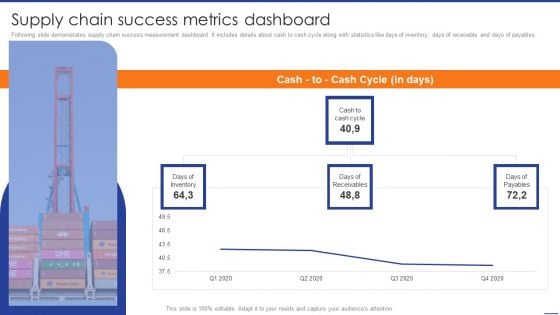
Digital Transformation Of Supply Supply Chain Success Metrics Dashboard Graphics PDF
Following slide demonstrates supply chain success measurement dashboard. It includes details about cash to cash cycle along with statistics like days of inventory, days of receivable and days of payables. If your project calls for a presentation, then Slidegeeks is your go-to partner because we have professionally designed, easy-to-edit templates that are perfect for any presentation. After downloading, you can easily edit Digital Transformation Of Supply Supply Chain Success Metrics Dashboard Graphics PDF and make the changes accordingly. You can rearrange slides or fill them with different images. Check out all the handy templates.
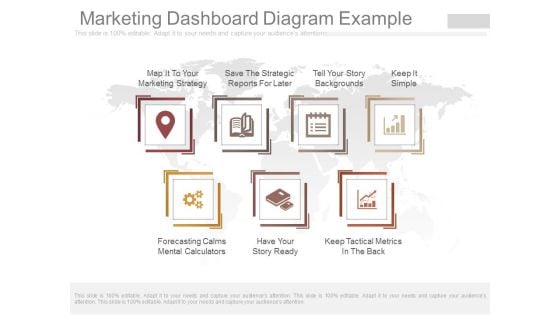
Marketing Dashboard Diagram Example
This is a marketing dashboard diagram example. This is a seven stage process. The stages in this process are map it to your marketing strategy, save the strategic reports for later, tell your story backgrounds, keep it simple, forecasting calms mental calculators, have your story ready, keep tactical metrics in the back.
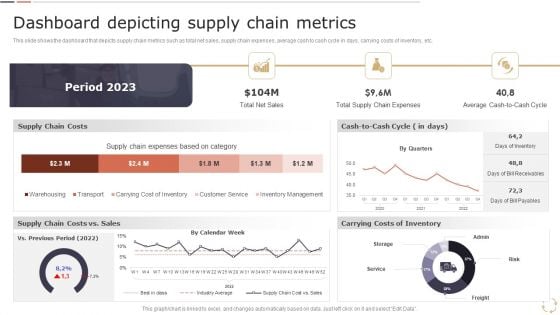
Optimizing Logistics Models To Enhance Supply Chain Management Dashboard Depicting Supply Chain Metrics Download PDF
This slide shows the dashboard that depicts supply chain metrics such as total net sales, supply chain expenses, average cash to cash cycle in days, carrying costs of inventory, etc. Coming up with a presentation necessitates that the majority of the effort goes into the content and the message you intend to convey. The visuals of a PowerPoint presentation can only be effective if it supplements and supports the story that is being told. Keeping this in mind our experts created Optimizing Logistics Models To Enhance Supply Chain Management Dashboard Depicting Supply Chain Metrics Download PDF to reduce the time that goes into designing the presentation. This way, you can concentrate on the message while our designers take care of providing you with the right template for the situation.
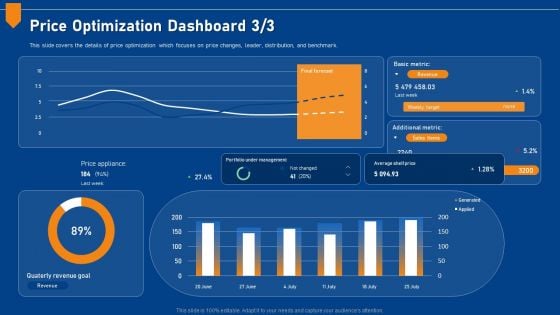
Evaluating Price Efficiency In Organization Price Optimization Dashboard Metric Designs PDF
This slide covers the details of price optimization which focuses on price changes, leader, distribution, and benchmark. Deliver and pitch your topic in the best possible manner with this evaluating price efficiency in organization price optimization dashboard metric designs pdf. Use them to share invaluable insights on portfolio, management, price, revenue, target and impress your audience. This template can be altered and modified as per your expectations. So, grab it now.
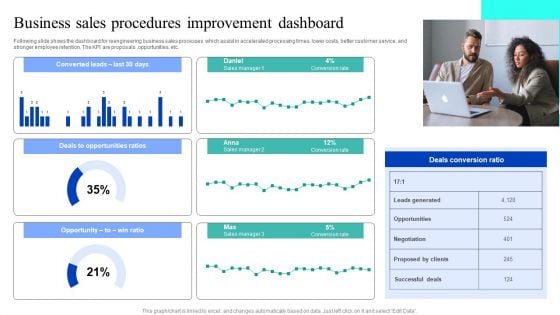
Business Sales Procedures Improvement Dashboard Designs PDF
Following slide shows the dashboard for reengineering business sales processes which assist in accelerated processing times, lower costs, better customer service, and stronger employee retention. The KPI are proposals ,opportunities, etc. Pitch your topic with ease and precision using this Business Sales Procedures Improvement Dashboard Designs PDF. This layout presents information on Deals Opportunities Ratios, Opportunity, Deals Conversion Ratio. It is also available for immediate download and adjustment. So, changes can be made in the color, design, graphics or any other component to create a unique layout.
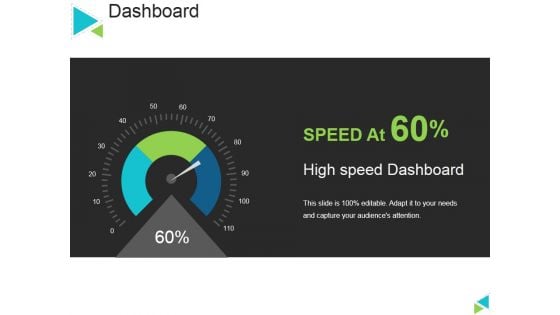
Dashboard Ppt PowerPoint Presentation Model Graphics Template
This is a dashboard ppt powerpoint presentation model graphics template. This is a one stage process. The stages in this process are high speed dashboard, speed, technology, business, marketing.

Dashboard Ppt PowerPoint Presentation Infographic Template Example 2015
This is a dashboard ppt powerpoint presentation infographic template example 2015. This is a two stage process. The stages in this process are dashboard, business, marketing, technology, process.
Dashboard High Speed Ppt PowerPoint Presentation Icon Background Designs
This is a dashboard high speed ppt powerpoint presentation information. This is a one stage process. The stages in this process are dashboard, business, marketing, management, planning.

Property Management Dashboard Ppt PowerPoint Presentation Outline Infographics
This is a property management dashboard ppt powerpoint presentation outline infographics. This is a five stage process. The stages in this process are dashboard, management, marketing, business.
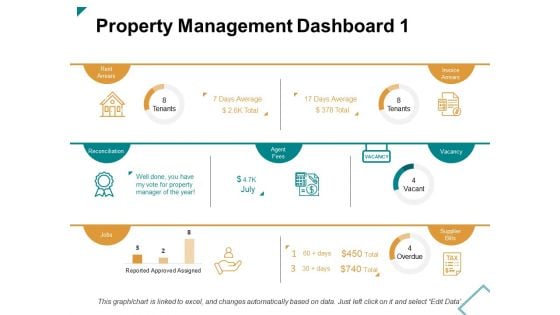
Property Management Dashboard Jobs Ppt PowerPoint Presentation Layouts Brochure
This is a property management dashboard jobs ppt powerpoint presentation layouts brochure. This is a three stage process. The stages in this process are dashboard, management, marketing, business.

Property Management Dashboard Ppt PowerPoint Presentation Gallery Infographics
This is a property management dashboard ppt powerpoint presentation gallery infographics. This is a two stage process. The stages in this process are dashboard, management, marketing, business.
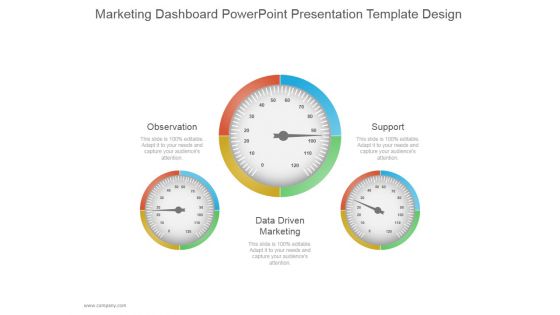
Marketing Dashboard Ppt PowerPoint Presentation Slides
This is a marketing dashboard ppt powerpoint presentation slides. This is a three stage process. The stages in this process are observation, data driven marketing, support.
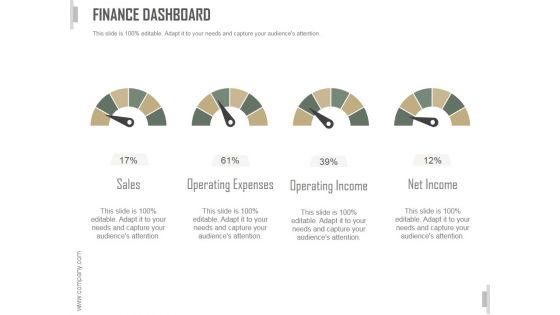
Finance Dashboard Ppt PowerPoint Presentation Clipart
This is a finance dashboard ppt powerpoint presentation clipart. This is a four stage process. The stages in this process are sales, operating expenses, operating income, net income.
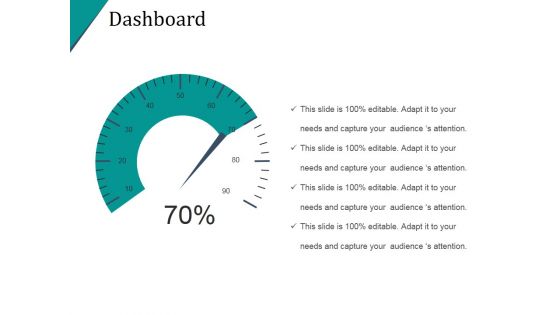
Dashboard Template Ppt PowerPoint Presentation Background Designs
This is a dashboard template ppt powerpoint presentation background designs. This is a three stage process. The stages in this process are low, medium, high.
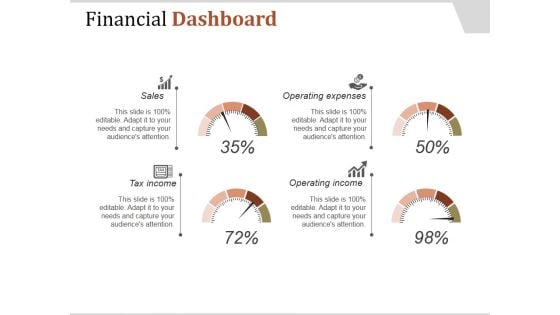
Financial Dashboard Ppt PowerPoint Presentation Influencers
This is a financial dashboard ppt powerpoint presentation influencers. This is a four stage process. The stages in this process are sales, tax income, operating income, operating expenses.
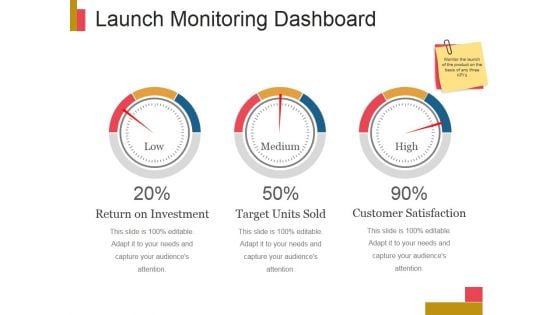
Launch Monitoring Dashboard Ppt PowerPoint Presentation Layout
This is a launch monitoring dashboard ppt powerpoint presentation layout. This is a three stage process. The stages in this process are low, medium, high.
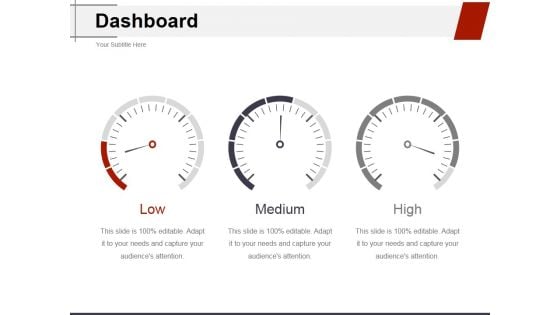
Dashboard Ppt PowerPoint Presentation Outline Model
This is a dashboard ppt powerpoint presentation outline model. This is a three stage process. The stages in this process are medium, high, low.
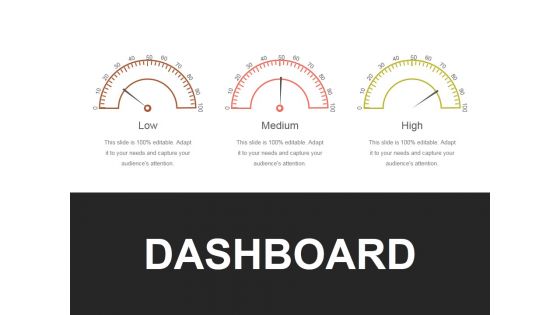
Dashboard Ppt PowerPoint Presentation Show Inspiration
This is a dashboard ppt powerpoint presentation show inspiration. This is a three stage process. The stages in this process are low, medium, high.

Dashboard Ppt PowerPoint Presentation Gallery Clipart Images
This is a dashboard ppt powerpoint presentation gallery clipart images. This is a three stage process. The stages in this process are low, medium, high.
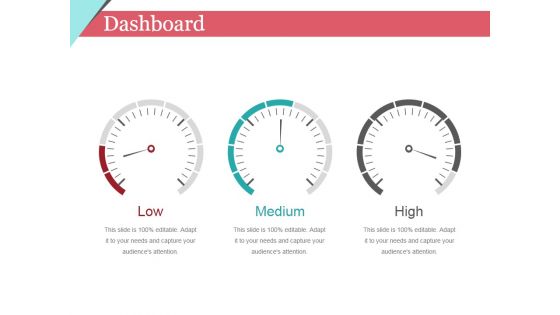
Dashboard Ppt PowerPoint Presentation Summary Template
This is a dashboard ppt powerpoint presentation summary template. This is a three stage process. The stages in this process are low, medium, high.

Dashboard Ppt PowerPoint Presentation Model Infographic Template
This is a dashboard ppt powerpoint presentation model infographic template. This is a three stage process. The stages in this process are low, medium, high.
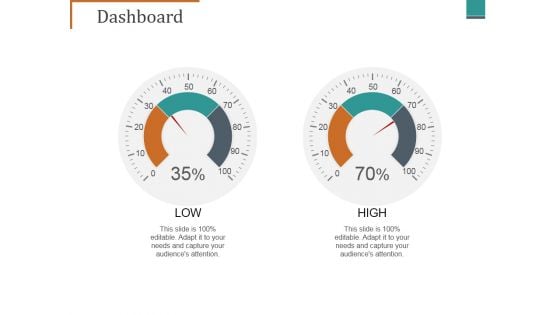
Dashboard Ppt PowerPoint Presentation Ideas Graphics Tutorials
This is a dashboard ppt powerpoint presentation ideas graphics tutorials. This is a two stage process. The stages in this process are low, high.
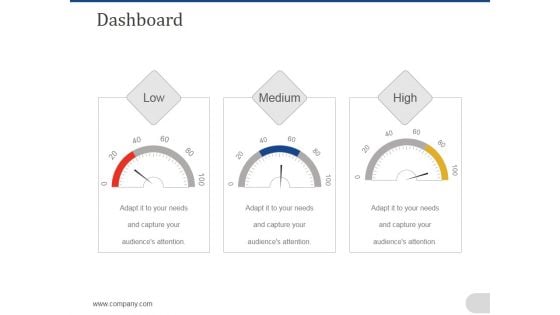
Dashboard Ppt PowerPoint Presentation Show Background Designs
This is a dashboard ppt powerpoint presentation show background designs. This is a three stage process. The stages in this process are low, medium, high.

Dashboard Ppt PowerPoint Presentation File Layout
This is a dashboard ppt powerpoint presentation file layout. This is a three stage process. The stages in this process are low, medium, high.
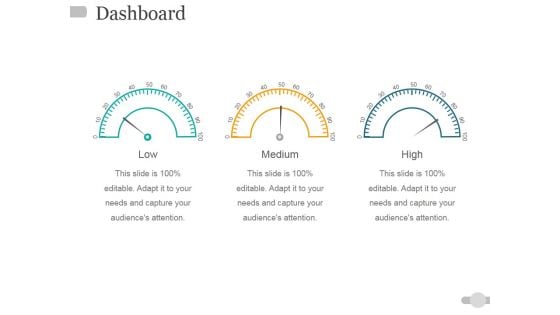
Dashboard Ppt PowerPoint Presentation Show Design Templates
This is a dashboard ppt powerpoint presentation show design templates. This is a three stage process. The stages in this process are low, medium, high.

Dashboard Ppt PowerPoint Presentation Infographics Graphics
This is a dashboard ppt powerpoint presentation infographics graphics. This is a three stage process. The stages in this process are low, medium, high.


 Continue with Email

 Home
Home


