Key Performance Indicators
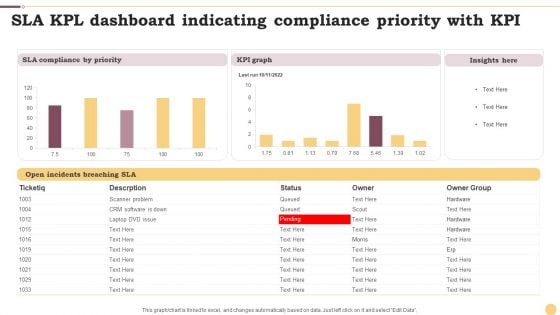
SLA KPL Dashboard Indicating Compliance Priority With KPI Ppt File Format PDF
This graph or chart is linked to excel, and changes automatically based on data. Just left click on it and select Edit Data. Showcasing this set of slides titled SLA KPL Dashboard Indicating Compliance Priority With KPI Ppt File Format PDF. The topics addressed in these templates are KPI Graph, Insights Here, SLA Compliance Priority. All the content presented in this PPT design is completely editable. Download it and make adjustments in color, background, font etc. as per your unique business setting.
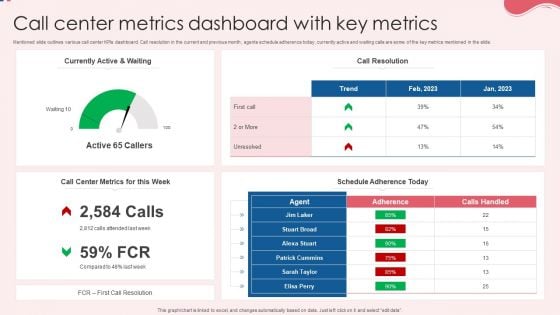
Call Center Metrics Dashboard With Key Metrics Information PDF
Mentioned slide outlines various call center KPIs dashboard. Call resolution in the current and previous month, agents schedule adherence today, currently active and waiting calls are some of the key metrics mentioned in the slide. Showcasing this set of slides titled Call Center Metrics Dashboard With Key Metrics Information PDF. The topics addressed in these templates are Currently Active, Call Resolution, Key Metrics. All the content presented in this PPT design is completely editable. Download it and make adjustments in color, background, font etc. as per your unique business setting.
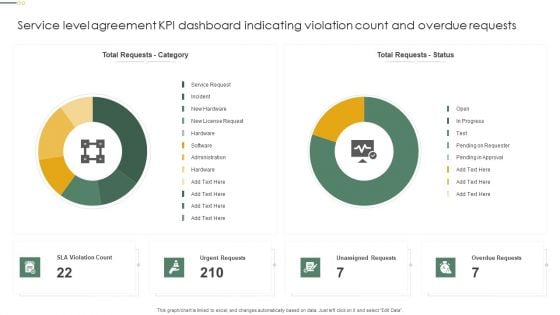
Service Level Agreement KPI Dashboard Indicating Violation Count And Overdue Requests Diagrams PDF
This graph or chart is linked to excel, and changes automatically based on data. Just left click on it and select Edit Data. Showcasing this set of slides titled Service Level Agreement KPI Dashboard Indicating Violation Count And Overdue Requests Diagrams PDF. The topics addressed in these templates are Total Requests Category, Total Requests Status, Urgent Requests. All the content presented in this PPT design is completely editable. Download it and make adjustments in color, background, font etc. as per your unique business setting.

Fuel Gauge Indicating Empty And Full Levels Ppt PowerPoint Presentation Portfolio Clipart PDF
Presenting fuel gauge indicating empty and full levels ppt powerpoint presentation portfolio clipart pdf to dispense important information. This template comprises one stages. It also presents valuable insights into the topics including fuel gauge indicating empty and full levels. This is a completely customizable PowerPoint theme that can be put to use immediately. So, download it and address the topic impactfully.
Customer Effort Score Indicator Icon To Measure Required Actions Ppt File Sample PDF
Persuade your audience using this Customer Effort Score Indicator Icon To Measure Required Actions Ppt File Sample PDF. This PPT design covers four stages, thus making it a great tool to use. It also caters to a variety of topics including Customer, Effort Score Indicator, Icon To Measure, Required Actions. Download this PPT design now to present a convincing pitch that not only emphasizes the topic but also showcases your presentation skills.
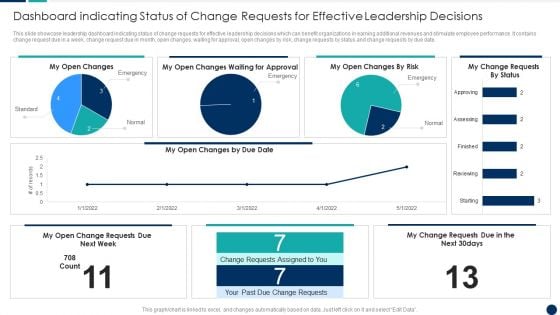
Dashboard Indicating Status Of Change Requests For Effective Leadership Decisions Themes PDF
This slide showcase leadership dashboard indicating status of change requests for effective leadership decisions which can benefit organizations in earning additional revenues and stimulate employee performance. It contains change request due in a week, change request due in month, open changes, waiting for approval, open changes by risk, change requests by status and change requests by due date.Showcasing this set of slides titled Dashboard Indicating Status Of Change Requests For Effective Leadership Decisions Themes PDF The topics addressed in these templates are Dashboard Indicating, Requests Effective, Leadership Decisions All the content presented in this PPT design is completely editable. Download it and make adjustments in color, background, font etc. as per your unique business setting.
Key Business Metrics Dashboard Ppt PowerPoint Presentation Outline Model Cpb
This is a key business metrics dashboard ppt powerpoint presentation outline model cpb. This is a six stage process. The stages in this process are key business metrics dashboard.
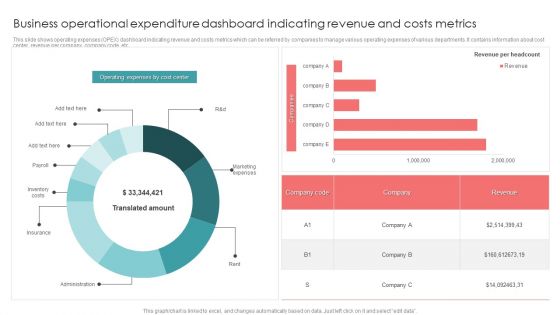
Business Operational Expenditure Dashboard Indicating Revenue And Costs Metrics Pictures PDF
This slide shows operating expenses OPEX dashboard indicating revenue and costs metrics which can be referred by companies to manage various operating expenses of various departments. It contains information about cost center, revenue per company, company code, etc. Pitch your topic with ease and precision using this Business Operational Expenditure Dashboard Indicating Revenue And Costs Metrics Pictures PDF. This layout presents information on Business Operational, Costs Metrics, Revenue. It is also available for immediate download and adjustment. So, changes can be made in the color, design, graphics or any other component to create a unique layout.
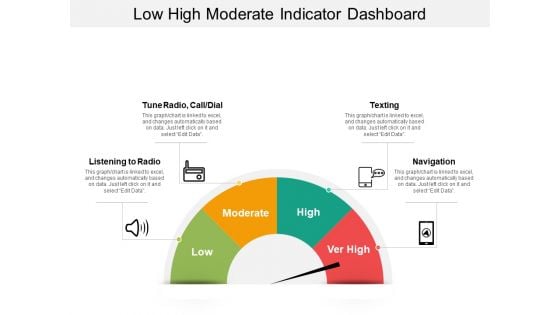
Low High Moderate Indicator Dashboard Ppt Powerpoint Presentation Infographic Template Example 2015
This is a low high moderate indicator dashboard ppt powerpoint presentation infographic template example 2015. This is a four stage process. The stages in this process are disturbance, distraction, interruption, diversion.
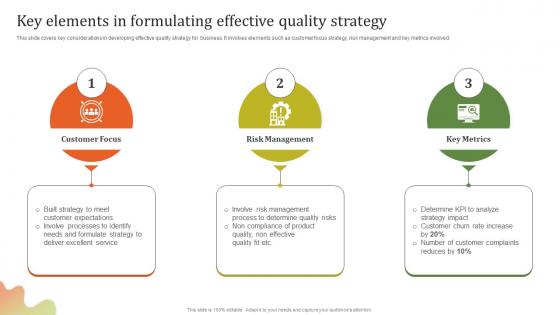
Key Elements In Formulating Executing Effective Quality Enhancement Elements Pdf
This slide covers key considerations in developing effective quality strategy for business. It involves elements such as customer focus strategy, risk management and key metrics involved. This Key Elements In Formulating Executing Effective Quality Enhancement Elements Pdf from Slidegeeks makes it easy to present information on your topic with precision. It provides customization options, so you can make changes to the colors, design, graphics, or any other component to create a unique layout. It is also available for immediate download, so you can begin using it right away. Slidegeeks has done good research to ensure that you have everything you need to make your presentation stand out. Make a name out there for a brilliant performance. This slide covers key considerations in developing effective quality strategy for business. It involves elements such as customer focus strategy, risk management and key metrics involved.
Our Key Metrics Ppt PowerPoint Presentation Icon Slide
This is a our key metrics ppt powerpoint presentation icon slide. This is a five stage process. The stages in this process are cash flow, turnover, productivity, net income, customer satisfaction .
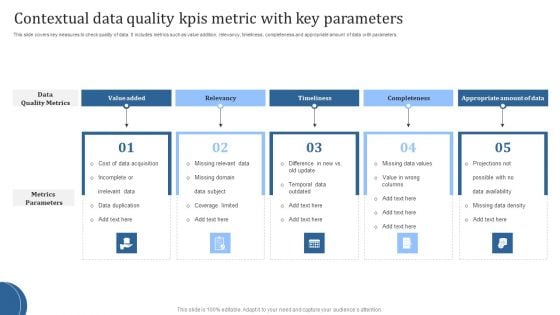
Contextual Data Quality Kpis Metric With Key Parameters Brochure PDF
This slide covers key measures to check quality of data. It includes metrics such as value addition, relevancy, timeliness, completeness and appropriate amount of data with parameters. Presenting Contextual Data Quality Kpis Metric With Key Parameters Brochure PDF to dispense important information. This template comprises Five stages. It also presents valuable insights into the topics including Value Added, Relevancy, Timeliness. This is a completely customizable PowerPoint theme that can be put to use immediately. So, download it and address the topic impactfully.
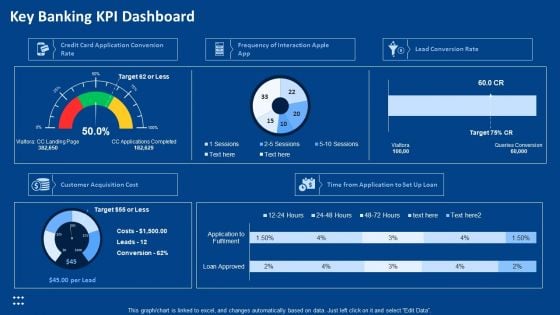
Procedure Advancements Banking Department Key Banking KPI Dashboard Slides PDF
Deliver an awe-inspiring pitch with this creative procedure advancements banking department key banking kpi dashboard slides pdf bundle. Topics like customer acquisition cost, lead conversion rate, application conversion rate can be discussed with this completely editable template. It is available for immediate download depending on the needs and requirements of the user.
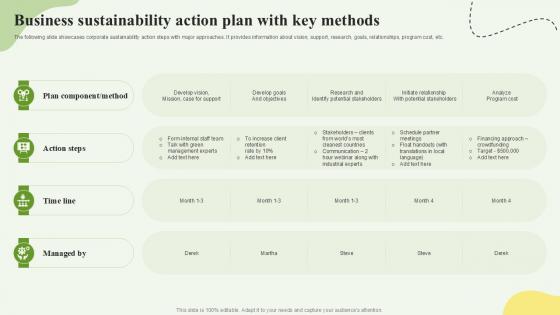
Business Sustainability Action Plan With Key Methods Ppt Template SS
This slide showcases HR analysis using business intelligence tool. The purpose of this slide is to understand the workforce demographics and effective management of employees to achieve business goals. It includes key metrics such as absenteeism rate, overtime hours, overall effectiveness and cost of training along with key takeaways. Do you have to make sure that everyone on your team knows about any specific topic I yes, then you should give Business Sustainability Action Plan With Key Methods Ppt Template SS a try. Our experts have put a lot of knowledge and effort into creating this impeccable Business Sustainability Action Plan With Key Methods Ppt Template SS You can use this template for your upcoming presentations, as the slides are perfect to represent even the tiniest detail. You can download these templates from the Slidegeeks website and these are easy to edit. So grab these today This slide showcases HR analysis using business intelligence tool. The purpose of this slide is to understand the workforce demographics and effective management of employees to achieve business goals. It includes key metrics such as absenteeism rate, overtime hours, overall effectiveness and cost of training along with key takeaways.
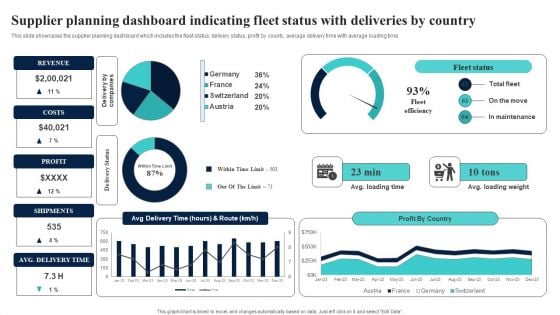
Supplier Planning Dashboard Indicating Fleet Status With Deliveries By Country Microsoft PDF
This slide showcases the supplier planning dashboard which includes the fleet status, delivery status, profit by county, average delivery time with average loading time. This Supplier Planning Dashboard Indicating Fleet Status With Deliveries By Country Microsoft PDF from Slidegeeks makes it easy to present information on your topic with precision. It provides customization options, so you can make changes to the colors, design, graphics, or any other component to create a unique layout. It is also available for immediate download, so you can begin using it right away. Slidegeeks has done good research to ensure that you have everything you need to make your presentation stand out. Make a name out there for a brilliant performance.
Key Business Metrics Dashboard Ppt Powerpoint Presentation Icon Graphics Design
This is a key business metrics dashboard ppt powerpoint presentation icon graphics design. This is a five stage process. The stages in this process are finance, marketing, management, investment, analysis.
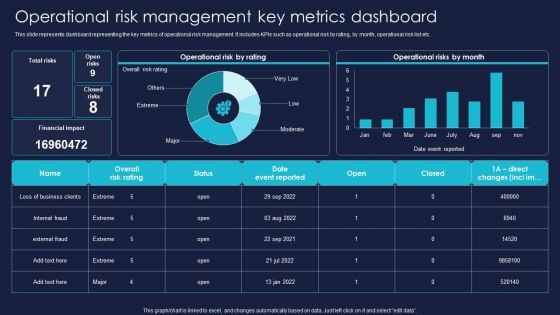
Operational Risk Management Key Metrics Dashboard Professional PDF
This slide represents dashboard representing the key metrics of operational risk management. It includes KPIs such as operational risk by rating, by month, operational risk list etc. Get a simple yet stunning designed Operational Risk Management Key Metrics Dashboard Professional PDF. It is the best one to establish the tone in your meetings. It is an excellent way to make your presentations highly effective. So, download this PPT today from Slidegeeks and see the positive impacts. Our easy to edit Operational Risk Management Key Metrics Dashboard Professional PDF can be your go-to option for all upcoming conferences and meetings. So, what are you waiting for Grab this template today.

Total Cost Of Ownership Dashboard Indicating Cost Breakdown And Storage Analysis Rules PDF
Showcasing this set of slides titled total cost of ownership dashboard indicating cost breakdown and storage analysis rules pdf. The topics addressed in these templates are total cost of ownership dashboard indicating cost breakdown and storage analysis. All the content presented in this PPT design is completely editable. Download it and make adjustments in color, background, font etc. as per your unique business setting.

Employee Feedback Dashboard With Key Metrics Elements PDF
The following slide depicts the key insights of the feedback survey to gauge employee engagement at different department levels. It includes metrics such as engagement score, response rate, no. of comments etc.Showcasing this set of slides titled Employee Feedback Dashboard With Key Metrics Elements PDF The topics addressed in these templates are Employee Feedback Dashboard With Key Metrics All the content presented in this PPT design is completely editable. Download it and make adjustments in color, background, font etc. as per your unique business setting.
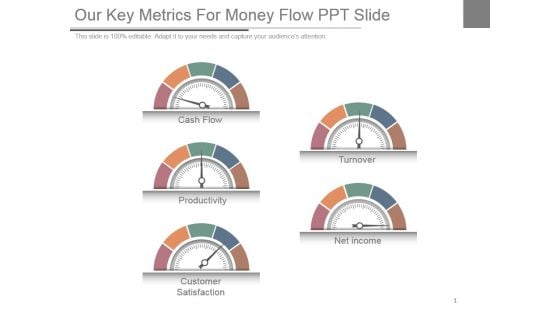
Our Key Metrics For Money Flow Ppt Slide
This is a our key metrics for money flow ppt slide. This is a five stage process. The stages in this process are cash flow, productivity, customer satisfaction, turnover, net income.
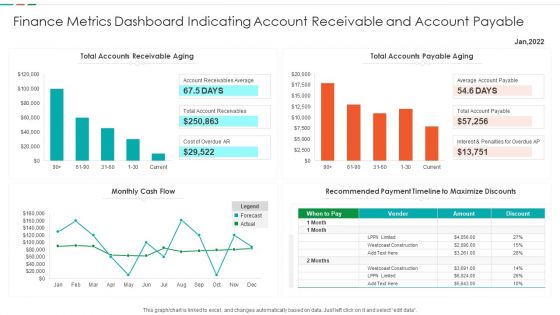
Finance Metrics Dashboard Indicating Account Receivable And Account Payable Demonstration PDF
This graph or chart is linked to excel, and changes automatically based on data. Just left click on it and select edit data. Showcasing this set of slides titled Finance Metrics Dashboard Indicating Account Receivable And Account Payable Demonstration PDF. The topics addressed in these templates are Total Accounts Receivable, Total Accounts Payable, Recommended Payment Timeline, Monthly Cash Flow. All the content presented in this PPT design is completely editable. Download it and make adjustments in color, background, font etc. as per your unique business setting.
Lead Tracking Dashboard Icon With Key Metrics Clipart PDF
Persuade your audience using this Lead Tracking Dashboard Icon With Key Metrics Clipart PDF. This PPT design covers three stages, thus making it a great tool to use. It also caters to a variety of topics including Lead Tracking, Dashboard, Key Metrics. Download this PPT design now to present a convincing pitch that not only emphasizes the topic but also showcases your presentation skills.
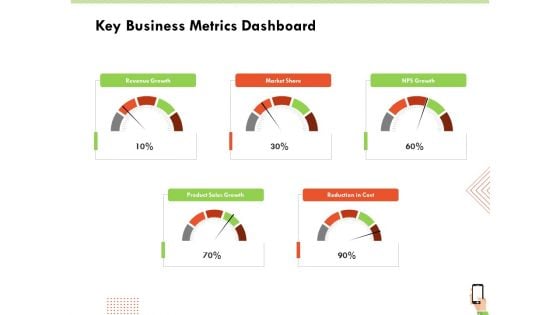
Multi Channel Online Commerce Key Business Metrics Dashboard Background PDF
Deliver and pitch your topic in the best possible manner with this multi channel online commerce key business metrics dashboard background pdf. Use them to share invaluable insights on revenue, market, sales, growth, cost and impress your audience. This template can be altered and modified as per your expectations. So, grab it now.
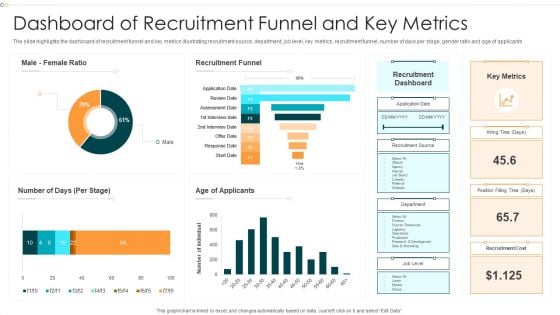
Dashboard Of Recruitment Funnel And Key Metrics Information PDF
The slide highlights the dashboard of recruitment funnel and key metrics illustrating recruitment source, department, job level, key metrics, recruitment funnel, number of days per stage, gender ratio and age of applicants.Pitch your topic with ease and precision using this Dashboard Of Recruitment Funnel And Key Metrics Information PDF This layout presents information on Recruitment Funnel, Recruitment Dashboard, Recruitment Cost It is also available for immediate download and adjustment. So, changes can be made in the color, design, graphics or any other component to create a unique layout.
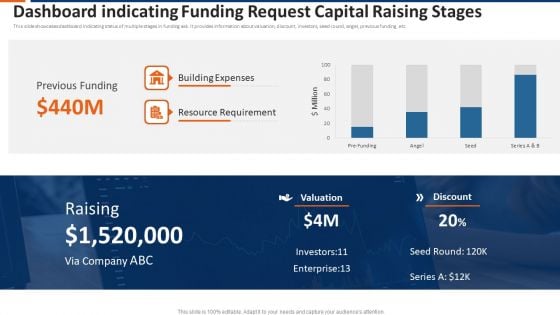
Dashboard Indicating Funding Request Capital Raising Stages Ppt Show Infographics PDF
This slide showcases dashboard indicating status of multiple stages in funding ask. It provides information about valuation, discount, investors, seed round, angel, previous funding, etc. Showcasing this set of slides titled dashboard indicating funding request capital raising stages ppt show infographics pdf. The topics addressed in these templates are previous funding, building expenses, resource requirement. All the content presented in this PPT design is completely editable. Download it and make adjustments in color, background, font etc. as per your unique business setting.
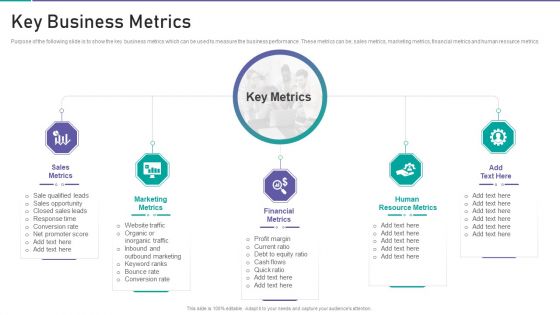
Corporate Organization Playbook Key Business Metrics Ppt Inspiration Elements PDF
Purpose of the following slide is to show the key business metrics which can be used to measure the business performance. These metrics can be sales metrics, marketing metrics, financial metrics and human resource metrics. Presenting corporate organization playbook key business metrics ppt inspiration elements pdf to provide visual cues and insights. Share and navigate important information on five stages that need your due attention. This template can be used to pitch topics like sales metrics, marketing metrics, financial metrics, human resource metrics. In addtion, this PPT design contains high resolution images, graphics, etc, that are easily editable and available for immediate download.
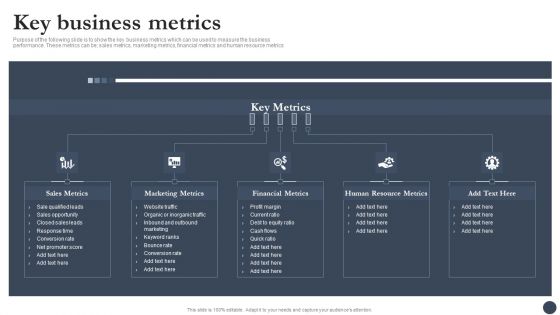
Strategic Playbook For Enterprise Administration Key Business Metrics Diagrams PDF
Purpose of the following slide is to show the key business metrics which can be used to measure the business performance. These metrics can be sales metrics, marketing metrics, financial metrics and human resource metrics. This is a Strategic Playbook For Enterprise Administration Key Business Metrics Diagrams PDF template with various stages. Focus and dispense information on five stages using this creative set, that comes with editable features. It contains large content boxes to add your information on topics like Marketing Metrics, Financial Metrics, Human Resource Metrics. You can also showcase facts, figures, and other relevant content using this PPT layout. Grab it now.

Blueprint To Enhance Organizational Operations Key Business Metrics Ideas PDF
Purpose of the following slide is to show the key business metrics which can be used to measure the business performance. These metrics can be sales metrics, marketing metrics, financial metrics and human resource metrics. Want to ace your presentation in front of a live audience Our Blueprint To Enhance Organizational Operations Key Business Metrics Ideas PDF can help you do that by engaging all the users towards you. Slidegeeks experts have put their efforts and expertise into creating these impeccable powerpoint presentations so that you can communicate your ideas clearly. Moreover, all the templates are customizable, and easy to edit and downloadable. Use these for both personal and commercial use.
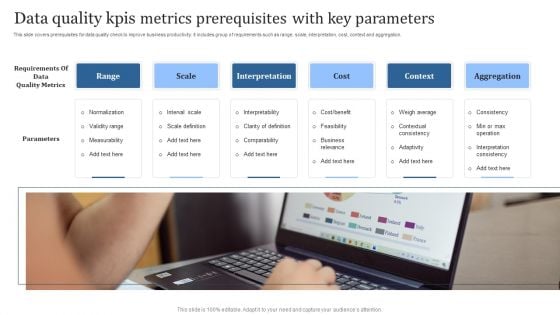
Data Quality Kpis Metrics Prerequisites With Key Parameters Introduction PDF
This slide covers prerequisites for data quality check to improve business productivity. It includes group of requirements such as range, scale, interpretation, cost, context and aggregation. Persuade your audience using this Data Quality Kpis Metrics Prerequisites With Key Parameters Introduction PDF. This PPT design covers Six stages, thus making it a great tool to use. It also caters to a variety of topics including Range, Scale, Interpretation. Download this PPT design now to present a convincing pitch that not only emphasizes the topic but also showcases your presentation skills.
Customer NPS Metric Image Indicating Customer Giving Experience Rating On Device Icons PDF
Presenting Customer NPS Metric Image Indicating Customer Giving Experience Rating On Device Icons PDF to dispense important information. This template comprises five stages. It also presents valuable insights into the topics including Customers Retention, Enhance Customer Experience, Business Assessment. This is a completely customizable PowerPoint theme that can be put to use immediately. So, download it and address the topic impactfully.
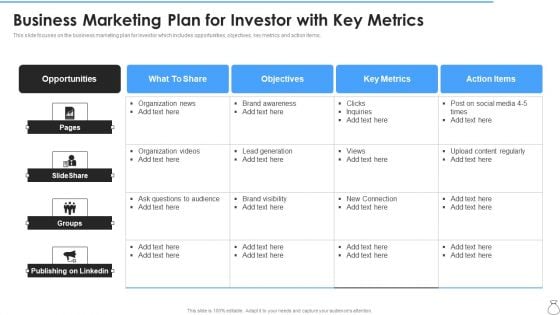
Business Marketing Plan For Investor With Key Metrics Information PDF
This slide focuses on the business marketing plan for investor which includes opportunities, objectives, key metrics and action items. Showcasing this set of slides titled Business Marketing Plan For Investor With Key Metrics Information PDF. The topics addressed in these templates are Opportunities, Social Media, Key Metrics. All the content presented in this PPT design is completely editable. Download it and make adjustments in color, background, font etc. as per your unique business setting.
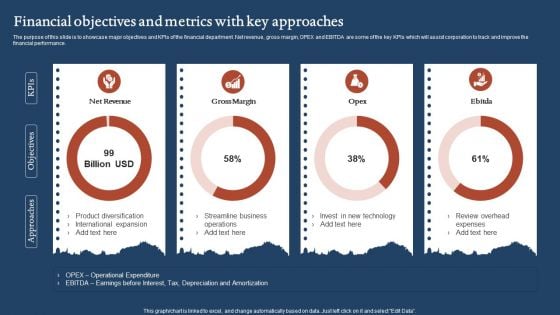
Financial Objectives And Metrics With Key Approaches Portrait PDF
The purpose of this slide is to showcase major objectives and KPIs of the financial department. Net revenue, gross margin, OPEX and EBITDA are some of the key KPIs which will assist corporation to track and improve the financial performance. Showcasing this set of slides titled Financial Objectives And Metrics With Key Approaches Portrait PDF. The topics addressed in these templates are Net Revenue, Gross Margin, Streamline Business. All the content presented in this PPT design is completely editable. Download it and make adjustments in color, background, font etc. as per your unique business setting.

Marketing Objectives And Metrics With Key Strategies Formats PDF
The purpose of this slide is to showcase different objectives and KPIs of the marketing team. The KPI could be customer lifetime value digital marketing ROI landing page conversion rate and lead to customer ratio. Pitch your topic with ease and precision using this Marketing Objectives And Metrics With Key Strategies Formats PDF. This layout presents information on Key Strategies, Conversion Rate, Customer Lifetime Value. It is also available for immediate download and adjustment. So, changes can be made in the color, design, graphics or any other component to create a unique layout.
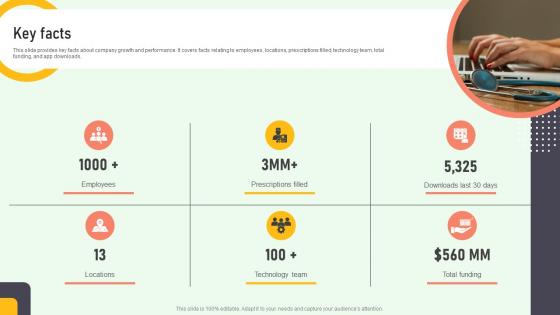
Key Facts Online Medication Management Platform Pitch Deck
This slide provides key facts about company growth and performance. It covers facts relating to employees, locations, prescriptions filled, technology team, total funding, and app downloads. This modern and well-arranged Key Facts Online Medication Management Platform Pitch Deck provides lots of creative possibilities. It is very simple to customize and edit with the Powerpoint Software. Just drag and drop your pictures into the shapes. All facets of this template can be edited with Powerpoint, no extra software is necessary. Add your own material, put your images in the places assigned for them, adjust the colors, and then you can show your slides to the world, with an animated slide included. This slide provides key facts about company growth and performance. It covers facts relating to employees, locations, prescriptions filled, technology team, total funding, and app downloads.
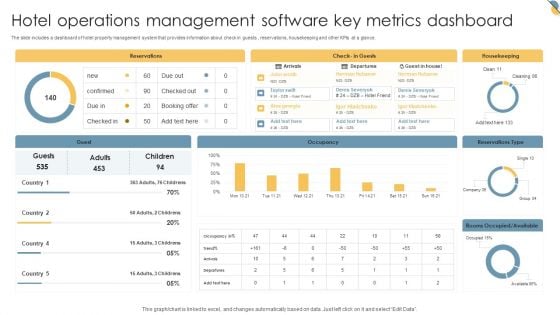
Hotel Operations Management Software Key Metrics Dashboard Inspiration PDF
The slide includes a dashboard of hotel property management system that provides information about check in guests , reservations, housekeeping and other KPIs at a glance. Pitch your topic with ease and precision using this Hotel Operations Management Software Key Metrics Dashboard Inspiration PDF. This layout presents information on Reservations, Housekeeping, Occupancy. It is also available for immediate download and adjustment. So, changes can be made in the color, design, graphics or any other component to create a unique layout.
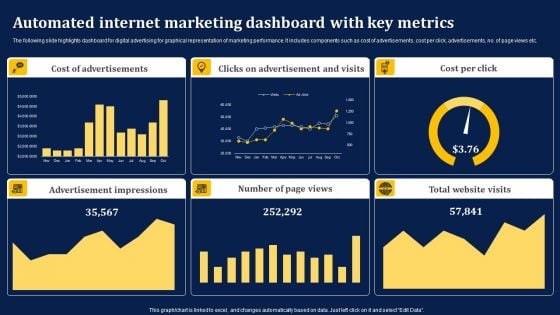
Automated Internet Marketing Dashboard With Key Metrics Information PDF
The following slide highlights dashboard for digital advertising for graphical representation of marketing performance. It includes components such as cost of advertisements, cost per click, advertisements, no. of page views etc. Showcasing this set of slides titled Automated Internet Marketing Dashboard With Key Metrics Information PDF. The topics addressed in these templates are Cost Advertisements, Clicks Advertisement, Cost Per Click. All the content presented in this PPT design is completely editable. Download it and make adjustments in color, background, font etc. as per your unique business setting.
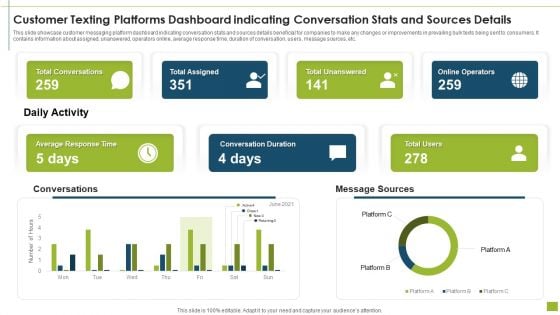
Customer Texting Platforms Dashboard Indicating Conversation Stats And Sources Details Ideas PDF
This slide showcase customer messaging platform dashboard indicating conversation stats and sources details beneficial for companies to make any changes or improvements in prevailing bulk texts being sent to consumers. It contains information about assigned, unanswered, operators online, average response time, duration of conversation, users, message sources, etc.Showcasing this set of slides titled customer texting platforms dashboard indicating conversation stats and sources details ideas pdf The topics addressed in these templates are total conversations, total assigned, total unanswered All the content presented in this PPT design is completely editable. Download it and make adjustments in color, background, font etc. as per your unique business setting.
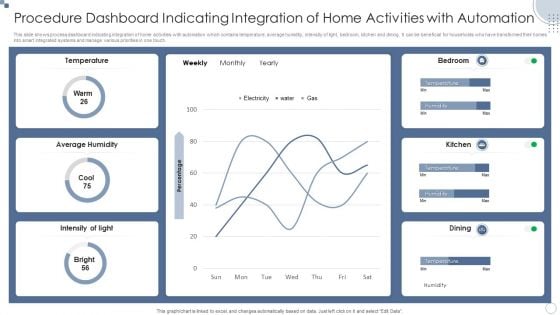
Procedure Dashboard Indicating Integration Of Home Activities With Automation Ppt PowerPoint Presentation File Files PDF
This slide shows process dashboard indicating integration of home activities with automation which contains temperature, average humidity, intensity of light, bedroom, kitchen and dining. It can be beneficial for households who have transformed their homes into smart integrated systems and manage various priorities in one touch.Showcasing this set of slides titled Procedure Dashboard Indicating Integration Of Home Activities With Automation Ppt PowerPoint Presentation File Files PDF. The topics addressed in these templates are Average Humidity, Temperature, Intensity Light. All the content presented in this PPT design is completely editable. Download it and make adjustments in color, background, font etc. as per your unique business setting.
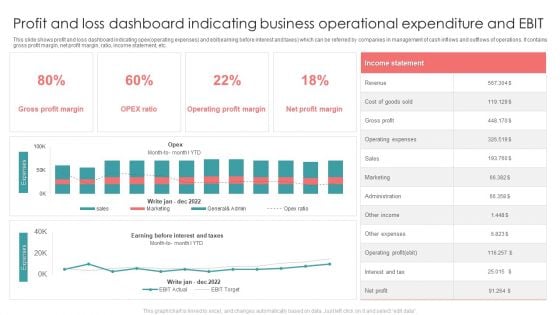
Profit And Loss Dashboard Indicating Business Operational Expenditure And EBIT Formats PDF
This slide shows profit and loss dashboard indicating opex operating expenses and ebit earning before interest and taxes which can be referred by companies in management of cash inflows and outflows of operations. It contains gross profit margin, net profit margin, ratio, income statement, etc. Showcasing this set of slides titled Profit And Loss Dashboard Indicating Business Operational Expenditure And EBIT Formats PDF. The topics addressed in these templates are Revenue, Gross Profit, Sales. All the content presented in this PPT design is completely editable. Download it and make adjustments in color, background, font etc. as per your unique business setting.
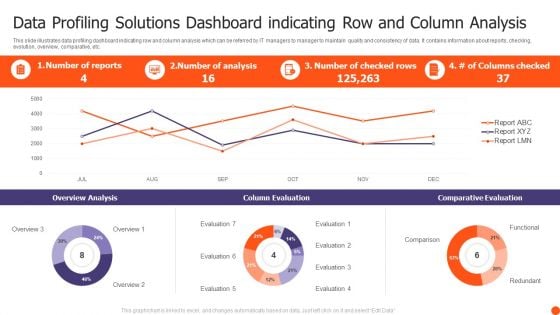
Data Profiling Solutions Dashboard Indicating Row And Column Analysis Summary PDF
This slide illustrates data profiling dashboard indicating row and column analysis which can be referred by IT managers to manager to maintain quality and consistency of data. It contains information about reports, checking, evolution, overview, comparative, etc. Showcasing this set of slides titled Data Profiling Solutions Dashboard Indicating Row And Column Analysis Summary PDF. The topics addressed in these templates are Overview Analysis, Column Evaluation, Comparative Evaluation. All the content presented in this PPT design is completely editable. Download it and make adjustments in color, background, font etc. as per your unique business setting.
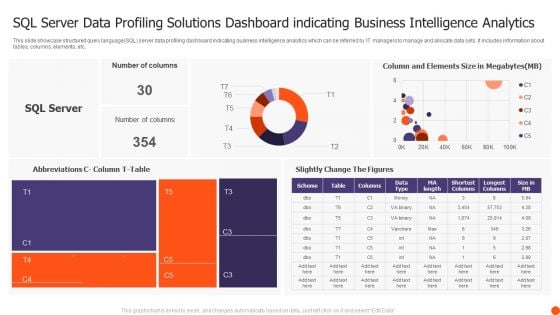
SQL Server Data Profiling Solutions Dashboard Indicating Business Intelligence Analytics Structure PDF
This slide showcase structured query language SQL server data profiling dashboard indicating business intelligence analytics which can be referred by IT managers to manage and allocate data sets. It includes information about tables, columns, elements, etc. Showcasing this set of slides titled SQL Server Data Profiling Solutions Dashboard Indicating Business Intelligence Analytics Structure PDF. The topics addressed in these templates are Number Columns, Slightly Change Figures, SQL Server. All the content presented in this PPT design is completely editable. Download it and make adjustments in color, background, font etc. as per your unique business setting.
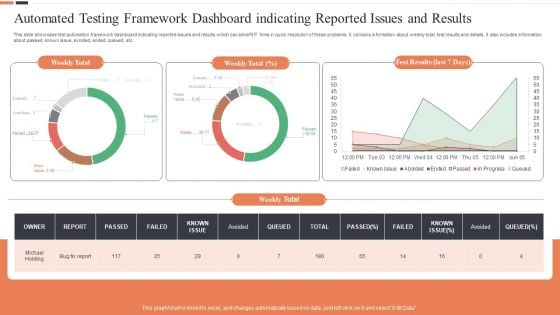
Automated Testing Framework Dashboard Indicating Reported Issues And Results Ideas PDF
This slide showcase test automation framework dashboard indicating reported issues and results which can benefit IT firms in quick resolution of these problems. It contains information about weekly total, test results and details. It also includes information about passed, known issue, avoided, ended, queued, etc. Showcasing this set of slides titled Automated Testing Framework Dashboard Indicating Reported Issues And Results Ideas PDF. The topics addressed in these templates are Weekly Total, Test Results, Last 7 Days. All the content presented in this PPT design is completely editable. Download it and make adjustments in color, background, font etc. as per your unique business setting.
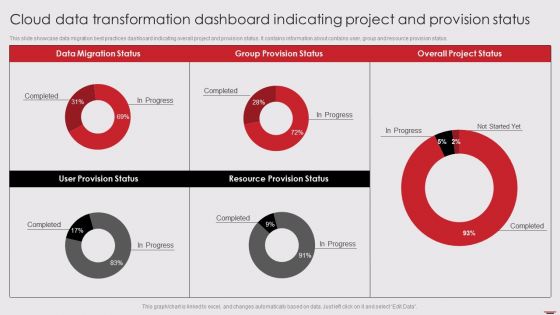
Cloud Data Transformation Dashboard Indicating Project And Provision Status Formats PDF
This slide showcase data migration best practices dashboard indicating overall project and provision status. It contains information about contains user, group and resource provision status. Showcasing this set of slides titled Cloud Data Transformation Dashboard Indicating Project And Provision Status Formats PDF. The topics addressed in these templates are Data Migration Status, Overall Project Status, Group Provision Status. All the content presented in this PPT design is completely editable. Download it and make adjustments in color, background, font etc. as per your unique business setting.
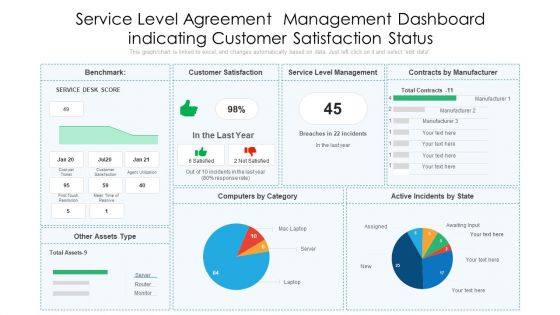
Service Level Agreement Management Dashboard Indicating Customer Satisfaction Status Designs PDF
Pitch your topic with ease and precision using this service level agreement management dashboard indicating customer satisfaction status designs pdf. This layout presents information on customer satisfaction, service level management, contracts by manufacturer. It is also available for immediate download and adjustment. So, changes can be made in the color, design, graphics or any other component to create a unique layout.
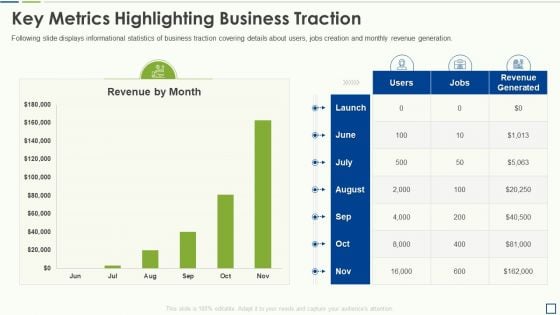
Accounting Pitch Deck Key Metrics Highlighting Business Traction Pictures PDF
Following slide displays informational statistics of business traction covering details about users, jobs creation and monthly revenue generation.Deliver and pitch your topic in the best possible manner with this accounting pitch deck key metrics highlighting business traction pictures pdf Use them to share invaluable insights on key metrics highlighting business traction and impress your audience. This template can be altered and modified as per your expectations. So, grab it now.
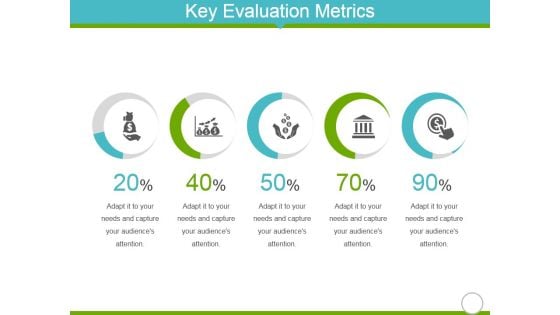
Key Evaluation Metrics Ppt Powerpoint Presentation Styles Design Inspiration
This is a key evaluation metrics ppt powerpoint presentation styles design inspiration. This is a five stage process. The stages in this process are business, marketing, icons, finance.
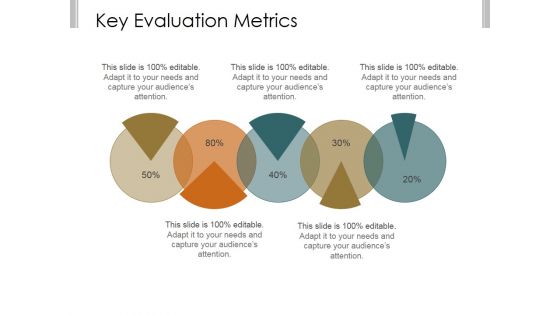
Key Evaluation Metrics Ppt PowerPoint Presentation Example File
This is a key evaluation metrics ppt powerpoint presentation example file. This is a five stage process. The stages in this process are business, strategy, marketing, analysis, finance.
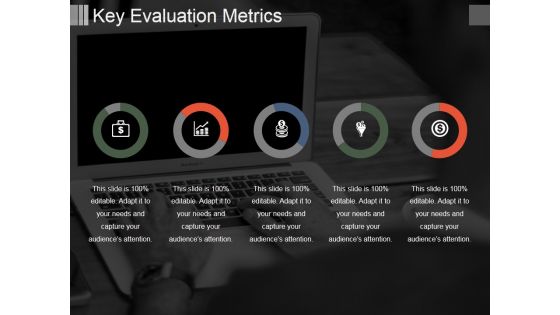
Key Evaluation Metrics Ppt PowerPoint Presentation Show Guide
This is a key evaluation metrics ppt powerpoint presentation show guide. This is a five stage process. The stages in this process are donut, icons, business, strategy, analysis.
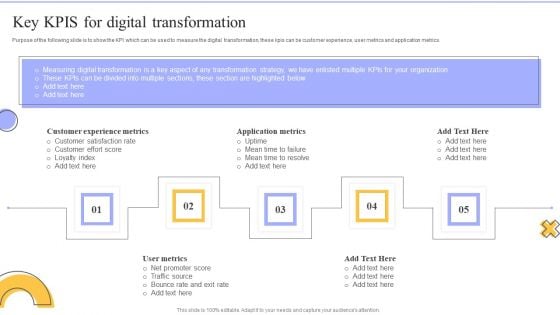
Change Administration Strategies Key Kpis For Digital Transformation Designs PDF
Purpose of the following slide is to show the KPI which can be used to measure the digital transformation, these kpis can be customer experience, user metrics and application metrics. This is a Change Administration Strategies Key Kpis For Digital Transformation Designs PDF template with various stages. Focus and dispense information on five stages using this creative set, that comes with editable features. It contains large content boxes to add your information on topics like Customer Experience Metrics, Application Metrics, User Metrics. You can also showcase facts, figures, and other relevant content using this PPT layout. Grab it now.
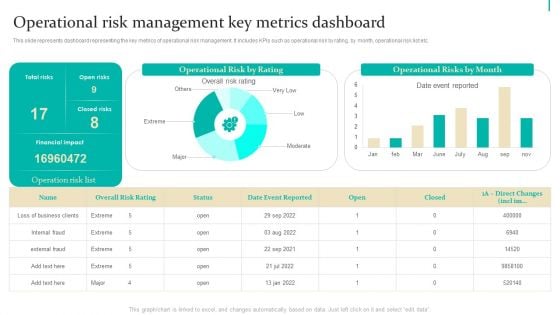
Enterprise Risk Management Operational Risk Management Key Metrics Inspiration PDF
This slide represents dashboard representing the key metrics of operational risk management. It includes KPIs such as operational risk by rating, by month, operational risk list etc. Boost your pitch with our creative Enterprise Risk Management Operational Risk Management Key Metrics Inspiration PDF. Deliver an awe-inspiring pitch that will mesmerize everyone. Using these presentation templates you will surely catch everyones attention. You can browse the ppts collection on our website. We have researchers who are experts at creating the right content for the templates. So you dont have to invest time in any additional work. Just grab the template now and use them.
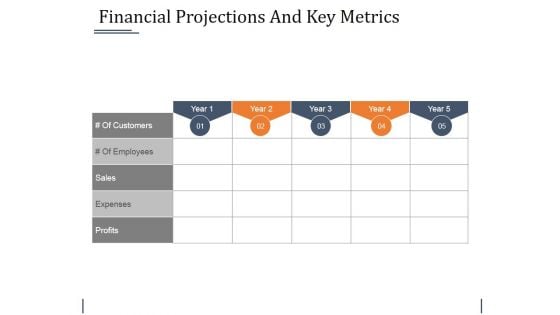
Financial Projections And Key Metrics Ppt PowerPoint Presentation Layouts Objects
This is a financial projections and key metrics ppt powerpoint presentation layouts objects. This is a five stage process. The stages in this process are sales, expenses, profits.
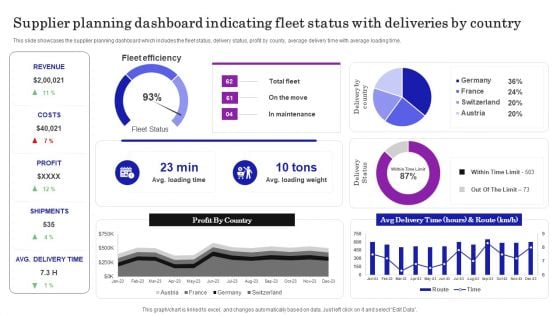
Supplier Planning Dashboard Indicating Fleet Status With Deliveries By Country Ideas PDF
This slide showcases the supplier planning dashboard which includes the fleet status, delivery status, profit by county, average delivery time with average loading time. Here you can discover an assortment of the finest PowerPoint and Google Slides templates. With these templates, you can create presentations for a variety of purposes while simultaneously providing your audience with an eye catching visual experience. Download Supplier Planning Dashboard Indicating Fleet Status With Deliveries By Country Ideas PDF to deliver an impeccable presentation. These templates will make your job of preparing presentations much quicker, yet still, maintain a high level of quality. Slidegeeks has experienced researchers who prepare these templates and write high quality content for you. Later on, you can personalize the content by editing the Supplier Planning Dashboard Indicating Fleet Status With Deliveries By Country Ideas PDF.
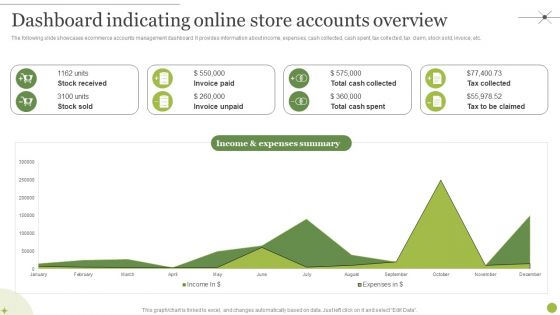
Managing E Commerce Business Accounting Dashboard Indicating Online Store Accounts Overview Inspiration PDF
The following slide showcases ecommerce accounts management dashboard. It provides information about income, expenses, cash collected, cash spent, tax collected, tax claim, stock sold, invoice, etc. There are so many reasons you need a Managing E Commerce Business Accounting Dashboard Indicating Online Store Accounts Overview Inspiration PDF. The first reason is you can not spend time making everything from scratch, Thus, Slidegeeks has made presentation templates for you too. You can easily download these templates from our website easily.
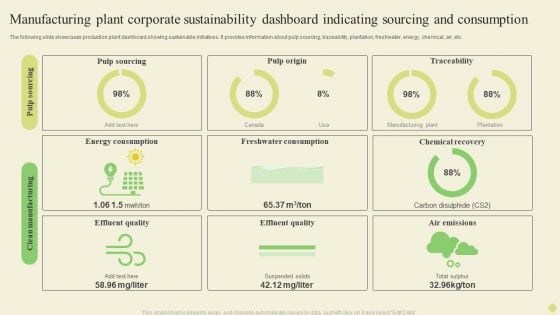
Manufacturing Plant Corporate Sustainability Dashboard Indicating Sourcing And Consumption Infographics PDF
The following slide showcases business sustainability dashboard highlighting multiple sources of technology. It provides information about renewable energy, plant age, solar, wind, biomass, regionality, etc.Pitch your topic with ease and precision using this Manufacturing Plant Corporate Sustainability Dashboard Indicating Sourcing And Consumption Infographics PDF. This layout presents information on Energy Consumption, Freshwater Consumption, Chemical Recovery. It is also available for immediate download and adjustment. So, changes can be made in the color, design, graphics or any other component to create a unique layout.
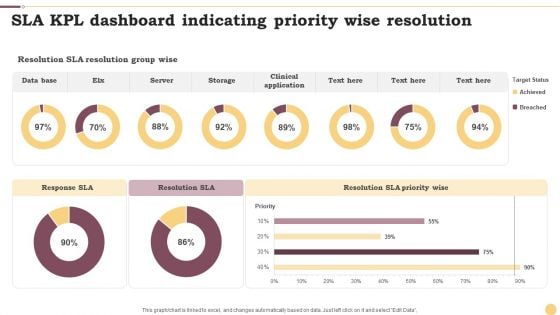
SLA KPL Dashboard Indicating Priority Wise Resolution Ppt Infographics Example File PDF
This graph or chart is linked to excel, and changes automatically based on data. Just left click on it and select Edit Data. Pitch your topic with ease and precision using this SLA KPL Dashboard Indicating Priority Wise Resolution Ppt Infographics Example File PDF. This layout presents information on Data Base, Server, Storage. It is also available for immediate download and adjustment. So, changes can be made in the color, design, graphics or any other component to create a unique layout.

Social Media ROI Pyramid With Key Business Metrics Download PDF
The slide showcases a social media ROI pyramid and highlights its key metrics which enables you to boost your social media strategy by making use of a measurement framework. It involves business metrics, social media analytics and engagement data. Persuade your audience using this Social Media ROI Pyramid With Key Business Metrics Download PDF. This PPT design covers three stages, thus making it a great tool to use. It also caters to a variety of topics including Business Metrices, Social Media Analytics, Engagement Data. Download this PPT design now to present a convincing pitch that not only emphasizes the topic but also showcases your presentation skills.
Key Metrics To Increase Consumer Traffic Icon Themes PDF
Showcasing this set of slides titled Key Metrics To Increase Consumer Traffic Icon Themes PDF. The topics addressed in these templates are Key Metrics, Increase Consumer, Traffic . All the content presented in this PPT design is completely editable. Download it and make adjustments in color, background, font etc. as per your unique business setting.
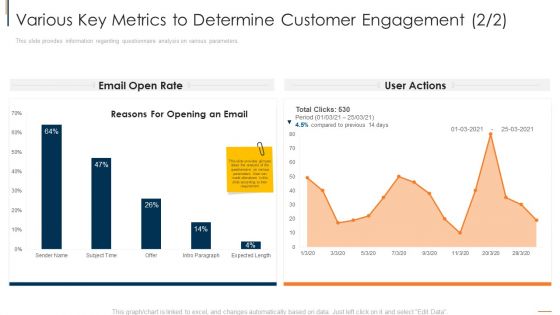
Various Key Metrics To Determine Customer Engagement Rate Download PDF
This slide provides information regarding questionnaire analysis on various parameters. Deliver an awe inspiring pitch with this creative various key metrics to determine customer engagement rate download pdf bundle. Topics like various key metrics to determine customer engagement can be discussed with this completely editable template. It is available for immediate download depending on the needs and requirements of the user.
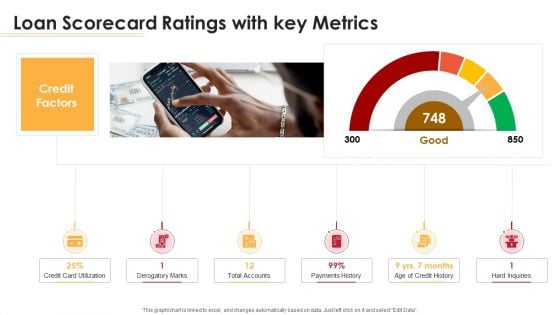
Loan Scorecard Ratings With Key Metrics Ppt Pictures Portfolio PDF
Deliver an awe inspiring pitch with this creative loan scorecard ratings with key metrics ppt pictures portfolio pdf bundle. Topics like loan scorecard ratings with key metrics can be discussed with this completely editable template. It is available for immediate download depending on the needs and requirements of the user.
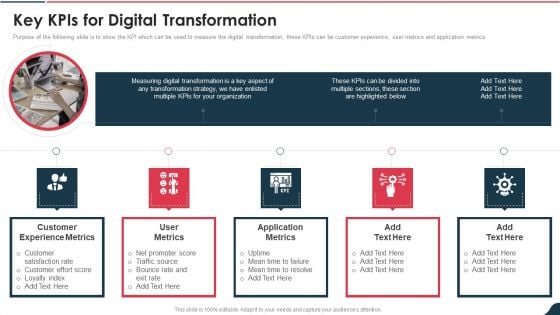
Electronic Playbook Key Kpis For Digital Transformation Infographics PDF
Purpose of the following slide is to show the KPI which can be used to measure the digital transformation, these KPIs can be customer experience, user metrics and application metrics. This is a electronic playbook key kpis for digital transformation infographics pdf template with various stages. Focus and dispense information on five stages using this creative set, that comes with editable features. It contains large content boxes to add your information on topics like customer experience metrics, application metrics, satisfaction rate customer You can also showcase facts, figures, and other relevant content using this PPT layout. Grab it now.


 Continue with Email

 Home
Home


