Key Themes

Virtual Currency Investment Guide For Companies Dashboard To Effectively Track Bitcoin Diagrams PDF
The following dashboard highlights key parameters that can be used by the organization to track the performance of their bitcoin investment, it enlists major KPIs such as price of bitcoin, transaction chart and its historical performance. Deliver an awe inspiring pitch with this creative Virtual Currency Investment Guide For Companies Dashboard To Effectively Track Bitcoin Diagrams PDF bundle. Topics like Prediction Meter, Todays Market Activity, Transaction Chart can be discussed with this completely editable template. It is available for immediate download depending on the needs and requirements of the user.
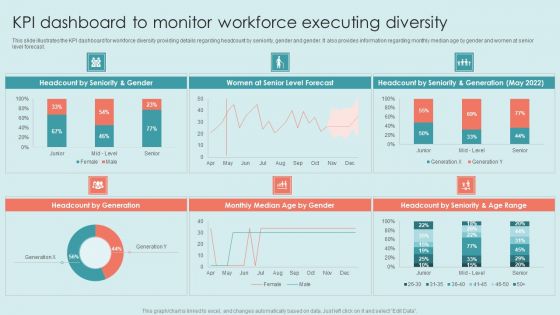
Executing Diversity KPI Dashboard To Monitor Workforce Executing Diversity Background PDF
This slide covers information regarding the key traits of inclusive leadership such as commitment, courage, cognize bias, curiosity etc. It also provides details about thinking to develop and behavior to adopt for becoming an effective inclusive leader. If your project calls for a presentation, then Slidegeeks is your go-to partner because we have professionally designed, easy-to-edit templates that are perfect for any presentation. After downloading, you can easily edit Executing Diversity KPI Dashboard To Monitor Workforce Executing Diversity Background PDF and make the changes accordingly. You can rearrange slides or fill them with different images. Check out all the handy templates.
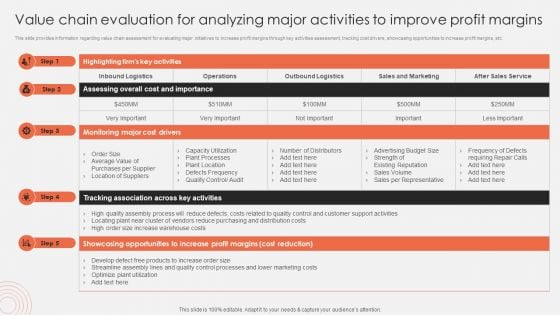
Value Chain Evaluation For Analyzing Major Activities To Improve Profit Margins Background PDF
This slide provides information regarding value chain assessment for evaluating major initiatives to increase profit margins through key activities assessment, tracking cost drivers, showcasing opportunities to increase profit margins, etc. If your project calls for a presentation, then Slidegeeks is your go to partner because we have professionally designed, easy to edit templates that are perfect for any presentation. After downloading, you can easily edit Value Chain Evaluation For Analyzing Major Activities To Improve Profit Margins Background PDF and make the changes accordingly. You can rearrange slides or fill them with different images. Check out all the handy templates.
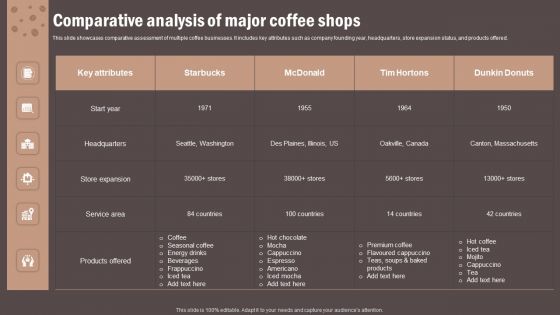
Coffee Cafe Company Profile Comparative Analysis Of Major Coffee Shops Background PDF
This slide showcases comparative assessment of multiple coffee businesses. It includes key attributes such as company founding year, headquarters, store expansion status, and products offered. If your project calls for a presentation, then Slidegeeks is your go to partner because we have professionally designed, easy to edit templates that are perfect for any presentation. After downloading, you can easily edit Coffee Cafe Company Profile Comparative Analysis Of Major Coffee Shops Background PDF and make the changes accordingly. You can rearrange slides or fill them with different images. Check out all the handy templates
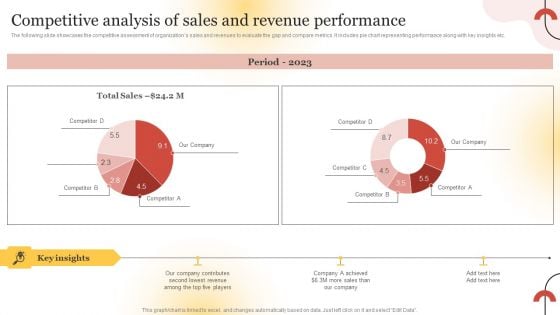
Executing Sales Risk Reduction Plan Competitive Analysis Of Sales And Revenue Performance Diagrams PDF
The following slide showcases the competitive assessment of organizations sales and revenues to evaluate the gap and compare metrics. It includes pie chart representing performance along with key insights etc. Take your projects to the next level with our ultimate collection of Executing Sales Risk Reduction Plan Competitive Analysis Of Sales And Revenue Performance Diagrams PDF. Slidegeeks has designed a range of layouts that are perfect for representing task or activity duration, keeping track of all your deadlines at a glance. Tailor these designs to your exact needs and give them a truly corporate look with your own brand colors they will make your projects stand out from the rest.
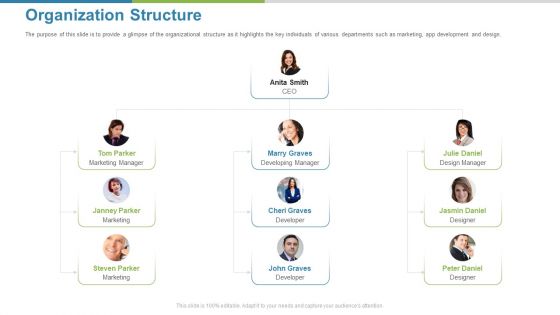
Work Execution Liability Organization Structure Ppt Ideas Backgrounds PDF
The purpose of this slide is to provide a glimpse of the organizational structure as it highlights the key individuals of various departments such as marketing, app development and design. This is a work execution liability organization structure ppt ideas backgrounds pdf template with various stages. Focus and dispense information on four stages using this creative set, that comes with editable features. It contains large content boxes to add your information on topics like organization structure. You can also showcase facts, figures, and other relevant content using this PPT layout. Grab it now.
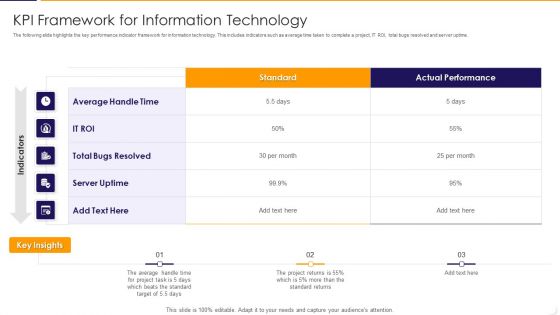
KPI Framework For Information Technology Ppt PowerPoint Presentation Gallery Clipart Images PDF
The following slide highlights the key performance indicator framework for information technology. This includes indicators such as average time taken to complete a project, IT ROI, total bugs resolved and server uptime. Showcasing this set of slides titled kpi framework for information technology ppt powerpoint presentation gallery clipart images pdf The topics addressed in these templates are average, target, performance All the content presented in this PPT design is completely editable. Download it and make adjustments in color, background, font etc. as per your unique business setting.

Construction Project Stages With Cost Management Activities Ppt Portfolio Clipart Images PDF
Mentioned slide highlights the various stages involved in the construction project with different cost control tasks. The key stages are strategic definition, preparation, concept design, developed design, technical design, etc. Showcasing this set of slides titled Construction Project Stages With Cost Management Activities Ppt Portfolio Clipart Images PDF. The topics addressed in these templates are Construction Stages, Cost Control Activities, Strategic Definition. All the content presented in this PPT design is completely editable. Download it and make adjustments in color, background, font etc. as per your unique business setting.
Construction Project Timeline And Work Stages Icon Structure PDF
The slide showcases budget formation and tasks involved in each phase of a construction project this helps me get a clear picture of deliverables and step by step budget allocation to stakeholders. The slide contains elements such as budgeting for internal, external, and foundation setting tasks with their key insights. Showcasing this set of slides titled Construction Project Timeline And Work Stages Icon Structure PDF. The topics addressed in these templates are Construction Project, Timeline, Work Stages Icon. All the content presented in this PPT design is completely editable. Download it and make adjustments in color, background, font etc. as per your unique business setting.
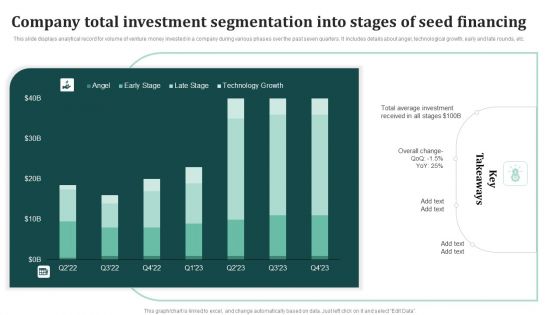
Company Total Investment Segmentation Into Stages Of Seed Financing Rules PDF
This slide displays analytical record for volume of venture money invested in a company during various phases over the past seven quarters. It includes details about angel, technological growth, early and late rounds, etc. Showcasing this set of slides titled Company Total Investment Segmentation Into Stages Of Seed Financing Rules PDF. The topics addressed in these templates are Total Average Investment, Overall Change, Key Takeaways. All the content presented in this PPT design is completely editable. Download it and make adjustments in color, background, font etc. as per your unique business setting.
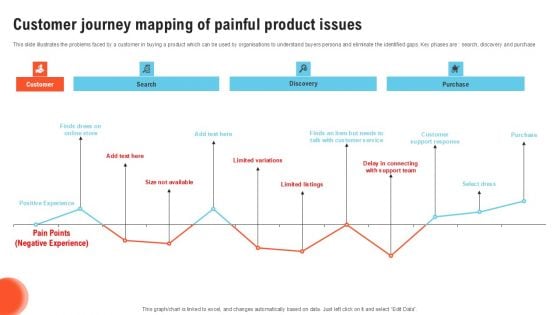
Customer Journey Mapping Of Painful Product Issues Portrait PDF
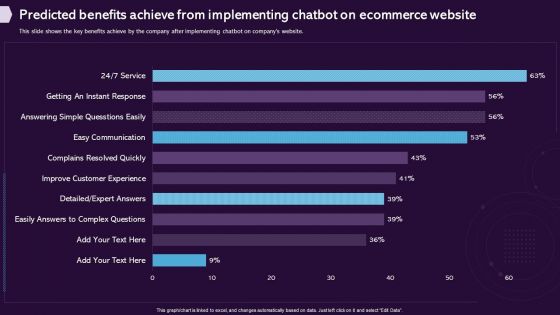
Predicted Benefits Achieve From Implementing Chatbot On Ecommerce Website Diagrams PDF
This slide shows the key benefits achieve by the company after implementing chatbot on companys website. Do you have an important presentation coming up Are you looking for something that will make your presentation stand out from the rest Look no further than Predicted Benefits Achieve From Implementing Chatbot On Ecommerce Website Diagrams PDF. With our professional designs, you can trust that your presentation will pop and make delivering it a smooth process. And with Slidegeeks, you can trust that your presentation will be unique and memorable. So why wait Grab Predicted Benefits Achieve From Implementing Chatbot On Ecommerce Website Diagrams PDF today and make your presentation stand out from the rest.
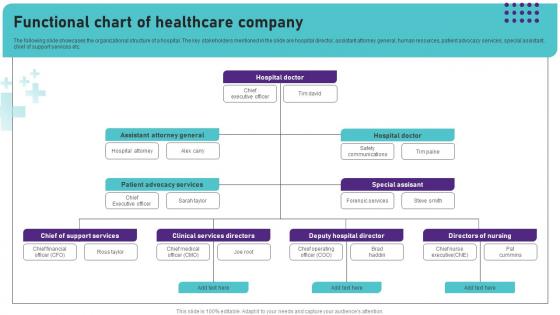
Functional Chart Of Healthcare Company Operational Areas Healthcare Introduction PDF
Make sure to capture your audiences attention in your business displays with our gratis customizable Functional Chart Of Healthcare Company Operational Areas Healthcare Introduction PDF. These are great for business strategies, office conferences, capital raising or task suggestions. If you desire to acquire more customers for your tech business and ensure they stay satisfied, create your own sales presentation with these plain slides. The following slide showcases the organizational structure of a hospital. The key stakeholders mentioned in the slide are hospital director, assistant attorney general, human resources, patient advocacy services, special assistant, chief of support services etc.
Testing Process To Improve Smartphone App Performance Icons PDF
This slide showcases process for mobile application testing that can help organization in reducing the the development and preventing bugs to improve the performance. Its key components are phases, activities and timeline. Showcasing this set of slides titled Testing Process To Improve Smartphone App Performance Icons PDF. The topics addressed in these templates are Documentation Testing, Functional Testing, Usability Testing. All the content presented in this PPT design is completely editable. Download it and make adjustments in color, background, font etc. as per your unique business setting.
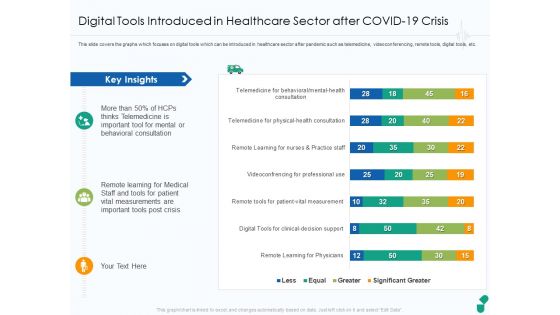
Digital Tools Introduced In Healthcare Sector After COVID 19 Crisis Ppt Outline Diagrams PDF
This slide covers the graphs which focuses on digital tools which can be introduced in healthcare sector after pandemic such as telemedicine, videoconferencing, remote tools, digital tools, etc. Deliver an awe-inspiring pitch with this creative digital tools introduced in healthcare sector after covid 19 crisis ppt outline diagrams pdf bundle. Topics like key insights, patient vital measurements, important tools post crisis, behavioral consultation can be discussed with this completely editable template. It is available for immediate download depending on the needs and requirements of the user.
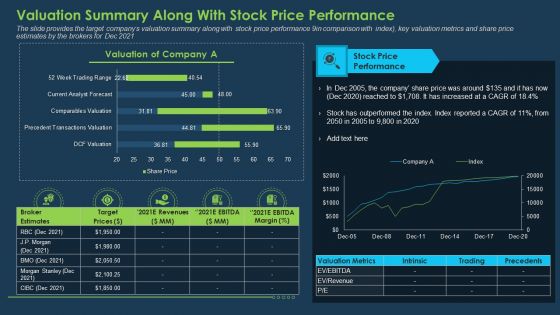
Commercial Banking Template Collection Valuation Summary Along With Stock Price Performance Diagrams PDF
The slide provides the target companys valuation summary along with stock price performance 9in comparison with index, key valuation metrics and share price estimates by the brokers for Dec 2021. Deliver and pitch your topic in the best possible manner with this commercial banking template collection valuation summary along with stock price performance diagrams pdf. Use them to share invaluable insights on stock price performance, revenues, target prices and impress your audience. This template can be altered and modified as per your expectations. So, grab it now.
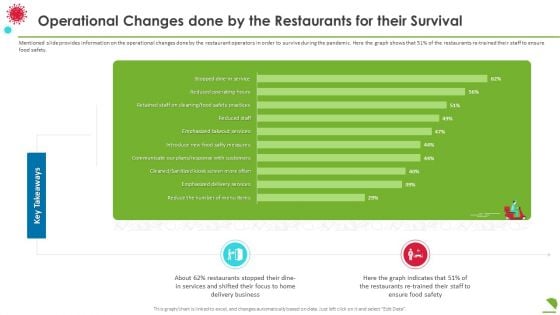
Operational Changes Done By The Restaurants For Their Survival Diagrams PDF
Mentioned slide provides information on the operational changes done by the restaurant operators in order to survive during the pandemic. Here the graph shows that 51 percentage of the restaurants re trained their staff to ensure food safety. Deliver an awe inspiring pitch with this creative operational changes done by the restaurants for their survival diagrams pdf bundle. Topics like business, services, key takeaways can be discussed with this completely editable template. It is available for immediate download depending on the needs and requirements of the user.
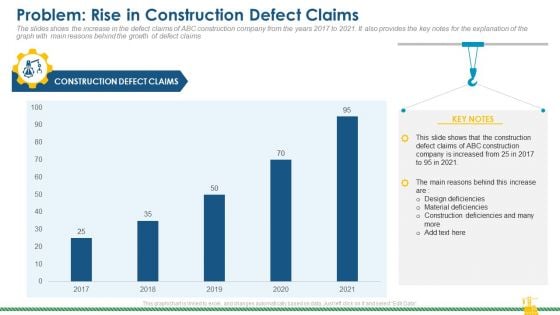
Rising Construction Defect Claims Against The Corporation Problem Rise In Construction Defect Claims Diagrams PDF
The slides shows the increase in the defect claims of ABC construction company from the years 2017 to 2021. It also provides the key notes for the explanation of the graph with main reasons behind the growth of defect claims. Deliver and pitch your topic in the best possible manner with this rising construction defect claims against the corporation problem rise in construction defect claims diagrams pdf. Use them to share invaluable insights on defect, claims, material deficiencies, design deficiencies and impress your audience. This template can be altered and modified as per your expectations. So, grab it now.
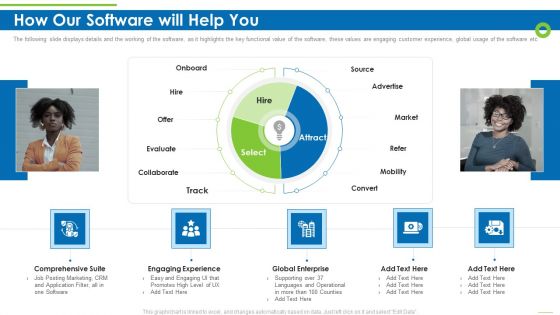
Enterprise Recruitment Industries Investor Fund Raising How Our Software Will Help You Diagrams PDF
The following slide displays details and the working of the software, as it highlights the key functional value of the software, these values are engaging customer experience, global usage of the software etc Deliver an awe inspiring pitch with this creative enterprise recruitment industries investor fund raising how our software will help you diagrams pdf bundle. Topics like comprehensive suite, engaging experience, global enterprise can be discussed with this completely editable template. It is available for immediate download depending on the needs and requirements of the user.
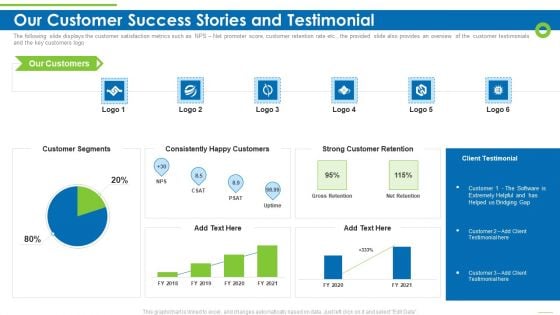
Enterprise Recruitment Industries Investor Fund Raising Our Customer Success Stories And Testimonial Diagrams PDF
The following slide displays the customer satisfaction metrics such as NPS Net promoter score, customer retention rate etc., the provided slide also provides an overview of the customer testimonials and the key customers logo Deliver an awe inspiring pitch with this creative enterprise recruitment industries investor fund raising our customer success stories and testimonial diagrams pdf bundle. Topics like customer segments, consistently happy customers, strong customer retention can be discussed with this completely editable template. It is available for immediate download depending on the needs and requirements of the user.
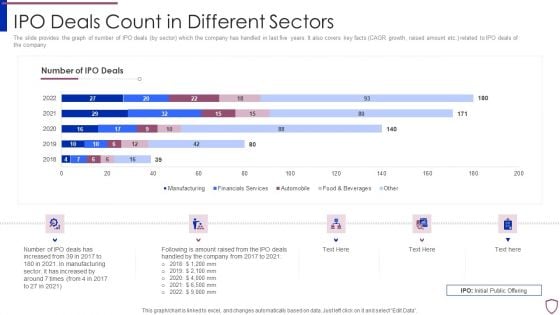
Financing Catalogue For Security Underwriting Agreement IPO Deals Count In Different Sectors Diagrams PDF
The slide provides the graph of number of IPO deals by sector which the company has handled in last five years. It also covers key facts CAGR growth, raised amount etc. related to IPO deals of the company. Deliver an awe inspiring pitch with this creative financing catalogue for security underwriting agreement ipo deals count in different sectors diagrams pdf bundle. Topics like manufacturing, financial services, automobile, food and beverages can be discussed with this completely editable template. It is available for immediate download depending on the needs and requirements of the user.
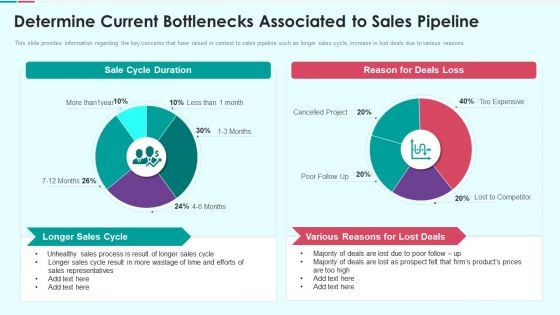
Sales Funnel Management For Revenue Generation Determine Current Bottlenecks Diagrams PDF
This slide provides information regarding the key concerns that have raised in context to sales pipeline such as longer sales cycle, increase in lost deals due to various reasons. Deliver and pitch your topic in the best possible manner with this sales funnel management for revenue generation determine current bottlenecks diagrams pdf Use them to share invaluable insights on longer sales cycle, various reasons for lost deals, sales representatives and impress your audience. This template can be altered and modified as per your expectations. So, grab it now.
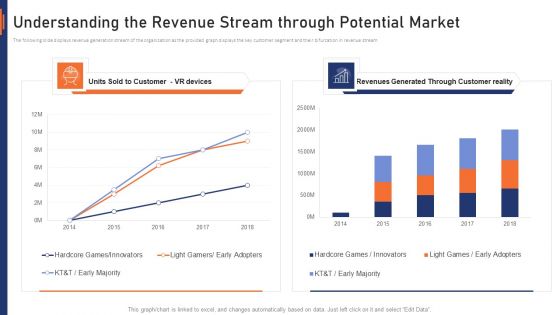
VR Market Capital Raising Elevator Pitch Deck Understanding The Revenue Stream Through Potential Market Diagrams PDF
The following slide displays revenue generation stream of the organization as the provided graph displays the key customer segment and their bifurcation in revenue stream. Deliver and pitch your topic in the best possible manner with this vr market capital raising elevator pitch deck understanding the revenue stream through potential market diagrams pdf. Use them to share invaluable insights on understanding the revenue stream through potential market and impress your audience. This template can be altered and modified as per your expectations. So, grab it now.
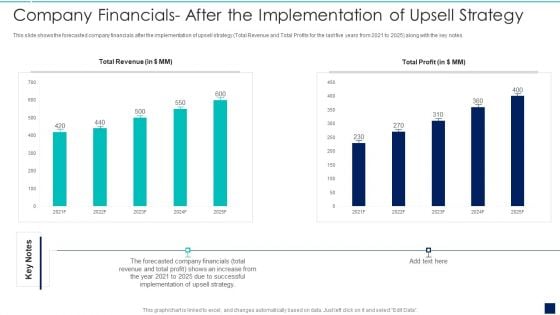
Influence Buyers To Purchase Additional High Company Financials After The Implementation Diagrams PDF
This slide shows the forecasted company financials after the implementation of upsell strategy total Revenue and Total Profits for the last five years from 2021 to 2025 along with the key notes.Deliver an awe inspiring pitch with this creative Influence Buyers To Purchase Additional High Company Financials After The Implementation Diagrams PDF bundle. Topics like Company Financials After The Implementation Of Upsell Strategy can be discussed with this completely editable template. It is available for immediate download depending on the needs and requirements of the user.
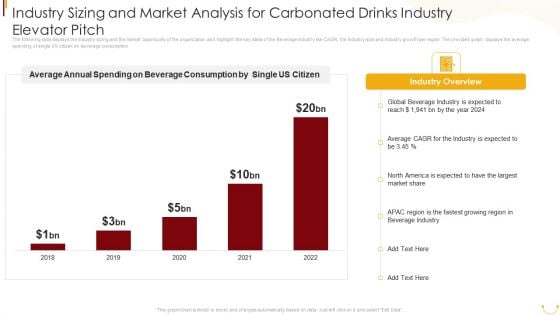
Industry Sizing And Market Analysis For Carbonated Drinks Industry Elevator Pitch Diagrams PDF
The following slide displays the Industry sizing and the market opportunity of the organization as it highlight the key stats of the Beverage industry like CAGR, the Industry size and Industry growth per region. The provided graph displays the average spending of single US citizen on beverage consumption. Deliver and pitch your topic in the best possible manner with this Industry Sizing And Market Analysis For Carbonated Drinks Industry Elevator Pitch Diagrams PDF. Use them to share invaluable insights on Average Annual Spending, Beverage Consumption, Single US Citizen, Global Beverage Industry, 2018 To 2022 and impress your audience. This template can be altered and modified as per your expectations. So, grab it now.
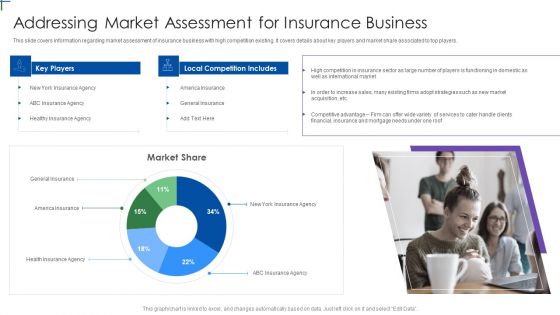
Insurance Company Business Plan Addressing Market Assessment For Insurance Business Diagrams PDF
This slide covers information regarding market assessment of insurance business with high competition existing. It covers details about key players and market share associated to top players. Deliver and pitch your topic in the best possible manner with this Insurance Company Business Plan Addressing Market Assessment For Insurance Business Diagrams PDF Use them to share invaluable insights on America Insurance, General Insurance, Local Competition Includes and impress your audience. This template can be altered and modified as per your expectations. So, grab it now.
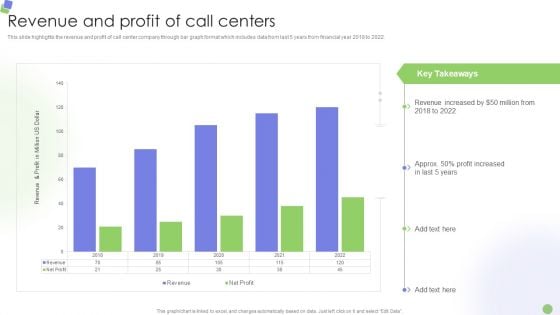
Knowledge Process Outsourcing Company Profile Revenue And Profit Of Call Centers Diagrams PDF
This slide highlights the revenue and profit of call center company through bar graph format which includes data from last 5 years from financial year 2018 to 2022.Deliver and pitch your topic in the best possible manner with this Knowledge Process Outsourcing Company Profile Revenue And Profit Of Call Centers Diagrams PDF. Use them to share invaluable insights on Revenue Increased, Profit Increased, Key Takeaways and impress your audience. This template can be altered and modified as per your expectations. So, grab it now.
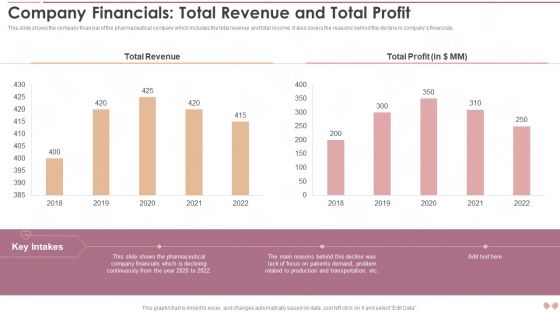
Innovative Business Model Of Pharmaceutical Company Financials Total Revenue And Total Profit Diagrams PDF
This slide shows the key impacts of the strategies on companys operations. It includes operational and environmental impacts such as accurate demand forecasting, reward research and development etc.Deliver and pitch your topic in the best possible manner with this Innovative Business Model Of Pharmaceutical Company Financials Total Revenue And Total Profit Diagrams PDF. Use them to share invaluable insights on Total Revenue, Total Profit, Related Production and impress your audience. This template can be altered and modified as per your expectations. So, grab it now.

IT Application Services Company Outline Revenue And Profit By Category Diagrams PDF
The slide highlights the historical revenue and profit for services and solutions. It also depicts revenue and profit split for services and solutions for current year along with key insights. Deliver and pitch your topic in the best possible manner with this IT Application Services Company Outline Revenue And Profit By Category Diagrams PDF. Use them to share invaluable insights on Revenue Split, Profit Split, Services and impress your audience. This template can be altered and modified as per your expectations. So, grab it now.
Process Enhancement Plan To Boost Sales Performance Website Performance Tracking And Monitoring Dashboard Diagrams PDF
The following slide showcases a dashboard to track and measure website performance. It includes key elements such as visits, average session duration, bounce rate, page views, goal conversion, visits by week, traffic sources, top channels by conversions, etc. From laying roadmaps to briefing everything in detail, our templates are perfect for you. You can set the stage with your presentation slides. All you have to do is download these easy to edit and customizable templates. Process Enhancement Plan To Boost Sales Performance Website Performance Tracking And Monitoring Dashboard Diagrams PDF will help you deliver an outstanding performance that everyone would remember and praise you for. Do download this presentation today.
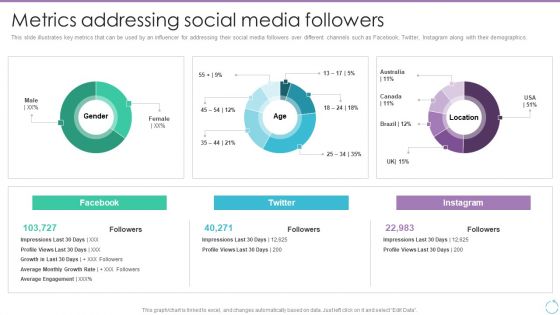
Personal Branding Plan For Executives Metrics Addressing Social Media Followers Diagrams PDF
This slide illustrates key metrics that can be used by an influencer for addressing their social media followers over different channels such as Facebook, Twitter, Instagram along with their demographics. The Personal Branding Plan For Executives Metrics Addressing Social Media Followers Diagrams PDF is a compilation of the most recent design trends as a series of slides. It is suitable for any subject or industry presentation, containing attractive visuals and photo spots for businesses to clearly express their messages. This template contains a variety of slides for the user to input data, such as structures to contrast two elements, bullet points, and slides for written information. Slidegeeks is prepared to create an impression.
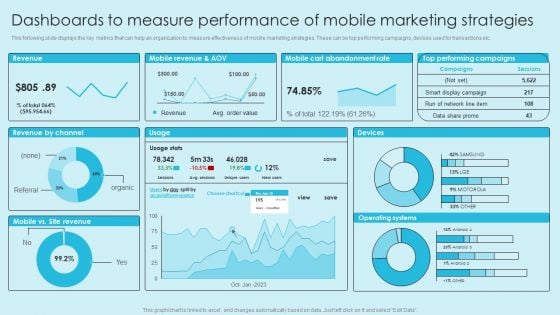
Online Marketing Techniques For Acquiring Clients Dashboards To Measure Performance Of Mobile Marketing Diagrams PDF
This following slide displays the key metrics that can help an organization to measure effectiveness of mobile marketing strategies. These can be top performing campaigns, devises used for transactions etc. Find a pre designed and impeccable Online Marketing Techniques For Acquiring Clients Dashboards To Measure Performance Of Mobile Marketing Diagrams PDF. The templates can ace your presentation without additional effort. You can download these easy to edit presentation templates to make your presentation stand out from others. So, what are you waiting for. Download the template from Slidegeeks today and give a unique touch to your presentation.
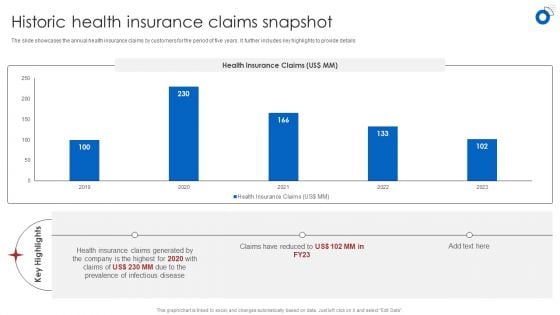
Insurance Business Financial Analysis Historic Health Insurance Claims Snapshot Diagrams PDF
The slide showcases the annual health insurance claims by customers for the period of five years. It further includes key highlights to provide details Boost your pitch with our creative Insurance Business Financial Analysis Historic Health Insurance Claims Snapshot Diagrams PDF. Deliver an awe-inspiring pitch that will mesmerize everyone. Using these presentation templates you will surely catch everyones attention. You can browse the ppts collection on our website. We have researchers who are experts at creating the right content for the templates. So you dont have to invest time in any additional work. Just grab the template now and use them.
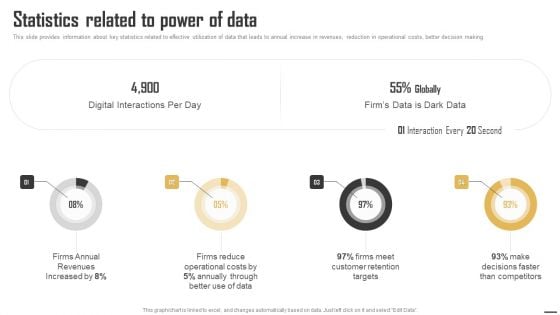
Data Monetization And Management Statistics Related To Power Of Data Diagrams PDF
This slide provides information about key statistics related to effective utilization of data that leads to annual increase in revenues, reduction in operational costs, better decision making. Find a pre-designed and impeccable Data Monetization And Management Statistics Related To Power Of Data Diagrams PDF. The templates can ace your presentation without additional effort. You can download these easy-to-edit presentation templates to make your presentation stand out from others. So, what are you waiting for Download the template from Slidegeeks today and give a unique touch to your presentation.
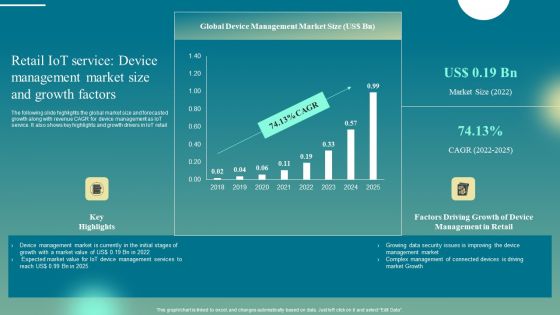
Retail Iot Service Device Management Market Size And Growth Factors Diagrams PDF
The following slide highlights the global market size and forecasted growth along with revenue CAGR for device management as IoT service. It also shows key highlights and growth drivers in IoT retail. If your project calls for a presentation, then Slidegeeks is your go-to partner because we have professionally designed, easy-to-edit templates that are perfect for any presentation. After downloading, you can easily edit Retail Iot Service Device Management Market Size And Growth Factors Diagrams PDF and make the changes accordingly. You can rearrange slides or fill them with different images. Check out all the handy templates
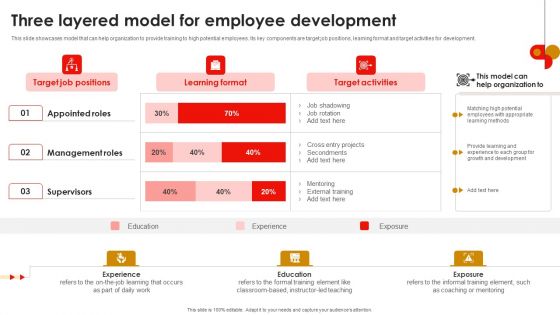
Strategic Talent Development Three Layered Model For Employee Development Diagrams PDF
This slide showcases model that can help organization to provide training to high potential employees. Its key components are target job positions, learning format and target activities for development. From laying roadmaps to briefing everything in detail, our templates are perfect for you. You can set the stage with your presentation slides. All you have to do is download these easy-to-edit and customizable templates. Strategic Talent Development Three Layered Model For Employee Development Diagrams PDF will help you deliver an outstanding performance that everyone would remember and praise you for. Do download this presentation today.
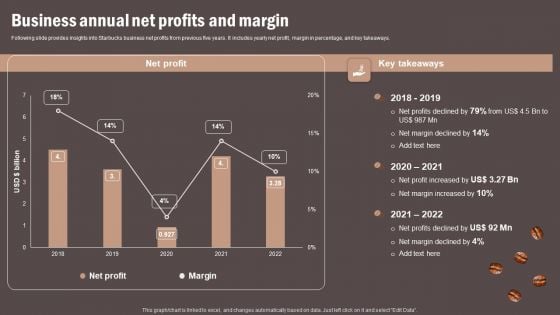
Coffee Cafe Company Profile Business Annual Net Profits And Margin Diagrams PDF
Following slide provides insights into Starbucks business net profits from previous five years. It includes yearly net profit, margin in percentage, and key takeaways. Want to ace your presentation in front of a live audience Our Coffee Cafe Company Profile Business Annual Net Profits And Margin Diagrams PDF can help you do that by engaging all the users towards you. Slidegeeks experts have put their efforts and expertise into creating these impeccable powerpoint presentations so that you can communicate your ideas clearly. Moreover, all the templates are customizable, and easy to edit and downloadable. Use these for both personal and commercial use.
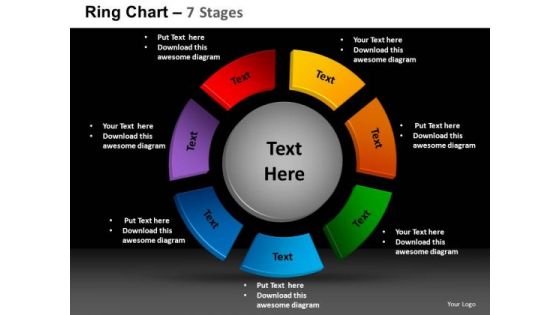
PowerPoint Design Slides Process Ring Chart Ppt Template
PowerPoint Design Slides Process Ring Chart PPT Template-These high quality powerpoint pre-designed slides and powerpoint templates have been carefully created by our professional team to help you impress your audience. All slides have been created and are 100% editable in powerpoint. Each and every property of any graphic - color, size, orientation, shading, outline etc. can be modified to help you build an effective powerpoint presentation. Any text can be entered at any point in the powerpoint template or slide. Simply DOWNLOAD, TYPE and PRESENT! Our PowerPoint Design Slides Process Ring Chart Ppt Template provide a key feature. They help the audience concentrate in your thoughts.
Defensive Brand Marketing Demonstrating Essential Brand Positioning Strategies Icons PDF
This slide provides information regarding key brand positioning strategies. The positioning strategies are categorized based on value, quality, competitor, benefit, celebrity-driven. Crafting an eye-catching presentation has never been more straightforward. Let your presentation shine with this tasteful yet straightforward Defensive Brand Marketing Demonstrating Essential Brand Positioning Strategies Icons PDF template. It offers a minimalistic and classy look that is great for making a statement. The colors have been employed intelligently to add a bit of playfulness while still remaining professional. Construct the ideal Defensive Brand Marketing Demonstrating Essential Brand Positioning Strategies Icons PDF that effortlessly grabs the attention of your audience Begin now and be certain to wow your customers.
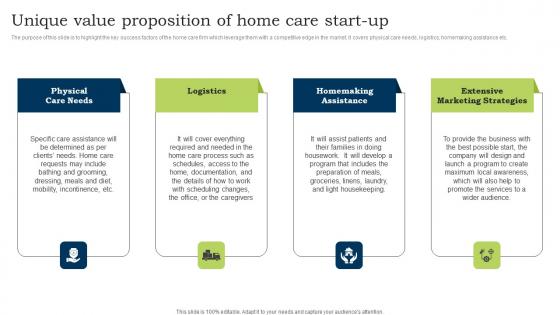
Go To Market Strategy Unique Value Proposition Of Home Care Start Up Professional Pdf
The purpose of this slide is to highlight the key success factors of the home care firm which leverage them with a competitive edge in the market. It covers physical care needs, logistics, homemaking assistance etc. Here you can discover an assortment of the finest PowerPoint and Google Slides templates. With these templates, you can create presentations for a variety of purposes while simultaneously providing your audience with an eye-catching visual experience. Download Go To Market Strategy Unique Value Proposition Of Home Care Start Up Professional Pdf to deliver an impeccable presentation. These templates will make your job of preparing presentations much quicker, yet still, maintain a high level of quality. Slidegeeks has experienced researchers who prepare these templates and write high-quality content for you. Later on, you can personalize the content by editing the Go To Market Strategy Unique Value Proposition Of Home Care Start Up Professional Pdf The purpose of this slide is to highlight the key success factors of the home care firm which leverage them with a competitive edge in the market. It covers physical care needs, logistics, homemaking assistance etc.
Intuition Technology Icon For User Information Ppt Show Aids PDF
The slide illustrate the integration of sixth sense technology with gaming industry to provide innovative and user engaging gaming experience. Key components are hand movements, 3D projection and physical exercise. Persuade your audience using this Intuition Technology Icon For User Information Ppt Show Aids PDF. This PPT design covers three stages, thus making it a great tool to use. It also caters to a variety of topics including Hand Movements, 3D Projection, Physical Exercise. Download this PPT design now to present a convincing pitch that not only emphasizes the topic but also showcases your presentation skills.
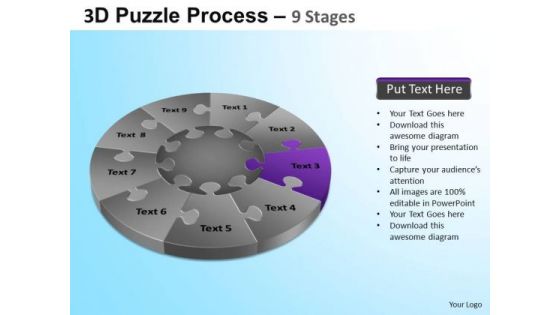
PowerPoint Slides Education Puzzle Segment Pie Chart Ppt Slide Designs
PowerPoint Slides Education Puzzle Segment Pie Chart PPT Slide Designs-These amazing PowerPoint pre-designed slides and PowerPoint templates have been carefully created by our team of experts to help you impress your audience. Our stunning collection of Powerpoint slides are 100% editable and can easily fit in any PowerPoint presentations. By using these animations and graphics in PowerPoint and you can easily make professional presentations. Any text can be entered at any point in the PowerPoint template or slide. Just DOWNLOAD our awesome PowerPoint templates and you are ready to go. Give due attention to key features. Filter out the unnecessary with our PowerPoint Slides Education Puzzle Segment Pie Chart Ppt Slide Designs.
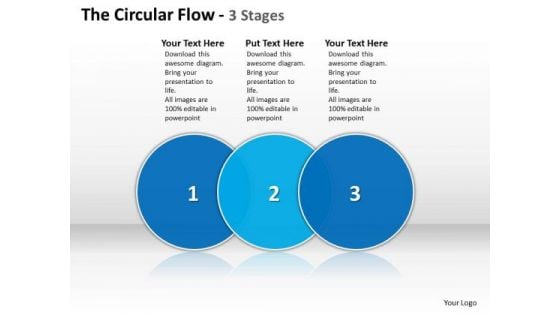
Ppt The Circular PowerPoint Menu Template Flow 3 State Diagram Templates
PPT the circular powerpoint menu template flow 3 state diagram Templates-Highlight the key point in selling process with this circular interpretation of 3 stages diagram-PPT the circular powerpoint menu template flow 3 state diagram Templates- Business, Concept, Conceptual, Corporate, Corporation, Decision, Director, Exceptional, Exclusive, First, Group, Individual, Isolated On White Background, Leader, Leadership, Level, Management, One, Only, Organization, Single, Singular, Sphere, Standout, Step, Strategy, Success, Symbol, Team, Teamwork, Unique Our Ppt The Circular PowerPoint Menu Template Flow 3 State Diagram Templates are really considerate. They give everyone equal attention.
Equity Funding And Debt Financing Pitchbook Services Provided By The Investment Bank Icons PDF
The slide comprises key services of the company which includes underwriting, general advisory, merger and acquisition advisory, asset management and sales and trading solutions. Create an editable Equity Funding And Debt Financing Pitchbook Services Provided By The Investment Bank Icons PDF that communicates your idea and engages your audience. Whether youre presenting a business or an educational presentation, pre-designed presentation templates help save time. Equity Funding And Debt Financing Pitchbook Services Provided By The Investment Bank Icons PDF is highly customizable and very easy to edit, covering many different styles from creative to business presentations. Slidegeeks has creative team members who have crafted amazing templates. So, go and get them without any delay.
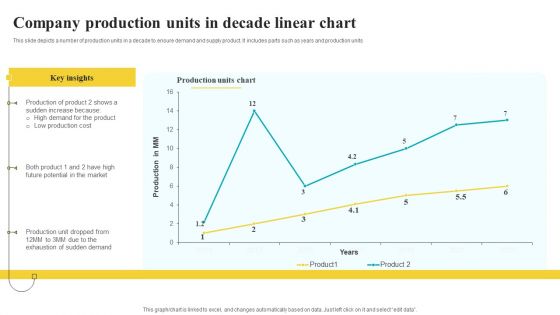
Company Production Units In Decade Linear Chart Designs PDF
This slide depicts a number of production units in a decade to ensure demand and supply product. It includes parts such as years and production units Pitch your topic with ease and precision using this Company Production Units In Decade Linear Chart Designs PDF. This layout presents information on Key Insights, Production Units Chart, Linear Chart. It is also available for immediate download and adjustment. So, changes can be made in the color, design, graphics or any other component to create a unique layout.
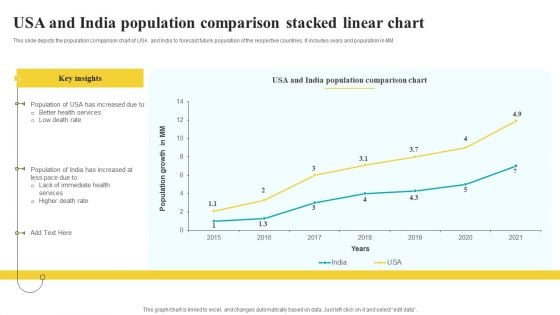
Usa And India Population Comparison Stacked Linear Chart Guidelines PDF
This slide depicts the population comparison chart of USA and India to forecast future population of the respective countries. It includes years and population in MM Pitch your topic with ease and precision using this Usa And India Population Comparison Stacked Linear Chart Guidelines PDF. This layout presents information on Key Insights, Population Growth, Comparison Chart. It is also available for immediate download and adjustment. So, changes can be made in the color, design, graphics or any other component to create a unique layout.
Problem Rise In Construction Defect Claims Ppt Icon Examples PDF
The slides shows the increase in the defect claims of ABC construction company from the years 2016 to 2020. It also provides the key notes for the explanation of the graph with main reasons behind the growth of defect claims. Deliver an awe inspiring pitch with this creative problem rise in construction defect claims ppt icon examples pdf bundle. Topics like material, design can be discussed with this completely editable template. It is available for immediate download depending on the needs and requirements of the user.
Corporate Digital Transformation Roadmap Budget Allocation For Digital Icons PDF
Purpose of the following slide is to show the budget for digital transformation as it highlights the key components of the budget along with the total amount allocated for the entire process. Deliver and pitch your topic in the best possible manner with this Corporate Digital Transformation Roadmap Budget Allocation For Digital Icons PDF Use them to share invaluable insights on Improve Security, Upgrading Network, Most Impotent Technology Investment and impress your audience. This template can be altered and modified as per your expectations. So, grab it now.
IT Application Services Company Outline Company Revenue Icons PDF
The slide shows annual revenue growth of the company with the CAGR for last five financial years from 2018 to 2022. It also highlights year on year growth along with key insights. Deliver and pitch your topic in the best possible manner with this IT Application Services Company Outline Company Revenue Icons PDF. Use them to share invaluable insights on Gross Profit Margin, Revenue, Business and impress your audience. This template can be altered and modified as per your expectations. So, grab it now.
VR Technology Market Overview Ppt PowerPoint Presentation Icon Example PDF
The following slide highlights VR technology market overview, including its growth drivers such as increase in smartphone penetration, post COVID-19 growth of virtual reality market and boost in gaming industry. Pitch your topic with ease and precision using this VR Technology Market Overview Ppt PowerPoint Presentation Icon Example PDF. This layout presents information on Growth Drivers, Key Takeaways, Exponential Virtual Reality. It is also available for immediate download and adjustment. So, changes can be made in the color, design, graphics or any other component to create a unique layout.
Allocating Budget For Performance Marketing Activities Icons PDF
This slide showcases budget allocation for performance marketing activities to run online promotional campaigns. Its key elements are Facebook ads, Instagram ads, Google display ads, YouTube ads etc. This modern and well-arranged Allocating Budget For Performance Marketing Activities Icons PDF provides lots of creative possibilities. It is very simple to customize and edit with the Powerpoint Software. Just drag and drop your pictures into the shapes. All facets of this template can be edited with Powerpoint, no extra software is necessary. Add your own material, put your images in the places assigned for them, adjust the colors, and then you can show your slides to the world, with an animated slide included.
Online Shopping Survey Outcome In Percentage Icons PDF
The slide showcases percentage results to analyze experience of online shopping to identify areas for enhancing shopping experience. It includes key elements such as reasons for online shopping, elements considered by customers and shopping platforms. Pitch your topic with ease and precision using this Online Shopping Survey Outcome In Percentage Icons PDF. This layout presents information on Price Comparison, Product Information, Online Reviews. It is also available for immediate download and adjustment. So, changes can be made in the color, design, graphics or any other component to create a unique layout.
Six Steps Layout Showing Corrective Action Plan For Business Problem Ppt PowerPoint Presentation Icon Display PDF
Persuade your audience using this six steps layout showing corrective action plan for business problem ppt powerpoint presentation icon display pdf. This PPT design covers six stages, thus making it a great tool to use. It also caters to a variety of topics including define the problem, describe key actions, plan a corrective action, implement the plan, find the root cause, define the scope, goal. Download this PPT design now to present a convincing pitch that not only emphasizes the topic but also showcases your presentation skills.
Business Intelligence And Big Transformation Toolkit Data Analysis Project Plan Icons PDF
The slide outline the key steps for data analytics methodology. It initiates with defining business objectives to data understanding, modelling and ends at data visualization and presentation. Presenting business intelligence and big transformation toolkit data analysis project plan icons pdf to provide visual cues and insights. Share and navigate important information on six stages that need your due attention. This template can be used to pitch topics like business issue understanding, data understanding, data preparation, exploratory analysis, modeling validation. In addtion, this PPT design contains high resolution images, graphics, etc, that are easily editable and available for immediate download.
Meal Kit Organization Marketing Marketing Business Case Ppt Styles Icons PDF
This slide shows case study for the firm including challenges and its solution after adopting marketing tool. It further includes area of concern, key point to resolve issue and the outcome. Persuade your audience using this Meal Kit Organization Marketing Marketing Business Case Ppt Styles Icons PDF. This PPT design covers three stages, thus making it a great tool to use. It also caters to a variety of topics including Challenge, Solution, Result. Download this PPT design now to present a convincing pitch that not only emphasizes the topic but also showcases your presentation skills.
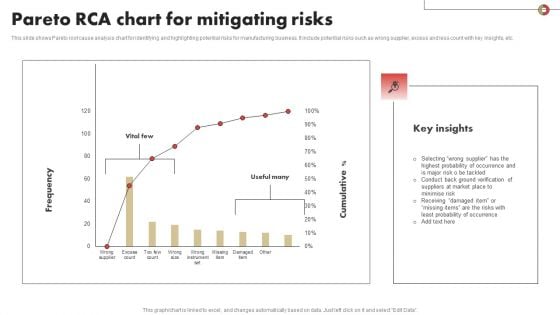
Pareto RCA Chart For Mitigating Risks Slides PDF
This slide shows Pareto root cause analysis chart for identifying and highlighting potential risks for manufacturing business. It include potential risks such as wrong supplier, excess and less count with key insights, etc. Pitch your topic with ease and precision using this Pareto RCA Chart For Mitigating Risks Slides PDF Download. This layout presents information on Mitigating, Pareto, Probability. It is also available for immediate download and adjustment. So, changes can be made in the color, design, graphics or any other component to create a unique layout.
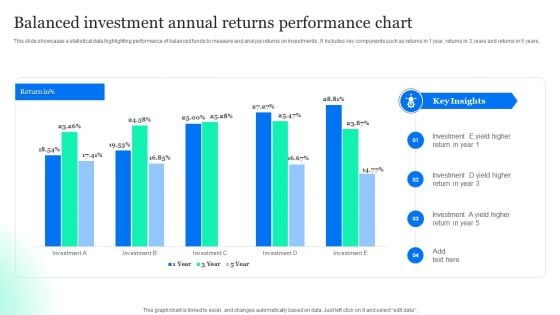
Balanced Investment Annual Returns Performance Chart Designs PDF
This slide showcases a statistical data highlighting performance of balanced funds to measure and analyze returns on investments . It includes key components such as returns in 1 year, returns in 3 years and returns in 5 years. Pitch your topic with ease and precision using this Balanced Investment Annual Returns Performance Chart Designs PDF. This layout presents information on Balanced Investment, Annual Returns, Performance Chart. It is also available for immediate download and adjustment. So, changes can be made in the color, design, graphics or any other component to create a unique layout.
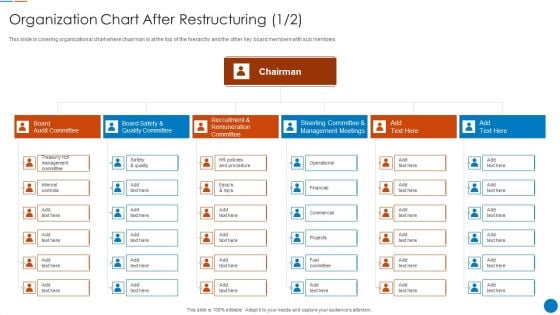
Organization Chart After Restructuring Organizational Restructuring Process Mockup PDF
This slide is covering organizational chart where chairman is at the top of the hierarchy and the other key board members with sub members Presenting Organization Chart After Restructuring Organizational Restructuring Process Mockup PDF to provide visual cues and insights. Share and navigate important information on six stages that need your due attention. This template can be used to pitch topics like Recruitment Remuneration Committee, Steerling Committee In addtion, this PPT design contains high resolution images, graphics, etc, that are easily editable and available for immediate download.
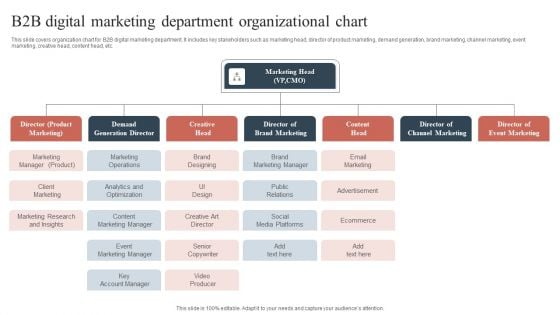
B2B Digital Marketing Department Organizational Chart Sample PDF
This slide covers organization chart for B2B digital marketing department. It includes key stakeholders such as marketing head, director of product marketing, demand generation, brand marketing, channel marketing, event marketing, creative head, content head, etc. Persuade your audience using this B2B Digital Marketing Department Organizational Chart Sample PDF. This PPT design covers six stages, thus making it a great tool to use. It also caters to a variety of topics including Marketing Operations, Brand Marketing Manager, Email Marketing. Download this PPT design now to present a convincing pitch that not only emphasizes the topic but also showcases your presentation skills.
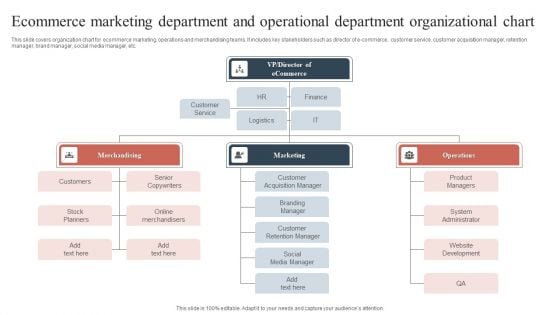
Ecommerce Marketing Department And Operational Department Organizational Chart Structure PDF
This slide covers organization chart for ecommerce marketing, operations and merchandising teams. It includes key stakeholders such as director of e commerce, customer service. customer acquisition manager, retention manager, brand manager, social media manager, etc. Persuade your audience using this Ecommerce Marketing Department And Operational Department Organizational Chart Structure PDF. This PPT design covers nine stages, thus making it a great tool to use. It also caters to a variety of topics including System Administrator, Stock Planners, Customer Acquisition Manager. Download this PPT design now to present a convincing pitch that not only emphasizes the topic but also showcases your presentation skills.


 Continue with Email

 Home
Home


