Key Themes
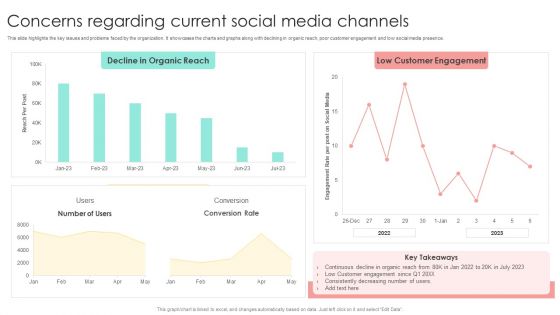
Media Advertising Concerns Regarding Current Social Media Channels Diagrams PDF
This slide highlights the key issues and problems faced by the organization. It showcases the charts and graphs along with declining in organic reach, poor customer engagement and low social media presence. If you are looking for a format to display your unique thoughts, then the professionally designed Media Advertising Concerns Regarding Current Social Media Channels Diagrams PDF is the one for you. You can use it as a Google Slides template or a PowerPoint template. Incorporate impressive visuals, symbols, images, and other charts. Modify or reorganize the text boxes as you desire. Experiment with shade schemes and font pairings. Alter, share or cooperate with other people on your work. Download Media Advertising Concerns Regarding Current Social Media Channels Diagrams PDF and find out how to give a successful presentation. Present a perfect display to your team and make your presentation unforgettable.
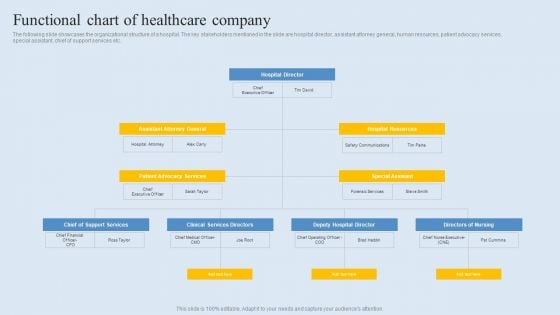
Functional Chart Of Healthcare Company Ideas PDF
Ppt Circle Arrow Process 7 Steps Free Fishbone Diagram PowerPoint Template Templates
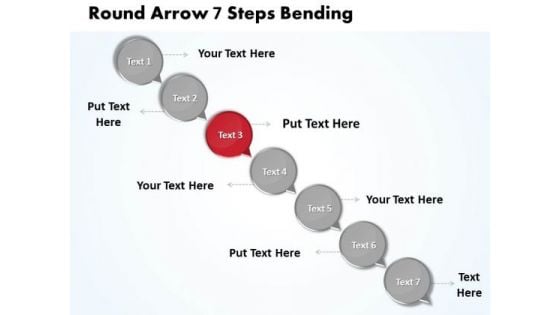
PPT circle arrow process 7 steps free fishbone diagram powerpoint template Templates-Deliver amazing Presentations with our above Diagram illustrating the Seven steps of the process to be explained in one single slide. This Diagram shows the Third stage with red color. Clarity of thought has been the key to your growth. Use our Diagram to illustrate your ability. You can change color, size and orientation of any icon to your liking. -PPT circle arrow process 7 steps free fishbone diagram powerpoint template Templates-Add, Aqua, Arrows, Badges, Bar, Blend, Blue, Bright, Bubbles, Buttons, Caution, Circle, Drop, Elements, Glossy, Glowing, Graphic, Heart, Help, Icons, Idea, Illustration, Navigation, Oblong, Plus, Round, Service, Shadow, Shiny, Sign, Speech, Squares Our Ppt Circle Arrow Process 7 Steps Free Fishbone Diagram PowerPoint Template Templates will keep u sane. Your thoughts will bolt across the line.
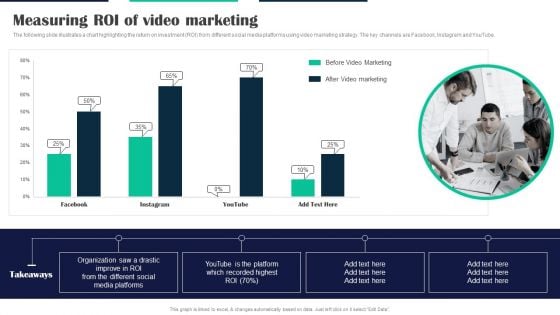
Executing Video Promotional Measuring Roi Of Video Marketing Diagrams PDF
The following slide illustrates a chart highlighting the return on investment ROI from different social media platforms using video marketing strategy. The key channels are Facebook, Instagram and YouTube. Welcome to our selection of the Executing Video Promotional Measuring Roi Of Video Marketing Diagrams PDF. These are designed to help you showcase your creativity and bring your sphere to life. Planning and Innovation are essential for any business that is just starting out. This collection contains the designs that you need for your everyday presentations. All of our PowerPoints are 100 percent editable, so you can customize them to suit your needs. This multi-purpose template can be used in various situations. Grab these presentation templates today.
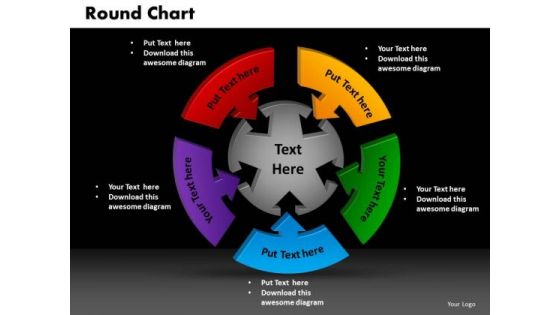
PowerPoint Template Round Chart Growth Ppt Presentation Designs
PowerPoint Template Round Chart Growth PPT Presentation Designs-Determine your targets and sequence them as per your priorities. Unravel each one for your audience while setting key timelines as you go along. Educate your listeners on the relevance and importance of each one as per your plan and how they all contribute as you strive to hit the Bullseye-PowerPoint Template Round Chart Growth PPT Presentation Designs-This ppt can be used for presentations relating to-3d, Answer, Arrow, Background, Business, Chance, Choice, Circular, Conceptual, Creative, Decision, Direction, Dollar, Entrance, Exit, Find, Game, Graphic, Help, Idea, Illustration, Inspiration, Intricacy, Isolated, Labyrinth, Marketing Our PowerPoint Template Round Chart Growth Ppt Presentation Designs are topically designed to impress. Use them to look like a presentation pro.
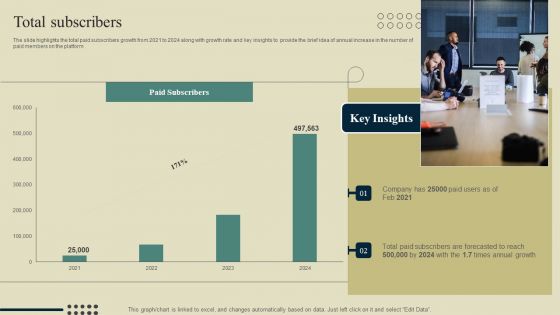
E Learning Platform Company Outline Total Subscribers Diagrams PDF
The slide highlights the total paid subscribers growth from 2021 to 2024 along with growth rate and key insights to provide the brief idea of annual increase in the number of paid members on the platform Do you have to make sure that everyone on your team knows about any specific topic I yes, then you should give E Learning Platform Company Outline Total Subscribers Diagrams PDF a try. Our experts have put a lot of knowledge and effort into creating this impeccable E Learning Platform Company Outline Total Subscribers Diagrams PDF. You can use this template for your upcoming presentations, as the slides are perfect to represent even the tiniest detail. You can download these templates from the Slidegeeks website and these are easy to edit. So grab these today.
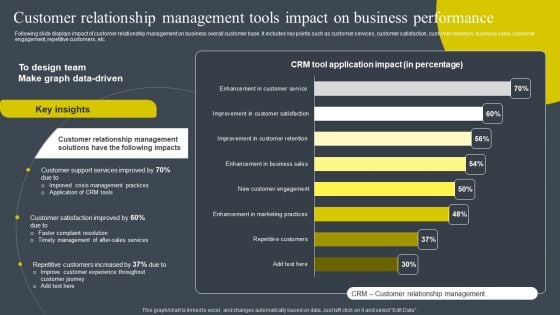
Customer Relationship Management Tools Impact On Business Performance Diagrams PDF
Following slide displays impact of customer relationship management on business overall customer base. It includes key points such as customer services, customer satisfaction, customer retention, business sales, customer engagement, repetitive customers, etc. Crafting an eye-catching presentation has never been more straightforward. Let your presentation shine with this tasteful yet straightforward Customer Relationship Management Tools Impact On Business Performance Diagrams PDF template. It offers a minimalistic and classy look that is great for making a statement. The colors have been employed intelligently to add a bit of playfulness while still remaining professional. Construct the ideal Customer Relationship Management Tools Impact On Business Performance Diagrams PDF that effortlessly grabs the attention of your audience Begin now and be certain to wow your customers
Business Diagram Clouds Icons Displaying Four Options Presentation Template
Our above diagram is designed with graphic of four clouds displaying four options. These clouds are designed with keys for text representation. Use this editable diagram for your cloud technology related presentations.
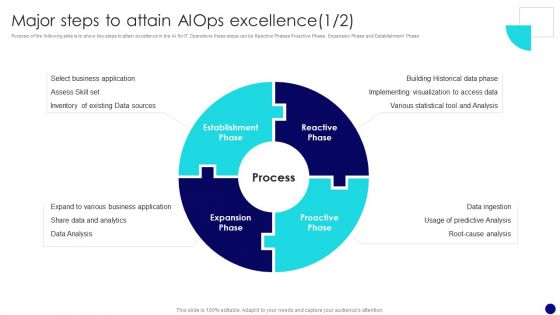
Information Technology Operations Administration With ML Major Steps To Attain Diagrams PDF
Purpose of the following slide is to show key steps to attain excellence in the AI for IT Operations these steps can be Reactive Phases Proactive Phase, Expansion Phase and Establishment Phase. Present like a pro with Information Technology Operations Administration With ML Major Steps To Attain Diagrams PDF Create beautiful presentations together with your team, using our easy to use presentation slides. Share your ideas in real time and make changes on the fly by downloading our templates. So whether you are in the office, on the go, or in a remote location, you can stay in sync with your team and present your ideas with confidence. With Slidegeeks presentation got a whole lot easier. Grab these presentations today.
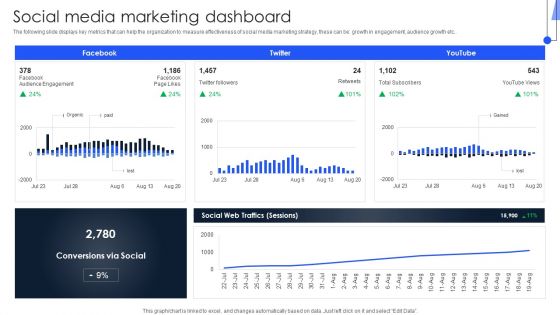
Implementing Marketing Strategies Social Media Marketing Dashboard Diagrams PDF
The following slide displays key metrics that can help the organization to measure effectiveness of social media marketing strategy, these can be growth in engagement, audience growth etc. Slidegeeks is here to make your presentations a breeze with Implementing Marketing Strategies Social Media Marketing Dashboard Diagrams PDF With our easy-to-use and customizable templates, you can focus on delivering your ideas rather than worrying about formatting. With a variety of designs to choose from, youre sure to find one that suits your needs. And with animations and unique photos, illustrations, and fonts, you can make your presentation pop. So whether youre giving a sales pitch or presenting to the board, make sure to check out Slidegeeks first.
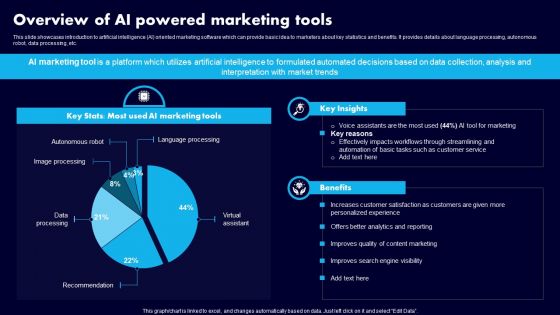
Overview Of AI Powered Marketing Tools Ppt Outline Diagrams PDF
This slide showcases introduction to artificial intelligence AI oriented marketing software which can provide basic idea to marketers about key statistics and benefits. It provides details about language processing, autonomous robot, data processing, etc. The Overview Of AI Powered Marketing Tools Ppt Outline Diagrams PDF is a compilation of the most recent design trends as a series of slides. It is suitable for any subject or industry presentation, containing attractive visuals and photo spots for businesses to clearly express their messages. This template contains a variety of slides for the user to input data, such as structures to contrast two elements, bullet points, and slides for written information. Slidegeeks is prepared to create an impression.
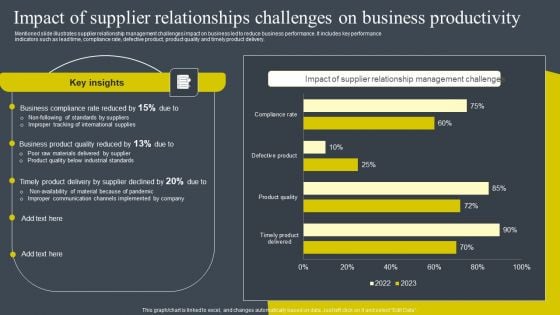
Impact Of Supplier Relationships Challenges On Business Productivity Diagrams PDF
Mentioned slide illustrates supplier relationship management challenges impact on business led to reduce business performance. It includes key performance indicators such as lead time, compliance rate, defective product, product quality and timely product delivery. The Impact Of Supplier Relationships Challenges On Business Productivity Diagrams PDF is a compilation of the most recent design trends as a series of slides. It is suitable for any subject or industry presentation, containing attractive visuals and photo spots for businesses to clearly express their messages. This template contains a variety of slides for the user to input data, such as structures to contrast two elements, bullet points, and slides for written information. Slidegeeks is prepared to create an impression.
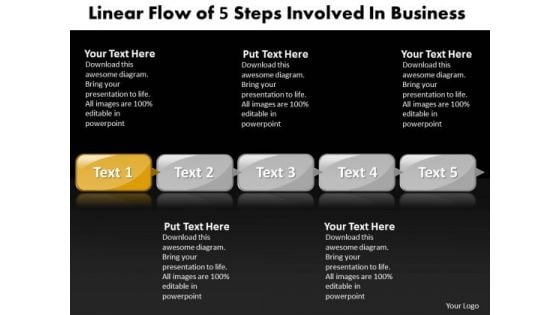
Ppt Continuous Demo Create Flow Chart PowerPoint Of Steps Templates
PPT continuous demo create flow chart powerpoint of steps Templates-The above diagram helps to highlight the key components of your entire business process. Communicate your concerns and educate your team along the path to success. This diagram has the unique ability to drive home your ideas and show how they mesh to guarantee success.-PPT continuous demo create flow chart powerpoint of steps Templates-Accent, Advertisement, Arrow, Badge, Banner, Blank, Business, Collection, Decoration, Design, Direction, Element, Empty, Financial, Flow, Graph, Horizontal, Instruction, Isolated, Label, Manual, Menu, Message, Placard, Process, Promo, Promotion, Sale, Set, Shape Our Ppt Continuous Demo Create Flow Chart PowerPoint Of Steps Templates will boost even a faint hope. They build up the belief in positive action.
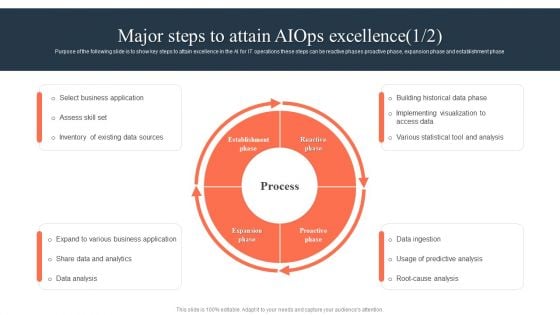
Ml And Big Data In Information Technology Processes Major Steps To Attain Aiops Excellence Summary PDF
Purpose of the following slide is to show key steps to attain excellence in the AI for IT operations these steps can be reactive phases proactive phase, expansion phase and establishment phase The Ml And Big Data In Information Technology Processes Major Steps To Attain Aiops Excellence Summary PDF is a compilation of the most recent design trends as a series of slides. It is suitable for any subject or industry presentation, containing attractive visuals and photo spots for businesses to clearly express their messages. This template contains a variety of slides for the user to input data, such as structures to contrast two elements, bullet points, and slides for written information. Slidegeeks is prepared to create an impression.
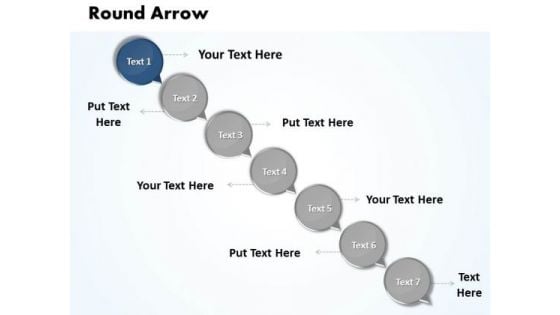
Ppt Connections Travel Text Circles 7 Steps Working With Slide Numbers Diagram PowerPoint Templates
PPT connections travel text circles 7 steps working with slide numbers diagram PowerPoint Templates-This Business Oriented Chart will definitely help you to be more Successful. Use this graphics as key element in streamlining your plans. It consists of Circular Bubbles connected together to form a complete process. This diagram is suitable for business and technical professionals who need to quickly and easily visualize, explore, and communicate information. -PPT connections travel text circles 7 steps working with slide numbers diagram PowerPoint Templates-Add, Aqua, Arrows, Badges, Bar, Blend, Blue, Bright, Bubbles, Buttons, Caution, Circle, Drop, Elements, Glossy, Glowing, Graphic, Heart, Help, Icons, Idea, Illustration, Navigation, Oblong, Plus, Round, Service, Shadow, Shiny, Sign, Speech, Squares Our Ppt Connections Travel Text Circles 7 Steps Working With Slide Numbers Diagram PowerPoint Templates team are an enduring lot. The further the distance, the better they become.
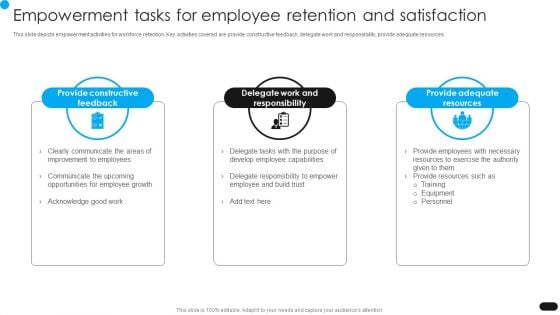
Workforce Engagement HR Plan Empowerment Tasks For Employee Retention And Satisfaction Formats PDF
This slide depicts empowerment activities for workforce retention. Key activities covered are provide constructive feedback, delegate work and responsibility, provide adequate resources. If you are looking for a format to display your unique thoughts, then the professionally designed Workforce Engagement HR Plan Empowerment Tasks For Employee Retention And Satisfaction Formats PDF is the one for you. You can use it as a Google Slides template or a PowerPoint template. Incorporate impressive visuals, symbols, images, and other charts. Modify or reorganize the text boxes as you desire. Experiment with shade schemes and font pairings. Alter, share or cooperate with other people on your work. Download Workforce Engagement HR Plan Empowerment Tasks For Employee Retention And Satisfaction Formats PDF and find out how to give a successful presentation. Present a perfect display to your team and make your presentation unforgettable.
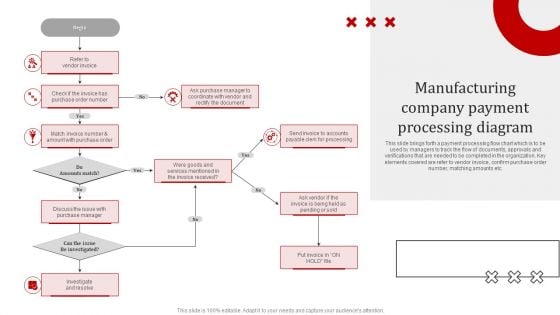
Manufacturing Company Payment Processing Diagram Guidelines PDF
This slide brings forth a payment processing flow chart which is to be used by managers to track the flow of documents, approvals and verifications that are needed to be completed in the organization. Key elements covered are refer to vendor invoice, confirm purchase order number, matching amounts etc. Persuade your audience using this Manufacturing Company Payment Processing Diagram Guidelines PDF. This PPT design covers one stages, thus making it a great tool to use. It also caters to a variety of topics including Investigate And Resolve, Payable Clerk For Processing, Purchase Manager, Coordinate With Vendor. Download this PPT design now to present a convincing pitch that not only emphasizes the topic but also showcases your presentation skills.
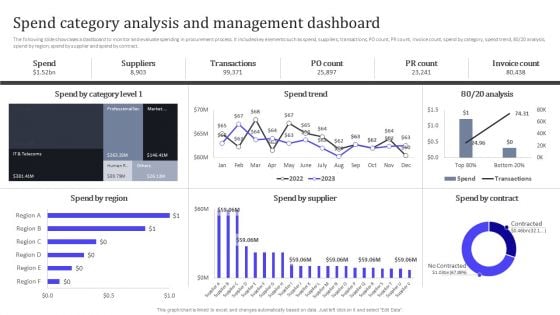
Spend Category Analysis And Management Dashboard Ppt PowerPoint Presentation Diagram PDF
The following slide showcases a dashboard to monitor and evaluate spending in procurement process. It includes key elements such as spend, suppliers, transactions, PO count, PR count, invoice count, spend by category, spend trend, 80 or 20 analysis, spend by region, spend by supplier and spend by contract. Do you have to make sure that everyone on your team knows about any specific topic I yes, then you should give Spend Category Analysis And Management Dashboard Ppt PowerPoint Presentation Diagram PDF a try. Our experts have put a lot of knowledge and effort into creating this impeccable Spend Category Analysis And Management Dashboard Ppt PowerPoint Presentation Diagram PDF. You can use this template for your upcoming presentations, as the slides are perfect to represent even the tiniest detail. You can download these templates from the Slidegeeks website and these are easy to edit. So grab these today.
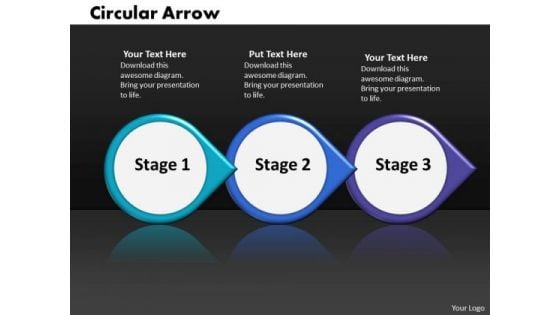
Ppt Continuous Work Flow Chart PowerPoint Of 3 Stages Circular Arrow Templates
PPT continuous work flow chart powerpoint of 3 stages circular arrow Templates-Use this PowerPoint Diagram to elaborate the Round Implementation through Circular Arrows. This Diagram portrays the concepts of arrows pointing, circled, activity, analysis, arrows, business, medical, science, health and shapes. Clarity of thought has been the key to your growth. Use our Diagram to illustrate your ability.-PPT continuous work flow chart powerpoint of 3 stages circular arrow Templates-3d, Abstract, Advertisement, Aim, Arrow, Business, Circular, Cursor, Direction, Down, Environment, Form, Glossy, Graphic, Icon, Illustration, Information, Mark, Motion, Perspective, Point, Sale, Shadow, Shape, Shiny, Sign Complete the circle with our Ppt Continuous Work Flow Chart PowerPoint Of 3 Stages Circular Arrow Templates. Explore every direction with your thoughts.
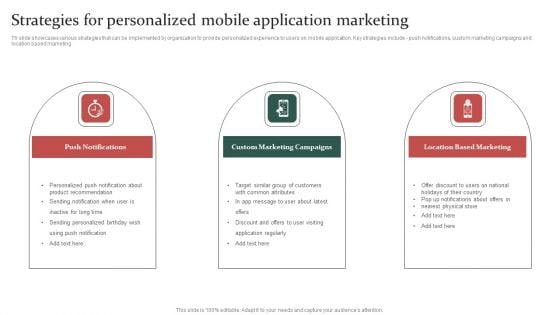
Gathering Customer Strategies For Personalized Mobile Application Marketing Microsoft PDF
Th slide showcases various strategies that can be implemented by organization to provide personalized experience to users on mobile application. Key strategies include - push notifications, custom marketing campaigns and location based marketing. Are you searching for a Gathering Customer Strategies For Personalized Mobile Application Marketing Microsoft PDF that is uncluttered, straightforward, and original Its easy to edit, and you can change the colors to suit your personal or business branding. For a presentation that expresses how much effort youve put in, this template is ideal With all of its features, including tables, diagrams, statistics, and lists, its perfect for a business plan presentation. Make your ideas more appealing with these professional slides. Download Gathering Customer Strategies For Personalized Mobile Application Marketing Microsoft PDF from Slidegeeks today.
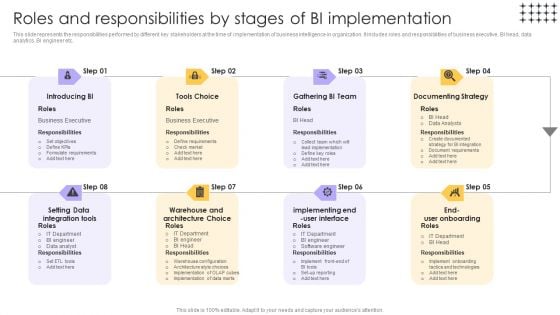
Tools For HR Business Analytics Roles And Responsibilities By Stages Of BI Implementation Guidelines PDF
This slide represents the responsibilities performed by different key stakeholders at the time of implementation of business intelligence in organization. It includes roles and responsibilities of business executive, BI head, data analytics, BI engineer etc. Are you searching for a Tools For HR Business Analytics Roles And Responsibilities By Stages Of BI Implementation Guidelines PDF that is uncluttered, straightforward, and original Its easy to edit, and you can change the colors to suit your personal or business branding. For a presentation that expresses how much effort youve put in, this template is ideal With all of its features, including tables, diagrams, statistics, and lists, its perfect for a business plan presentation. Make your ideas more appealing with these professional slides. Download Tools For HR Business Analytics Roles And Responsibilities By Stages Of BI Implementation Guidelines PDF from Slidegeeks today.
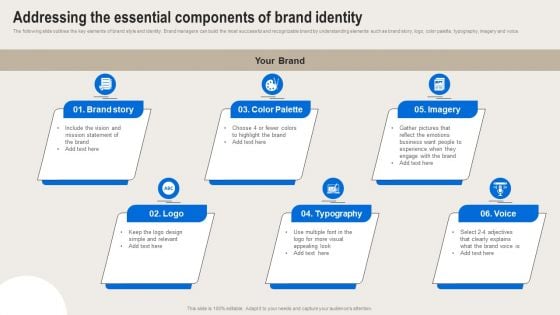
Formulating Branding Strategy To Enhance Revenue And Sales Addressing The Essential Components Of Brand Identity Background PDF
The following slide outlines the key elements of brand style and identity. Brand managers can build the most successful and recognizable brand by understanding elements such as brand story, logo, color palette, typography, imagery and voice. If you are looking for a format to display your unique thoughts, then the professionally designed Formulating Branding Strategy To Enhance Revenue And Sales Addressing The Essential Components Of Brand Identity Background PDF is the one for you. You can use it as a Google Slides template or a PowerPoint template. Incorporate impressive visuals, symbols, images, and other charts. Modify or reorganize the text boxes as you desire. Experiment with shade schemes and font pairings. Alter, share or cooperate with other people on your work. Download Formulating Branding Strategy To Enhance Revenue And Sales Addressing The Essential Components Of Brand Identity Background PDF and find out how to give a successful presentation. Present a perfect display to your team and make your presentation unforgettable.
Computer Folder Icon With Light Bulb Business PowerPoint Templates Ppt Backgrounds For Slides 1112
We present our Computer Folder Icon with Light Bulb Business PowerPoint Templates PPT Backgrounds for Slides 1112.Use our Light bulbs PowerPoint Templates because; Highlight the key components of your entire manufacturing/ business process. Use our Marketing PowerPoint Templates because, Now use this slide to bullet point your views. Use our Shapes PowerPoint Templates because, Many a core idea has various enveloping layers. Use our Success PowerPoint Templates because, you understand the illness and its causes. Use our Business PowerPoint Templates because, Marketing Strategy Business Template: - Maximizing sales of your product is the intended destination. Use these PowerPoint slides for presentations relating to Sketched icon set, light bulbs, marketing, shapes, success, and business. The prominent colors used in the PowerPoint template are White, Black, and Yellow Exercise your team with our Computer Folder Icon With Light Bulb Business PowerPoint Templates Ppt Backgrounds For Slides 1112. Get them up to face any challenge.
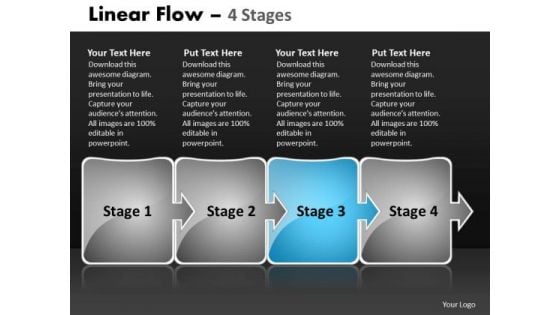
Ppt Arrow Progression Of Business Representation Video Workflow Diagram 4 Design
We present our PPT arrow progression of Business representation video workflow diagram 4 design. Use our Arrows PowerPoint Templates because, Emphasize on any critical or key factors within them. Use our Signs PowerPoint Templates because, You have the entire picture in mind. Use our Process and Flows PowerPoint Templates because, Be the cynosure of all eyes with our template depicting. Use our Metaphor PowerPoint Templates because; Highlight the important timelines and milestones of this exciting journey. Use our Business PowerPoint Templates because, You have a great training programmed in mind to upgrade the skills of your staff. Use these PowerPoint slides for presentations relating to Arrow, Background, Business, Chart, Diagram, Financial, Graphic, Gray, Icon, Illustration, Management, Orange, Perspective, Planning, Process, Stages, Steps, Text. The prominent colors used in the PowerPoint template are Blue, Gray, Black Take all factors into account. Take a cue from our Ppt Arrow Progression Of Business Representation Video Workflow Diagram 4 Design.
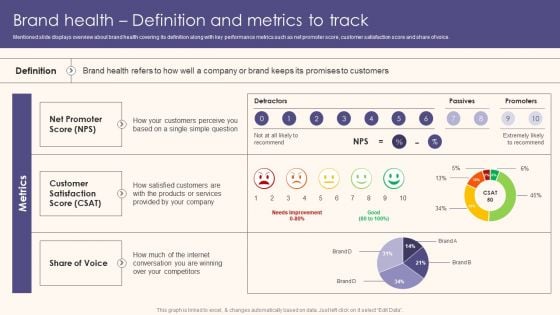
Brand Health Definition And Metrics To Track Background PDF
Mentioned slide displays overview about brand health covering its definition along with key performance metrics such as net promoter score, customer satisfaction score and share of voice.Presenting this PowerPoint presentation, titled Brand Health Definition And Metrics To Track Background PDF, with topics curated by our researchers after extensive research. This editable presentation is available for immediate download and provides attractive features when used. Download now and captivate your audience. Presenting this Brand Health Definition And Metrics To Track Background PDF. Our researchers have carefully researched and created these slides with all aspects taken into consideration. This is a completely customizable Brand Health Definition And Metrics To Track Background PDF that is available for immediate downloading. Download now and make an impact on your audience. Highlight the attractive features available with our PPTs.
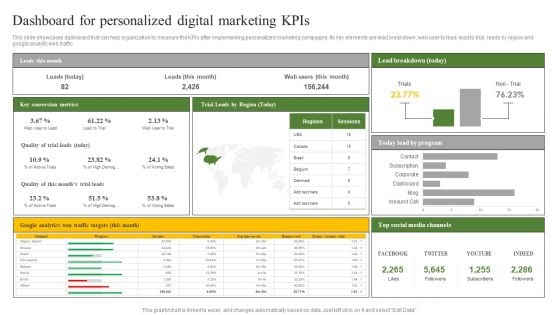
Dashboard For Personalized Digital Marketing Kpis Ppt Background Designs PDF
This slide showcases dashboard that can help organization to measure the KPIs after implementing personalized marketing campaigns. Its key elements are lead breakdown, web user to lead, lead to trial, leads by region and google analytic web traffic. Presenting this PowerPoint presentation, titled Dashboard For Personalized Digital Marketing Kpis Ppt Background Designs PDF, with topics curated by our researchers after extensive research. This editable presentation is available for immediate download and provides attractive features when used. Download now and captivate your audience. Presenting this Dashboard For Personalized Digital Marketing Kpis Ppt Background Designs PDF. Our researchers have carefully researched and created these slides with all aspects taken into consideration. This is a completely customizable Dashboard For Personalized Digital Marketing Kpis Ppt Background Designs PDF that is available for immediate downloading. Download now and make an impact on your audience. Highlight the attractive features available with our PPTs.
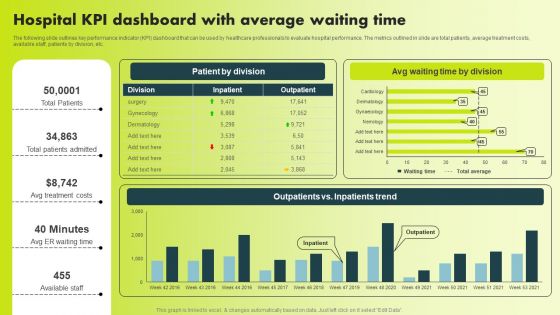
Hospital KPI Dashboard With Average Waiting Time Background PDF
The following slide outlines key performance indicator KPI dashboard that can be used by healthcare professionals to evaluate hospital performance. The metrics outlined in slide are total patients, average treatment costs, available staff, patients by division, etc. Slidegeeks is one of the best resources for PowerPoint templates. You can download easily and regulate Hospital KPI Dashboard With Average Waiting Time Background PDF for your personal presentations from our wonderful collection. A few clicks is all it takes to discover and get the most relevant and appropriate templates. Use our Templates to add a unique zing and appeal to your presentation and meetings. All the slides are easy to edit and you can use them even for advertisement purposes.
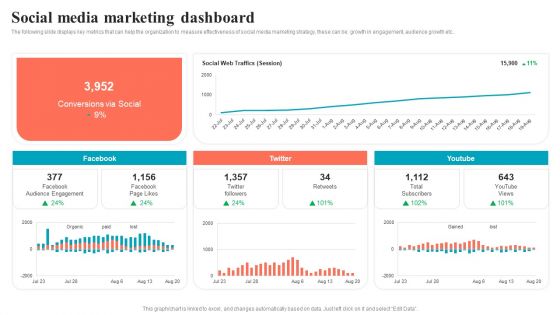
Brand Positioning Through Successful Social Media Marketing Dashboard Background PDF
The following slide displays key metrics that can help the organization to measure effectiveness of social media marketing strategy, these can be growth in engagement, audience growth etc. Do you have to make sure that everyone on your team knows about any specific topic I yes, then you should give Brand Positioning Through Successful Social Media Marketing Dashboard Background PDF a try. Our experts have put a lot of knowledge and effort into creating this impeccable Brand Positioning Through Successful Social Media Marketing Dashboard Background PDF. You can use this template for your upcoming presentations, as the slides are perfect to represent even the tiniest detail. You can download these templates from the Slidegeeks website and these are easy to edit. So grab these today.
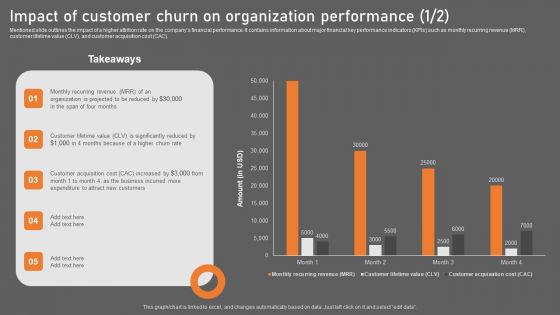
Impact Of Customer Churn On Organization Performance Background PDF
Mentioned slide outlines the impact of a higher attrition rate on the companys financial performance. It contains information about major financial key performance indicators KPIs such as monthly recurring revenue MRR, customer lifetime value CLV, and customer acquisition cost CAC. Take your projects to the next level with our ultimate collection of Impact Of Customer Churn On Organization Performance Background PDF. Slidegeeks has designed a range of layouts that are perfect for representing task or activity duration, keeping track of all your deadlines at a glance. Tailor these designs to your exact needs and give them a truly corporate look with your own brand colors they will make your projects stand out from the rest.
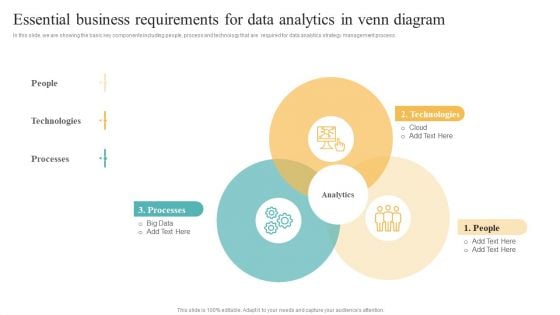
Transformation Toolkit Competitive Intelligence Information Analysis Essential Business Requirements For Data Analytics Summary PDF
In this slide, we are showing the basic key components including people, process and technology that are required for data analytics strategy management process. Present like a pro with Transformation Toolkit Competitive Intelligence Information Analysis Essential Business Requirements For Data Analytics Summary PDF Create beautiful presentations together with your team, using our easy to use presentation slides. Share your ideas in real time and make changes on the fly by downloading our templates. So whether you are in the office, on the go, or in a remote location, you can stay in sync with your team and present your ideas with confidence. With Slidegeeks presentation got a whole lot easier. Grab these presentations today.
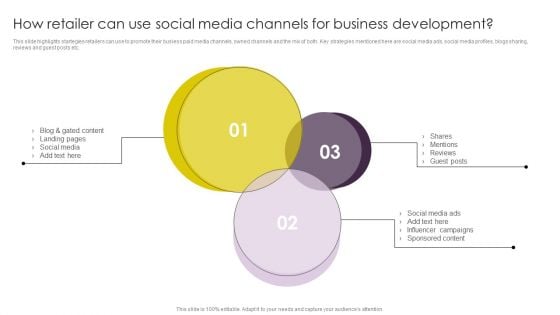
Implementing Digital Marketing How Retailer Can Use Social Media Channels For Business Information PDF
This slide highlights startegies retailers can use to promote their busiess paid media channels, owned channels and the mix of both. Key strategies mentioned here are social media ads, social media profiles, blogs sharing, reviews and guest posts etc. Get a simple yet stunning designed Implementing Digital Marketing How Retailer Can Use Social Media Channels For Business Information PDF. It is the best one to establish the tone in your meetings. It is an excellent way to make your presentations highly effective. So, download this PPT today from Slidegeeks and see the positive impacts. Our easy-to-edit Implementing Digital Marketing How Retailer Can Use Social Media Channels For Business Information PDF can be your go-to option for all upcoming conferences and meetings. So, what are you waiting for Grab this template today.

Recent Technologies In IT Industry Overview Of Mixed Reality MR Technology Ideas PDF
This slide provides an introduction of mixed reality technology, covering key features such as cloud-powered computer processing, advanced input techniques, and environmental perceptions. Find highly impressive Recent Technologies In IT Industry Overview Of Mixed Reality MR Technology Ideas PDF on Slidegeeks to deliver a meaningful presentation. You can save an ample amount of time using these presentation templates. No need to worry to prepare everything from scratch because Slidegeeks experts have already done a huge research and work for you. You need to download Recent Technologies In IT Industry Overview Of Mixed Reality MR Technology Ideas PDF for your upcoming presentation. All the presentation templates are 100 percent editable and you can change the color and personalize the content accordingly. Download now.
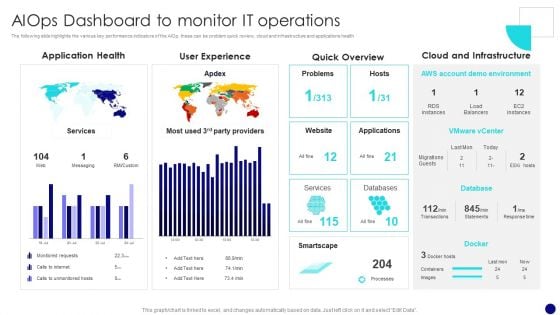
Information Technology Operations Administration With ML Aiops Dashboard To Monitor Diagrams PDF
The following slide highlights the various key performance indicators of the AIOp, these can be problem quick review, cloud and infrastructure and applications health. If you are looking for a format to display your unique thoughts, then the professionally designed Information Technology Operations Administration With ML Aiops Dashboard To Monitor Diagrams PDF is the one for you. You can use it as a Google Slides template or a PowerPoint template. Incorporate impressive visuals, symbols, images, and other charts. Modify or reorganize the text boxes as you desire. Experiment with shade schemes and font pairings. Alter, share or cooperate with other people on your work. Download Information Technology Operations Administration With ML Aiops Dashboard To Monitor Diagrams PDF and find out how to give a successful presentation. Present a perfect display to your team and make your presentation unforgettable.

Operational Strategy For ML In IT Sector Aiops Dashboard To Monitor IT Operations Diagrams PDF
The following slide highlights the various key performance indicators of the AIOps, these can be problem quick review, cloud and infrastructure and applications health If you are looking for a format to display your unique thoughts, then the professionally designed Operational Strategy For ML In IT Sector Aiops Dashboard To Monitor IT Operations Diagrams PDF is the one for you. You can use it as a Google Slides template or a PowerPoint template. Incorporate impressive visuals, symbols, images, and other charts. Modify or reorganize the text boxes as you desire. Experiment with shade schemes and font pairings. Alter, share or cooperate with other people on your work. Download Operational Strategy For ML In IT Sector Aiops Dashboard To Monitor IT Operations Diagrams PDF and find out how to give a successful presentation. Present a perfect display to your team and make your presentation unforgettable.

Mitigating Sales Risks With Strategic Action Planning Assessing Impact Of Sales Risk Management Diagrams PDF
The following slide highlights some key performance indicators KPIs to measure the influence of executing sales risk management strategies on revenue performance. It includes elements such as target attainment rate, gross profit, annual growth rate etc. If you are looking for a format to display your unique thoughts, then the professionally designed Mitigating Sales Risks With Strategic Action Planning Assessing Impact Of Sales Risk Management Diagrams PDF is the one for you. You can use it as a Google Slides template or a PowerPoint template. Incorporate impressive visuals, symbols, images, and other charts. Modify or reorganize the text boxes as you desire. Experiment with shade schemes and font pairings. Alter, share or cooperate with other people on your work. Download Mitigating Sales Risks With Strategic Action Planning Assessing Impact Of Sales Risk Management Diagrams PDF and find out how to give a successful presentation. Present a perfect display to your team and make your presentation unforgettable.
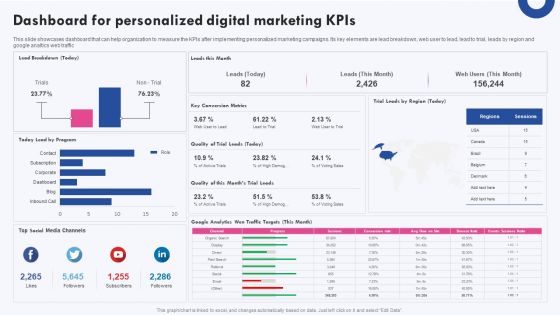
Targeted Marketing Campaigns To Improve Buyers Experience Dashboard For Personalized Digital Marketing Kpis Diagrams PDF
This slide showcases dashboard that can help organization to measure the KPIs after implementing personalized marketing campaigns. Its key elements are lead breakdown, web user to lead, lead to trial, leads by region and google analtics web traffic If you are looking for a format to display your unique thoughts, then the professionally designed Targeted Marketing Campaigns To Improve Buyers Experience Dashboard For Personalized Digital Marketing Kpis Diagrams PDF is the one for you. You can use it as a Google Slides template or a PowerPoint template. Incorporate impressive visuals, symbols, images, and other charts. Modify or reorganize the text boxes as you desire. Experiment with shade schemes and font pairings. Alter, share or cooperate with other people on your work. Download Targeted Marketing Campaigns To Improve Buyers Experience Dashboard For Personalized Digital Marketing Kpis Diagrams PDF and find out how to give a successful presentation. Present a perfect display to your team and make your presentation unforgettable.

Employee Training And Development Strategy 70 2010 Rule For Leadership Development Diagrams PDF
The slide showcases 70 20 10 rule which focuses on daily learning along with processional training program. Key focus area of this rule is to make employees learn through peers, social group, daily challenging tasks, etc. Presenting this PowerPoint presentation, titled Employee Training And Development Strategy 70 2010 Rule For Leadership Development Diagrams PDF, with topics curated by our researchers after extensive research. This editable presentation is available for immediate download and provides attractive features when used. Download now and captivate your audience. Presenting this Employee Training And Development Strategy 70 2010 Rule For Leadership Development Diagrams PDF. Our researchers have carefully researched and created these slides with all aspects taken into consideration. This is a completely customizable Employee Training And Development Strategy 70 2010 Rule For Leadership Development Diagrams PDF that is available for immediate downloading. Download now and make an impact on your audience. Highlight the attractive features available with our PPTs.
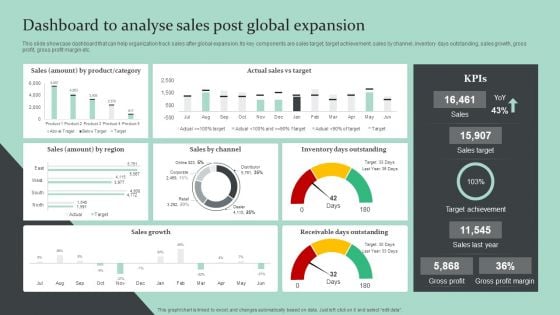
Strategic Global Expansion Business Plan Dashboard To Analyse Sales Post Global Expansion Diagrams PDF
This slide showcase dashboard that can help organization track sales after global expansion. Its key components are sales target, target achievement, sales by channel, inventory days outstanding, sales growth, gross profit, gross profit margin etc. Presenting this PowerPoint presentation, titled Strategic Global Expansion Business Plan Dashboard To Analyse Sales Post Global Expansion Diagrams PDF, with topics curated by our researchers after extensive research. This editable presentation is available for immediate download and provides attractive features when used. Download now and captivate your audience. Presenting this Strategic Global Expansion Business Plan Dashboard To Analyse Sales Post Global Expansion Diagrams PDF. Our researchers have carefully researched and created these slides with all aspects taken into consideration. This is a completely customizable Strategic Global Expansion Business Plan Dashboard To Analyse Sales Post Global Expansion Diagrams PDF that is available for immediate downloading. Download now and make an impact on your audience. Highlight the attractive features available with our PPTs.
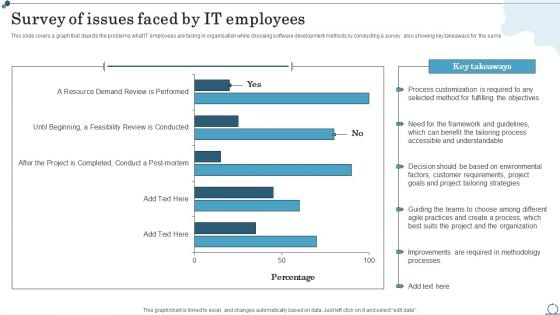
Survey Of Issues Faced By IT Employees Agile IT Methodology In Project Management Diagrams PDF
This slide covers a graph that depicts the problems what IT employees are facing in organisation while choosing software development methods by conducting a survey also showing key takeaways for the same.Get a simple yet stunning designed Survey Of Issues Faced By IT Employees Agile IT Methodology In Project Management Diagrams PDF. It is the best one to establish the tone in your meetings. It is an excellent way to make your presentations highly effective. So, download this PPT today from Slidegeeks and see the positive impacts. Our easy-to-edit Survey Of Issues Faced By IT Employees Agile IT Methodology In Project Management Diagrams PDF can be your go-to option for all upcoming conferences and meetings. So, what are you waiting for Grab this template today.
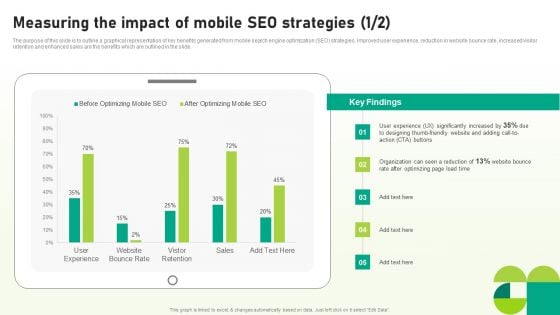
Utilizing SEO To Boost Customer Measuring The Impact Of Mobile SEO Strategies Diagrams PDF
The purpose of this slide is to outline a graphical representation of key benefits generated from mobile search engine optimization SEO strategies. Improved user experience, reduction in website bounce rate, increased visitor retention and enhanced sales are the benefits which are outlined in the slide. Explore a selection of the finest Utilizing SEO To Boost Customer Measuring The Impact Of Mobile SEO Strategies Diagrams PDF here. With a plethora of professionally designed and pre-made slide templates, you can quickly and easily find the right one for your upcoming presentation. You can use our Utilizing SEO To Boost Customer Measuring The Impact Of Mobile SEO Strategies Diagrams PDF to effectively convey your message to a wider audience. Slidegeeks has done a lot of research before preparing these presentation templates. The content can be personalized and the slides are highly editable. Grab templates today from Slidegeeks.
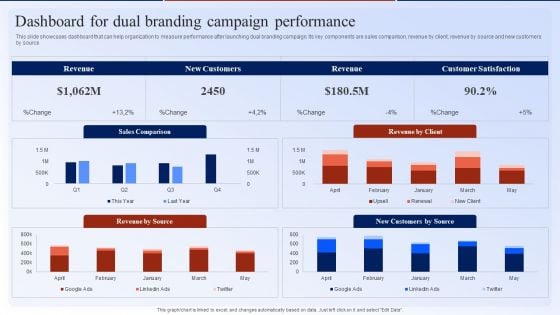
Dashboard For Dual Branding Campaign Performance Dual Branding Marketing Campaign Diagrams PDF
This slide showcases dashboard that can help organization to measure performance after launching dual branding campaign. Its key components are sales comparison, revenue by client, revenue by source and new customers by source. Here you can discover an assortment of the finest PowerPoint and Google Slides templates. With these templates, you can create presentations for a variety of purposes while simultaneously providing your audience with an eye-catching visual experience. Download Dashboard For Dual Branding Campaign Performance Dual Branding Marketing Campaign Diagrams PDF to deliver an impeccable presentation. These templates will make your job of preparing presentations much quicker, yet still, maintain a high level of quality. Slidegeeks has experienced researchers who prepare these templates and write high-quality content for you. Later on, you can personalize the content by editing the Dashboard For Dual Branding Campaign Performance Dual Branding Marketing Campaign Diagrams PDF.
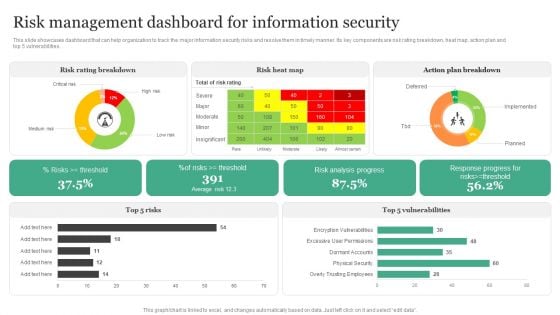
Risk Management Dashboard For Information Security Information Security Risk Administration Diagrams PDF
This slide showcases dashboard that can help organization to track the major information security risks and resolve them in timely manner. Its key components are risk rating breakdown, heat map, action plan and top 5 vulnerabilities.Create an editable Risk Management Dashboard For Information Security Information Security Risk Administration Diagrams PDF that communicates your idea and engages your audience. Whether you are presenting a business or an educational presentation, pre-designed presentation templates help save time. Risk Management Dashboard For Information Security Information Security Risk Administration Diagrams PDF is highly customizable and very easy to edit, covering many different styles from creative to business presentations. Slidegeeks has creative team members who have crafted amazing templates. So, go and get them without any delay.

Global Automotive Industry Research And Analysis Global Motor Vehicle Sales By Region Diagrams PDF
This slide covers a graphical representation of worldwide automobile sales for Europe, Asia, Africa, NAFTA, Central, and South America, etc. It also includes key insights about Chinese car sales expansion, USA sales, Indias sales, etc. Explore a selection of the finest Global Automotive Industry Research And Analysis Global Motor Vehicle Sales By Region Diagrams PDF here. With a plethora of professionally designed and pre made slide templates, you can quickly and easily find the right one for your upcoming presentation. You can use our Global Automotive Industry Research And Analysis Global Motor Vehicle Sales By Region Diagrams PDF to effectively convey your message to a wider audience. Slidegeeks has done a lot of research before preparing these presentation templates. The content can be personalized and the slides are highly editable. Grab templates today from Slidegeeks.
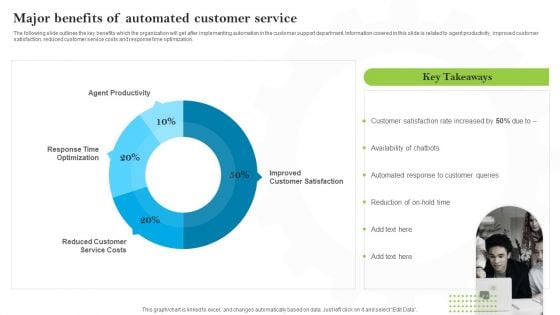
Introducing AI Tools Major Benefits Of Automated Customer Service Diagrams PDF
The following slide outlines the key benefits which the organization will get after implementing automation in the customer support department. Information covered in this slide is related to agent productivity, improved customer satisfaction, reduced customer service costs and response time optimization. Explore a selection of the finest Introducing AI Tools Major Benefits Of Automated Customer Service Diagrams PDF here. With a plethora of professionally designed and pre-made slide templates, you can quickly and easily find the right one for your upcoming presentation. You can use our Introducing AI Tools Major Benefits Of Automated Customer Service Diagrams PDF to effectively convey your message to a wider audience. Slidegeeks has done a lot of research before preparing these presentation templates. The content can be personalized and the slides are highly editable. Grab templates today from Slidegeeks.
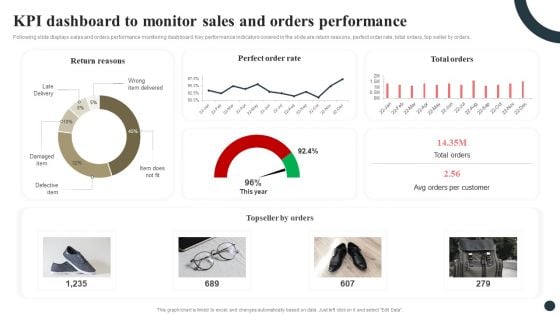
Strategic Guide For Positioning Expanded Brand KPI Dashboard To Monitor Sales And Orders Performance Diagrams PDF
Following slide displays sales and orders performance monitoring dashboard. Key performance indicators covered in the slide are return reasons, perfect order rate, total orders, top seller by orders. Crafting an eye-catching presentation has never been more straightforward. Let your presentation shine with this tasteful yet straightforward Strategic Guide For Positioning Expanded Brand KPI Dashboard To Monitor Sales And Orders Performance Diagrams PDF template. It offers a minimalistic and classy look that is great for making a statement. The colors have been employed intelligently to add a bit of playfulness while still remaining professional. Construct the ideal Strategic Guide For Positioning Expanded Brand KPI Dashboard To Monitor Sales And Orders Performance Diagrams PDF that effortlessly grabs the attention of your audience Begin now and be certain to wow your customers.
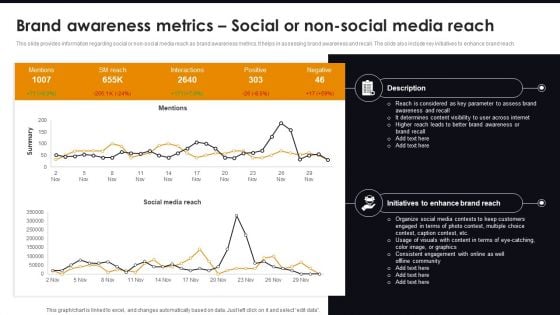
Brand Awareness Metrics Social Or Non-Social Media Reach Comprehensive Guide For Brand Recognition Diagrams PDF
This slide provides information regarding social or non-social media reach as brand awareness metrics. It helps in assessing brand awareness and recall. The slide also include key initiatives to enhance brand reach. Get a simple yet stunning designed Brand Awareness Metrics Social Or Non-Social Media Reach Comprehensive Guide For Brand Recognition Diagrams PDF. It is the best one to establish the tone in your meetings. It is an excellent way to make your presentations highly effective. So, download this PPT today from Slidegeeks and see the positive impacts. Our easy-to-edit Brand Awareness Metrics Social Or Non-Social Media Reach Comprehensive Guide For Brand Recognition Diagrams PDF can be your go-to option for all upcoming conferences and meetings. So, what are you waiting for Grab this template today.
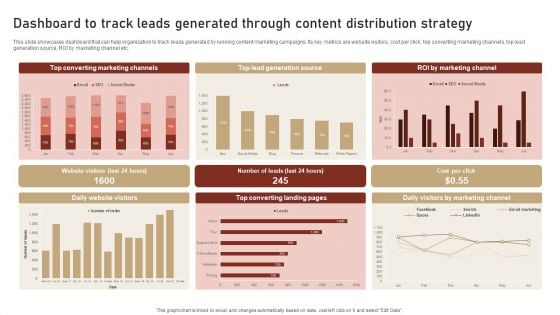
Content Delivery And Promotion Dashboard To Track Leads Generated Through Content Diagrams PDF
This slide showcases dashboard that can help organization to track leads generated by running content marketing campaigns. Its key metrics are website visitors, cost per click, top converting marketing channels, top lead generation source, ROI by marketing channel etc. Do you have an important presentation coming up Are you looking for something that will make your presentation stand out from the rest Look no further than Content Delivery And Promotion Dashboard To Track Leads Generated Through Content Diagrams PDF. With our professional designs, you can trust that your presentation will pop and make delivering it a smooth process. And with Slidegeeks, you can trust that your presentation will be unique and memorable. So why wait Grab Content Delivery And Promotion Dashboard To Track Leads Generated Through Content Diagrams PDF today and make your presentation stand out from the rest.
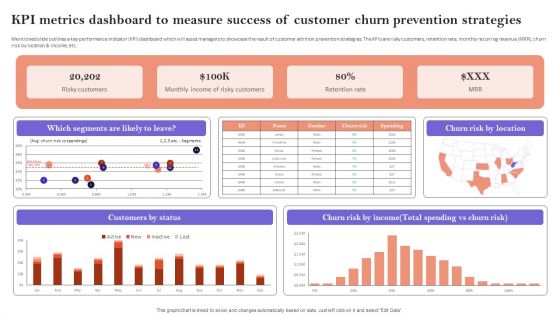
KPI Metrics Dashboard To Measure Success Of Customer Churn Prevention Strategies Diagrams PDF
Mentioned slide outlines a key performance indicator KPI dashboard which will assist managers to showcase the result of customer attrition prevention strategies. The KPIs are risky customers, retention rate, monthly recurring revenue MRR, churn risk by location and income, etc. This KPI Metrics Dashboard To Measure Success Of Customer Churn Prevention Strategies Diagrams PDF is perfect for any presentation, be it in front of clients or colleagues. It is a versatile and stylish solution for organizing your meetings. The KPI Metrics Dashboard To Measure Success Of Customer Churn Prevention Strategies Diagrams PDF features a modern design for your presentation meetings. The adjustable and customizable slides provide unlimited possibilities for acing up your presentation. Slidegeeks has done all the homework before launching the product for you. So, do not wait, grab the presentation templates today
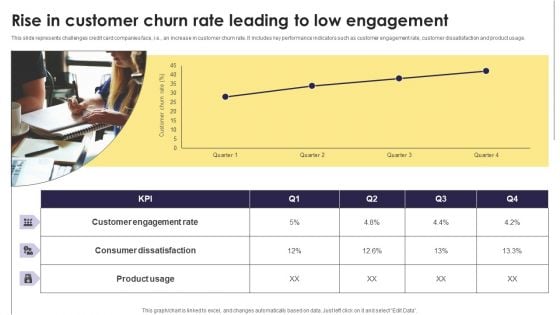
Implementation Of An Efficient Credit Card Promotion Plan Rise In Customer Churn Rate Leading Diagrams PDF
This slide represents challenges credit card companies face, i.e., an increase in customer churn rate. It includes key performance indicators such as customer engagement rate, customer dissatisfaction and product usage. Explore a selection of the finest Implementation Of An Efficient Credit Card Promotion Plan Rise In Customer Churn Rate Leading Diagrams PDF here. With a plethora of professionally designed and pre made slide templates, you can quickly and easily find the right one for your upcoming presentation. You can use our Implementation Of An Efficient Credit Card Promotion Plan Rise In Customer Churn Rate Leading Diagrams PDF to effectively convey your message to a wider audience. Slidegeeks has done a lot of research before preparing these presentation templates. The content can be personalized and the slides are highly editable. Grab templates today from Slidegeeks.
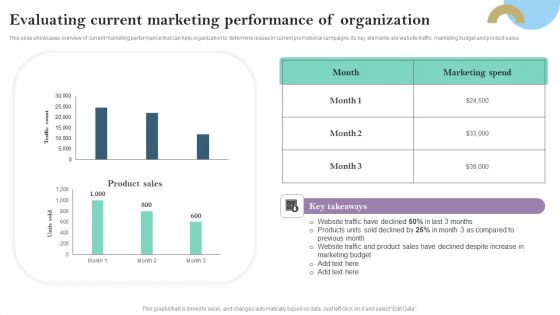
Evaluating Current Marketing Performance Of Organization Ppt PowerPoint Presentation Diagram Templates PDF
This slide showcases overview of current marketing performance that can help organization to determine issues in current promotional campaigns. Its key elements are website traffic, marketing budget and product sales Explore a selection of the finest Evaluating Current Marketing Performance Of Organization Ppt PowerPoint Presentation Diagram Templates PDF here. With a plethora of professionally designed and pre made slide templates, you can quickly and easily find the right one for your upcoming presentation. You can use our Evaluating Current Marketing Performance Of Organization Ppt PowerPoint Presentation Diagram Templates PDF to effectively convey your message to a wider audience. Slidegeeks has done a lot of research before preparing these presentation templates. The content can be personalized and the slides are highly editable. Grab templates today from Slidegeeks.
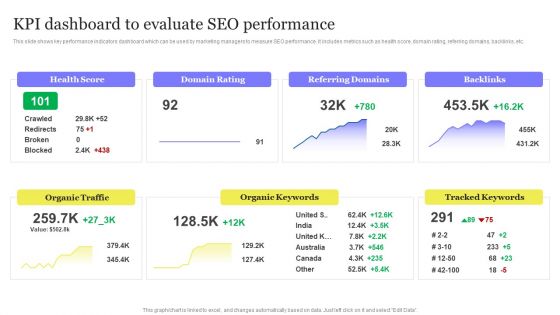
Enhancing Digital Visibility Using SEO Content Strategy KPI Dashboard To Evaluate SEO Performance Diagrams PDF
This slide shows key performance indicators dashboard which can be used by marketing managers to measure SEO performance. It includes metrics such as health score, domain rating, referring domains, backlinks, etc. This Enhancing Digital Visibility Using SEO Content Strategy KPI Dashboard To Evaluate SEO Performance Diagrams PDF is perfect for any presentation, be it in front of clients or colleagues. It is a versatile and stylish solution for organizing your meetings. The Enhancing Digital Visibility Using SEO Content Strategy KPI Dashboard To Evaluate SEO Performance Diagrams PDF features a modern design for your presentation meetings. The adjustable and customizable slides provide unlimited possibilities for acing up your presentation. Slidegeeks has done all the homework before launching the product for you. So, do not wait, grab the presentation templates today
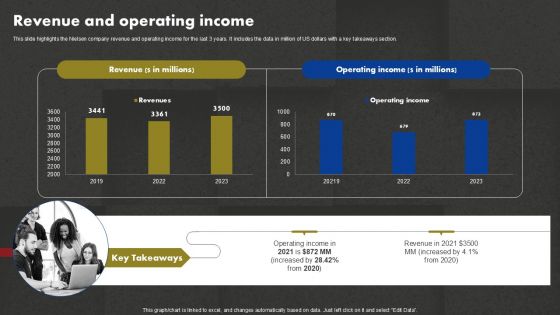
Data And Customer Analysis Company Outline Revenue And Operating Income Diagrams PDF
Enterprise SMS Marketing Subscribers Tracking Dashboard Ppt PowerPoint Presentation Diagram PDF
This slide represents the key metrics dashboard to monito and track the SMS marketing subscribers of the enterprise. It includes details related to KPIs such as total subscribers, new subscribers, total unsubscribes etc. Do you have an important presentation coming up Are you looking for something that will make your presentation stand out from the rest Look no further than Enterprise SMS Marketing Subscribers Tracking Dashboard Ppt PowerPoint Presentation Diagram PDF. With our professional designs, you can trust that your presentation will pop and make delivering it a smooth process. And with Slidegeeks, you can trust that your presentation will be unique and memorable. So why wait Grab Enterprise SMS Marketing Subscribers Tracking Dashboard Ppt PowerPoint Presentation Diagram PDF today and make your presentation stand out from the rest.
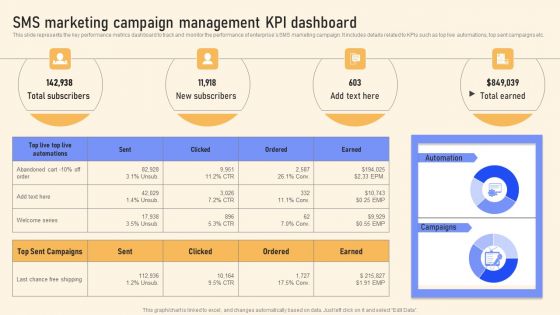
SMS Marketing Campaign Management KPI Dashboard Ppt PowerPoint Presentation Diagram Templates PDF
This slide represents the key performance metrics dashboard to track and monitor the performance of enterprises SMS marketing campaign. It includes details related to KPIs such as top live automations, top sent campaigns etc. Get a simple yet stunning designed SMS Marketing Campaign Management KPI Dashboard Ppt PowerPoint Presentation Diagram Templates PDF. It is the best one to establish the tone in your meetings. It is an excellent way to make your presentations highly effective. So, download this PPT today from Slidegeeks and see the positive impacts. Our easy to edit SMS Marketing Campaign Management KPI Dashboard Ppt PowerPoint Presentation Diagram Templates PDF can be your go to option for all upcoming conferences and meetings. So, what are you waiting for Grab this template today.
Impact Of Customer Churn On Organization Performance Icons PDF
Mentioned slide outlines the impact of a higher attrition rate on the companys financial performance. It contains information about major financial key performance indicators KPIs such as monthly recurring revenue MRR, customer lifetime value CLV, and customer acquisition cost CAC. If you are looking for a format to display your unique thoughts, then the professionally designed Impact Of Customer Churn On Organization Performance Icons PDF is the one for you. You can use it as a Google Slides template or a PowerPoint template. Incorporate impressive visuals, symbols, images, and other charts. Modify or reorganize the text boxes as you desire. Experiment with shade schemes and font pairings. Alter, share or cooperate with other people on your work. Download Impact Of Customer Churn On Organization Performance Icons PDF and find out how to give a successful presentation. Present a perfect display to your team and make your presentation unforgettable.
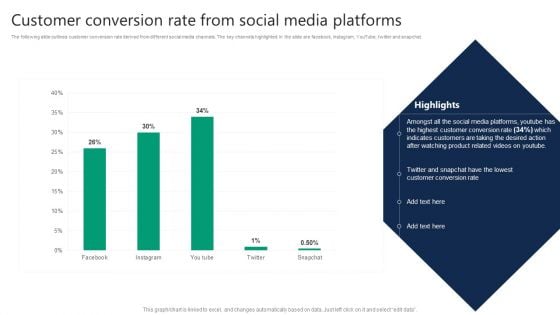
Formulating Video Marketing Strategies To Enhance Sales Customer Conversion Rate From Social Media Platforms Diagrams PDF
The following slide outlines customer conversion rate derived from different social media channels. The key channels highlighted in the slide are facebook, instagram, YouTube, twitter and snapchat. Are you in need of a template that can accommodate all of your creative concepts This one is crafted professionally and can be altered to fit any style. Use it with Google Slides or PowerPoint. Include striking photographs, symbols, depictions, and other visuals. Fill, move around, or remove text boxes as desired. Test out color palettes and font mixtures. Edit and save your work, or work with colleagues. Download Formulating Video Marketing Strategies To Enhance Sales Customer Conversion Rate From Social Media Platforms Diagrams PDF and observe how to make your presentation outstanding. Give an impeccable presentation to your group and make your presentation unforgettable.

Nielsen Business Profile Revenue And Operating Income Ppt PowerPoint Presentation Diagram PDF
This slide highlights the Nielsen company revenue and operating income for the last 3 years. It includes the data in million of US dollars with a key takeaways section. This Nielsen Business Profile Revenue And Operating Income Ppt PowerPoint Presentation Diagram PDF from Slidegeeks makes it easy to present information on your topic with precision. It provides customization options, so you can make changes to the colors, design, graphics, or any other component to create a unique layout. It is also available for immediate download, so you can begin using it right away. Slidegeeks has done good research to ensure that you have everything you need to make your presentation stand out. Make a name out there for a brilliant performance.
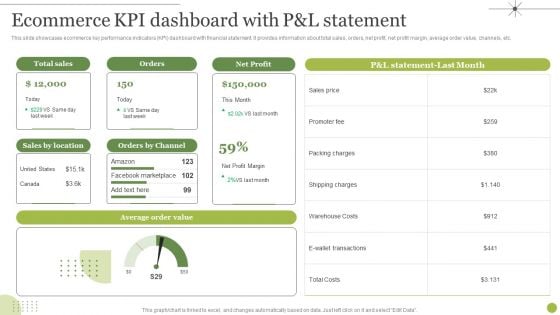
Managing E Commerce Business Accounting Ecommerce KPI Dashboard With P And L Statement Diagrams PDF
This slide showcases ecommerce key performance indicators KPI dashboard with financial statement. It provides information about total sales, orders, net profit, net profit margin, average order value, channels, etc. Present like a pro with Managing E Commerce Business Accounting Ecommerce KPI Dashboard With P And L Statement Diagrams PDF Create beautiful presentations together with your team, using our easy to use presentation slides. Share your ideas in real time and make changes on the fly by downloading our templates. So whether you are in the office, on the go, or in a remote location, you can stay in sync with your team and present your ideas with confidence. With Slidegeeks presentation got a whole lot easier. Grab these presentations today.
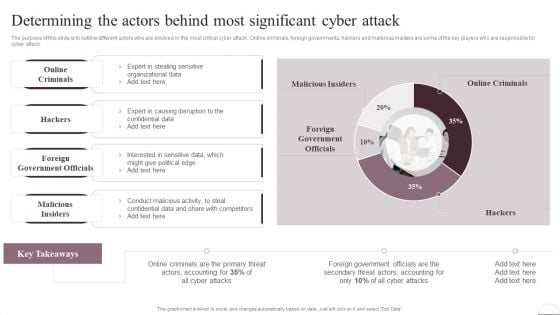
Prevention Of Information Determining The Actors Behind Most Significant Cyber Attack Diagrams PDF
The purpose of this slide is to outline different actors who are involved in the most critical cyber attack. Online criminals, foreign governments, hackers and malicious insiders are some of the key players who are responsible for cyber attack. Present like a pro with Prevention Of Information Determining The Actors Behind Most Significant Cyber Attack Diagrams PDF Create beautiful presentations together with your team, using our easy-to-use presentation slides. Share your ideas in real-time and make changes on the fly by downloading our templates. So whether youre in the office, on the go, or in a remote location, you can stay in sync with your team and present your ideas with confidence. With Slidegeeks presentation got a whole lot easier. Grab these presentations today.
Metrics For Tracking Effectiveness Of Safety Measures In The Organization Ppt PowerPoint Presentation File Diagrams PDF
The following slide showcases five safety metrics to monitor the effectiveness of current safety measures. Key KPIs inluded here are reported incidents, accident free days, cases of near misses, audit acore, BBS score etc. Want to ace your presentation in front of a live audience Our Metrics For Tracking Effectiveness Of Safety Measures In The Organization Ppt PowerPoint Presentation File Diagrams PDF can help you do that by engaging all the users towards you. Slidegeeks experts have put their efforts and expertise into creating these impeccable powerpoint presentations so that you can communicate your ideas clearly. Moreover, all the templates are customizable, and easy to edit and downloadable. Use these for both personal and commercial use.


 Continue with Email

 Home
Home


