Kpi 5
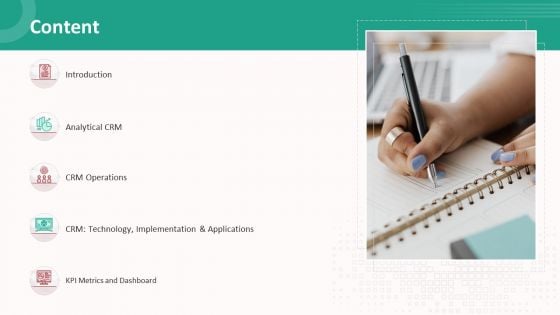
Customer Relationship Management Action Plan Content Graphics PDF
Presenting customer relationship management action plan content graphics pdf to provide visual cues and insights. Share and navigate important information on five stages that need your due attention. This template can be used to pitch topics like analytical crm, crm operations, kpi metrics and dashboard. In addtion, this PPT design contains high resolution images, graphics, etc, that are easily editable and available for immediate download.
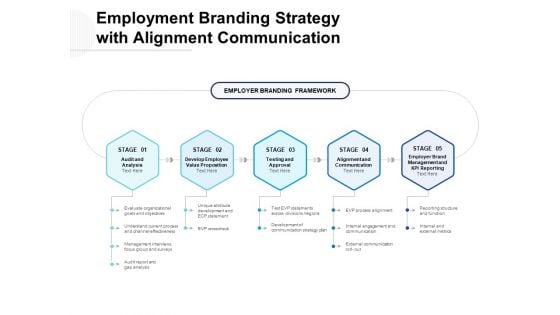
Employment Branding Strategy With Alignment Communication Ppt PowerPoint Presentation Gallery Introduction
Presenting this set of slides with name employment branding strategy with alignment communication ppt powerpoint presentation gallery introduction. This is a five stage process. The stages in this process are audit and analysis, develop employee value proposition, testing and approval, alignment and communication, employer brand management and kpi reporting. This is a completely editable PowerPoint presentation and is available for immediate download. Download now and impress your audience.
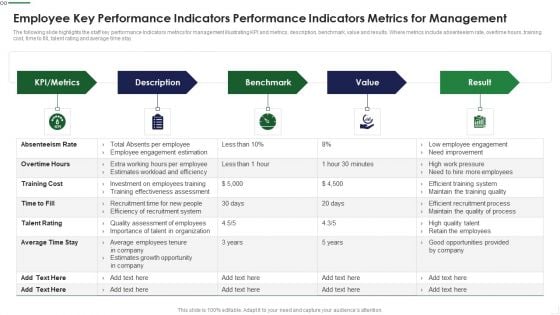
Employee Key Performance Indicators Performance Indicators Metrics For Management Professional PDF
The following slide highlights the staff key performance Indicators metrics for management illustrating KPI and metrics, description, benchmark, value and results. Where metrics include absenteeism rate, overtime hours, training cost, time to fill, talent rating and average time stay Presenting Employee Key Performance Indicators Performance Indicators Metrics For Management Professional PDF to dispense important information. This template comprises five stages. It also presents valuable insights into the topics including Employee Engagement, Recruitment System, Talent Organization This is a completely customizable PowerPoint theme that can be put to use immediately. So, download it and address the topic impactfully.
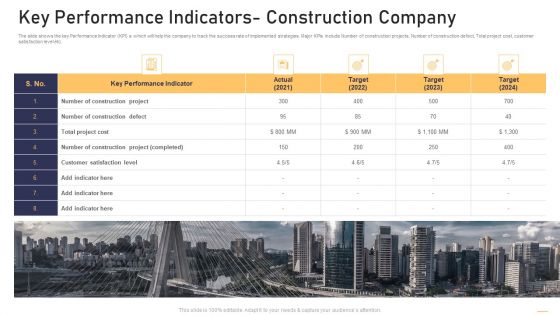
Surge In Construction Faults Lawsuits Case Competition Key Performance Indicators Construction Company Formats PDF
The slide shows the key Performance Indicator KPI s which will help the company to track the success rate of implemented strategies. Major KPIs include Number of construction projects, Number of construction defect, Total project cost, customer satisfaction level etc. Presenting surge in construction faults lawsuits case competition key performance indicators construction company formats pdf to provide visual cues and insights. Share and navigate important information on five stages that need your due attention. This template can be used to pitch topics like performance indicator, project cost, target, construction project. In addtion, this PPT design contains high resolution images, graphics, etc, that are easily editable and available for immediate download.
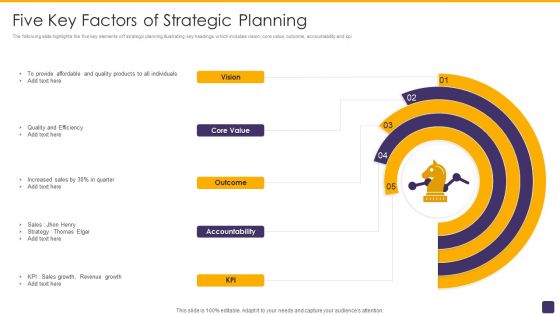
Five Key Factors Of Strategic Planning Template PDF
The following slide highlights the five key elements off strategic planning illustrating key headings which includes vision, core value, outcome, accountability and kpi Persuade your audience using this Five Key Factors Of Strategic Planning Template PDF. This PPT design covers five stages, thus making it a great tool to use. It also caters to a variety of topics including Objective, Scope, Advantage. Download this PPT design now to present a convincing pitch that not only emphasizes the topic but also showcases your presentation skills.
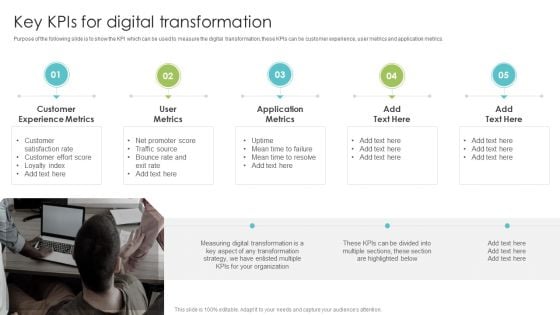
Playbook For Enterprise Transformation Administration Key Kpis For Digital Transformation Sample PDF
Purpose of the following slide is to show the KPI which can be used to measure the digital transformation, these KPIs can be customer experience, user metrics and application metrics. This is a Playbook For Enterprise Transformation Administration Key Kpis For Digital Transformation Sample PDF template with various stages. Focus and dispense information on five stages using this creative set, that comes with editable features. It contains large content boxes to add your information on topics like User Metrics, Application Metrics, Customer Experience Metrics. You can also showcase facts, figures, and other relevant content using this PPT layout. Grab it now.
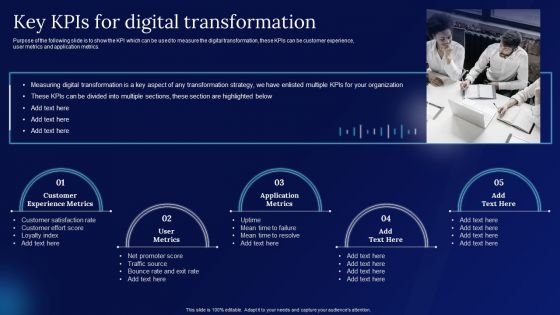
Digitalization Guide For Business Key Kpis For Digital Transformation Mockup PDF
Purpose of the following slide is to show the KPI which can be used to measure the digital transformation, these KPIs can be customer experience, user metrics and application metrics. This is a Digitalization Guide For Business Key Kpis For Digital Transformation Mockup PDF template with various stages. Focus and dispense information on five stages using this creative set, that comes with editable features. It contains large content boxes to add your information on topics like Measuring Digital, Transformation, Strategy Enlisted. You can also showcase facts, figures, and other relevant content using this PPT layout. Grab it now.
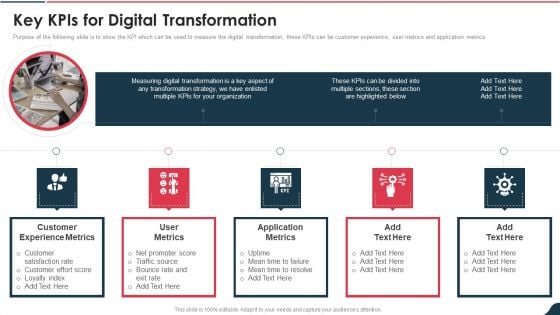
Electronic Playbook Key Kpis For Digital Transformation Infographics PDF
Purpose of the following slide is to show the KPI which can be used to measure the digital transformation, these KPIs can be customer experience, user metrics and application metrics. This is a electronic playbook key kpis for digital transformation infographics pdf template with various stages. Focus and dispense information on five stages using this creative set, that comes with editable features. It contains large content boxes to add your information on topics like customer experience metrics, application metrics, satisfaction rate customer You can also showcase facts, figures, and other relevant content using this PPT layout. Grab it now.
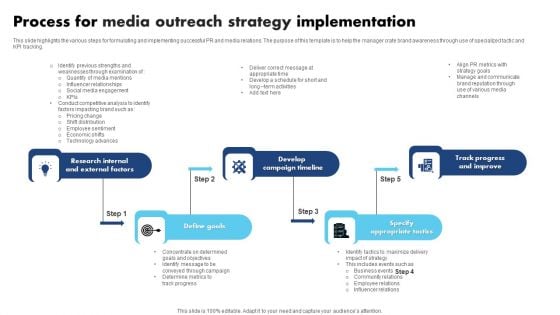
Process For Media Outreach Strategy Implementation Summary PDF
This slide highlights the various steps for formulating and implementing successful PR and media relations. The purpose of this template is to help the manager crate brand awareness through use of specialized tactic and KPI tracking. Presenting Process For Media Outreach Strategy Implementation Summary PDF to dispense important information. This template comprises five stages. It also presents valuable insights into the topics including Define Goals, Develop Campaign Timeline, Specify Appropriate Tactics. This is a completely customizable PowerPoint theme that can be put to use immediately. So, download it and address the topic impactfully.

Key Facts And Figures Of Global Devops Market Ppt Ideas Tips PDF
Following slide provides key facts and figures of global DevOps market. It shows that global DevOps market will grow with a CAGR greater than 20persent during 2020-26 period.This is a key facts and figures of global devops market ppt ideas tips pdf template with various stages. Focus and dispense information on five stages using this creative set, that comes with editable features. It contains large content boxes to add your information on topics like kpi dashboard for monitoring project progress You can also showcase facts, figures, and other relevant content using this PPT layout. Grab it now.
Marketers Guide To Data Analysis Optimization Tracking Followers Count To Improve User Engagement Clipart PDF
This slide covers an overview of the follower count KPI to identify the number of users following the account on social media platforms. It also includes strategies to increase followers, such as throwing contests, posting exclusive content, and partnering with influencers. Slidegeeks is one of the best resources for PowerPoint templates. You can download easily and regulate Marketers Guide To Data Analysis Optimization Tracking Followers Count To Improve User Engagement Clipart PDF for your personal presentations from our wonderful collection. A few clicks is all it takes to discover and get the most relevant and appropriate templates. Use our Templates to add a unique zing and appeal to your presentation and meetings. All the slides are easy to edit and you can use them even for advertisement purposes.
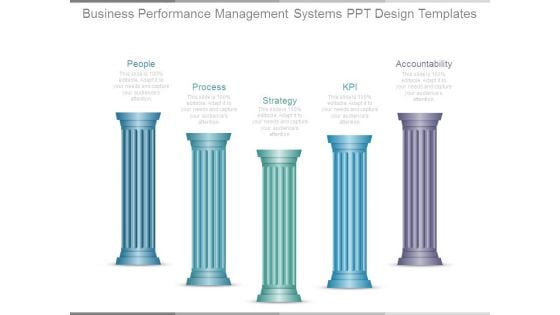
Business Performance Management Systems Ppt Design Templates
This is a business performance management systems ppt design templates. This is a five stage process. The stages in this process are people, process, strategy, kpi, accountability.
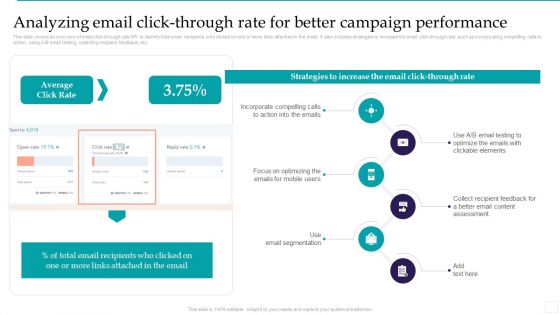
Analyzing Email Click Through Rate For Better Campaign Performance Slides PDF
This slide covers an overview of email click through rate KPI to identify total email recipients who clicked on one or more links attached in the email. It also includes strategies to increase the email click through rate, such as incorporating compelling calls to action, using A or B email testing, collecting recipient feedback, etc. If you are looking for a format to display your unique thoughts, then the professionally designed Analyzing Email Click Through Rate For Better Campaign Performance Slides PDF is the one for you. You can use it as a Google Slides template or a PowerPoint template. Incorporate impressive visuals, symbols, images, and other charts. Modify or reorganize the text boxes as you desire. Experiment with shade schemes and font pairings. Alter, share or cooperate with other people on your work. Download Analyzing Email Click Through Rate For Better Campaign Performance Slides PDF and find out how to give a successful presentation. Present a perfect display to your team and make your presentation unforgettable.
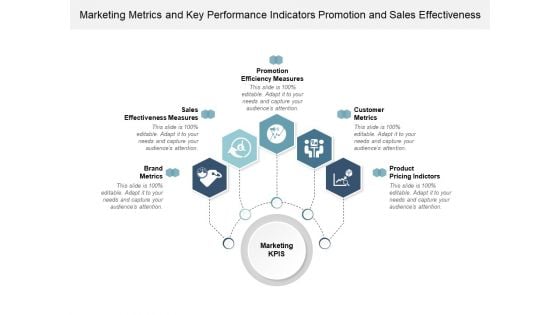
Marketing Metrics And Key Performance Indicators Promotion And Sales Effectiveness Ppt Powerpoint Presentation Infographics Graphics Example
This is a marketing metrics and key performance indicators promotion and sales effectiveness ppt powerpoint presentation infographics graphics example. This is a five stage process. The stages in this process are dashboard, kpi, metrics.
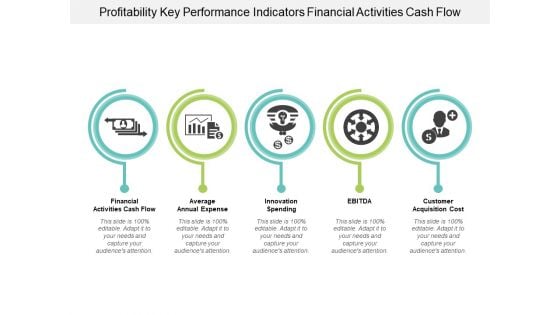
Profitability Key Performance Indicators Financial Activities Cash Flow Ppt Powerpoint Presentation Portfolio Clipart Images
This is a profitability key performance indicators financial activities cash flow ppt powerpoint presentation portfolio clipart images. This is a five stage process. The stages in this process are dashboard, kpi, metrics.
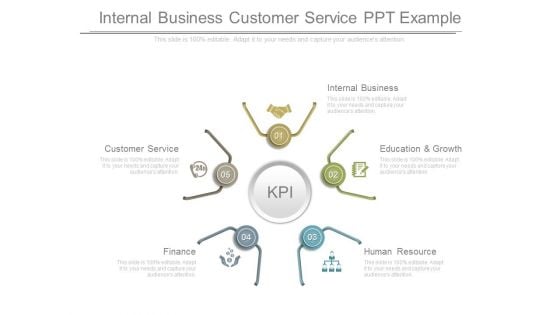
Internal Business Customer Service Ppt Example
This is a internal business customer service ppt example. This is a five stage process. The stages in this process are internal business, education and growth, human resource, finance, customer service, kpi.
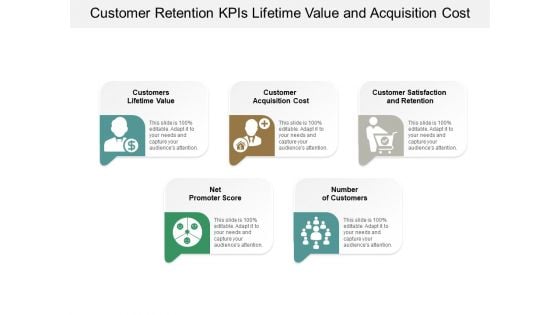
Customer Retention Kpis Lifetime Value And Acquisition Cost Ppt Powerpoint Presentation Model Samples
This is a customer retention kpis lifetime value and acquisition cost ppt powerpoint presentation model samples. This is a five stage process. The stages in this process are dashboard, kpi, metrics.
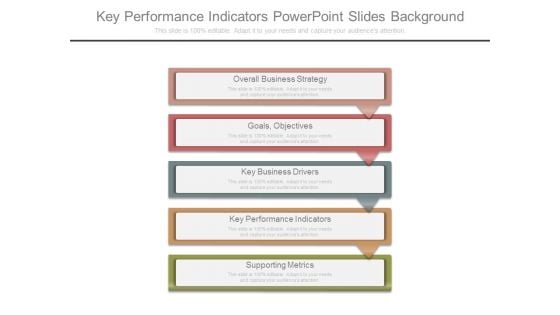
Key Performance Indicators Powerpoint Slides Background
This is a key performance indicators powerpoint slides background. This is a five stage process. The stages in this process are overall business strategy, goals, objectives, key business drivers, key performance indicators, supporting metrics.
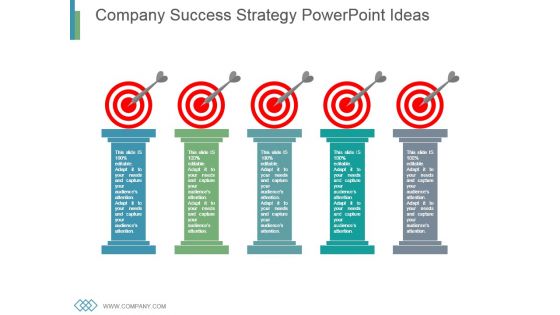
Company Success Strategy Powerpoint Ideas
This is a company success strategy powerpoint ideas. This is a five stage process. The stages in this process are business, marketing, success, strategy, target.
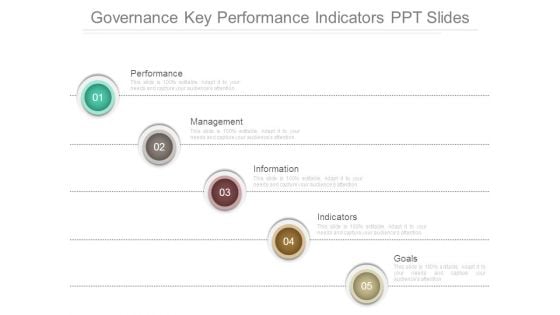
Governance Key Performance Indicators Ppt Slides
This is a governance key performance indicators ppt slides. This is a five stage process. The stages in this process are performance, management, information, indicators, goals.
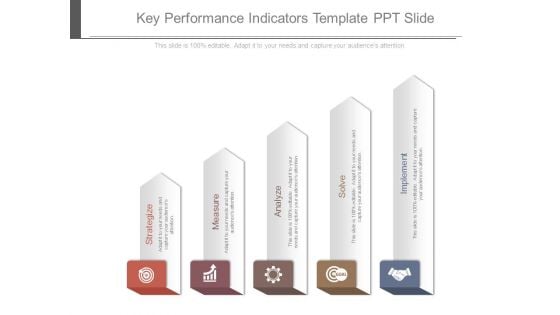
Key Performance Indicators Template Ppt Slide
This is a key performance indicators template ppt slide. This is a five stage process. The stages in this process are strategize, measure, analyze, solve, implement.
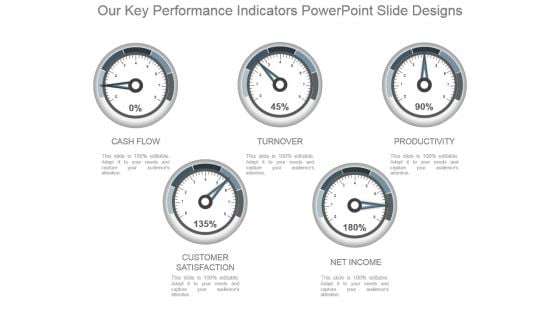
Our Key Performance Indicators Powerpoint Slide Designs
This is a our key performance indicators powerpoint slide designs. This is a five stage process. The stages in this process are cash flow, turnover, productivity, customer satisfaction, net income.
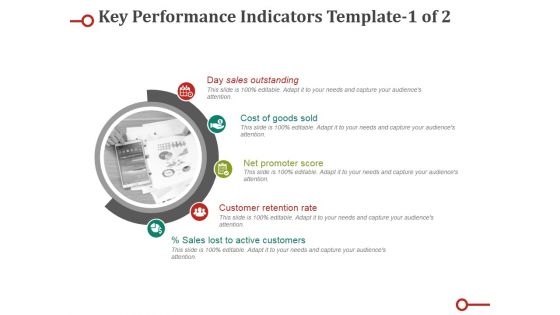
Key Performance Indicators Template Ppt PowerPoint Presentation Professional Diagrams
This is a key performance indicators template ppt powerpoint presentation professional diagrams. This is a five stage process. The stages in this process are day sales outstanding, cost of goods sold, net promoter score, customer retention rate, sales lost to active customers.
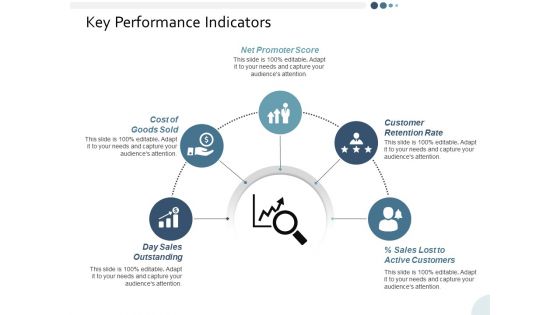
Key Performance Indicators Ppt PowerPoint Presentation Gallery Gridlines
This is a key performance indicators ppt powerpoint presentation gallery gridlines. This is a five stage process. The stages in this process are business, management, strategy, analysis, icons.
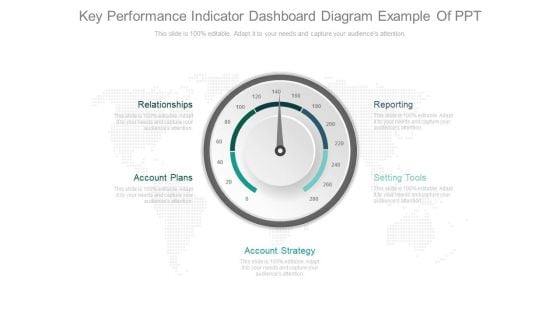
Key Performance Indicator Dashboard Diagram Example Of Ppt
This is a key performance indicator dashboard diagram example of ppt. This is a five stage process. The stages in this process are relationships, account plans, account strategy, setting tools, reporting.
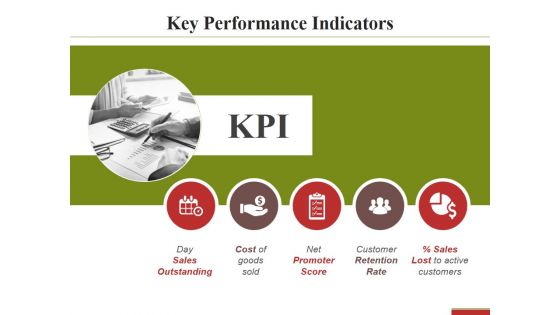
Key Performance Indicators Template 2 Ppt PowerPoint Presentation Pictures Slide
This is a key performance indicators template 2 ppt powerpoint presentation pictures slide. This is a five stage process. The stages in this process are day sales outstanding, cost of goods sold, net promoter score.
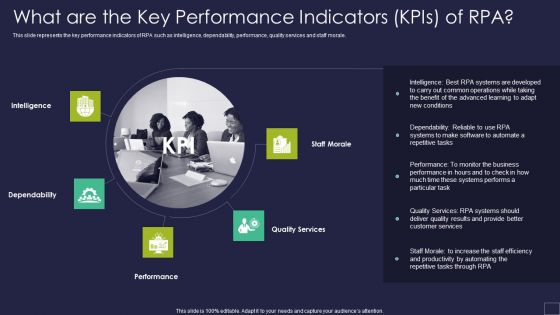
What Are The Key Performance Indicators Kpis Of RPA Robotic Process Automation Technology Graphics PDF
This slide represents the key performance indicators of RPA such as intelligence, dependability, performance, quality services and staff morale.This is a What Are The Key Performance Indicators Kpis Of RPA Robotic Process Automation Technology Graphics PDF template with various stages. Focus and dispense information on five stages using this creative set, that comes with editable features. It contains large content boxes to add your information on topics like Dependability, Intelligence, Quality Services. You can also showcase facts, figures, and other relevant content using this PPT layout. Grab it now.
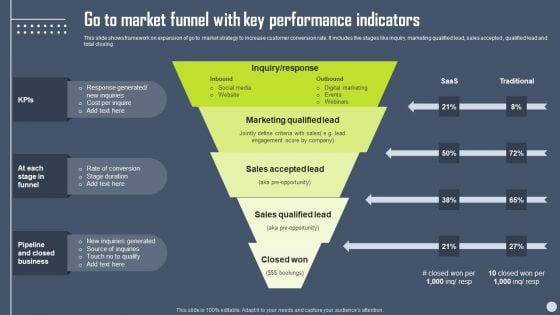
Boosting Yearly Business Revenue Go To Market Funnel With Key Performance Indicators Inspiration PDF
This slide shows framework on expansion of go to market strategy to increase customer conversion rate. It includes five stages like inquiry, marketing qualified lead, sales accepted , qualified lead and total closing. Coming up with a presentation necessitates that the majority of the effort goes into the content and the message you intend to convey. The visuals of a PowerPoint presentation can only be effective if it supplements and supports the story that is being told. Keeping this in mind our experts created Boosting Yearly Business Revenue Go To Market Funnel With Key Performance Indicators Inspiration PDF to reduce the time that goes into designing the presentation. This way, you can concentrate on the message while our designers take care of providing you with the right template for the situation.
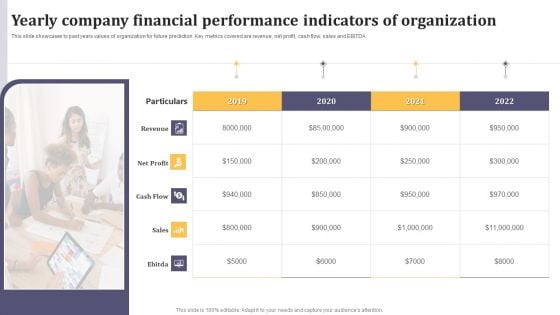
Yearly Company Financial Performance Indicators Of Organization Ppt Infographics Outline PDF
This slide showcases to past years values of organization for future prediction. Key metrics covered are revenue, net profit, cash flow, sales and EBITDA. Persuade your audience using this Yearly Company Financial Performance Indicators Of Organization Ppt Infographics Outline PDF. This PPT design covers five stages, thus making it a great tool to use. It also caters to a variety of topics including Revenue, Net Profit, Cash Flow. Download this PPT design now to present a convincing pitch that not only emphasizes the topic but also showcases your presentation skills.
Different Campaign Metrics Powerpoint Templates
This is a different campaign metrics powerpoint templates. This is a five stage process. The stages in this process are metrics, management, marketing, business, strategy.
Business Process Metrics Ppt Sample Presentations
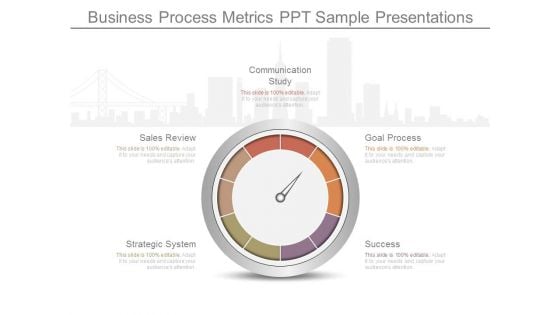
This is a business process metrics ppt sample presentations. This is a five stage process. The stages in this process are communication study, goal process, success, strategic system, sales review.
Business Metrics Dashboard Slide Powerpoint Templates
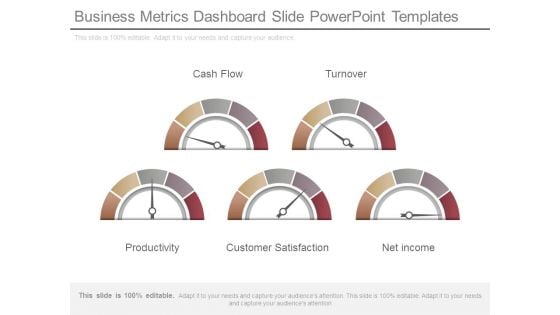
This is a business metrics dashboard slide powerpoint templates. This is a five stage process. The stages in this process are cash flow, turnover, productivity, customer satisfaction, net income.
Performance Metrics Ppt Examples Professional
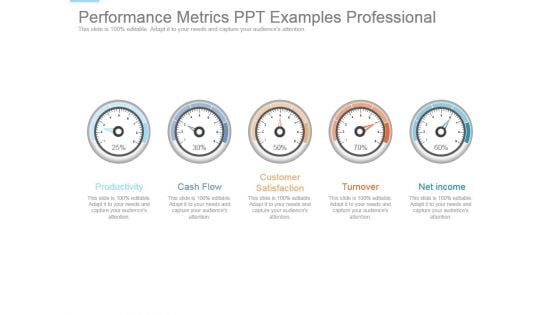
This is a performance metrics ppt examples professional. This is a five stage process. The stages in this process are productivity, cash flow, customer satisfaction, turnover, net income.
Monitor Effectiveness Metrics Powerpoint Guide
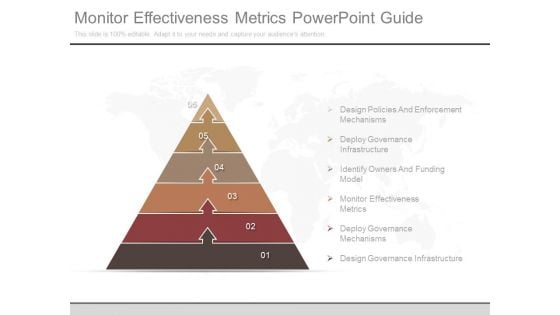
This is a monitor effectiveness metrics powerpoint guide. This is a six stage process. The stages in this process are design policies and enforcement mechanisms, deploy governance infrastructure, identify owners and funding model, monitor effectiveness metrics, deploy governance mechanisms, design governance infrastructure.
Metrics To Measure Marketing Campaign Ppt Example
This is a metrics to measure marketing campaign ppt example. This is a five stage process. The stages in this process are marketing, business, strategy, icons, management.
Set And Track Metrics Ppt Examples
This is a set and track metrics ppt examples. This is a five stage process. The stages in this process are business, management, strategy, presentation, marketing.
Key Performance Management Metrics Powerpoint Slide Background
This is a key performance management metrics powerpoint slide background. This is a five stage process. The stages in this process are business, marketing, finance, icons, strategy.
Metrics Of Business Performance Management Presentation Background Images
This is a metrics of business performance management presentation background images. This is a five stage process. The stages in this process are performance, management, business, strategy, marketing.
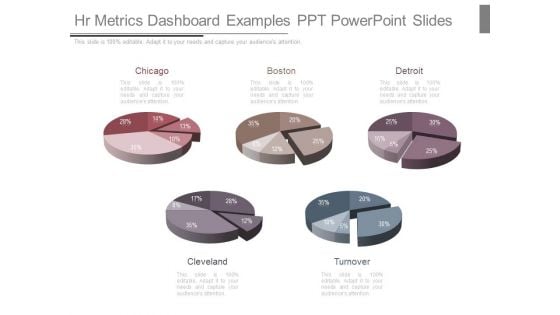
Hr Metrics Dashboard Examples Ppt Powerpoint Slides
This is a hr metrics dashboard examples ppt powerpoint slides. This is a five stage process. The stages in this process are chicago, boston, detroit, cleveland, turnover.
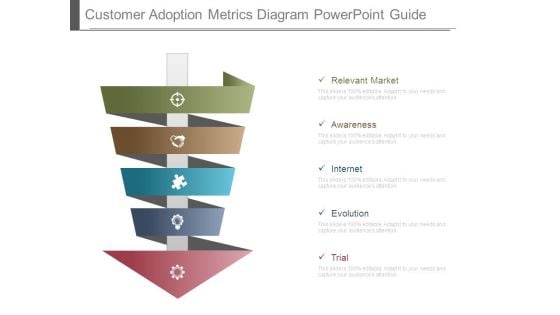
Customer Adoption Metrics Diagram Powerpoint Guide
This is a customer adoption metrics diagram powerpoint guide. This is a five stage process. The stages in this process are relevant market, awareness, internet, evolution, trial.
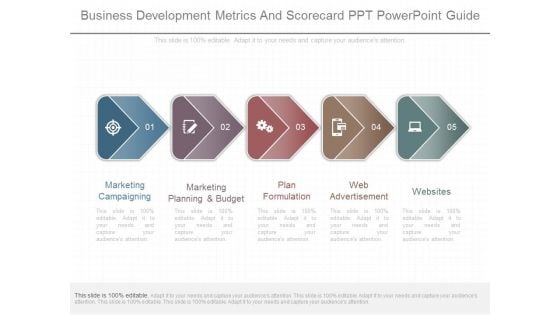
Business Development Metrics And Scorecard Ppt Powerpoint Guide
This is a business development metrics and scorecard ppt powerpoint guide. This is a five stage process. The stages in this process are marketing campaigning, marketing planning and budget, plan formulation, web advertisement, websites.
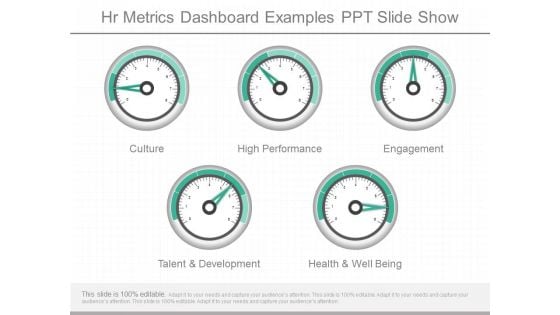
Hr Metrics Dashboard Examples Ppt Slide Show
This is a hr metrics dashboard examples ppt slide show. This is a five stage process. The stages in this process are culture, high performance, engagement, talent and development, health and well being.

Key Metrics Ppt PowerPoint Presentation Professional Slideshow
This is a key metrics ppt powerpoint presentation professional slideshow. This is a five stage process. The stages in this process are new customers per month, on time delivery, customer satisfaction, lead conversion rate, customer retention rate.
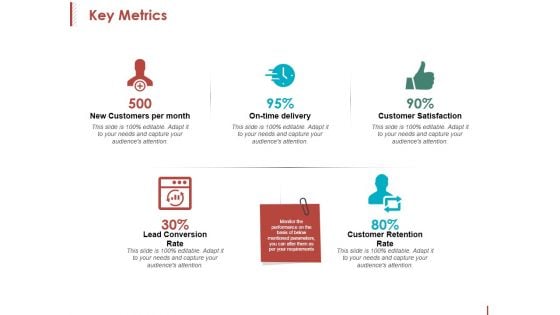
Key Metrics Ppt PowerPoint Presentation Inspiration Format
This is a key metrics ppt powerpoint presentation inspiration format. This is a five stage process. The stages in this process are new customers per month, on time delivery, customer satisfaction, customer retention rate.
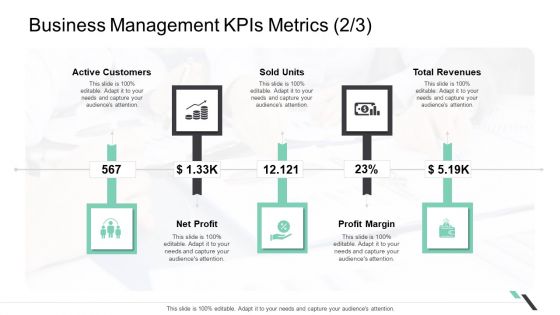
Business Management Kpis Metrics Net Profit Ppt Show Structure PDF
Presenting business management kpis metrics net profit ppt show structure pdf. to provide visual cues and insights. Share and navigate important information on five stages that need your due attention. This template can be used to pitch topics like active customers sold units, total revenues, profit margin, net profit. In addtion, this PPT design contains high resolution images, graphics, etc, that are easily editable and available for immediate download.
Evaluation Of Risk Metrics Powerpoint Slide Presentation Guidelines
This is a evaluation of risk metrics powerpoint slide presentation guidelines. This is a five stage process. The stages in this process are business, management, strategy, marketing, diagram.
Setting Campaign Metrics Ppt PowerPoint Presentation Inspiration Slide
This is a setting campaign metrics ppt powerpoint presentation inspiration slide. This is a five stage process. The stages in this process are business, icons, strategy, marketing.
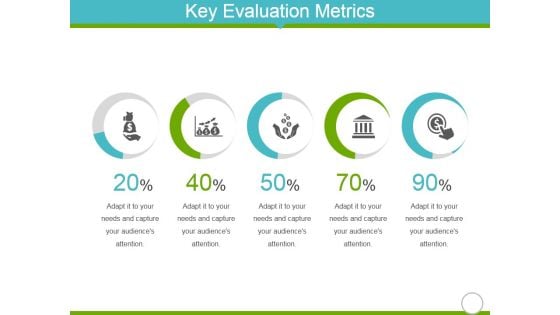
Key Evaluation Metrics Ppt Powerpoint Presentation Styles Design Inspiration
This is a key evaluation metrics ppt powerpoint presentation styles design inspiration. This is a five stage process. The stages in this process are business, marketing, icons, finance.
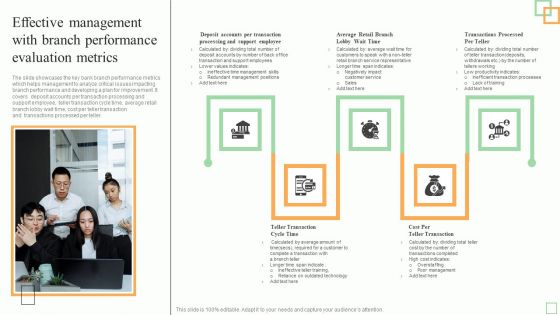
Effective Management With Branch Performance Evaluation Metrics Information PDF
The slide showcases the key bank branch performance metrics which helps management to analyze critical issues impacting branch performance and developing a plan for improvement. It covers deposit accounts per transaction processing and support employee, teller transaction cycle time, average retail branch lobby wait time, cost per teller transaction and transactions processed per teller.Presenting Effective Management With Branch Performance Evaluation Metrics Information PDF to dispense important information. This template comprises five stages. It also presents valuable insights into the topics including Support Employee, Complete Transaction, Outdated Technology. This is a completely customizable PowerPoint theme that can be put to use immediately. So, download it and address the topic impactfully.
Setting Campaign Metrics Ppt PowerPoint Presentation Slides File Formats
This is a setting campaign metrics ppt powerpoint presentation slides file formats. This is a five stage process. The stages in this process are business, marketing, management, icons, strategy.
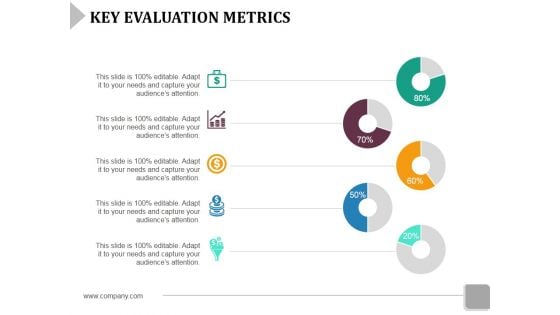
Key Evaluation Metrics Ppt PowerPoint Presentation File Design Ideas
This is a key evaluation metrics ppt powerpoint presentation file design ideas. This is a five stage process. The stages in this process are business, icons, strategy, marketing, finance.
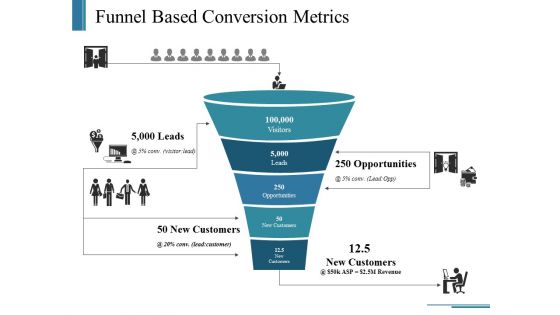
Funnel Based Conversion Metrics Ppt PowerPoint Presentation Outline Layouts
This is a funnel based conversion metrics ppt powerpoint presentation outline layouts. This is a five stage process. The stages in this process are visitors, leads, opportunities, new customers, business.
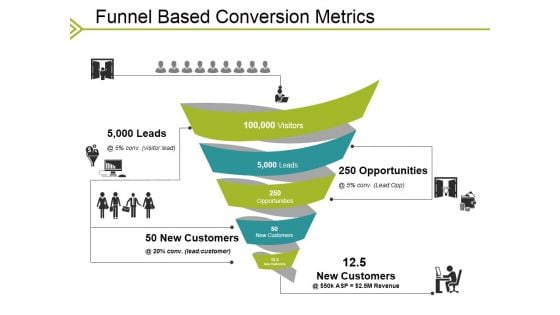
Funnel Based Conversion Metrics Ppt PowerPoint Presentation Infographics Slideshow
This is a funnel based conversion metrics ppt powerpoint presentation infographics slideshow. This is a five stage process. The stages in this process are business, visitors, leads, opportunities, new customers.

Cyber Security Metrics Ppt PowerPoint Presentation File Example Topics Cpb
Presenting this set of slides with name cyber security metrics ppt powerpoint presentation file example topics cpb. This is an editable Powerpoint five stages graphic that deals with topics like cyber security metrics to help convey your message better graphically. This product is a premium product available for immediate download and is 100 percent editable in Powerpoint. Download this now and use it in your presentations to impress your audience.
B2B Funnel Metrics Ppt PowerPoint Presentation Professional Slides Cpb
Presenting this set of slides with name b2b funnel metrics ppt powerpoint presentation professional slides cpb. This is an editable Powerpoint five stages graphic that deals with topics like b2b funnel metrics to help convey your message better graphically. This product is a premium product available for immediate download and is 100 percent editable in Powerpoint. Download this now and use it in your presentations to impress your audience.
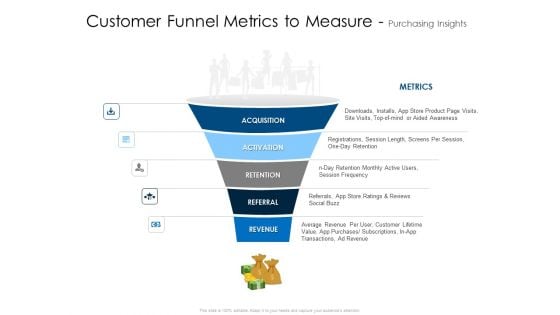
Customer Funnel Metrics To Measure Purchasing Insights Summary PDF
Presenting customer funnel metrics to measure purchasing insights summary pdf to provide visual cues and insights. Share and navigate important information on five stages that need your due attention. This template can be used to pitch topics like acquisition, activation, retention, referral, revenue. In addtion, this PPT design contains high resolution images, graphics, etc, that are easily editable and available for immediate download.
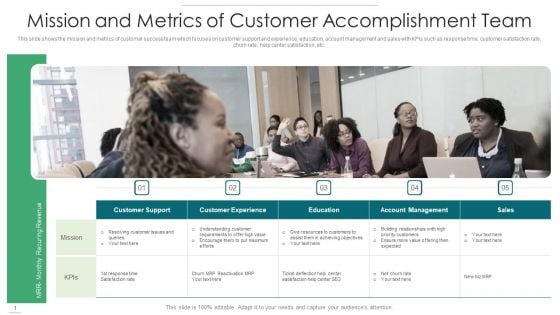
Mission And Metrics Of Customer Accomplishment Team Demonstration PDF
This slide shows the mission and metrics of customer success team which focuses on customer support and experience, education, account management and sales with KPIs such as response time, customer satisfaction rate, churn rate, help center satisfaction, etc. Presenting mission and metrics of customer accomplishment team demonstration pdf to dispense important information. This template comprises five stages. It also presents valuable insights into the topics including customer support, customer experience, education, account management, sales. This is a completely customizable PowerPoint theme that can be put to use immediately. So, download it and address the topic impactfully.
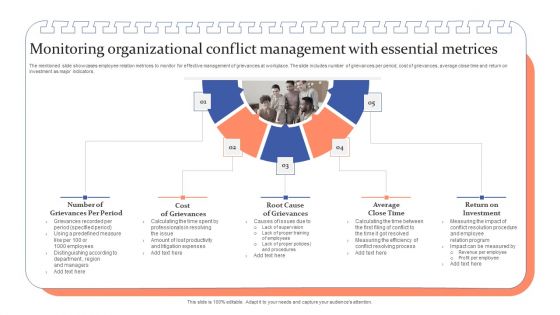
Monitoring Organizational Conflict Management With Essential Metrices Ppt Designs PDF
The mentioned slide showcases employee relation metrices to monitor for effective management of grievances at workplace. The slide includes number of grievances per period, cost of grievances, average close time and return on investment as major indicators. Persuade your audience using this Monitoring Organizational Conflict Management With Essential Metrices Ppt Designs PDF. This PPT design covers five stages, thus making it a great tool to use. It also caters to a variety of topics including Average Close Time, Return Investment, Cost Grievances. Download this PPT design now to present a convincing pitch that not only emphasizes the topic but also showcases your presentation skills.
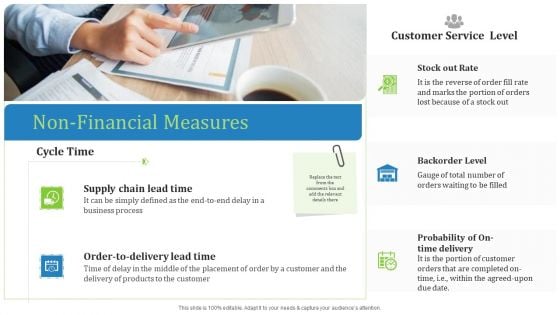
Supply Chain Management Operational Metrics Non Financial Measures Structure PDF
Presenting supply chain management operational metrics non financial measures structure pdf. to provide visual cues and insights. Share and navigate important information on five stages that need your due attention. This template can be used to pitch topics like backorder level, order to delivery lead time, supply chain lead time. In addtion, this PPT design contains high resolution images, graphics, etc, that are easily editable and available for immediate download.

Supply Chain Management Operational Metrics SCM Process Plan Professional PDF
This is a supply chain management operational metrics SCM process plan professional pdf. template with various stages. Focus and dispense information on six stages using this creative set, that comes with editable features. It contains large content boxes to add your information on topics like plant location, plant size, warehouse designing plan. You can also showcase facts, figures, and other relevant content using this PPT layout. Grab it now.

 Home
Home