Kpi Comparison
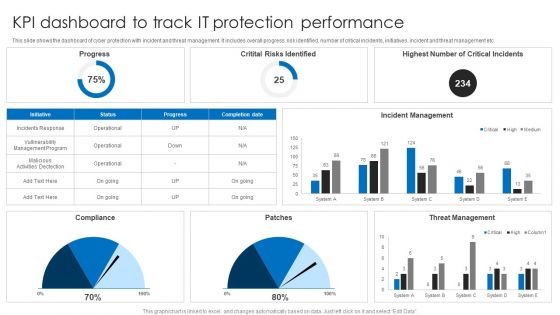
KPI Dashboard To Track IT Protection Performance Elements PDF
This slide shows the dashboard of cyber protection with incident and threat management. It includes overall progress, risk identified, number of critical incidents, initiatives, incident and threat management etc. Pitch your topic with ease and precision using this KPI Dashboard To Track IT Protection Performance Elements PDF. This layout presents information on Incident Management, Threat Management, Critital Risks Identified. It is also available for immediate download and adjustment. So, changes can be made in the color, design, graphics or any other component to create a unique layout.
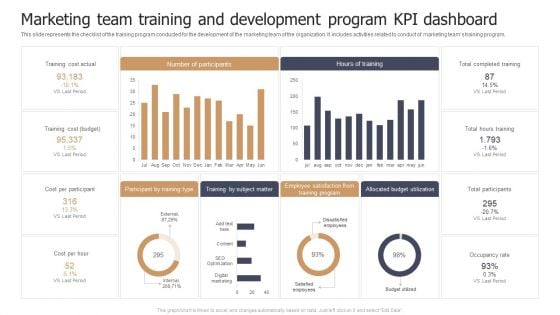
Marketing Team Training And Development Program KPI Dashboard Designs PDF
This slide represents the checklist of the training program conducted for the development of the marketing team of the organization. It includes activities related to conduct of marketing teams training program. Pitch your topic with ease and precision using this Marketing Team Training And Development Program KPI Dashboard Designs PDF. This layout presents information on Training Cost Actual, Cost Per Participant, Cost Per Hour. It is also available for immediate download and adjustment. So, changes can be made in the color, design, graphics or any other component to create a unique layout.
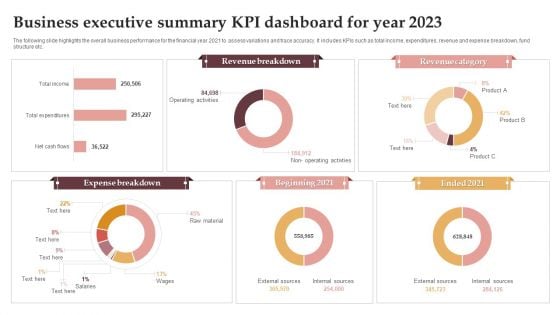
Business Executive Summary KPI Dashboard For Year 2023 Graphics PDF
The following slide highlights the overall business performance for the financial year 2021 to assess variations and trace accuracy. It includes KPIs such as total income, expenditures, revenue and expense breakdown, fund structure etc. Pitch your topic with ease and precision using this Business Executive Summary KPI Dashboard For Year 2023 Graphics PDF. This layout presents information on Revenue Breakdown, Revenue Category, Expense Breakdown. It is also available for immediate download and adjustment. So, changes can be made in the color, design, graphics or any other component to create a unique layout.
Enhancing CX Strategy Customer Service Kpi Tracking Dashboard Themes PDF
This Enhancing CX Strategy Customer Service Kpi Tracking Dashboard Themes PDF from Slidegeeks makes it easy to present information on your topic with precision. It provides customization options, so you can make changes to the colors, design, graphics, or any other component to create a unique layout. It is also available for immediate download, so you can begin using it right away. Slidegeeks has done good research to ensure that you have everything you need to make your presentation stand out. Make a name out there for a brilliant performance.
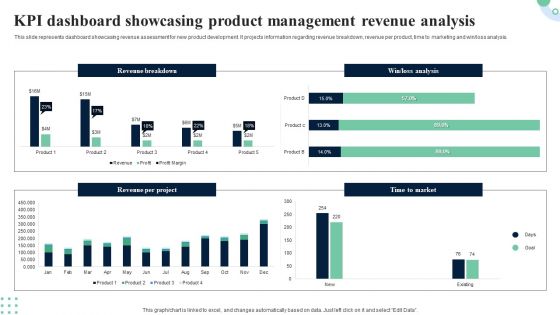
KPI Dashboard Showcasing Product Management Revenue Analysis Portrait PDF
This slide provides dashboard showcasing product development project overview with completion status. It provides information regarding cash flow statements, completion progress, project overview and product approval status. Pitch your topic with ease and precision using this KPI Dashboard Showcasing Product Management Revenue Analysis Portrait PDF. This layout presents information on Completion Progress, Product Approval Status, Cash Flow Statements. It is also available for immediate download and adjustment. So, changes can be made in the color, design, graphics or any other component to create a unique layout.
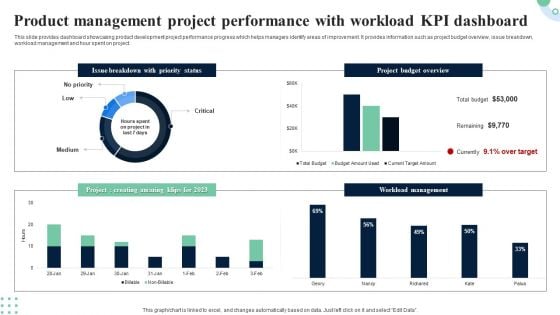
Product Management Project Performance With Workload KPI Dashboard Structure PDF
This slide provides dashboard showcasing product development project performance progress which helps managers identify areas of improvement. It provides information such as project budget overview, issue breakdown, workload management and hour spent on project. Pitch your topic with ease and precision using this Product Management Project Performance With Workload KPI Dashboard Structure PDF. This layout presents information on Project Budget Overview, Workload Management. It is also available for immediate download and adjustment. So, changes can be made in the color, design, graphics or any other component to create a unique layout.
Storage Facility Productivity Tracking KPI Dashboard Graphics PDF
This slide showcases a dashboard for tracking and managing warehouse productivity to optimize logistics operations. It includes key components such as warehouse operating costs, perfect order rate, total shipments by country and on time shipments. Showcasing this set of slides titled Storage Facility Productivity Tracking KPI Dashboard Graphics PDF. The topics addressed in these templates are Warehouse Operating Costs, Perfect Order Rate, Total Shipment Country. All the content presented in this PPT design is completely editable. Download it and make adjustments in color, background, font etc. as per your unique business setting.
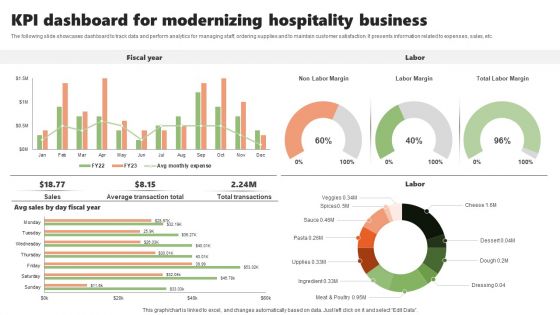
KPI Dashboard For Modernizing Hospitality Business Inspiration PDF
The following slide showcases dashboard to track data and perform analytics for managing staff, ordering supplies and to maintain customer satisfaction. It presents information related to expenses, sales, etc. Pitch your topic with ease and precision using this KPI Dashboard For Modernizing Hospitality Business Inspiration PDF. This layout presents information on Fiscal Year, Labor, Modernizing Hospitality. It is also available for immediate download and adjustment. So, changes can be made in the color, design, graphics or any other component to create a unique layout.
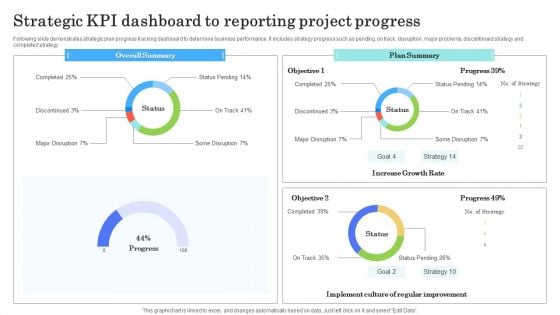
Strategic Kpi Dashboard To Reporting Project Progress Sample PDF
Following slide demonstrates strategic plan progress tracking dashboard to determine business performance. It includes strategy progress such as pending, on track, disruption, major problems, discontinued strategy and completed strategy Pitch your topic with ease and precision using this Strategic Kpi Dashboard To Reporting Project Progress Sample PDF. This layout presents information on Overall Summary, Plan Summary, Growth Rate. It is also available for immediate download and adjustment. So, changes can be made in the color, design, graphics or any other component to create a unique layout.
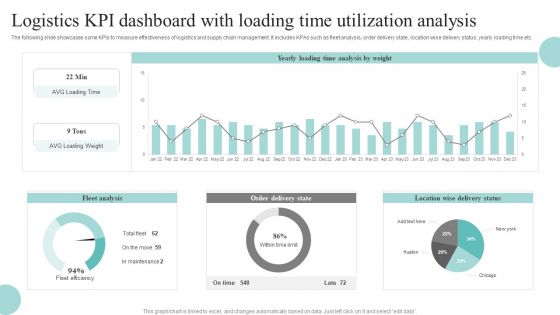
Logistics KPI Dashboard With Loading Time Utilization Analysis Download PDF
The following slide showcases some KPIs to measure effectiveness of logistics and supply chain management. It includes KPAs such as fleet analysis, order delivery state, location wise delivery status, yearly loading time etc. Pitch your topic with ease and precision using this Logistics KPI Dashboard With Loading Time Utilization Analysis Download PDF. This layout presents information on Fleet Analysis, Order Delivery State, Location Wise Delivery Status. It is also available for immediate download and adjustment. So, changes can be made in the color, design, graphics or any other component to create a unique layout.
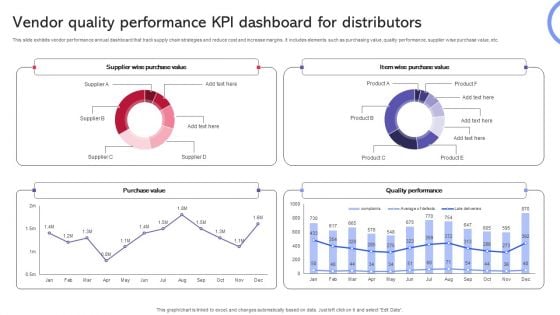
Vendor Quality Performance KPI Dashboard For Distributors Template PDF
This slide exhibits vendor performance annual dashboard that track supply chain strategies and reduce cost and increase margins. It includes elements such as purchasing value, quality performance, supplier wise purchase value, etc. Pitch your topic with ease and precision using this Vendor Quality Performance KPI Dashboard For Distributors Template PDF. This layout presents information on Purchase Value, Quality Performance, Supplier Wise Purchase Value. It is also available for immediate download and adjustment. So, changes can be made in the color, design, graphics or any other component to create a unique layout.
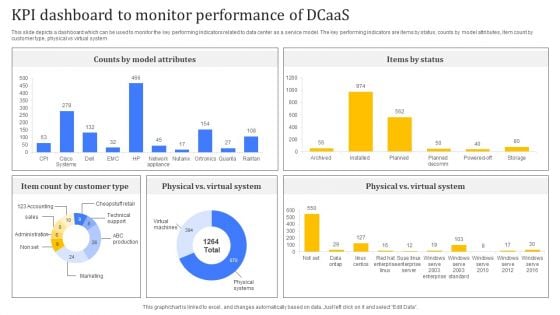
KPI Dashboard To Monitor Performance Of Dcaas Pictures PDF
Following slide highlights major benefits of applying data center as a service to business operations which can be used by businesses looking to modernize their IT infrastructure. Major benefits are in terms of scalability, flexibility, cost effectiveness, and security. Pitch your topic with ease and precision using this KPI Dashboard To Monitor Performance Of Dcaas Pictures PDF. This layout presents information on Customer Type, Counts By Model Attributes, Items By Status. It is also available for immediate download and adjustment. So, changes can be made in the color, design, graphics or any other component to create a unique layout.
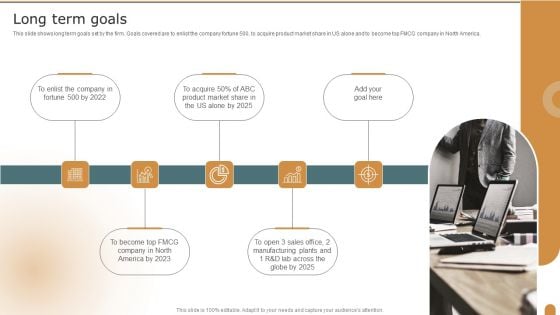
Long Term Goals Company Performance Evaluation Using KPI Portrait PDF
This slide shows long term goals set by the firm. Goals covered are to enlist the company fortune 500, to acquire product market share in US alone and to become top FMCG company in North America. This is a Long Term Goals Company Performance Evaluation Using KPI Portrait PDF template with various stages. Focus and dispense information on five stages using this creative set, that comes with editable features. It contains large content boxes to add your information on topics like Long Term Goals, Company, Product Market. You can also showcase facts, figures, and other relevant content using this PPT layout. Grab it now.
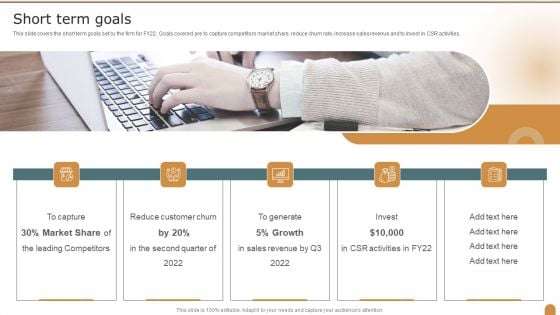
Short Term Goals Company Performance Evaluation Using KPI Themes PDF
This slide covers the short term goals set by the firm for FY22. Goals covered are to capture competitors market share, reduce churn rate, increase sales revenue and to invest in CSR activities. This is a Short Term Goals Company Performance Evaluation Using KPI Themes PDF template with various stages. Focus and dispense information on five stages using this creative set, that comes with editable features. It contains large content boxes to add your information on topics like Market Share, Customer Churn, Revenue. You can also showcase facts, figures, and other relevant content using this PPT layout. Grab it now.
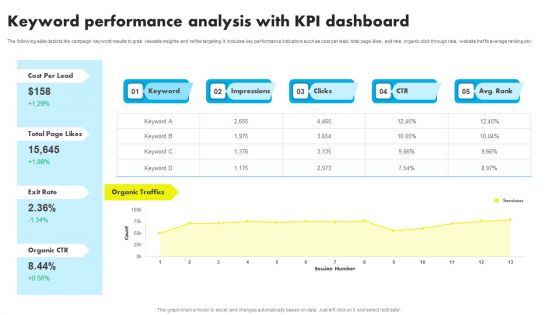
Keyword Performance Analysis With KPI Dashboard Ppt Summary Templates PDF

Organizational Manpower Kpi Dashboard Employees Ppt PowerPoint Presentation Complete Deck
This organizational manpower kpi dashboard employees ppt powerpoint presentation complete deck acts as backup support for your ideas, vision, thoughts, etc. Use it to present a thorough understanding of the topic. This PPT slideshow can be utilized for both in-house and outside presentations depending upon your needs and business demands. Entailing twelve slides with a consistent design and theme, this template will make a solid use case. As it is intuitively designed, it suits every business vertical and industry. All you have to do is make a few tweaks in the content or any other component to design unique presentations. The biggest advantage of this complete deck is that it can be personalized multiple times once downloaded. The color, design, shapes, and other elements are free to modify to add personal touches. You can also insert your logo design in this PPT layout. Therefore a well-thought and crafted presentation can be delivered with ease and precision by downloading this organizational manpower kpi dashboard employees ppt powerpoint presentation complete deck PPT slideshow.

JIRA KPI Dashboard Ppt PowerPoint Presentation Complete Deck With Slides
This jira kpi dashboard ppt powerpoint presentation complete deck with slides acts as backup support for your ideas, vision, thoughts, etc. Use it to present a thorough understanding of the topic. This PPT slideshow can be utilized for both in-house and outside presentations depending upon your needs and business demands. Entailing sixteen slides with a consistent design and theme, this template will make a solid use case. As it is intuitively designed, it suits every business vertical and industry. All you have to do is make a few tweaks in the content or any other component to design unique presentations. The biggest advantage of this complete deck is that it can be personalized multiple times once downloaded. The color, design, shapes, and other elements are free to modify to add personal touches. You can also insert your logo design in this PPT layout. Therefore a well-thought and crafted presentation can be delivered with ease and precision by downloading this jira kpi dashboard ppt powerpoint presentation complete deck with slides PPT slideshow.
SLA KPI Dashboard Ppt PowerPoint Presentation Complete Deck With Slides
This SLA KPI Dashboard Ppt PowerPoint Presentation Complete Deck With Slides acts as backup support for your ideas, vision, thoughts, etc. Use it to present a thorough understanding of the topic. This PPT slideshow can be utilized for both in-house and outside presentations depending upon your needs and business demands. Entailing twelve slides with a consistent design and theme, this template will make a solid use case. As it is intuitively designed, it suits every business vertical and industry. All you have to do is make a few tweaks in the content or any other component to design unique presentations. The biggest advantage of this complete deck is that it can be personalized multiple times once downloaded. The color, design, shapes, and other elements are free to modify to add personal touches. You can also insert your logo design in this PPT layout. Therefore a well-thought and crafted presentation can be delivered with ease and precision by downloading this SLA KPI Dashboard Ppt PowerPoint Presentation Complete Deck With Slides PPT slideshow.
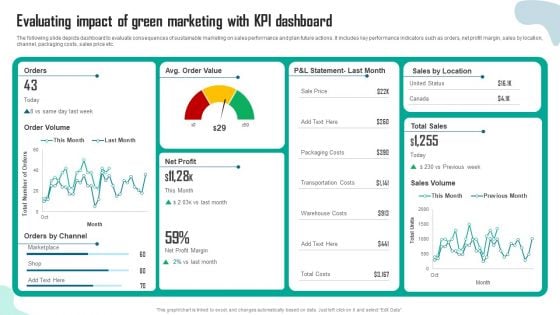
Evaluating Impact Of Green Marketing With Kpi Dashboard Inspiration PDF
The following slide depicts dashboard to evaluate consequences of sustainable marketing on sales performance and plan future actions. It includes key performance indicators such as orders, net profit margin, sales by location, channel, packaging costs, sales price etc. This Evaluating Impact Of Green Marketing With Kpi Dashboard Inspiration PDF from Slidegeeks makes it easy to present information on your topic with precision. It provides customization options, so you can make changes to the colors, design, graphics, or any other component to create a unique layout. It is also available for immediate download, so you can begin using it right away. Slidegeeks has done good research to ensure that you have everything you need to make your presentation stand out. Make a name out there for a brilliant performance.

Hiring KPI Dashboard Ppt PowerPoint Presentation Complete Deck With Slides
Boost your confidence and team morale with this well-structured Hiring KPI Dashboard Ppt PowerPoint Presentation Complete Deck With Slides. This prefabricated set gives a voice to your presentation because of its well-researched content and graphics. Our experts have added all the components very carefully, thus helping you deliver great presentations with a single click. Not only that, it contains a set of thridteen slides that are designed using the right visuals, graphics, etc. Various topics can be discussed, and effective brainstorming sessions can be conducted using the wide variety of slides added in this complete deck. Apart from this, our PPT design contains clear instructions to help you restructure your presentations and create multiple variations. The color, format, design anything can be modified as deemed fit by the user. Not only this, it is available for immediate download. So, grab it now.

Firm KPI Dashboard Ppt PowerPoint Presentation Complete Deck With Slides
Boost your confidence and team morale with this well-structured Firm KPI Dashboard Ppt PowerPoint Presentation Complete Deck With Slides. This prefabricated set gives a voice to your presentation because of its well-researched content and graphics. Our experts have added all the components very carefully, thus helping you deliver great presentations with a single click. Not only that, it contains a set of twelve slides that are designed using the right visuals, graphics, etc. Various topics can be discussed, and effective brainstorming sessions can be conducted using the wide variety of slides added in this complete deck. Apart from this, our PPT design contains clear instructions to help you restructure your presentations and create multiple variations. The color, format, design anything can be modified as deemed fit by the user. Not only this, it is available for immediate download. So, grab it now.
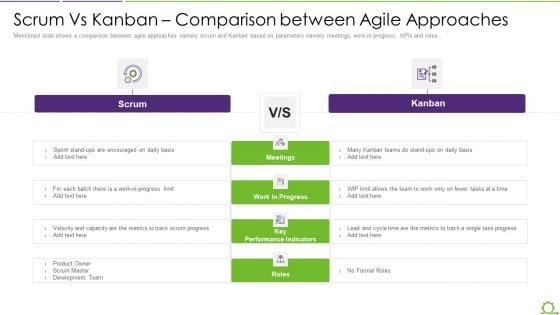
Comparison Between Agile And Scrum IT Scrum Vs Kanban Comparison Between Agile Approaches Slides PDF
Mentioned slide shows a comparison between agile approaches namely scrum and Kanban based on parameters namely meetings, work-in-progress, KPIs and roles. This is a comparison between agile and scrum it scrum vs kanban comparison between agile approaches slides pdf template with various stages. Focus and dispense information on two stages using this creative set, that comes with editable features. It contains large content boxes to add your information on topics like scrum, kanban, meetings work progress, key performance indicators, roles. You can also showcase facts, figures, and other relevant content using this PPT layout. Grab it now.
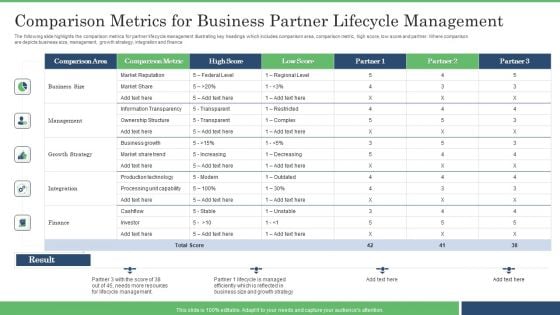
Comparison Metrics For Business Partner Lifecycle Management Guidelines PDF
The following slide highlights the comparison metrics for partner lifecycle management illustrating key headings which includes comparison area, comparison metric, high score, low score and partner. Where comparison are depicts business size, management, growth strategy, integration and finance. Pitch your topic with ease and precision using this Comparison Metrics For Business Partner Lifecycle Management Guidelines PDF. This layout presents information on Business Size, Management, Growth Strategy. It is also available for immediate download and adjustment. So, changes can be made in the color, design, graphics or any other component to create a unique layout.

Ecommerce Marketing Tools Comparison Matrix Comprehensive Guide For Marketing Technology
Following slide provides information about ecommerce marketing software solution. It includes key metrics such as pricing, best for business, rating, ecommerce platform, marketing automation, email marketing, and drip campaigns.Presenting this PowerPoint presentation, titled Ecommerce Marketing Tools Comparison Matrix Comprehensive Guide For Marketing Technology, with topics curated by our researchers after extensive research. This editable presentation is available for immediate download and provides attractive features when used. Download now and captivate your audience. Presenting this Ecommerce Marketing Tools Comparison Matrix Comprehensive Guide For Marketing Technology. Our researchers have carefully researched and created these slides with all aspects taken into consideration. This is a completely customizable Ecommerce Marketing Tools Comparison Matrix Comprehensive Guide For Marketing Technology that is available for immediate downloading. Download now and make an impact on your audience. Highlight the attractive features available with our PPTs. Following slide provides information about ecommerce marketing software solution. It includes key metrics such as pricing, best for business, rating, ecommerce platform, marketing automation, email marketing, and drip campaigns.
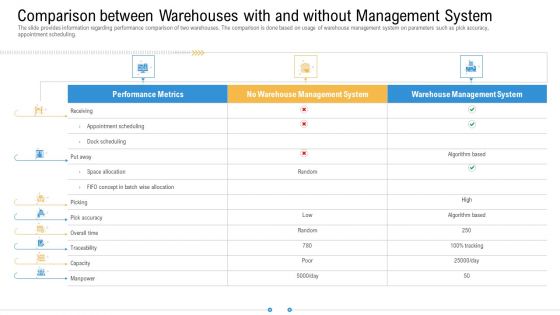
Comparison Between Warehouses With And Without Management System Structure PDF
The slide provides information regarding performance comparison of two warehouses. The comparison is done based on usage of warehouse management system on parameters such as pick accuracy, appointment scheduling. Deliver an awe inspiring pitch with this creative comparison between warehouses with and without management system structure pdf bundle. Topics like warehouse management system, performance metrics can be discussed with this completely editable template. It is available for immediate download depending on the needs and requirements of the user.
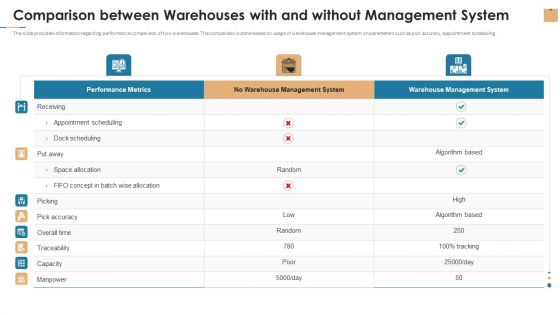
Comparison Between Warehouses With And Without Management System Rules PDF
The slide provides information regarding performance comparison of two warehouses. The comparison is done based on usage of warehouse management system on parameters such as pick accuracy, appointment scheduling. Deliver an awe inspiring pitch with this creative comparison between warehouses with and without management system rules pdf bundle. Topics like performance metrics, warehouse management system, capacity can be discussed with this completely editable template. It is available for immediate download depending on the needs and requirements of the user.
Lead Tracking Dashboard With Metric Comparison Brochure PDF
This slide showcases dashboard of lead pipeline that can help to identify total number of leads generated and expenses incurred to acquire the audience. It also showcases other key performance metrics like lead breakdown by status and number of leads per month. Pitch your topic with ease and precision using this Lead Tracking Dashboard With Metric Comparison Brochure PDF. This layout presents information on Metric Comparison, Lead Pipeline, Lead Breakdown Status. It is also available for immediate download and adjustment. So, changes can be made in the color, design, graphics or any other component to create a unique layout.
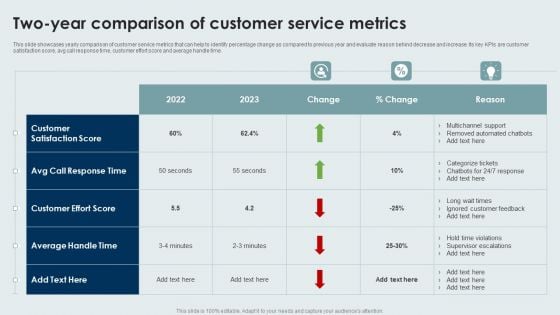
Two Year Comparison Of Customer Service Metrics Information PDF
This slide showcases yearly comparison of customer service metrics that can help to identify percentage change as compared to previous year and evaluate reason behind decrease and increase. Its key KPIs are customer satisfaction score, avg call response time, customer effort score and average handle time. Pitch your topic with ease and precision using this Two Year Comparison Of Customer Service Metrics Information PDF. This layout presents information on Customer Effort Score, Customer Satisfaction Score, Average Handle Time. It is also available for immediate download and adjustment. So, changes can be made in the color, design, graphics or any other component to create a unique layout.

Website Data Yearly Comparison With Percentage Change Formats PDF
This slide showcases yearly comparison table that can help organization to identify the change in current year website statistics as compared to previous year. Its key metrics are total traffic, conversion rate, pages or session, pageviews and bounce rate. Pitch your topic with ease and precision using this Website Data Yearly Comparison With Percentage Change Formats PDF. This layout presents information on Website Data Yearly Comparison With Percentage Change. It is also available for immediate download and adjustment. So, changes can be made in the color, design, graphics or any other component to create a unique layout.
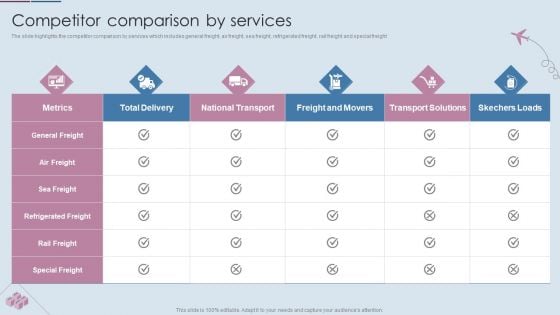
Logistics Shipment Company Profile Competitor Comparison By Services Diagrams PDF
The slide highlights the competitor comparison by services which includes general freight, air freight, sea freight, refrigerated freight, rail freight and special freight. Deliver an awe inspiring pitch with this creative Logistics Shipment Company Profile Competitor Comparison By Services Diagrams PDF bundle. Topics like Metrics, Total Delivery, National Transport can be discussed with this completely editable template. It is available for immediate download depending on the needs and requirements of the user.
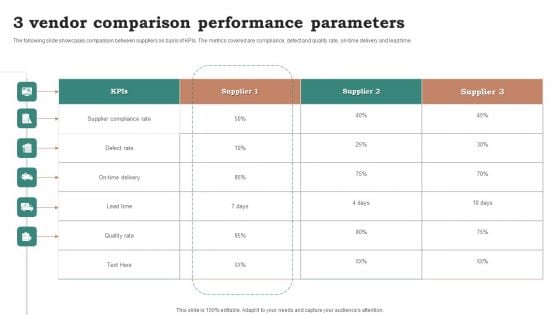
3 Vendor Comparison Performance Parameters Ppt Portfolio Topics PDF
The following slide showcases comparison between suppliers on basis of KPIs. The metrics covered are compliance, defect and quality rate, on-time delivery and lead time. Pitch your topic with ease and precision using this 3 Vendor Comparison Performance Parameters Ppt Portfolio Topics PDF. This layout presents information on Supplier Compliance Rate, Defect Rate, Lead Time. It is also available for immediate download and adjustment. So, changes can be made in the color, design, graphics or any other component to create a unique layout.
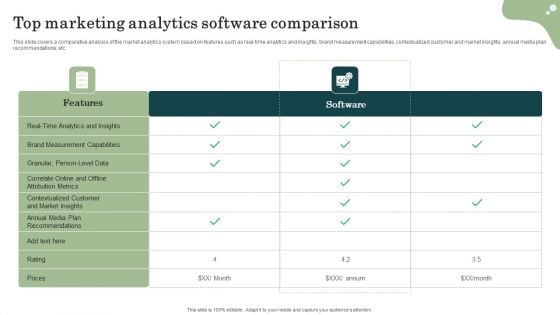
Marketing Success Metrics Top Marketing Analytics Software Comparison Template PDF
This slide covers a comparative analysis of the market analytics system based on features such as real-time analytics and insights, brand measurement capabilities, contextualized customer and market insights, annual media plan recommendations, etc. Create an editable Marketing Success Metrics Top Marketing Analytics Software Comparison Template PDF that communicates your idea and engages your audience. Whether youre presenting a business or an educational presentation, pre-designed presentation templates help save time. Marketing Success Metrics Top Marketing Analytics Software Comparison Template PDF is highly customizable and very easy to edit, covering many different styles from creative to business presentations. Slidegeeks has creative team members who have crafted amazing templates. So, go and get them without any delay.

Software Tool Comparison Assessment Matrix Ppt Pictures Outline PDF
This slide showcases software comparison and assessment matrix of customer segmentation software solution tools. It includes key elements such as cohort analysis, lifetime value, acquisition, behavior, conversation metrics, affinity categories, in market segment, market email activity, ads interactions, etc. Present like a pro with Software Tool Comparison Assessment Matrix Ppt Pictures Outline PDF Create beautiful presentations together with your team, using our easy to use presentation slides. Share your ideas in real time and make changes on the fly by downloading our templates. So whether you are in the office, on the go, or in a remote location, you can stay in sync with your team and present your ideas with confidence. With Slidegeeks presentation got a whole lot easier. Grab these presentations today.
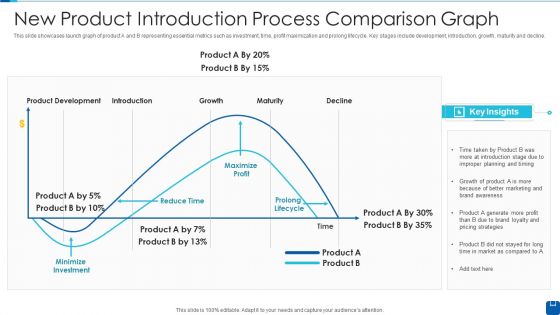
New Product Introduction Process Comparison Graph Slides PDF
This slide showcases launch graph of product A and B representing essential metrics such as investment, time, profit maximization and prolong lifecycle. Key stages include development, introduction, growth, maturity and decline.Showcasing this set of slides titled New Product Introduction Process Comparison Graph Slides PDF The topics addressed in these templates are Product Development, Improper Planning, Minimize Investment All the content presented in this PPT design is completely editable. Download it and make adjustments in color, background, font etc. as per your unique business setting.

Advertisement Cost Comparison Of Social Media Platforms Graphics PDF
This slide showcases comparative assessment of advertisement cost on different social media. It analyze social media advertising cost on the basis of key metrics that are average cost per click and cost per mile. Make sure to capture your audiences attention in your business displays with our gratis customizable Advertisement Cost Comparison Of Social Media Platforms Graphics PDF. These are great for business strategies, office conferences, capital raising or task suggestions. If you desire to acquire more customers for your tech business and ensure they stay satisfied, create your own sales presentation with these plain slides.
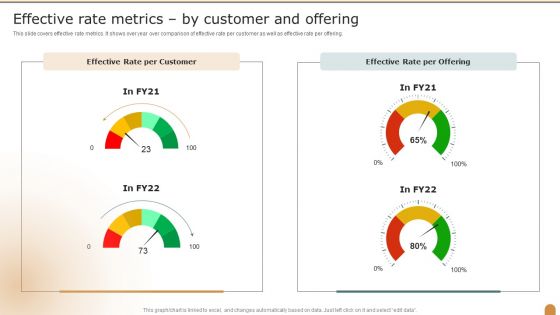
Effective Rate Metrics By Customer And Offering Company Performance Evaluation Using KPI Inspiration PDF
This slide covers effective rate metrics. It shows over year over comparison of effective rate per customer as well as effective rate per offering. Deliver an awe inspiring pitch with this creative Effective Rate Metrics By Customer And Offering Company Performance Evaluation Using KPI Inspiration PDF bundle. Topics like Effective Rate, Customer, Per Offering can be discussed with this completely editable template. It is available for immediate download depending on the needs and requirements of the user.
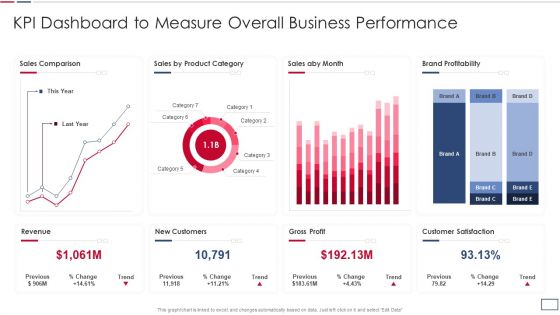
Software Developer Playbook Kpi Dashboard To Measure Overall Business Performance Topics PDF
This graph or chart is linked to excel, and changes automatically based on data. Just left click on it and select Edit Data. Deliver and pitch your topic in the best possible manner with this software developer playbook kpi dashboard to measure overall business performance topics pdf. Use them to share invaluable insights on revenue new customers, gross profit, customer satisfaction, sales comparison and impress your audience. This template can be altered and modified as per your expectations. So, grab it now.
KPI Framework For Customer Acquisition And Retention Ppt PowerPoint Presentation Icon Diagrams PDF
This slide illustrates key performance indicator framework for customer acquisition and retention such as customer churn rate, customer lifetime value, repeat purchase rate and customer acquisition cost. It also provides information about comparison of standard and actual performance of kips. Showcasing this set of slides titled kpi framework for customer acquisition and retention ppt powerpoint presentation icon diagrams pdf The topics addressed in these templates are customer, value, acquisition cost. All the content presented in this PPT design is completely editable. Download it and make adjustments in color, background, font etc. as per your unique business setting.
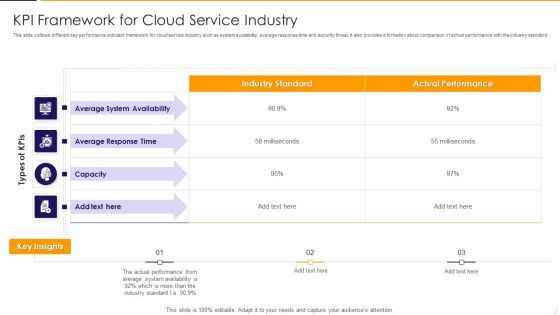
KPI Framework For Cloud Service Industry Ppt PowerPoint Presentation Gallery Styles PDF
This slide outlines different key performance indicator framework for cloud service industry such as system availability, average response time and security threat. It also provides information about comparison of actual performance with the industry standard. Pitch your topic with ease and precision using this kpi framework for cloud service industry ppt powerpoint presentation gallery styles pdf This layout presents information on average, performance, system It is also available for immediate download and adjustment. So, changes can be made in the color, design, graphics or any other component to create a unique layout.
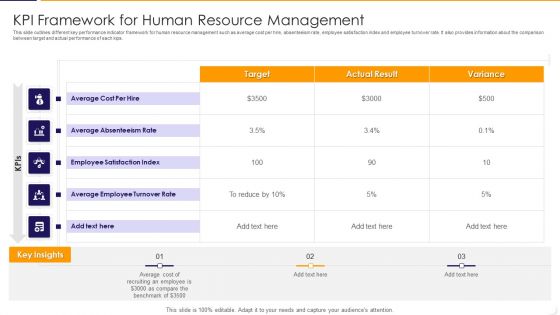
KPI Framework For Human Resource Management Ppt PowerPoint Presentation Gallery Portrait PDF
This slide outlines different key performance indicator framework for human resource management such as average cost per hire, absenteeism rate, employee satisfaction index and employee turnover rate. It also provides information about the comparison between target and actual performance of each kips. Pitch your topic with ease and precision using this kpi framework for human resource management ppt powerpoint presentation gallery portrait pdf This layout presents information on average, cost, target It is also available for immediate download and adjustment. So, changes can be made in the color, design, graphics or any other component to create a unique layout.
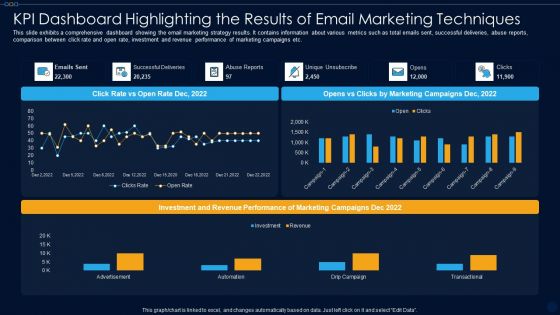
KPI Dashboard Highlighting The Results Of Email Marketing Techniques Ppt PowerPoint Presentation File Format PDF
This slide exhibits a comprehensive dashboard showing the email marketing strategy results. It contains information about various metrics such as total emails sent, successful deliveries, abuse reports, comparison between click rate and open rate, investment and revenue performance of marketing campaigns etc. Showcasing this set of slides titled kpi dashboard highlighting the results of email marketing techniques ppt powerpoint presentation file format pdf. The topics addressed in these templates are advertisement, automation, drip campaign, transactional. All the content presented in this PPT design is completely editable. Download it and make adjustments in color, background, font etc. as per your unique business setting.
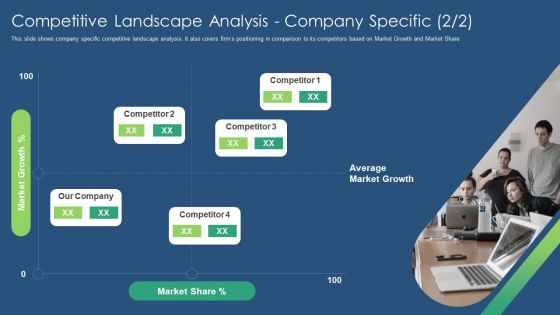
Sustainability Calculation With KPI Competitive Landscape Analysis Company Ppt PowerPoint Presentation File Deck PDF
This slide shows company specific competitive landscape analysis. It also covers firms positioning in comparison to its competitors based on Market Growth and Market Share. This is a sustainability calculation with kpi competitive landscape analysis company ppt powerpoint presentation file deck pdf template with various stages. Focus and dispense information on one stages using this creative set, that comes with editable features. It contains large content boxes to add your information on topics like market growth, market share, competitor. You can also showcase facts, figures, and other relevant content using this PPT layout. Grab it now.
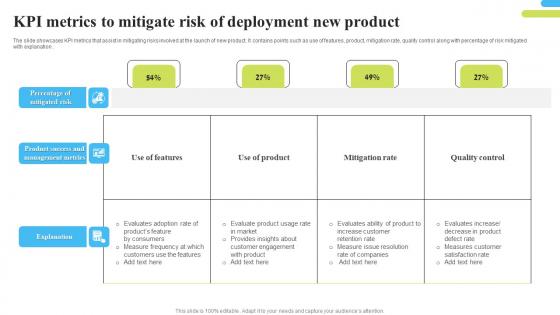
Kpi Metrics To Mitigate Risk Of Deployment New Product Themes Pdf
The slide showcases KPI metrics that assist in mitigating risks involved at the launch of new product. It contains points such as use of features, product, mitigation rate, quality control along with percentage of risk mitigated with explanation. Showcasing this set of slides titled Kpi Metrics To Mitigate Risk Of Deployment New Product Themes Pdf. The topics addressed in these templates are KPI Metrics To Mitigate Risk, Deployment New Product, Quality Control. All the content presented in this PPT design is completely editable. Download it and make adjustments in color, background, font etc. as per your unique business setting. The slide showcases KPI metrics that assist in mitigating risks involved at the launch of new product. It contains points such as use of features, product, mitigation rate, quality control along with percentage of risk mitigated with explanation.
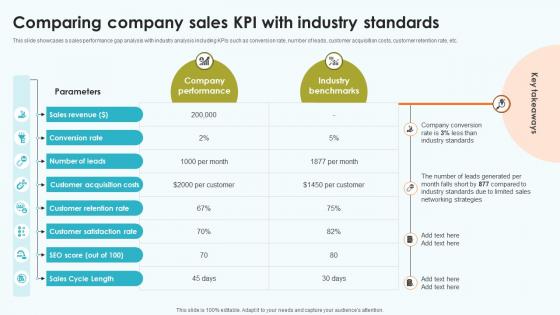
Elevating Sales Networks Comparing Company Sales KPI With Industry Standards SA SS V
This slide showcases a sales performance gap analysis with industry analysis including KPIs such as conversion rate, number of leads, customer acquisition costs, customer retention rate, etc. Get a simple yet stunning designed Elevating Sales Networks Comparing Company Sales KPI With Industry Standards SA SS V. It is the best one to establish the tone in your meetings. It is an excellent way to make your presentations highly effective. So, download this PPT today from Slidegeeks and see the positive impacts. Our easy-to-edit Elevating Sales Networks Comparing Company Sales KPI With Industry Standards SA SS V can be your go-to option for all upcoming conferences and meetings. So, what are you waiting for Grab this template today. This slide showcases a sales performance gap analysis with industry analysis including KPIs such as conversion rate, number of leads, customer acquisition costs, customer retention rate, etc.
Online Learning And Improvement KPI Training Sessions Dashboard Icon Graphics Pdf
Pitch your topic with ease and precision using this Online Learning And Improvement KPI Training Sessions Dashboard Icon Graphics Pdf. This layout presents information on Online Learning, Improvement KPI, Training Sessions, Dashboard Icon. It is also available for immediate download and adjustment. So, changes can be made in the color, design, graphics or any other component to create a unique layout. Our Online Learning And Improvement KPI Training Sessions Dashboard Icon Graphics Pdf are topically designed to provide an attractive backdrop to any subject. Use them to look like a presentation pro.

Marketing Growth Strategy KPI Dashboard To Evaluate Sales Performance Strategy SS V
The following slide outlines key performance indicator KPI dashboard to monitor sales performance of company. The key metrics covered in slide are total sales by location, monthly sales trend, average revenue AR by clients, etc. This Marketing Growth Strategy KPI Dashboard To Evaluate Sales Performance Strategy SS V is perfect for any presentation, be it in front of clients or colleagues. It is a versatile and stylish solution for organizing your meetings. The Marketing Growth Strategy KPI Dashboard To Evaluate Sales Performance Strategy SS V features a modern design for your presentation meetings. The adjustable and customizable slides provide unlimited possibilities for acing up your presentation. Slidegeeks has done all the homework before launching the product for you. So, do not wait, grab the presentation templates today The following slide outlines key performance indicator KPI dashboard to monitor sales performance of company. The key metrics covered in slide are total sales by location, monthly sales trend, average revenue AR by clients, etc.
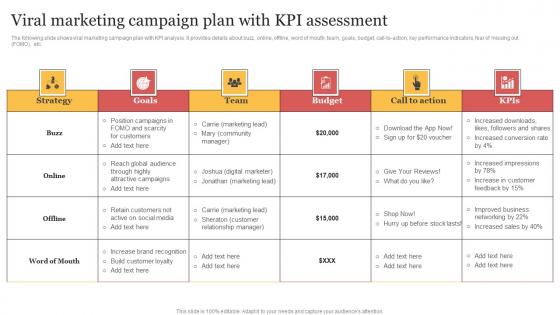
Viral Marketing Campaign Plan With KPI Assessment Organizing Buzzworthy Social Structure Pdf
The following slide shows viral marketing campaign plan with KPI analysis. It provides details about buzz, online, offline, word of mouth, team, goals, budget, call-to-action, key performance indicators, fear of missing out FOMO, etc. Take your projects to the next level with our ultimate collection of Viral Marketing Campaign Plan With KPI Assessment Organizing Buzzworthy Social Structure Pdf Slidegeeks has designed a range of layouts that are perfect for representing task or activity duration, keeping track of all your deadlines at a glance. Tailor these designs to your exact needs and give them a truly corporate look with your own brand colors they well make your projects stand out from the rest. The following slide shows viral marketing campaign plan with KPI analysis. It provides details about buzz, online, offline, word of mouth, team, goals, budget, call-to-action, key performance indicators, fear of missing out FOMO, etc.
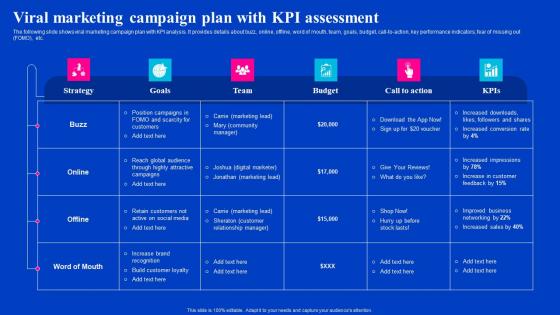
Viral Marketing Campaign Plan With KPI Assessment Viral Video Outreach Plan Template Pdf
The following slide shows viral marketing campaign plan with KPI analysis. It provides details about buzz, online, offline, word of mouth, team, goals, budget, call-to-action, key performance indicators, fear of missing out FOMO, etc. If your project calls for a presentation, then Slidegeeks is your go-to partner because we have professionally designed, easy-to-edit templates that are perfect for any presentation. After downloading, you can easily edit Viral Marketing Campaign Plan With KPI Assessment Viral Video Outreach Plan Template Pdf and make the changes accordingly. You can rearrange slides or fill them with different images. Check out all the handy templates The following slide shows viral marketing campaign plan with KPI analysis. It provides details about buzz, online, offline, word of mouth, team, goals, budget, call-to-action, key performance indicators, fear of missing out FOMO, etc.
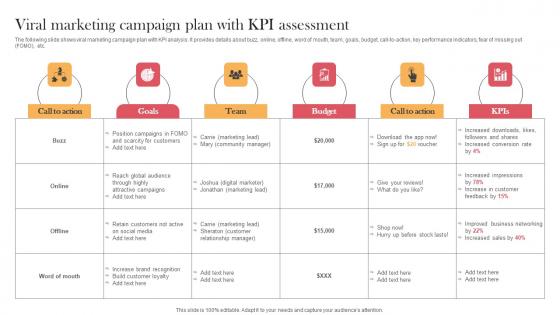
Viral Marketing Campaign Plan With KPI Assessment Designing Approaches Rules Pdf
The following slide shows viral marketing campaign plan with KPI analysis. It provides details about buzz, online, offline, word of mouth, team, goals, budget, call-to-action, key performance indicators, fear of missing out FOMO, etc. Boost your pitch with our creative Viral Marketing Campaign Plan With KPI Assessment Designing Approaches Rules Pdf. Deliver an awe-inspiring pitch that will mesmerize everyone. Using these presentation templates you will surely catch everyones attention. You can browse the ppts collection on our website. We have researchers who are experts at creating the right content for the templates. So you do not have to invest time in any additional work. Just grab the template now and use them. The following slide shows viral marketing campaign plan with KPI analysis. It provides details about buzz, online, offline, word of mouth, team, goals, budget, call-to-action, key performance indicators, fear of missing out FOMO, etc.
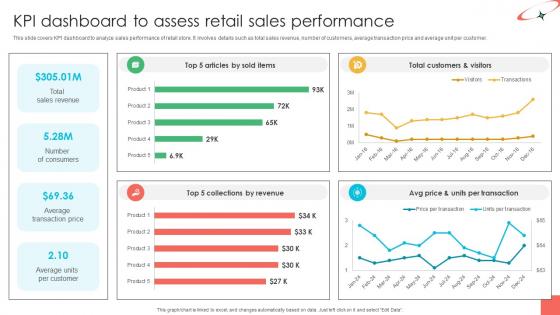
Marketing Strategies For Effective KPI Dashboard To Assess Retail Sales Performance
This slide covers KPI dashboard to analyze sales performance of retail store. It involves details such as total sales revenue, number of customers, average transaction price and average unit per customer. This Marketing Strategies For Effective KPI Dashboard To Assess Retail Sales Performance is perfect for any presentation, be it in front of clients or colleagues. It is a versatile and stylish solution for organizing your meetings. The Marketing Strategies For Effective KPI Dashboard To Assess Retail Sales Performance features a modern design for your presentation meetings. The adjustable and customizable slides provide unlimited possibilities for acing up your presentation. Slidegeeks has done all the homework before launching the product for you. So, do not wait, grab the presentation templates today This slide covers KPI dashboard to analyze sales performance of retail store. It involves details such as total sales revenue, number of customers, average transaction price and average unit per customer.
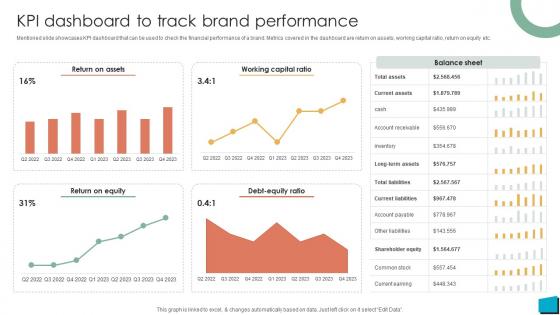
Brand Authority KPI Dashboard To Track Brand Performance Strategy SS V
Mentioned slide showcases KPI dashboard that can be used to check the financial performance of a brand. Metrics covered in the dashboard are return on assets, working capital ratio, return on equity etc. This Brand Authority KPI Dashboard To Track Brand Performance Strategy SS V is perfect for any presentation, be it in front of clients or colleagues. It is a versatile and stylish solution for organizing your meetings. The Brand Authority KPI Dashboard To Track Brand Performance Strategy SS V features a modern design for your presentation meetings. The adjustable and customizable slides provide unlimited possibilities for acing up your presentation. Slidegeeks has done all the homework before launching the product for you. So, do not wait, grab the presentation templates today Mentioned slide showcases KPI dashboard that can be used to check the financial performance of a brand. Metrics covered in the dashboard are return on assets, working capital ratio, return on equity etc.
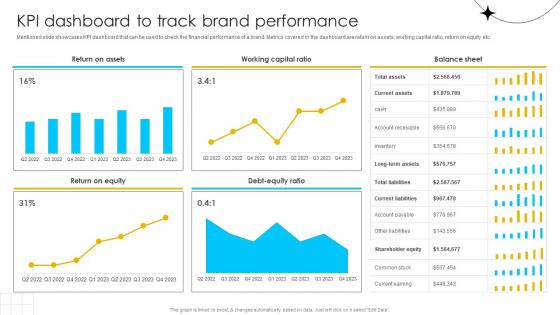
Brand Influence KPI Dashboard To Track Brand Performance Strategy SS V
Mentioned slide showcases KPI dashboard that can be used to check the financial performance of a brand. Metrics covered in the dashboard are return on assets, working capital ratio, return on equity etc. This Brand Influence KPI Dashboard To Track Brand Performance Strategy SS V is perfect for any presentation, be it in front of clients or colleagues. It is a versatile and stylish solution for organizing your meetings. The Brand Influence KPI Dashboard To Track Brand Performance Strategy SS V features a modern design for your presentation meetings. The adjustable and customizable slides provide unlimited possibilities for acing up your presentation. Slidegeeks has done all the homework before launching the product for you. So, do not wait, grab the presentation templates today Mentioned slide showcases KPI dashboard that can be used to check the financial performance of a brand. Metrics covered in the dashboard are return on assets, working capital ratio, return on equity etc.
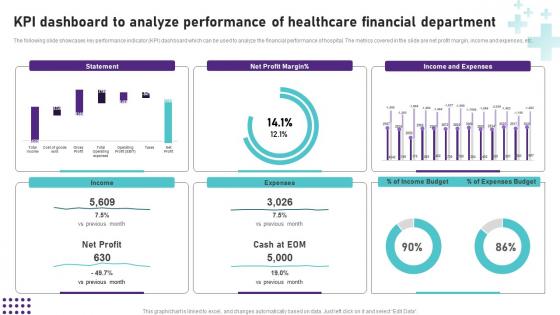
KPI Dashboard To Analyze Performance Of Healthcare Operational Areas Healthcare Clipart PDF
Are you searching for a KPI Dashboard To Analyze Performance Of Healthcare Operational Areas Healthcare Clipart PDF that is uncluttered, straightforward, and original Its easy to edit, and you can change the colors to suit your personal or business branding. For a presentation that expresses how much effort you have put in, this template is ideal With all of its features, including tables, diagrams, statistics, and lists, its perfect for a business plan presentation. Make your ideas more appealing with these professional slides. Download Kpi Dashboard To Analyze Performance Of Healthcare Operational Areas Healthcare Clipart PDF from Slidegeeks today. The following slide showcases key performance indicator KPI dashboard which can be used to analyze the financial performance of hospital. The metrics covered in the slide are net profit margin, income and expenses, etc.
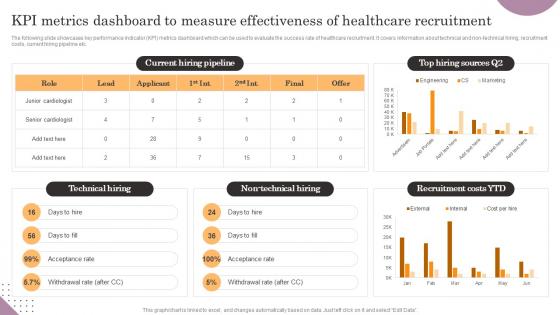
KPI Metrics Dashboard To Measure Effectiveness Of General Management Information Pdf
The following slide showcases key performance indicator KPI metrics dashboard which can be used to evaluate the success rate of healthcare recruitment. It covers information about technical and non-technical hiring, recruitment costs, current hiring pipeline etc. Presenting this PowerPoint presentation, titled KPI Metrics Dashboard To Measure Effectiveness Of General Management Information Pdf, with topics curated by our researchers after extensive research. This editable presentation is available for immediate download and provides attractive features when used. Download now and captivate your audience. Presenting this KPI Metrics Dashboard To Measure Effectiveness Of General Management Information Pdf. Our researchers have carefully researched and created these slides with all aspects taken into consideration. This is a completely customizable KPI Metrics Dashboard To Measure Effectiveness Of General Management Information Pdf that is available for immediate downloading. Download now and make an impact on your audience. Highlight the attractive features available with our PPTs. The following slide showcases key performance indicator KPI metrics dashboard which can be used to evaluate the success rate of healthcare recruitment. It covers information about technical and non-technical hiring, recruitment costs, current hiring pipeline etc.
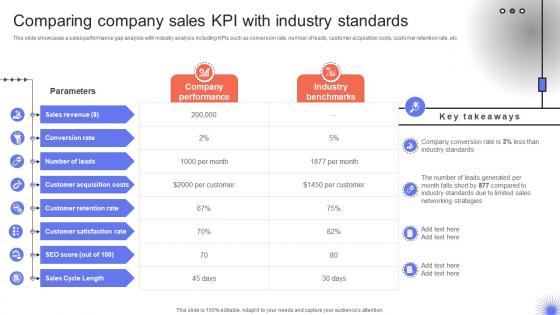
Trade Event Tactics To Boost Comparing Company Sales KPI With Industry Standards SA SS V
This slide showcases a sales performance gap analysis with industry analysis including KPIs such as conversion rate, number of leads, customer acquisition costs, customer retention rate, etc. From laying roadmaps to briefing everything in detail, our templates are perfect for you. You can set the stage with your presentation slides. All you have to do is download these easy-to-edit and customizable templates. Trade Event Tactics To Boost Comparing Company Sales KPI With Industry Standards SA SS V will help you deliver an outstanding performance that everyone would remember and praise you for. Do download this presentation today. This slide showcases a sales performance gap analysis with industry analysis including KPIs such as conversion rate, number of leads, customer acquisition costs, customer retention rate, etc.

KPI Dashboard To Measure Brand Marketing Performance Ultimate Guide Implementing Demonstration Pdf
Mentioned slide illustrates KPI dashboard that can be used by organizations to track the performance of their brand performance. Brand, advertising and purchase are the metrics covered in the dashboard. Presenting this PowerPoint presentation, titled KPI Dashboard To Measure Brand Marketing Performance Ultimate Guide Implementing Demonstration Pdf with topics curated by our researchers after extensive research. This editable presentation is available for immediate download and provides attractive features when used. Download now and captivate your audience. Presenting this KPI Dashboard To Measure Brand Marketing Performance Ultimate Guide Implementing Demonstration Pdf Our researchers have carefully researched and created these slides with all aspects taken into consideration. This is a completely customizable KPI Dashboard To Measure Brand Marketing Performance Ultimate Guide Implementing Demonstration Pdf that is available for immediate downloading. Download now and make an impact on your audience. Highlight the attractive features available with our PPTs. Mentioned slide illustrates KPI dashboard that can be used by organizations to track the performance of their brand performance. Brand, advertising and purchase are the metrics covered in the dashboard.
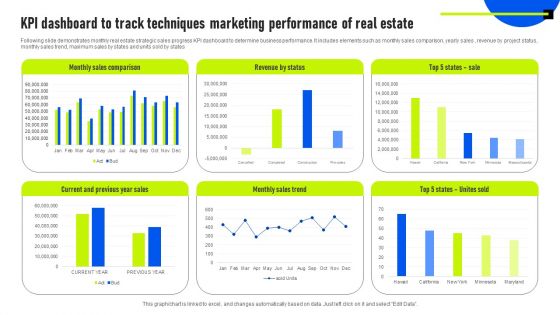
KPI Dashboard To Track Techniques Marketing Performance Of Real Estate Information PDF
Following slide demonstrates monthly real estate strategic sales progress KPI dashboard to determine business performance. It includes elements such as monthly sales comparison, yearly sales , revenue by project status, monthly sales trend, maximum sales by states and units sold by states. Showcasing this set of slides titled KPI Dashboard To Track Techniques Marketing Performance Of Real Estate Information PDF. The topics addressed in these templates are Revenue By Status, Monthly Sales Comparison, Monthly Sales Trend. All the content presented in this PPT design is completely editable. Download it and make adjustments in color, background, font etc. as per your unique business setting.
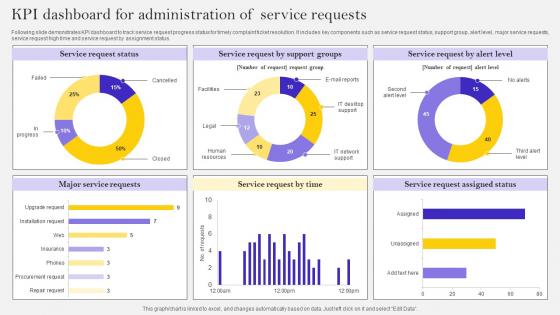
KPI Dashboard For Administration Of Service Requests Ppt Show Inspiration Pdf
Following slide demonstrates KPI dashboard to track service request progress status for timely complaint ticket resolution. It includes key components such as service request status, support group, alert level, major service requests, service request high time and service request by assignment status. Showcasing this set of slides titled KPI Dashboard For Administration Of Service Requests Ppt Show Inspiration Pdf. The topics addressed in these templates are Major Service Requests, Service Request, High Time. All the content presented in this PPT design is completely editable. Download it and make adjustments in color, background, font etc. as per your unique business setting. Following slide demonstrates KPI dashboard to track service request progress status for timely complaint ticket resolution. It includes key components such as service request status, support group, alert level, major service requests, service request high time and service request by assignment status.
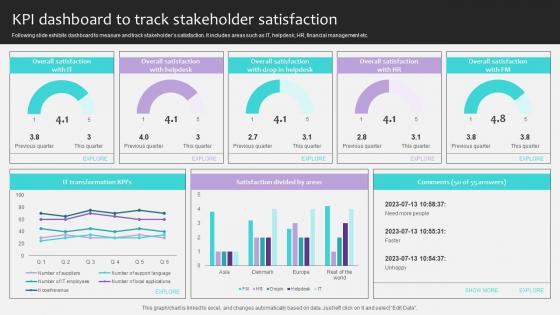
Project Stakeholders Management KPI Dashboard To Track Stakeholder Satisfaction Ppt Powerpoint
Following slide exhibits dashboard to measure and track stakeholders satisfaction. It includes areas such as IT, helpdesk, HR, financial management etc. Presenting this PowerPoint presentation, titled Project Stakeholders Management KPI Dashboard To Track Stakeholder Satisfaction Ppt Powerpoint, with topics curated by our researchers after extensive research. This editable presentation is available for immediate download and provides attractive features when used. Download now and captivate your audience. Presenting this Project Stakeholders Management KPI Dashboard To Track Stakeholder Satisfaction Ppt Powerpoint. Our researchers have carefully researched and created these slides with all aspects taken into consideration. This is a completely customizable Project Stakeholders Management KPI Dashboard To Track Stakeholder Satisfaction Ppt Powerpoint that is available for immediate downloading. Download now and make an impact on your audience. Highlight the attractive features available with our PPTs. Following slide exhibits dashboard to measure and track stakeholders satisfaction. It includes areas such as IT, helpdesk, HR, financial management etc.
Viral Campaigns KPI Dashboard With Engagement Metrics Organizing Buzzworthy Social Portrait Pdf
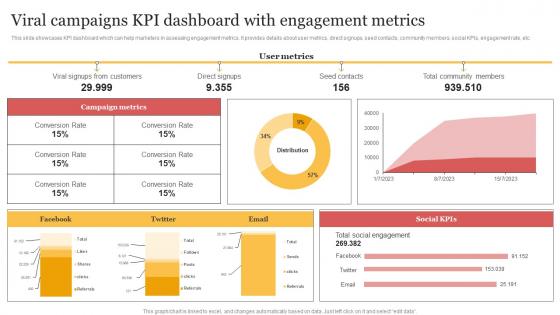
This slide showcases KPI dashboard which can help marketers in assessing engagement metrics. It provides details about user metrics, direct signups, seed contacts, community members, social KPIs, engagement rate, etc. This Viral Campaigns KPI Dashboard With Engagement Metrics Organizing Buzzworthy Social Portrait Pdf from Slidegeeks makes it easy to present information on your topic with precision. It provides customization options, so you can make changes to the colors, design, graphics, or any other component to create a unique layout. It is also available for immediate download, so you can begin using it right away. Slidegeeks has done good research to ensure that you have everything you need to make your presentation stand out. Make a name out there for a brilliant performance. This slide showcases KPI dashboard which can help marketers in assessing engagement metrics. It provides details about user metrics, direct signups, seed contacts, community members, social KPIs, engagement rate, etc.


 Continue with Email

 Home
Home


