Kpi Comparison
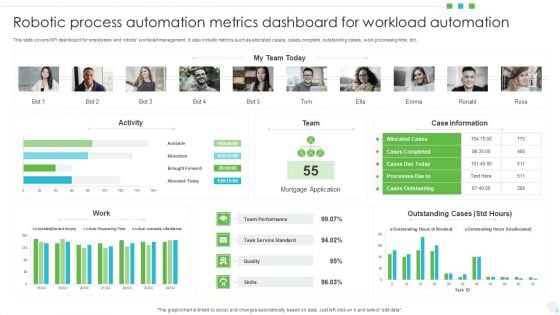
Robotic Process Automation Metrics Dashboard For Workload Automation Mockup PDF
This slide covers KPI dashboard for employees and robots workload management. It also include metrics such as allocated cases, cases complete, outstanding cases, work processing time, etc. Pitch your topic with ease and precision using this Robotic Process Automation Metrics Dashboard For Workload Automation Mockup PDF. This layout presents information on Mortgage Application, Team Performance, Case Information. It is also available for immediate download and adjustment. So, changes can be made in the color, design, graphics or any other component to create a unique layout.
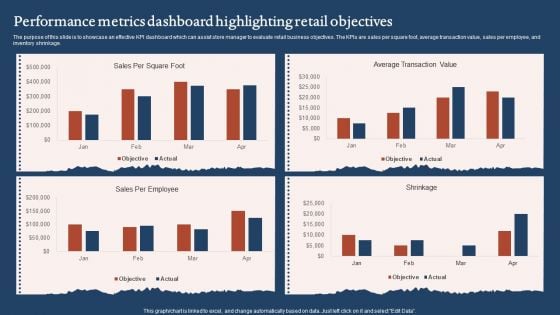
Performance Metrics Dashboard Highlighting Retail Objectives Sample PDF
The purpose of this slide is to showcase an effective KPI dashboard which can assist store manager to evaluate retail business objectives. The KPIs are sales per square foot, average transaction value, sales per employee, and inventory shrinkage. Pitch your topic with ease and precision using this Performance Metrics Dashboard Highlighting Retail Objectives Sample PDF. This layout presents information on Average Transaction Value, Sales Per Employee. It is also available for immediate download and adjustment. So, changes can be made in the color, design, graphics or any other component to create a unique layout.
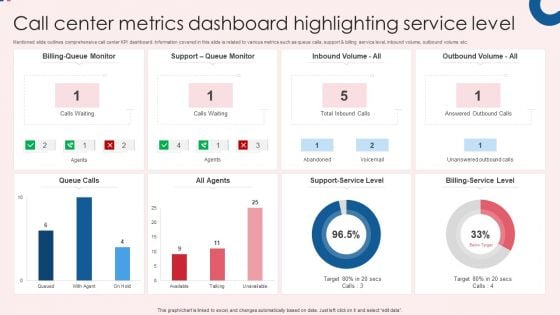
Call Center Metrics Dashboard Highlighting Service Level Infographics PDF
Mentioned slide outlines comprehensive call center KPI dashboard. Information covered in this slide is related to various metrics such as queue calls, support and billing service level, inbound volume, outbound volume etc. Pitch your topic with ease and precision using this Call Center Metrics Dashboard Highlighting Service Level Infographics PDF. This layout presents information on All Agents, Queue Calls, Billing Service Level. It is also available for immediate download and adjustment. So, changes can be made in the color, design, graphics or any other component to create a unique layout.
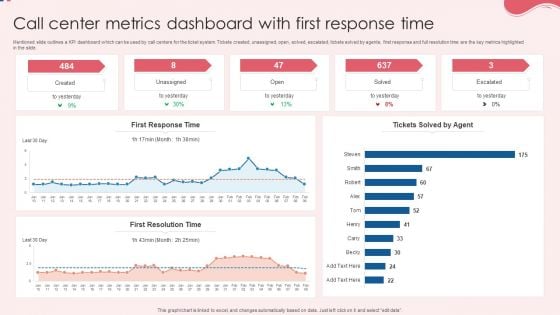
Call Center Metrics Dashboard With First Response Time Background PDF
Mentioned slide outlines a KPI dashboard which can be used by call centers for the ticket system. Tickets created, unassigned, open, solved, escalated, tickets solved by agents, first response and full resolution time are the key metrics highlighted in the slide. Pitch your topic with ease and precision using this Call Center Metrics Dashboard With First Response Time Background PDF. This layout presents information on First Response Time, First Resolution Time, Response Time. It is also available for immediate download and adjustment. So, changes can be made in the color, design, graphics or any other component to create a unique layout.

Marketing Objectives And Metrics With Key Strategies Formats PDF
The purpose of this slide is to showcase different objectives and KPIs of the marketing team. The KPI could be customer lifetime value digital marketing ROI landing page conversion rate and lead to customer ratio. Pitch your topic with ease and precision using this Marketing Objectives And Metrics With Key Strategies Formats PDF. This layout presents information on Key Strategies, Conversion Rate, Customer Lifetime Value. It is also available for immediate download and adjustment. So, changes can be made in the color, design, graphics or any other component to create a unique layout.
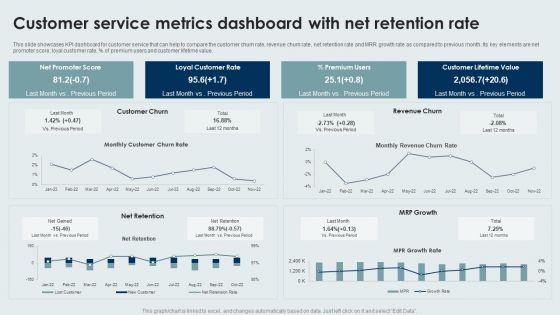
Customer Service Metrics Dashboard With Net Retention Rate Sample PDF
This slide showcases KPI dashboard for customer service that can help to compare the customer churn rate, revenue churn rate, net retention rate and MRR growth rate as compared to previous month. Its key elements are net promoter score, loyal customer rate, percentage of premium users and customer lifetime value. Pitch your topic with ease and precision using this Customer Service Metrics Dashboard With Net Retention Rate Sample PDF. This layout presents information on Loyal Customer Rate, Premium Users, Customer Lifetime Value. It is also available for immediate download and adjustment. So, changes can be made in the color, design, graphics or any other component to create a unique layout.
Shipping Delivery Tracking Metrics Analysis Dashboard Structure PDF
This template illustrates the KPI dashboard for tracking shipment orders. It also includes shipment analysis based on different KPIs such as ongoing delivery, completed delivery, on-time delivery, actual delivery duration, and variance between expected and actual delivery time. Pitch your topic with ease and precision using this Shipping Delivery Tracking Metrics Analysis Dashboard Structure PDF. This layout presents information on Recipient Country, Completed Deliveries, Delivery Duration. It is also available for immediate download and adjustment. So, changes can be made in the color, design, graphics or any other component to create a unique layout.
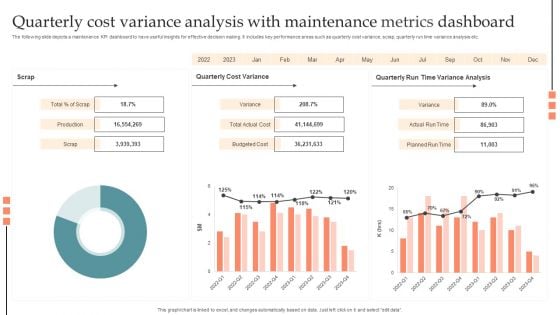
Quarterly Cost Variance Analysis With Maintenance Metrics Dashboard Information PDF
The following slide depicts a maintenance KPI dashboard to have useful insights for effective decision making. It includes key performance areas such as quarterly cost variance, scrap, quarterly run time variance analysis etc. Pitch your topic with ease and precision using this Quarterly Cost Variance Analysis With Maintenance Metrics Dashboard Information PDF. This layout presents information on Production, Budgeted Cost, Planned Run Time, Actual Run Time. It is also available for immediate download and adjustment. So, changes can be made in the color, design, graphics or any other component to create a unique layout.

Metric Dashboard To Track Supplier Diversity And Performance Designs PDF
This slide represents KPI dashboard for tracking supplier diversity in organization and measure performance. It provides information regarding organization spending cost, supplier count, diversity type, status etc. Pitch your topic with ease and precision using this Metric Dashboard To Track Supplier Diversity And Performance Designs PDF. This layout presents information on Diversity Type, Diversity Status, Diverse Supplier. It is also available for immediate download and adjustment. So, changes can be made in the color, design, graphics or any other component to create a unique layout.
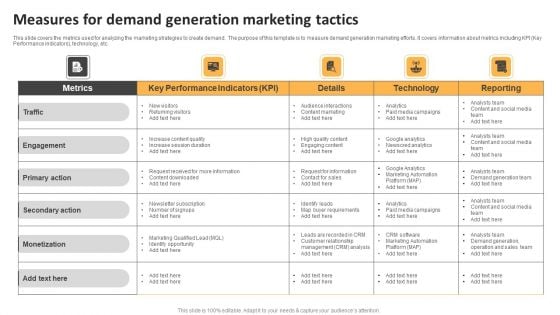
Measures For Demand Generation Marketing Tactics Ppt Slides Outline PDF
This slide covers the metrics used for analyzing the marketing strategies to create demand. The purpose of this template is to measure demand generation marketing efforts. It covers information about metrics including KPI Key Performance indicators, technology, etc. Pitch your topic with ease and precision using this Measures For Demand Generation Marketing Tactics Ppt Slides Outline PDF. This layout presents information on Key Performance Indicators, Details, Technology. It is also available for immediate download and adjustment. So, changes can be made in the color, design, graphics or any other component to create a unique layout.
Robotic Process Automation Metrics Dashboard For Tracking Business Return On Investment Information PDF
This slide illustrates KPI Dashboard for measuring time and money saved after RPA deployment. It also include metrics for analysis such as productivity in robot hours, hours saved per process, money saved per process, etc. Pitch your topic with ease and precision using this Robotic Process Automation Metrics Dashboard For Tracking Business Return On Investment Information PDF. This layout presents information on Management, Goal, Productivity. It is also available for immediate download and adjustment. So, changes can be made in the color, design, graphics or any other component to create a unique layout.
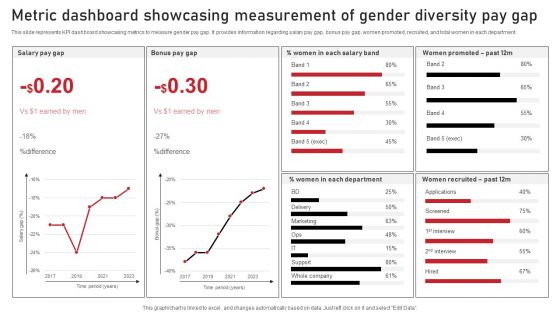
Metric Dashboard Showcasing Measurement Of Gender Diversity Pay Gap Sample PDF
This slide represents KPI dashboard showcasing metrics to measure gender pay gap. It provides information regarding salary pay gap, bonus pay gap, women promoted, recruited, and total women in each department. Pitch your topic with ease and precision using this Metric Dashboard Showcasing Measurement Of Gender Diversity Pay Gap Sample PDF. This layout presents information on Marketing, Screened, Delivery. It is also available for immediate download and adjustment. So, changes can be made in the color, design, graphics or any other component to create a unique layout.
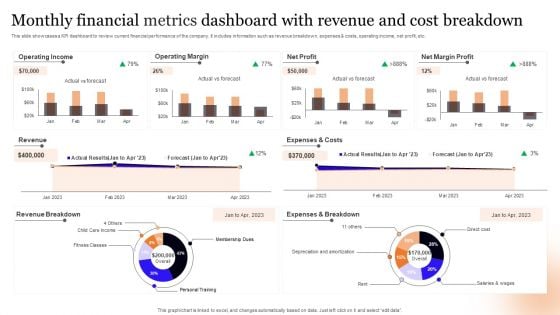
Monthly Financial Metrics Dashboard With Revenue And Cost Breakdown Information PDF
This slide showcases a KPI dashboard to review current financial performance of the company. It includes information such as revenue breakdown, expenses and costs, operating income, net profit, etc. Pitch your topic with ease and precision using this Monthly Financial Metrics Dashboard With Revenue And Cost Breakdown Information PDF. This layout presents information on Operating Income, Operating Margin, Net Profit. It is also available for immediate download and adjustment. So, changes can be made in the color, design, graphics or any other component to create a unique layout.
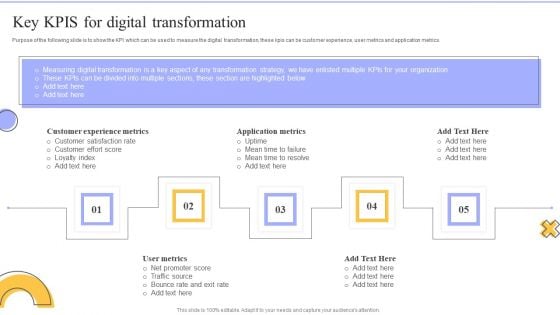
Change Administration Strategies Key Kpis For Digital Transformation Designs PDF
Purpose of the following slide is to show the KPI which can be used to measure the digital transformation, these kpis can be customer experience, user metrics and application metrics. This is a Change Administration Strategies Key Kpis For Digital Transformation Designs PDF template with various stages. Focus and dispense information on five stages using this creative set, that comes with editable features. It contains large content boxes to add your information on topics like Customer Experience Metrics, Application Metrics, User Metrics. You can also showcase facts, figures, and other relevant content using this PPT layout. Grab it now.
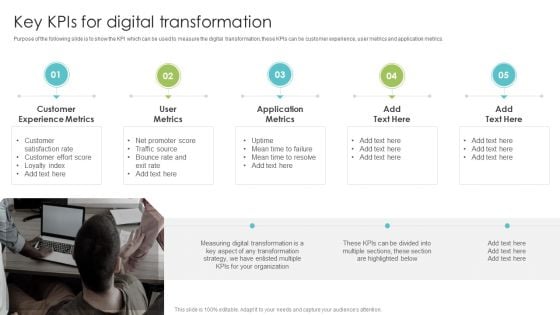
Playbook For Enterprise Transformation Administration Key Kpis For Digital Transformation Sample PDF
Purpose of the following slide is to show the KPI which can be used to measure the digital transformation, these KPIs can be customer experience, user metrics and application metrics. This is a Playbook For Enterprise Transformation Administration Key Kpis For Digital Transformation Sample PDF template with various stages. Focus and dispense information on five stages using this creative set, that comes with editable features. It contains large content boxes to add your information on topics like User Metrics, Application Metrics, Customer Experience Metrics. You can also showcase facts, figures, and other relevant content using this PPT layout. Grab it now.
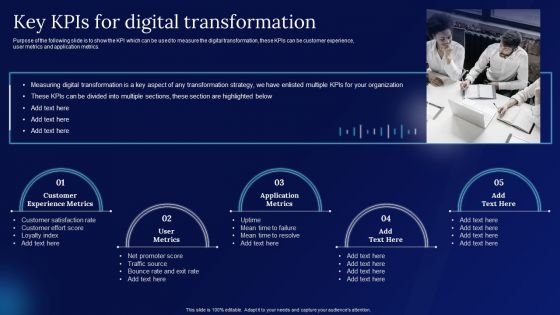
Digitalization Guide For Business Key Kpis For Digital Transformation Mockup PDF
Purpose of the following slide is to show the KPI which can be used to measure the digital transformation, these KPIs can be customer experience, user metrics and application metrics. This is a Digitalization Guide For Business Key Kpis For Digital Transformation Mockup PDF template with various stages. Focus and dispense information on five stages using this creative set, that comes with editable features. It contains large content boxes to add your information on topics like Measuring Digital, Transformation, Strategy Enlisted. You can also showcase facts, figures, and other relevant content using this PPT layout. Grab it now.
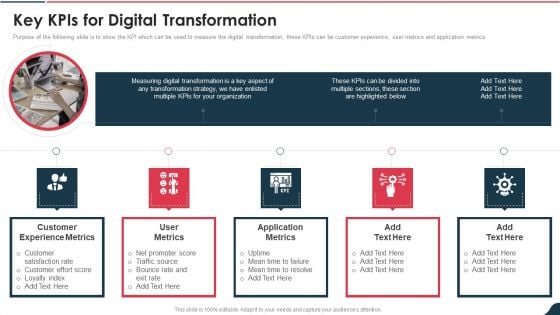
Electronic Playbook Key Kpis For Digital Transformation Infographics PDF
Purpose of the following slide is to show the KPI which can be used to measure the digital transformation, these KPIs can be customer experience, user metrics and application metrics. This is a electronic playbook key kpis for digital transformation infographics pdf template with various stages. Focus and dispense information on five stages using this creative set, that comes with editable features. It contains large content boxes to add your information on topics like customer experience metrics, application metrics, satisfaction rate customer You can also showcase facts, figures, and other relevant content using this PPT layout. Grab it now.
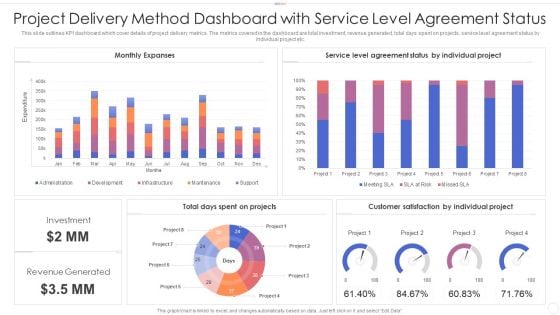
Project Delivery Method Dashboard With Service Level Agreement Status Clipart PDF
This slide outlines KPI dashboard which cover details of project delivery metrics. The metrics covered in the dashboard are total investment, revenue generated, total days spent on projects, service level agreement status by individual project etc. Pitch your topic with ease and precision using this project delivery method dashboard with service level agreement status clipart pdf. This layout presents information on project delivery method dashboard with service level agreement status. It is also available for immediate download and adjustment. So, changes can be made in the color, design, graphics or any other component to create a unique layout.
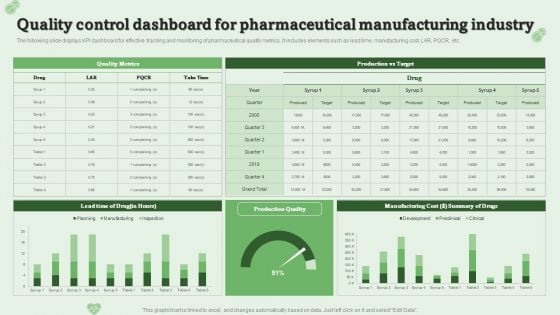
Quality Control Dashboard For Pharmaceutical Manufacturing Industry Ppt PowerPoint Presentation Model Layouts PDF
The following slide displays KPI dashboard for effective tracking and monitoring of pharmaceutical quality metrics. It includes elements such as lead time, manufacturing cost, LAR, PQCR, etc.Pitch your topic with ease and precision using this Quality Control Dashboard For Pharmaceutical Manufacturing Industry Ppt PowerPoint Presentation Model Layouts PDF. This layout presents information on Manufacturing Cost, Summary Drugs, Quality Metrics. It is also available for immediate download and adjustment. So, changes can be made in the color, design, graphics or any other component to create a unique layout.
Consumer Journey Mapping Techniques Dashboard For Tracking Social Media Platforms Introduction PDF
This slide covers the KPI dashboard for analyzing social media channels. It includes metrics such as social media followers, Facebook daily reach, Facebook engaged users and page impressions, etc. Pitch your topic with ease and precision using this Consumer Journey Mapping Techniques Dashboard For Tracking Social Media Platforms Introduction PDF. This layout presents information on Linkedin Key Metrics, Social Media Followers, Awareness. It is also available for immediate download and adjustment. So, changes can be made in the color, design, graphics or any other component to create a unique layout.
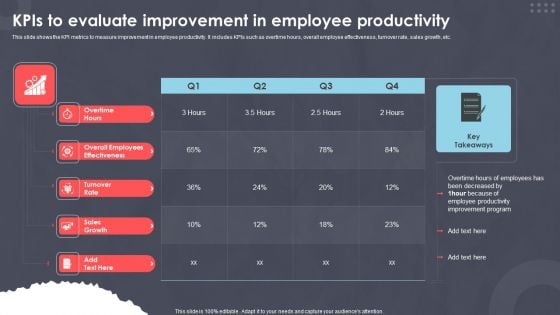
Kpis To Evaluate Improvement In Employee Productivity Ppt PowerPoint Presentation Ideas Styles PDF
This slide shows the KPI metrics to measure improvement in employee productivity. It includes KPIs such as overtime hours, overall employee effectiveness, turnover rate, sales growth, etc.Pitch your topic with ease and precision using this Kpis To Evaluate Improvement In Employee Productivity Ppt PowerPoint Presentation Ideas Styles PDF. This layout presents information on Been Decreased, Employee Productivity, Improvement Program. It is also available for immediate download and adjustment. So, changes can be made in the color, design, graphics or any other component to create a unique layout.
Consumer Journey Mapping Techniques Dashboard For Tracking Customer Service Team Performance Summary PDF
This slide covers the KPI dashboard for analyzing the performance of client support department. It includes metrics such as first call resolution, unresolved calls, average response rate, the best day to call, average time to solve issues, etc. Pitch your topic with ease and precision using this Consumer Journey Mapping Techniques Dashboard For Tracking Customer Service Team Performance Summary PDF. This layout presents information on Dashboard For Tracking Customer, Service Team Performance. It is also available for immediate download and adjustment. So, changes can be made in the color, design, graphics or any other component to create a unique layout.
Consumer Journey Mapping Techniques Loyalty Program Performance Tracking Dashboard Portrait PDF
This slide covers the KPI dashboard for analyzing customer loyalty campaign results. It includes metrics such as revenue, liability, NQP accrued, transaction count, members, redemption ratio, etc. Pitch your topic with ease and precision using this Consumer Journey Mapping Techniques Loyalty Program Performance Tracking Dashboard Portrait PDF. This layout presents information on Transaction Count, Revenue, Redemption Ratio. It is also available for immediate download and adjustment. So, changes can be made in the color, design, graphics or any other component to create a unique layout.
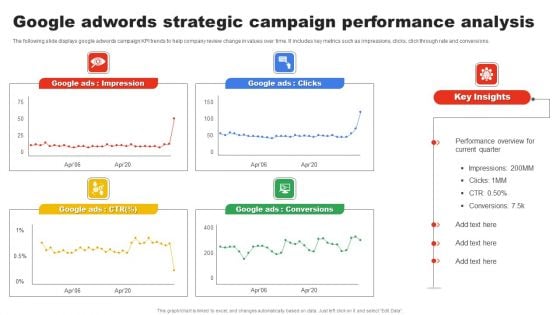
Google Adwords Strategic Campaign Performance Analysis Download PDF
The following slide displays google adwords campaign KPI trends to help company review change in values over time. It includes key metrics such as impressions, clicks, click through rate and conversions. Pitch your topic with ease and precision using this Google Adwords Strategic Campaign Performance Analysis Download PDF. This layout presents information on Google Ads Impression, Google Ads Clicks, Google Ads Conversions. It is also available for immediate download and adjustment. So, changes can be made in the color, design, graphics or any other component to create a unique layout.
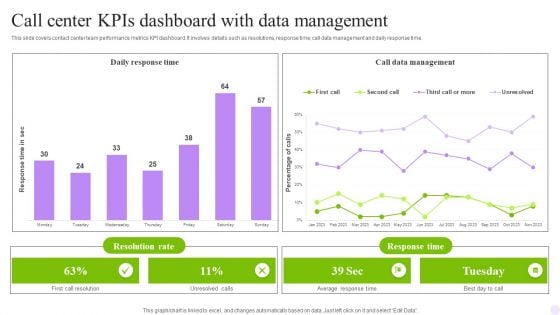
Call Center Kpis Dashboard With Data Management Infographics PDF
This slide covers contact center metrics KPI dashboard with call data details. It involves details such as total number of contacts handled, product sales, repeated calls and contact handles per day. Pitch your topic with ease and precision using this Call Center Kpis Dashboard With Data Management Infographics PDF. This layout presents information on Achieved, Contacts Handled, Repeated Calls. It is also available for immediate download and adjustment. So, changes can be made in the color, design, graphics or any other component to create a unique layout.
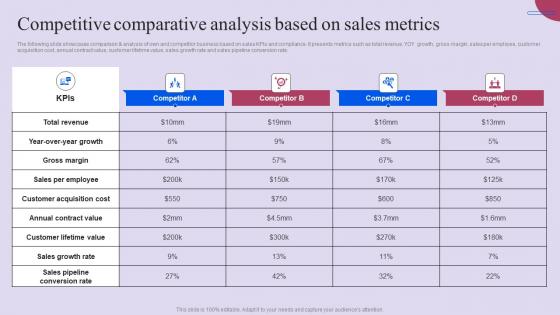
Competitive Comparative Analysis Based On Sales Metrics Ppt File Designs Pdf
The following slide showcases comparison and analysis of own and competitor business based on sales KPIs and compliance. It presents metrics such as total revenue, YOY growth, gross margin, sales per employee, customer acquisition cost, annual contract value, customer lifetime value, sales growth rate and sales pipeline conversion rate. There are so many reasons you need a Competitive Comparative Analysis Based On Sales Metrics Ppt File Designs Pdf. The first reason is you can not spend time making everything from scratch, Thus, Slidegeeks has made presentation templates for you too. You can easily download these templates from our website easily. The following slide showcases comparison and analysis of own and competitor business based on sales KPIs and compliance. It presents metrics such as total revenue, YOY growth, gross margin, sales per employee, customer acquisition cost, annual contract value, customer lifetime value, sales growth rate and sales pipeline conversion rate.
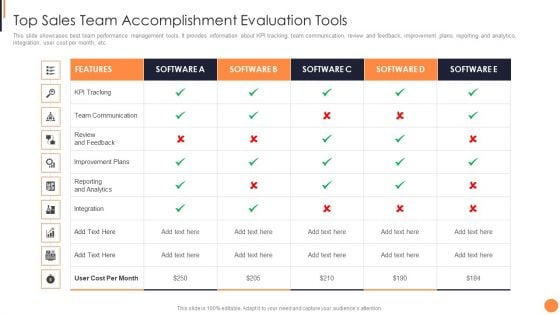
Top Sales Team Accomplishment Evaluation Tools Structure PDF
This slide showcases best team performance management tools. It provides information about KPI tracking, team communication, review and feedback, improvement plans, reporting and analytics, integration, user cost per month, etc.Pitch your topic with ease and precision using this top sales team accomplishment evaluation tools structure pdf This layout presents information on top sales team accomplishment evaluation tools It is also available for immediate download and adjustment. So, changes can be made in the color, design, graphics or any other component to create a unique layout.
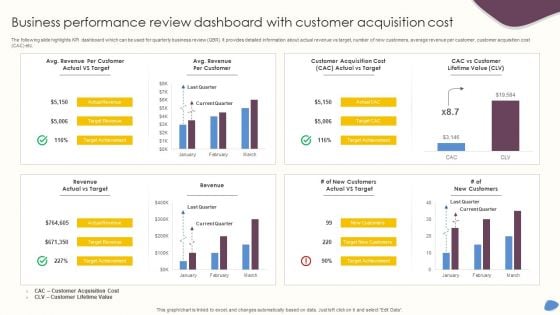
Business Performance Review Dashboard With Customer Acquisition Cost Diagrams PDF
The following slide highlights KPI dashboard which can be used for quarterly business review QBR. It provides detailed information about actual revenue vs target, number of new customers, average revenue per customer, customer acquisition cost CAC etc. Pitch your topic with ease and precision using this Business Performance Review Dashboard With Customer Acquisition Cost Diagrams PDF. This layout presents information on Revenue, Customer Acquisition Cost, Current Quarter. It is also available for immediate download and adjustment. So, changes can be made in the color, design, graphics or any other component to create a unique layout.
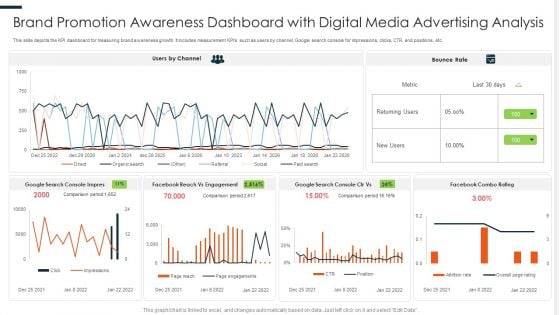
Brand Promotion Awareness Dashboard With Digital Media Advertising Analysis Ppt PowerPoint Presentation Design Ideas PDF
This slide depicts the KPI dashboard for measuring brand awareness growth. It includes measurement KPIs such as users by channel, Google search console for impressions, clicks, CTR, and positions, etc. Pitch your topic with ease and precision using this Brand Promotion Awareness Dashboard With Digital Media Advertising Analysis Ppt PowerPoint Presentation Design Ideas PDF. This layout presents information on Console Impress, Reach Engagement, Combo Rating. It is also available for immediate download and adjustment. So, changes can be made in the color, design, graphics or any other component to create a unique layout.
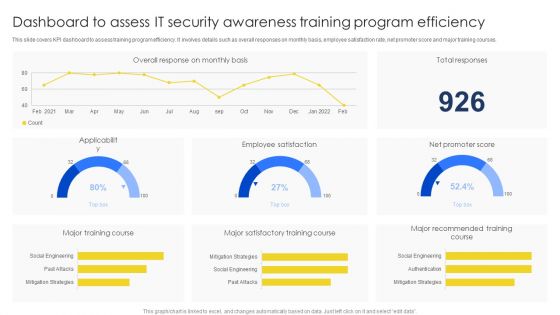
Dashboard To Assess IT Security Awareness Training Program Efficiency Brochure PDF
This slide covers KPI dashboard to assess training program efficiency. It involves details such as overall responses on monthly basis, employee satisfaction rate, net promoter score and major training courses. Pitch your topic with ease and precision using this Dashboard To Assess IT Security Awareness Training Program Efficiency Brochure PDF. This layout presents information on Major Training Course, Major Satisfactory, Training Course. It is also available for immediate download and adjustment. So, changes can be made in the color, design, graphics or any other component to create a unique layout.
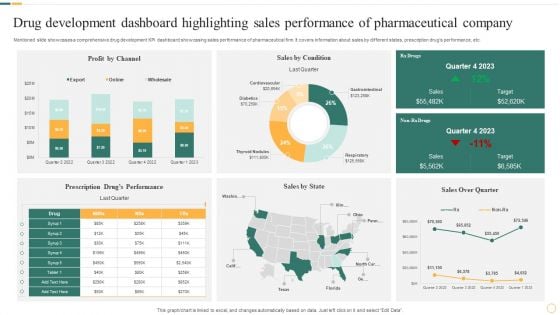
Drug Development Dashboard Highlighting Sales Performance Of Pharmaceutical Company Microsoft PDF
Mentioned slide showcases a comprehensive drug development KPI dashboard showcasing sales performance of pharmaceutical firm. It covers information about sales by different states, prescription drugs performance, etc. Pitch your topic with ease and precision using this Drug Development Dashboard Highlighting Sales Performance Of Pharmaceutical Company Microsoft PDF. This layout presents information on Sales By Condition, Profit By Channel, Sales By State. It is also available for immediate download and adjustment. So, changes can be made in the color, design, graphics or any other component to create a unique layout.
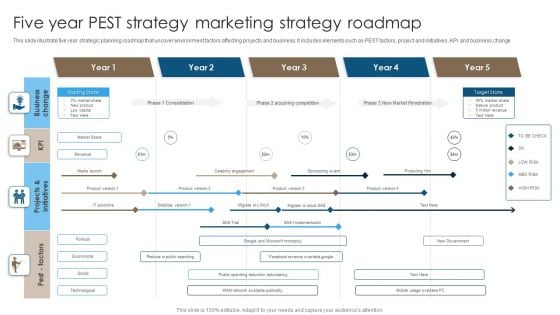
Five Year PEST Strategy Marketing Strategy Roadmap Structure PDF
This slide illustrate five year strategic planning roadmap that uncover environment factors affecting projects and business. It includes elements such as PEST factors, project and initiatives, KPI and business change. Pitch your topic with ease and precision using this Five Year PEST Strategy Marketing Strategy Roadmap Structure PDF. This layout presents information on Acquiring Competition, New Market Penetration, Consolidation. It is also available for immediate download and adjustment. So, changes can be made in the color, design, graphics or any other component to create a unique layout.
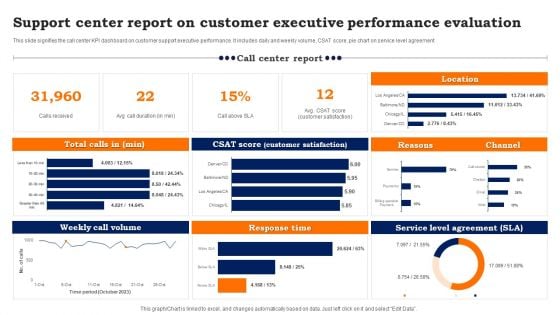
Support Center Report On Customer Executive Performance Evaluation Background PDF
This slide signifies the call center KPI dashboard on customer support executive performance. It includes daily and weekly volume, CSAT score, pie chart on service level agreement. Pitch your topic with ease and precision using this Support Center Report On Customer Executive Performance Evaluation Background PDF. This layout presents information on Weekly Call Volume, Response Time, Service Level Agreement. It is also available for immediate download and adjustment. So, changes can be made in the color, design, graphics or any other component to create a unique layout.
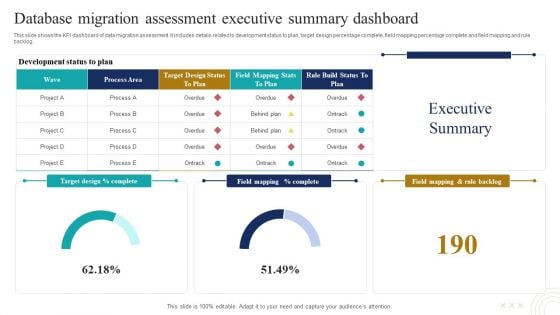
Database Migration Assessment Executive Summary Dashboard Mockup PDF
This slide shows the KPI dashboard of data migration assessment. It includes details related to development status to plan, target design percentage complete, field mapping percentage complete and field mapping and rule backlog. Pitch your topic with ease and precision using this Database Migration Assessment Executive Summary Dashboard Mockup PDF. This layout presents information on Wave, Process Area, Rule Build Status Plan. It is also available for immediate download and adjustment. So, changes can be made in the color, design, graphics or any other component to create a unique layout
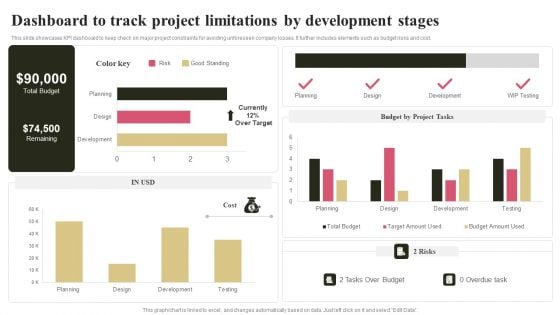
Dashboard To Track Project Limitations By Development Stages Ideas PDF
This slide showcases KPI dashboard to keep check on major project constraints for avoiding unforeseen company losses. It further includes elements such as budget risks and cost. Pitch your topic with ease and precision using this Dashboard To Track Project Limitations By Development Stages Ideas PDF. This layout presents information on Budget By Project Tasks, Risks. It is also available for immediate download and adjustment. So, changes can be made in the color, design, graphics or any other component to create a unique layout.
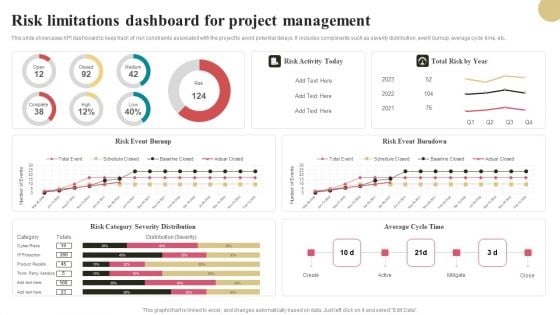
Risk Limitations Dashboard For Project Management Elements PDF
This slide showcases KPI dashboard to keep track of risk constraints associated with the project to avoid potential delays. It includes components such as severity distribution, event burnup, average cycle time, etc. Showcasing this set of slides titled Risk Limitations Dashboard For Project Management Elements PDF. The topics addressed in these templates are Risk Activity Today, Risk Event Burndown, Average Cycle Time. All the content presented in this PPT design is completely editable. Download it and make adjustments in color, background, font etc. as per your unique business setting.
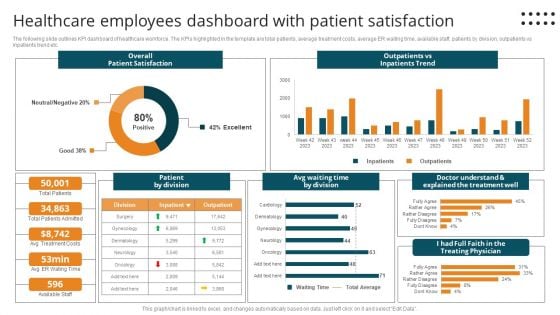
Healthcare Employees Dashboard With Patient Satisfaction Mockup PDF
The following slide outlines KPI dashboard of healthcare workforce. The KPIs highlighted in the template are total patients, average treatment costs, average ER waiting time, available staff, patients by division, outpatients vs inpatients trend etc.Pitch your topic with ease and precision using this Healthcare Employees Dashboard With Patient Satisfaction Mockup PDF. This layout presents information on Patient Satisfaction, Outpatients Inpatients Trend, Doctor Understand. It is also available for immediate download and adjustment. So, changes can be made in the color, design, graphics or any other component to create a unique layout.
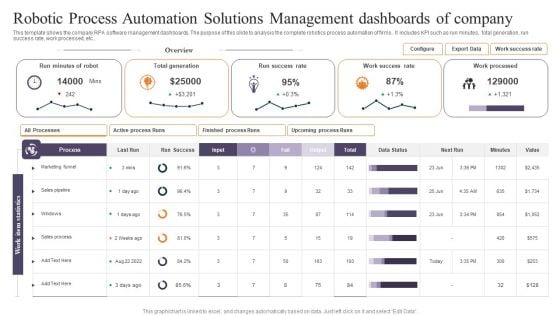
Robotic Process Automation Solutions Management Dashboards Of Company Elements PDF
This template shows the company RPA software management dashboards. The purpose of this slide to analysis the complete robotics process automation of firms . It includes KPI such as run minutes, total generation, run success rate, work processed, etc. Pitch your topic with ease and precision using this Robotic Process Automation Solutions Management Dashboards Of Company Elements PDF. This layout presents information on Minutes Of Robot, Total Generation, Success Rate. It is also available for immediate download and adjustment. So, changes can be made in the color, design, graphics or any other component to create a unique layout.

Dashboard For Transaction Overview By Purchase Currency Template PDF
The following slide displays KPI dashboard to track transaction summary for buying and selling of foreign currency. It includes elements such as net settlement, total fees, reverse activity, refunds, sales, count, etc. Pitch your topic with ease and precision using this Dashboard For Transaction Overview By Purchase Currency Template PDF. This layout presents information on Purchase Currency, Reconciliation Activity, Returned Payment. It is also available for immediate download and adjustment. So, changes can be made in the color, design, graphics or any other component to create a unique layout.
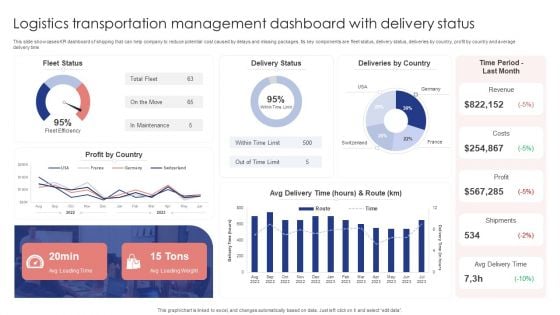
Logistics Transportation Management Dashboard With Delivery Status Portrait PDF
This slide showcases KPI dashboard of shipping that can help company to reduce potential cost caused by delays and missing packages. Its key components are fleet status, delivery status, deliveries by country, profit by country and average delivery time. Showcasing this set of slides titled Logistics Transportation Management Dashboard With Delivery Status Portrait PDF. The topics addressed in these templates are Fleet Status, Delivery Status, Deliveries By Country. All the content presented in this PPT design is completely editable. Download it and make adjustments in color, background, font etc. as per your unique business setting.
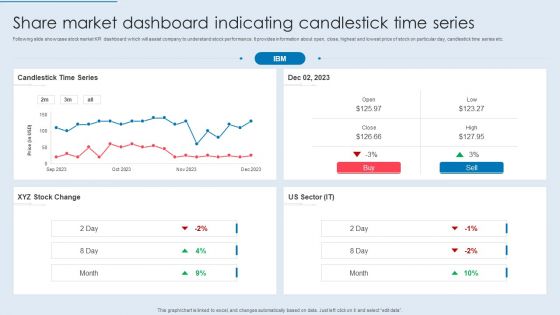
Share Market Dashboard Indicating Candlestick Time Series Formats PDF
Following slide showcase stock market KPI dashboard which will assist company to understand stock performance. It provides information about open, close, highest and lowest price of stock on particular day, candlestick time series etc. Pitch your topic with ease and precision using this Share Market Dashboard Indicating Candlestick Time Series Formats PDF. This layout presents information on Candlestick Time Series, Stock Change, US Sector. It is also available for immediate download and adjustment. So, changes can be made in the color, design, graphics or any other component to create a unique layout.
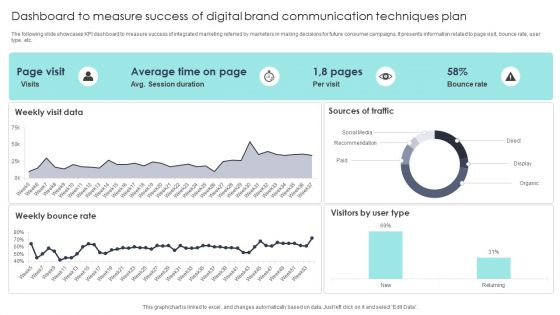
Dashboard To Measure Success Of Digital Brand Communication Techniques Plan Themes PDF
The following slide showcases KPI dashboard to measure success of integrated marketing referred by marketers in making decisions for future consumer campaigns. It presents information related to page visit, bounce rate, user type, etc. Pitch your topic with ease and precision using this Dashboard To Measure Success Of Digital Brand Communication Techniques Plan Themes PDF. This layout presents information on Sources Of Traffic, Social Media, Brand Communication Techniques Plan. It is also available for immediate download and adjustment. So, changes can be made in the color, design, graphics or any other component to create a unique layout.
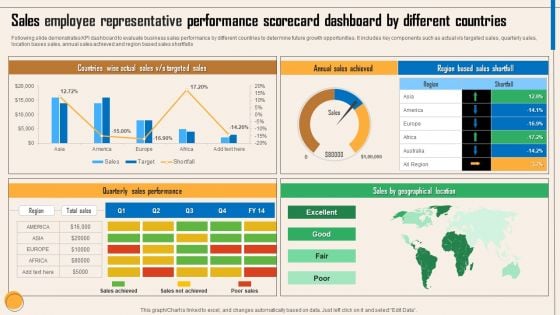
Sales Employee Representative Performance Scorecard Dashboard By Different Countries Themes PDF
Following slide demonstrates KPI dashboard to evaluate business sales performance by different countries to determine future growth opportunities. It includes key components such as actual v or s targeted sales, quarterly sales, location bases sales, annual sales achieved and region based sales shortfalls. Showcasing this set of slides titled Sales Employee Representative Performance Scorecard Dashboard By Different Countries Themes PDF. The topics addressed in these templates are Countries Wise Actual Sales, V Or S Targeted Sales, Annual Sales Achieved, Quarterly Sales Performance, Sales By Geographical Location. All the content presented in this PPT design is completely editable. Download it and make adjustments in color, background, font etc. as per your unique business setting.
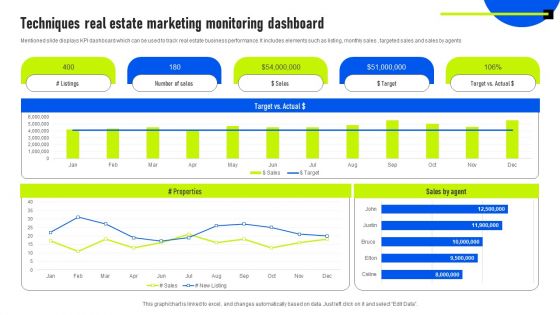
Techniques Real Estate Marketing Monitoring Dashboard Guidelines PDF
Mentioned slide displays KPI dashboard which can be used to track real estate business performance. It includes elements such as listing, monthly sales , targeted sales and sales by agents. Pitch your topic with ease and precision using this Techniques Real Estate Marketing Monitoring Dashboard Guidelines PDF. This layout presents information on Sales By Agent, Target, Marketing Monitoring Dashboard. It is also available for immediate download and adjustment. So, changes can be made in the color, design, graphics or any other component to create a unique layout.

Enterprise Recruitment Dashboard With Cost Per Hire Graphics PDF
The following slide showcases KPI dashboard to get real- time insights about efficiency of corporate staffing process in the organization. It includes elements such as hired, days to fill, sources contribution, etc. Pitch your topic with ease and precision using this Enterprise Recruitment Dashboard With Cost Per Hire Graphics PDF. This layout presents information on Enterprise, Contribution, Cost. It is also available for immediate download and adjustment. So, changes can be made in the color, design, graphics or any other component to create a unique layout.
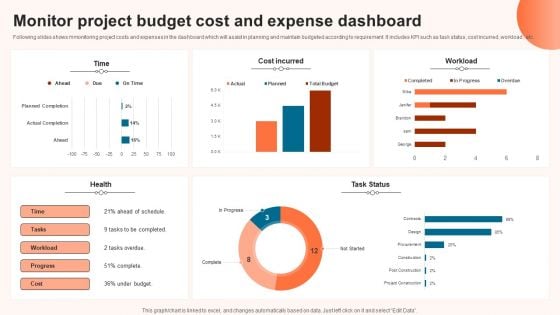
Monitor Project Budget Cost And Expense Dashboard Brochure PDF
Following slides shows mmonitoring project costs and expenses in the dashboard which will assist in planning and maintain budgeted according to requirement. It includes KPI such as task status, cost incurred ,workload , etc. Pitch your topic with ease and precision using this Monitor Project Budget Cost And Expense Dashboard Brochure PDF. This layout presents information on Expense Dashboard, Monitor Project Budget Cost. It is also available for immediate download and adjustment. So, changes can be made in the color, design, graphics or any other component to create a unique layout.
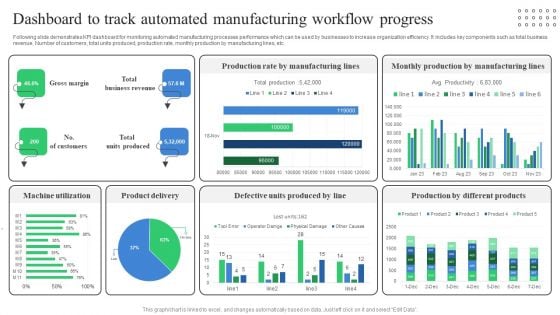
Dashboard To Track Automated Manufacturing Workflow Progress Professional PDF
Following slide demonstrates KPI dashboard for monitoring automated manufacturing processes performance which can be used by businesses to increase organization efficiency. It includes key components such as total business revenue, Number of customers, total units produced, production rate, monthly production by manufacturing lines, etc. Showcasing this set of slides titled Dashboard To Track Automated Manufacturing Workflow Progress Professional PDF. The topics addressed in these templates are Machine Utilization, Product Delivery, Defective Units Produced. All the content presented in this PPT design is completely editable. Download it and make adjustments in color, background, font etc. as per your unique business setting.
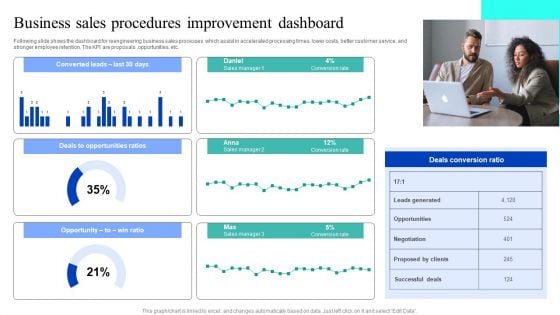
Business Sales Procedures Improvement Dashboard Designs PDF
Following slide shows the dashboard for reengineering business sales processes which assist in accelerated processing times, lower costs, better customer service, and stronger employee retention. The KPI are proposals ,opportunities, etc. Pitch your topic with ease and precision using this Business Sales Procedures Improvement Dashboard Designs PDF. This layout presents information on Deals Opportunities Ratios, Opportunity, Deals Conversion Ratio. It is also available for immediate download and adjustment. So, changes can be made in the color, design, graphics or any other component to create a unique layout.
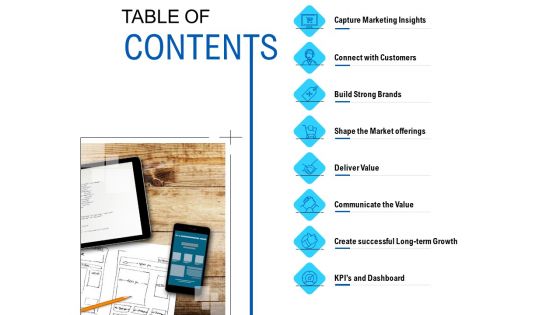
Competition In Market TABLE OF CONTENTS Ppt Portfolio Sample PDF Ppt Slide PDF
This is a competition in market table of contents ppt portfolio sample pdf ppt slide pdf. template with various stages. Focus and dispense information on eight stages using this creative set, that comes with editable features. It contains large content boxes to add your information on topics like capture marketing insights, connect with customers, build strong brands, shape market offerings, deliver value, communicate value, create successful long term growth, kpi s and dashboard. You can also showcase facts, figures, and other relevant content using this PPT layout. Grab it now.
Business Plan Methods Tools And Templates Set 2 OGSM Framework Model Converts Strategy Into Action Icons PDF
This slide covers the objectives, goals, strategies and measures model of a digital marketing firm. This is a business plan methods tools and templates set 2 ogsm framework model converts strategy into action icons pdf template with various stages. Focus and dispense information on four stages using this creative set, that comes with editable features. It contains large content boxes to add your information on topics like goals, strategies, kpi measure, tactical actions. You can also showcase facts, figures, and other relevant content using this PPT layout. Grab it now.

Key Facts And Figures Of Global Devops Market Ppt Ideas Tips PDF
Following slide provides key facts and figures of global DevOps market. It shows that global DevOps market will grow with a CAGR greater than 20persent during 2020-26 period.This is a key facts and figures of global devops market ppt ideas tips pdf template with various stages. Focus and dispense information on five stages using this creative set, that comes with editable features. It contains large content boxes to add your information on topics like kpi dashboard for monitoring project progress You can also showcase facts, figures, and other relevant content using this PPT layout. Grab it now.
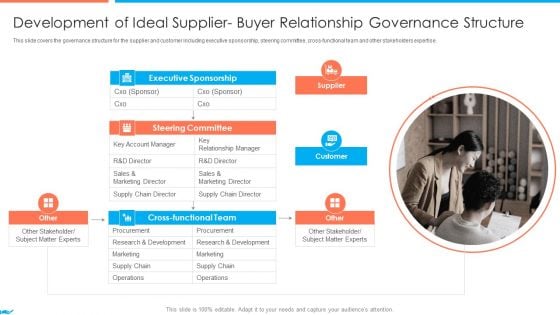
Supplier Association Management Techniques Development Of Ideal Supplier Buyer Guidelines PDF
This slide covers the governance structure for the supplier and customer including executive sponsorship, steering committee, cross functional team and other stakeholders expertise. This is a supplier association management techniques development of ideal supplier buyer guidelines pdf template with various stages. Focus and dispense information on three stages using this creative set, that comes with editable features. It contains large content boxes to add your information on topics like supplier association management techniques supplier performance management kpi dashboards guidelines pdf. You can also showcase facts, figures, and other relevant content using this PPT layout. Grab it now.
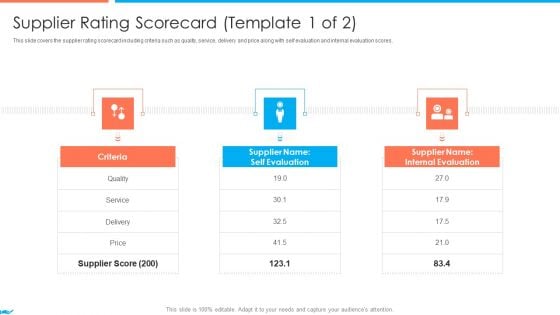
Supplier Association Management Techniques Supplier Rating Scorecard Template Criteria Mockup PDF
This slide covers the supplier rating scorecard including criteria such as quality, service, delivery and price along with self evaluation and internal evaluation scores. This is a supplier association management techniques supplier performance management kpi dashboards guidelines pdf template with various stages. Focus and dispense information on three stages using this creative set, that comes with editable features. It contains large content boxes to add your information on topics like reduction in costs, increased efficiency, increase in profitability. You can also showcase facts, figures, and other relevant content using this PPT layout. Grab it now.
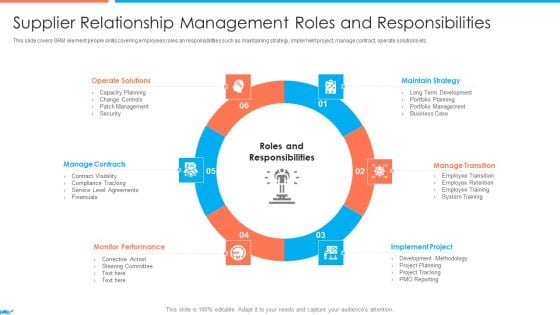
Supplier Association Management Techniques Supplier Relationship Management Roles Slides PDF
This slide covers SRM element people skills covering employees roles an responsibilities such as maintaining strategy, implement project, manage contract, operate solutions ect. This is a supplier association management techniques supplier performance management kpi dashboards guidelines pdf template with various stages. Focus and dispense information on six stages using this creative set, that comes with editable features. It contains large content boxes to add your information on topics like reduction in costs, increased efficiency, increase in profitability. You can also showcase facts, figures, and other relevant content using this PPT layout. Grab it now.
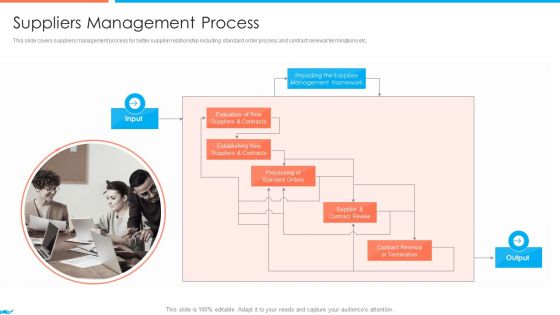
Supplier Association Management Techniques Suppliers Management Process Introduction PDF
This slide covers suppliers management process for better supplier relationship including standard order process and contract renewal terminations etc. This is a supplier association management techniques supplier performance management kpi dashboards guidelines pdf template with various stages. Focus and dispense information on two stages using this creative set, that comes with editable features. It contains large content boxes to add your information on topics like transactional level, review of performance, strategic alliance. You can also showcase facts, figures, and other relevant content using this PPT layout. Grab it now.

Strategic Business Plan Effective Tools Ogsm Framework Model Converts Strategy Into Action Background PDF
This slide covers the objectives, goals, strategies and measures model of a digital marketing firm. This is a strategic business plan effective tools ogsm framework model converts strategy into action background pdf template with various stages. Focus and dispense information on four stages using this creative set, that comes with editable features. It contains large content boxes to add your information on topics like goals, strategies, kpi measure, tactical actions. You can also showcase facts, figures, and other relevant content using this PPT layout. Grab it now.
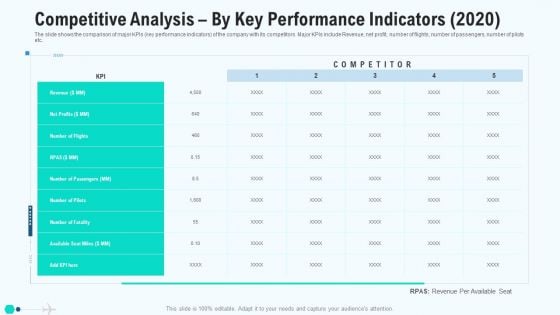
Competitive Analysis By Key Performance Indicators 2020 Elements PDF
The slide shows the comparison of major KPIs key performance indicators of the company with its competitors. Major KPIs include Revenue, net profit, number of flights, number of passengers, number of pilots etc. Deliver an awe inspiring pitch with this creative competitive analysis by key performance indicators 2020 elements pdf bundle. Topics like competitive analysis by key performance indicators can be discussed with this completely editable template. It is available for immediate download depending on the needs and requirements of the user.
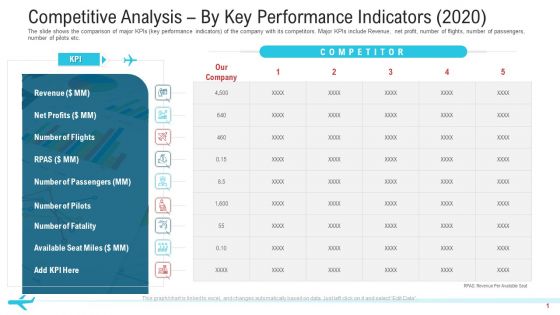
Competitive Analysis By Key Performance Indicators 2020 Designs PDF
The slide shows the comparison of major KPIs key performance indicators of the company with its competitors. Major KPIs include Revenue, net profit, number of flights, number of passengers, number of pilots etc.Deliver an awe-inspiring pitch with this creative competitive analysis by key performance indicators 2020 designs pdf. bundle. Topics like net profits, revenue, number of passengers can be discussed with this completely editable template. It is available for immediate download depending on the needs and requirements of the user.
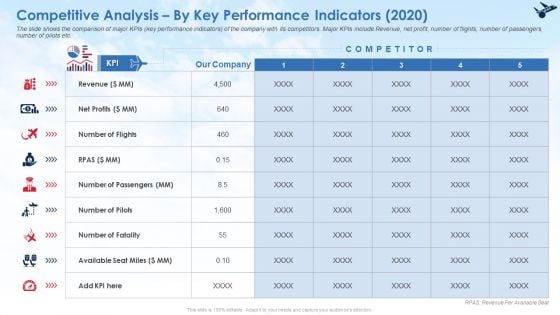
Competitive Analysis By Key Performance Indicators 2020 Professional PDF
The slide shows the comparison of major KPIs key performance indicators of the company with its competitors. Major KPIs include Revenue, net profit, number of flights, number of passengers, number of pilots etc. Deliver an awe inspiring pitch with this creative competitive analysis by key performance indicators 2020 professional pdf bundle. Topics like revenue, net profits can be discussed with this completely editable template. It is available for immediate download depending on the needs and requirements of the user.

Marketing Process Pain Points And Solutions Ppt Sample SS
This slide covers advertising process problems and solutions. The challenges are focus on wrong audience, lack of process definition, error in data analysis and less alignment with sales team. The solutions are develop data driven persona, use software such as Trello, identify KPI etc. Whether you have daily or monthly meetings, a brilliant presentation is necessary. Marketing Process Pain Points And Solutions Ppt Sample SS can be your best option for delivering a presentation. Represent everything in detail using Marketing Process Pain Points And Solutions Ppt Sample SS and make yourself stand out in meetings. The template is versatile and follows a structure that will cater to your requirements. All the templates prepared by Slidegeeks are easy to download and edit. Our research experts have taken care of the corporate themes as well. So, give it a try and see the results. This slide covers advertising process problems and solutions. The challenges are focus on wrong audience, lack of process definition, error in data analysis and less alignment with sales team. The solutions are develop data driven persona, use software such as Trello, identify KPI etc.


 Continue with Email

 Home
Home


