Kpi Compliance
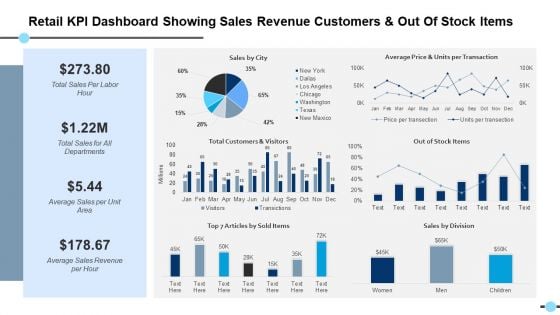
Retail Kpi Dashboard Showing Sales Revenue Customers And Out Of Stock Items Out Of Stock Items Ppt PowerPoint Presentation Files
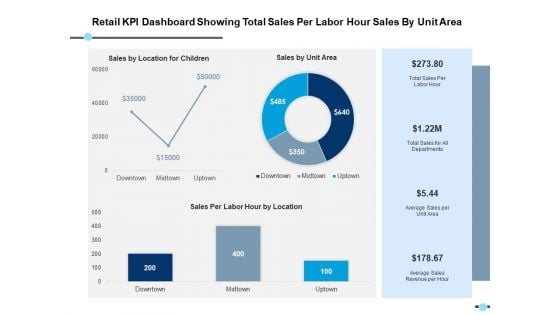
Retail Kpi Dashboard Showing Total Sales Per Labor Hour Sales By Unit Area Ppt PowerPoint Presentation Model Format
This is a retail kpi dashboard showing total sales per labor hour sales by unit area ppt powerpoint presentation model format. This is a three stage process. The stages in this process are finance, strategy, analysis, marketing.
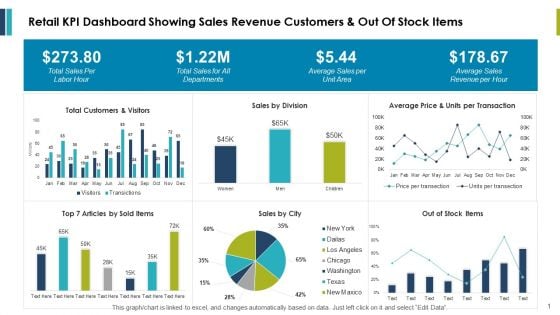
Retail Kpi Dashboard Showing Sales Revenue Customers And Out Of Stock Items Ppt PowerPoint Presentation Outline Example
This is a retail kpi dashboard showing sales revenue customers and out of stock items ppt powerpoint presentation outline example. This is a three stage process. The stages in this process are finance, marketing, management, investment, analysis.
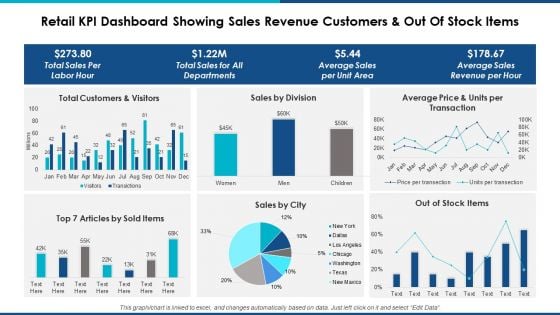
Retail Kpi Dashboard Showing Sales Revenue Customers And Out Of Stock Items Ppt Powerpoint Presentation Professional Background Designs
This is a retail kpi dashboard showing sales revenue customers and out of stock items ppt powerpoint presentation professional background designs. This is a six stage process. The stages in this process are finance, marketing, management, investment, analysis.
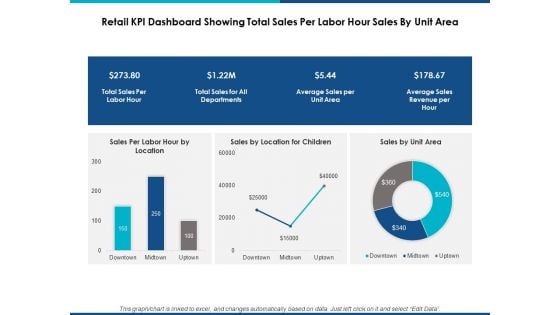
Retail Kpi Dashboard Showing Total Sales Per Labor Hour Sales By Unit Area Ppt Powerpoint Presentation Show Graphic Tips
This is a retail kpi dashboard showing total sales per labor hour sales by unit area ppt powerpoint presentation show graphic tips. This is a three stage process. The stages in this process are finance, marketing, management, investment, analysis.
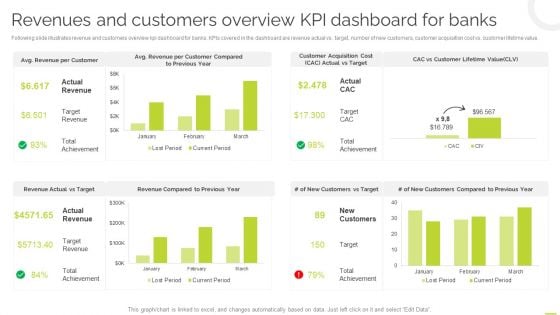
Effective BPM Tool For Business Process Management Revenues And Customers Overview KPI Dashboard For Banks Elements PDF
Following slide illustrates revenue and customers overview kpi dashboard for banks. KPIs covered in the dashboard are revenue actual vs target, number of new customers, customer acquisition cost vs. customer lifetime value. This Effective BPM Tool For Business Process Management Revenues And Customers Overview KPI Dashboard For Banks Elements PDF is perfect for any presentation, be it in front of clients or colleagues. It is a versatile and stylish solution for organizing your meetings. The Effective BPM Tool For Business Process Management Revenues And Customers Overview KPI Dashboard For Banks Elements PDF features a modern design for your presentation meetings. The adjustable and customizable slides provide unlimited possibilities for acing up your presentation. Slidegeeks has done all the homework before launching the product for you. So, do not wait, grab the presentation templates today.
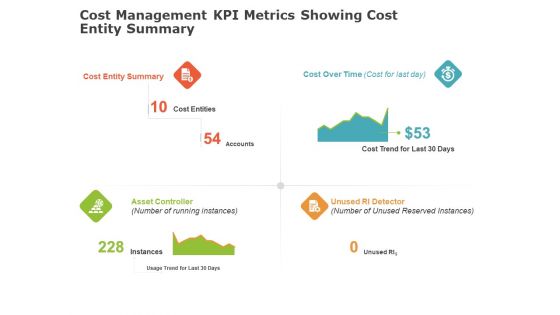
Product Cost Management PCM Cost Management KPI Metrics Showing Cost Entity Summary Ppt Layouts Slide Download PDF
Deliver and pitch your topic in the best possible manner with this product cost management pcm cost management kpi metrics showing cost entity summary ppt layouts slide download pdf. Use them to share invaluable insights on cost, asset, detector and impress your audience. This template can be altered and modified as per your expectations. So, grab it now.
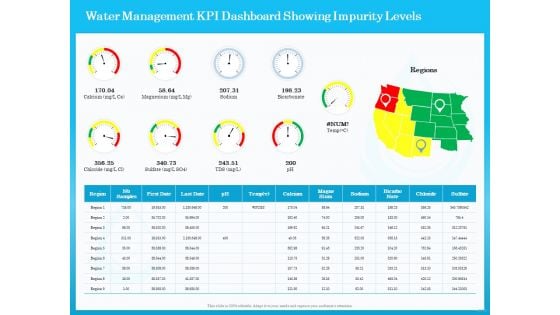
Monitoring And Evaluating Water Quality Water Management KPI Dashboard Showing Impurity Levels Ppt Show Design Inspiration PDF
Presenting this set of slides with name monitoring and evaluating water quality water management kpi dashboard showing impurity levels ppt show design inspiration pdf. The topics discussed in these slides are region, ph, magne sium, sodium, chloride, bicarbo nate. This is a completely editable PowerPoint presentation and is available for immediate download. Download now and impress your audience.

Product Cost Management PCM Cost Management KPI Dashboards Showing Return On Assets And Asset Turnover Elements PDF
Deliver an awe inspiring pitch with this creative product cost management pcm cost management kpi dashboards showing return on assets and asset turnover elements pdf bundle. Topics like return on assets, asset turnover, maintenance costs, target can be discussed with this completely editable template. It is available for immediate download depending on the needs and requirements of the user.
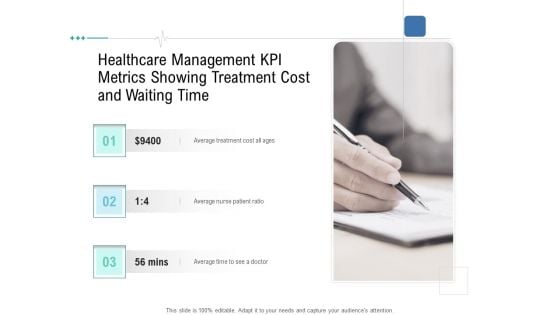
Health Centre Management Business Plan Healthcare Management KPI Metrics Showing Treatment Cost And Waiting Time Portrait PDF
Presenting health centre management business plan healthcare management kpi metrics showing treatment cost and waiting time portrait pdf to provide visual cues and insights. Share and navigate important information on three stages that need your due attention. This template can be used to pitch topics like average treatment cost all ages, average nurse patient ratio, average time to see a doctor. In addtion, this PPT design contains high resolution images, graphics, etc, that are easily editable and available for immediate download.
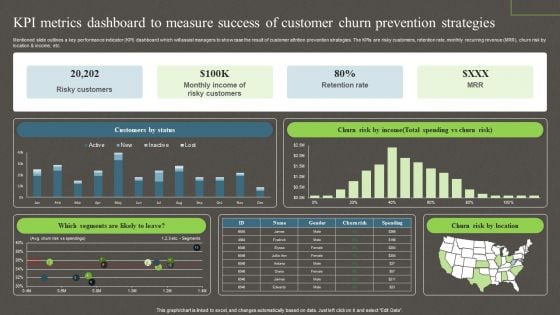
Kpi Metrics Dashboard To Measure Success Of Customer Churn Prevention Strategies Ppt PowerPoint Presentation File Model PDF
Mentioned slide outlines a key performance indicator KPI dashboard which will assist managers to showcase the result of customer attrition prevention strategies. The KPIs are risky customers, retention rate, monthly recurring revenue MRR, churn risk by location and income, etc. This Kpi Metrics Dashboard To Measure Success Of Customer Churn Prevention Strategies Ppt PowerPoint Presentation File Model PDF from Slidegeeks makes it easy to present information on your topic with precision. It provides customization options, so you can make changes to the colors, design, graphics, or any other component to create a unique layout. It is also available for immediate download, so you can begin using it right away. Slidegeeks has done good research to ensure that you have everything you need to make your presentation stand out. Make a name out there for a brilliant performance.

Product Cost Management PCM Cost Management KPI Metrics Showing Return On Investment Ppt Visual Aids Inspiration PDF
This is a product cost management pcm cost management kpi metrics showing return on investment ppt visual aids inspiration pdf template with various stages. Focus and dispense information on four stages using this creative set, that comes with editable features. It contains large content boxes to add your information on topics like performed, cost, investment, variance, return. You can also showcase facts, figures, and other relevant content using this PPT layout. Grab it now.
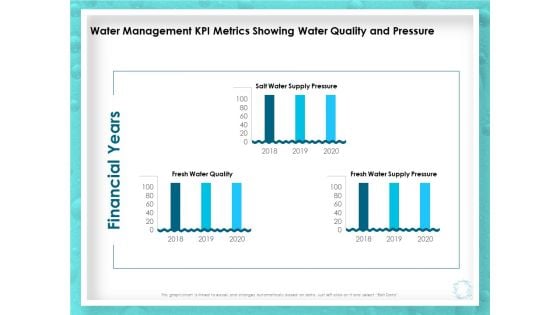
WQM System Water Management KPI Metrics Showing Water Quality And Pressure Ppt PowerPoint Presentation Model Example File PDF
Presenting this set of slides with name wqm system water management kpi metrics showing water quality and pressure ppt powerpoint presentation model example file pdf. The topics discussed in these slides are financial years, fresh water quality, fresh water supply pressure, salt water supply pressure, 2018 to 2020. This is a completely editable PowerPoint presentation and is available for immediate download. Download now and impress your audience.
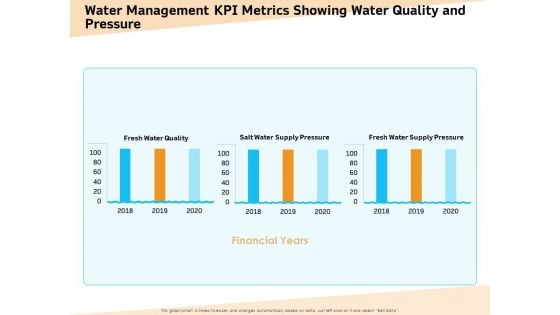
Optimization Of Water Usage Water Management KPI Metrics Showing Water Quality And Pressure Ppt Gallery Graphics PDF
Presenting this set of slides with name optimization of water usage water management kpi metrics showing water quality and pressure ppt gallery graphics pdf. The topics discussed in these slides are financial years, fresh water quality, fresh water supply pressure, salt water supply pressure, 2018 to 2020. This is a completely editable PowerPoint presentation and is available for immediate download. Download now and impress your audience.
Monitoring And Evaluating Water Quality Water Management KPI Metrics Showing Water Quality And Pressure Ppt Icon Maker PDF
Presenting this set of slides with name monitoring and evaluating water quality water management kpi metrics showing water quality and pressure ppt icon maker pdf. The topics discussed in these slides are financial years, fresh water quality, fresh water supply pressure, salt water supply pressure, 2018 to 2020. This is a completely editable PowerPoint presentation and is available for immediate download. Download now and impress your audience.
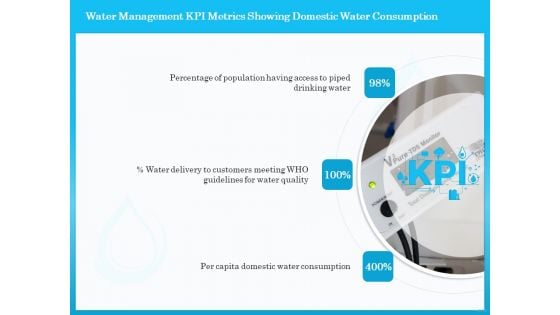
Monitoring And Evaluating Water Quality Water Management KPI Metrics Showing Domestic Water Consumption Ppt Layouts Tips PDF
Presenting this set of slides with name monitoring and evaluating water quality water management kpi metrics showing domestic water consumption ppt layouts tips pdf. This is a three stage process. The stages in this process are drinking water, customers meeting, who guidelines, water quality, per capita domestic water consumption. This is a completely editable PowerPoint presentation and is available for immediate download. Download now and impress your audience.
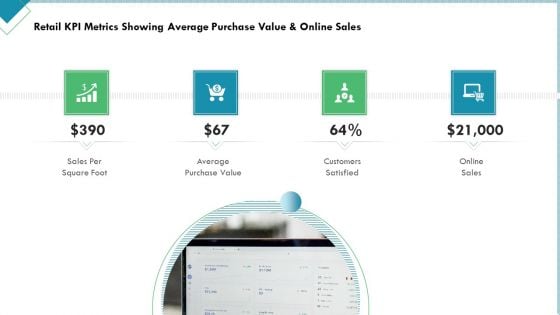
Market Analysis Of Retail Sector Retail KPI Metrics Showing Average Purchase Value And Online Sales Information PDF
Presenting market analysis of retail sector retail kpi metrics showing average purchase value and online sales information pdf to provide visual cues and insights. Share and navigate important information on four stages that need your due attention. This template can be used to pitch topics like sales per square foot, average purchase value, customers satisfied, online sales. In addtion, this PPT design contains high resolution images, graphics, etc, that are easily editable and available for immediate download.
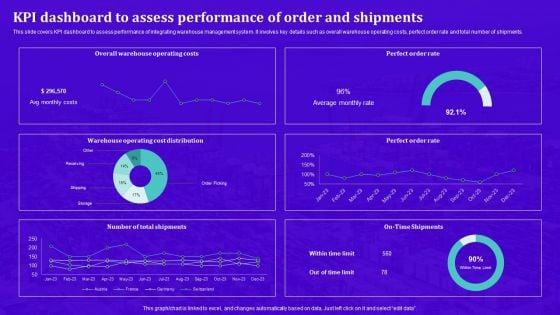
Techniques For Effective Supply Chain Management KPI Dashboard To Assess Performance Of Order And Shipments Structure PDF
This slide covers KPI dashboard to assess performance of integrating warehouse management system. It involves key details such as overall warehouse operating costs, perfect order rate and total number of shipments. Boost your pitch with our creative Techniques For Effective Supply Chain Management KPI Dashboard To Assess Performance Of Order And Shipments Structure PDF. Deliver an awe-inspiring pitch that will mesmerize everyone. Using these presentation templates you will surely catch everyones attention. You can browse the ppts collection on our website. We have researchers who are experts at creating the right content for the templates. So you do not have to invest time in any additional work. Just grab the template now and use them.
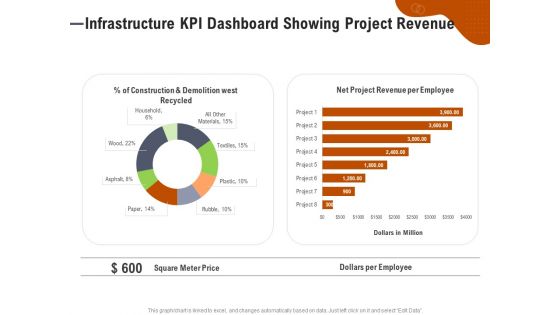
Key Features For Effective Business Management Infrastructure KPI Dashboard Showing Project Revenue Ppt Ideas File Formats PDF
Presenting this set of slides with name key features for effective business management infrastructure kpi dashboard showing project revenue ppt ideas file formats pdf. The topics discussed in these slides are construction and demolition west recycled, net project revenue per employee, square meter price, dollars per employee. This is a completely editable PowerPoint presentation and is available for immediate download. Download now and impress your audience.
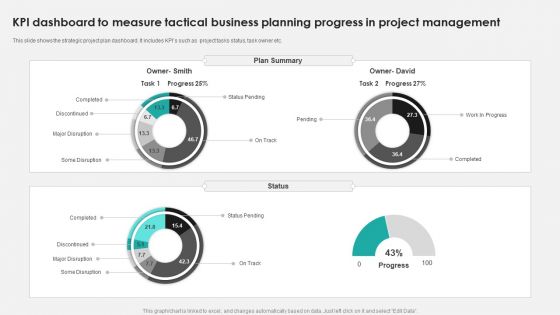
KPI Dashboard To Measure Tactical Business Planning Progress In Project Management Ppt PowerPoint Presentation File Example File PDF
This slide shows the strategic project plan dashboard. It includes KPIs such as project tasks status, task owner etc. Showcasing this set of slides titled KPI Dashboard To Measure Tactical Business Planning Progress In Project Management Ppt PowerPoint Presentation File Example File PDF. The topics addressed in these templates are Discontinued, Some Disruption, Completed. All the content presented in this PPT design is completely editable. Download it and make adjustments in color, background, font etc. as per your unique business setting.

Supply Chain Kpi Dashboard For Effective Financial Analysis Stand Out Digital Supply Chain Tactics Enhancing Graphics PDF
Mentioned slide illustrates KPI dashboard that can be used by managers to assess financial health of supply chain business. KPIs covered are supply chain costs versus sales, cash to order cycle, warehouse operating cost distribution etc.Coming up with a presentation necessitates that the majority of the effort goes into the content and the message you intend to convey. The visuals of a PowerPoint presentation can only be effective if it supplements and supports the story that is being told. Keeping this in mind our experts created Supply Chain Kpi Dashboard For Effective Financial Analysis Stand Out Digital Supply Chain Tactics Enhancing Graphics PDF to reduce the time that goes into designing the presentation. This way, you can concentrate on the message while our designers take care of providing you with the right template for the situation.
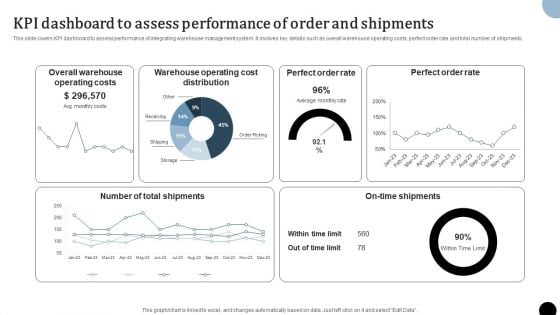
Strategy To Enhance Supply Chain Operations KPI Dashboard To Assess Performance Of Order And Shipments Professional PDF
This slide covers KPI dashboard to assess performance of integrating warehouse management system. It involves key details such as overall warehouse operating costs, perfect order rate and total number of shipments. Slidegeeks has constructed Strategy To Enhance Supply Chain Operations KPI Dashboard To Assess Performance Of Order And Shipments Professional PDF after conducting extensive research and examination. These presentation templates are constantly being generated and modified based on user preferences and critiques from editors. Here, you will find the most attractive templates for a range of purposes while taking into account ratings and remarks from users regarding the content. This is an excellent jumping off point to explore our content and will give new users an insight into our top notch PowerPoint Templates.
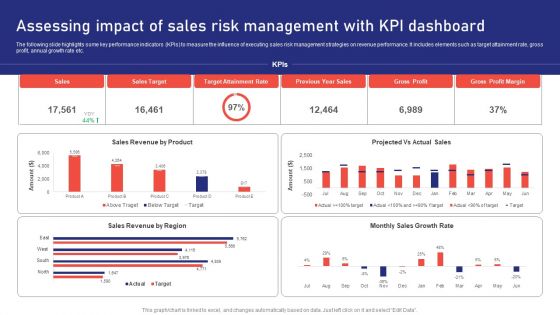
Sales Risk Assessment For Profit Maximization Assessing Impact Of Sales Risk Management With Kpi Dashboard Inspiration PDF
The following slide highlights some key performance indicators KPIs to measure the influence of executing sales risk management strategies on revenue performance. It includes elements such as target attainment rate, gross profit, annual growth rate etc. Find a pre designed and impeccable Sales Risk Assessment For Profit Maximization Assessing Impact Of Sales Risk Management With Kpi Dashboard Inspiration PDF. The templates can ace your presentation without additional effort. You can download these easy to edit presentation templates to make your presentation stand out from others. So, what are you waiting for Download the template from Slidegeeks today and give a unique touch to your presentation.
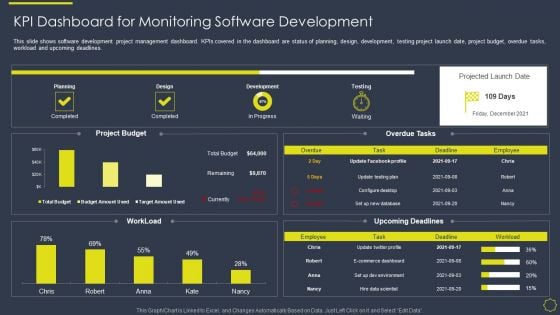
Implementing Development And Operations Platforms For In Time Product Launch IT KPI Dashboard For Monitoring Elements PDF
This slide shows software development project management dashboard. KPIs covered in the dashboard are status of planning, design, development, testing project launch date, project budget, overdue tasks, workload and upcoming deadlines. Deliver and pitch your topic in the best possible manner with this implementing development and operations platforms for in time product launch it kpi dashboard for monitoring elements pdf. Use them to share invaluable insights on development, design, development, planning and impress your audience. This template can be altered and modified as per your expectations. So, grab it now.
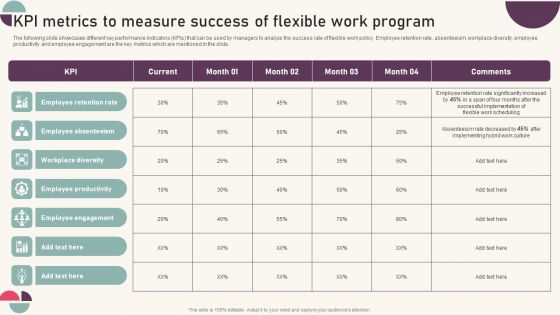
Tactics For Establishing Sustainable Hybrid Work Environment Kpi Metrics To Measure Success Of Flexible Work Mockup PDF
The following slide showcases different key performance indicators KPIs that can be used by managers to analyze the success rate of flexible work policy. Employee retention rate, absenteeism, workplace diversity, employee productivity and employee engagement are the key metrics which are mentioned in the slide. The best PPT templates are a great way to save time, energy, and resources. Slidegeeks have 100 percent editable powerpoint slides making them incredibly versatile. With these quality presentation templates, you can create a captivating and memorable presentation by combining visually appealing slides and effectively communicating your message. Download Tactics For Establishing Sustainable Hybrid Work Environment Kpi Metrics To Measure Success Of Flexible Work Mockup PDF from Slidegeeks and deliver a wonderful presentation.

Actual Project Management Linguistic Presentation Visual Aids
This is a actual project management linguistic presentation visual aids. This is a four stage process. The stages in this process are area, kpi name, target compliance, actual, linguistic, project management, engineering, finance.
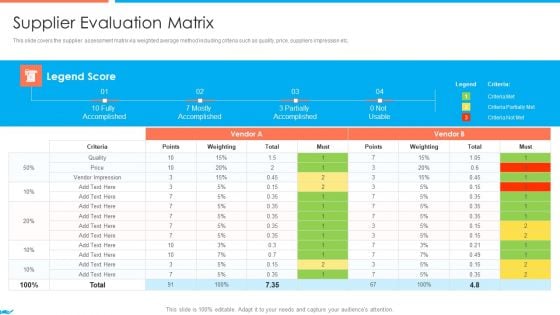
Supplier Association Management Techniques Supplier Evaluation Matrix Summary PDF
This slide covers the supplier assessment matric via weighted average method including criteria such as quality, price, suppliers impression etc. Deliver and pitch your topic in the best possible manner with this supplier association management techniques supplier compliance kpi dashboard topics pdf. Use them to share invaluable insights on reduction in costs increased efficiency, increase in profitability and impress your audience. This template can be altered and modified as per your expectation. So, grab it now.
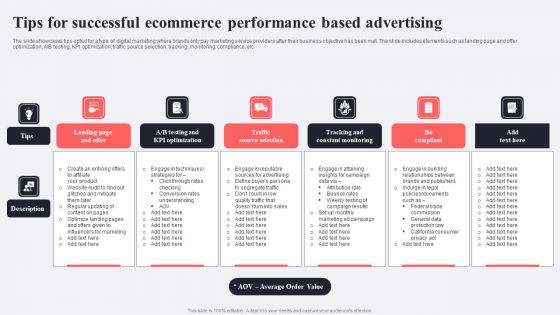
Tips For Successful Ecommerce Performance Based Advertising Clipart PDF
The slide showcases tips opted for a type of digital marketing where brands only pay marketing service providers after their business objective has been met. The slide includes elements such as landing page and offer optimization, A B testing, KPI optimization, traffic source selection, tracking, monitoring, compliance, etc. Presenting Tips For Successful Ecommerce Performance Based Advertising Clipart PDF to dispense important information. This template comprises six stages. It also presents valuable insights into the topics including Landing Page Offer, Testing KPI Optimization, Traffic Source Selection. This is a completely customizable PowerPoint theme that can be put to use immediately. So, download it and address the topic impactfully.
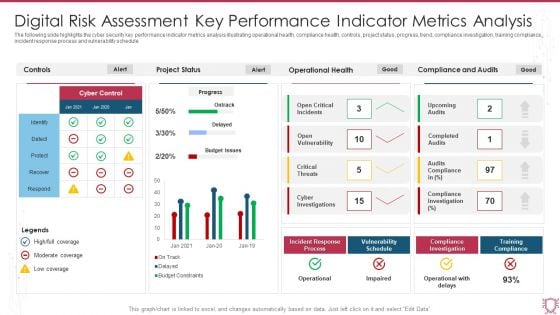
Digital Risk Assessment Key Performance Indicator Metrics Analysis Infographics PDF
The following slide highlights the cyber security key performance indicator metrics analysis illustrating operational health, compliance health, controls, project status, progress, trend, compliance investigation, training compliance, incident response process and vulnerability schedule. Showcasing this set of slides titled Digital Risk Assessment Key Performance Indicator Metrics Analysis Infographics PDF. The topics addressed in these templates are Project Status, Operational Health, Compliance And Audits. All the content presented in this PPT design is completely editable. Download it and make adjustments in color, background, font etc. as per your unique business setting.
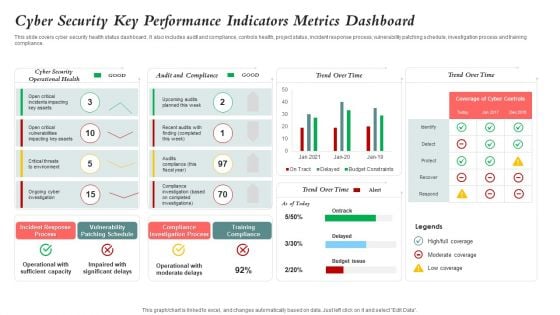
Cyber Security Key Performance Indicators Metrics Dashboard Mockup PDF
This slide covers cyber security health status dashboard . It also includes audit and compliance, controls health, project status, incident response process, vulnerability patching schedule, investigation process and training compliance. Pitch your topic with ease and precision using this Cyber Security Key Performance Indicators Metrics Dashboard Mockup PDF. This layout presents information on Cyber Security, Vulnerability Patching Schedule, Compliance Investigation Process. It is also available for immediate download and adjustment. So, changes can be made in the color, design, graphics or any other component to create a unique layout.
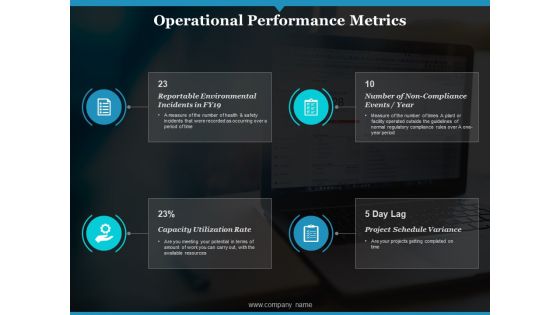
Operational Performance Metrics Ppt PowerPoint Presentation Ideas Background Image
This is a operational performance metrics ppt powerpoint presentation ideas background image. This is a four stage process. The stages in this process are reportable environmental incidents, number of non compliance events, capacity utilization rate.

Sample Of Global Client Service Ppt Examples Professional
This is a sample of global client service ppt examples professional. This is a six stage process. The stages in this process are compliance assessment, program review, average, excellent, program metrics and efficiencies, global risk analysis.
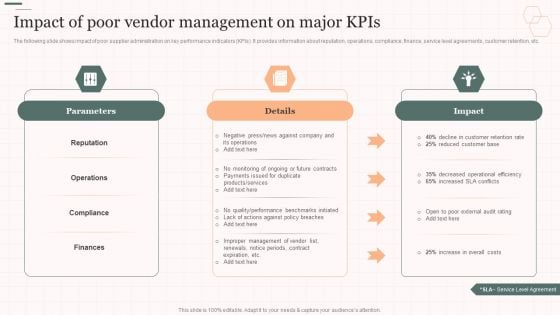
Impact Of Poor Vendor Management On Major Kpis Vendor Management Strategies Ideas PDF
The following slide shows impact of poor supplier administration on key performance indicators KPIs. It provides information about reputation, operations, compliance, finance, service level agreements, customer retention, etc. Deliver and pitch your topic in the best possible manner with this Impact Of Poor Vendor Management On Major Kpis Vendor Management Strategies Ideas PDF. Use them to share invaluable insights on Parameters, Decreased Operational, Compliance and impress your audience. This template can be altered and modified as per your expectations. So, grab it now.
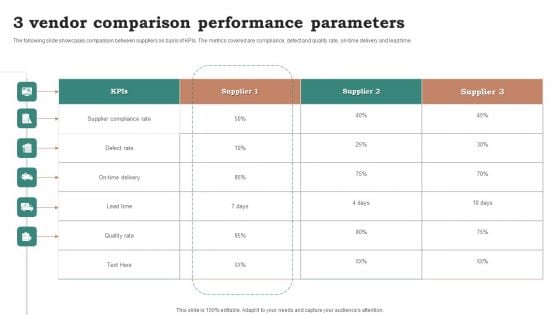
3 Vendor Comparison Performance Parameters Ppt Portfolio Topics PDF
The following slide showcases comparison between suppliers on basis of KPIs. The metrics covered are compliance, defect and quality rate, on-time delivery and lead time. Pitch your topic with ease and precision using this 3 Vendor Comparison Performance Parameters Ppt Portfolio Topics PDF. This layout presents information on Supplier Compliance Rate, Defect Rate, Lead Time. It is also available for immediate download and adjustment. So, changes can be made in the color, design, graphics or any other component to create a unique layout.
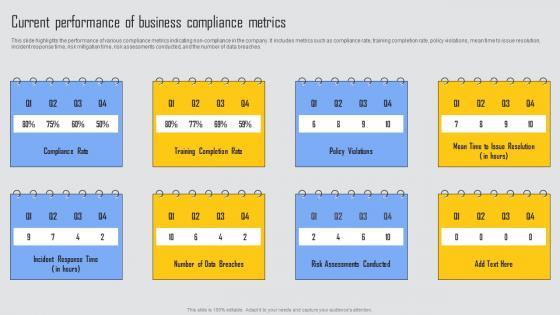
Current Performance Business Managing Risks And Establishing Trust Through Efficient Demonstration Pdf
This slide highlights the performance of various compliance metrics indicating non compliance in the company. It includes metrics such as compliance rate, training completion rate, policy violations, mean time to issue resolution, incident response time, risk mitigation time, risk assessments conducted, and the number of data breaches. Are you searching for a Current Performance Business Managing Risks And Establishing Trust Through Efficient Demonstration Pdf that is uncluttered, straightforward, and original Its easy to edit, and you can change the colors to suit your personal or business branding. For a presentation that expresses how much effort you have put in, this template is ideal With all of its features, including tables, diagrams, statistics, and lists, its perfect for a business plan presentation. Make your ideas more appealing with these professional slides. Download Current Performance Business Managing Risks And Establishing Trust Through Efficient Demonstration Pdf from Slidegeeks today. This slide highlights the performance of various compliance metrics indicating non compliance in the company. It includes metrics such as compliance rate, training completion rate, policy violations, mean time to issue resolution, incident response time, risk mitigation time, risk assessments conducted, and the number of data breaches.
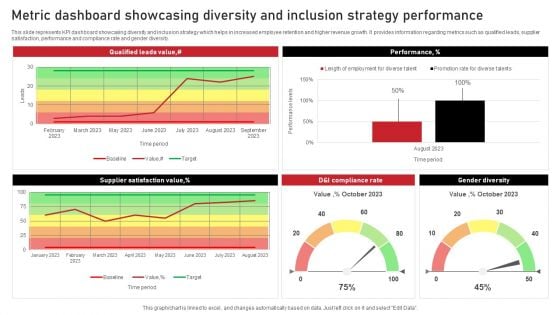
Metric Dashboard Showcasing Diversity And Inclusion Strategy Performance Background PDF
This slide represents KPI dashboard showcasing diversity and inclusion strategy which helps in increased employee retention and higher revenue growth. It provides information regarding metrics such as qualified leads, supplier satisfaction, performance and compliance rate and gender diversity. Showcasing this set of slides titled Metric Dashboard Showcasing Diversity And Inclusion Strategy Performance Background PDF. The topics addressed in these templates are Performance, Gender Diversity, Performance. All the content presented in this PPT design is completely editable. Download it and make adjustments in color, background, font etc. as per your unique business setting.
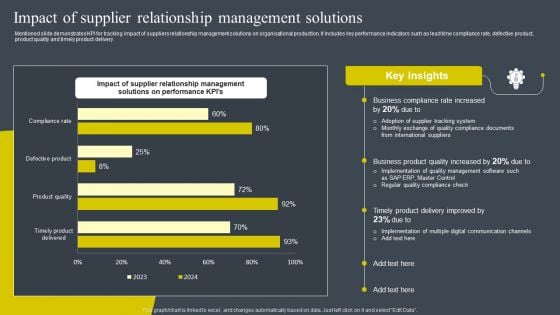
Impact Of Supplier Relationship Management Solutions Rules PDF
Mentioned slide demonstrates KPI for tracking impact of suppliers relationship management solutions on organisational production. It includes key performance indicators such as lead time compliance rate, defective product, product quality and timely product delivery. The best PPT templates are a great way to save time, energy, and resources. Slidegeeks have 100 percent editable powerpoint slides making them incredibly versatile. With these quality presentation templates, you can create a captivating and memorable presentation by combining visually appealing slides and effectively communicating your message. Download Impact Of Supplier Relationship Management Solutions Rules PDF from Slidegeeks and deliver a wonderful presentation.
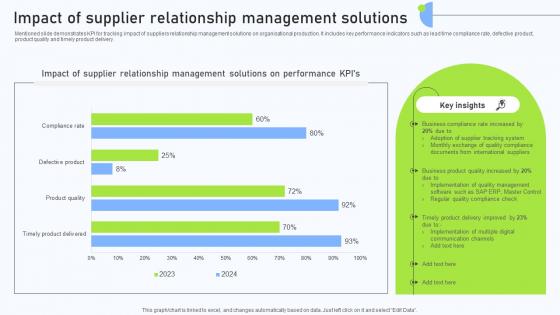
Relationship Management Automation Impact Of Supplier Relationship Management
Mentioned slide demonstrates KPI for tracking impact of suppliers relationship management solutions on organisational production. It includes key performance indicators such as lead time compliance rate, defective product, product quality and timely product delivery. Formulating a presentation can take up a lot of effort and time, so the content and message should always be the primary focus. The visuals of the PowerPoint can enhance the presenters message, so our Relationship Management Automation Impact Of Supplier Relationship Management was created to help save time. Instead of worrying about the design, the presenter can concentrate on the message while our designers work on creating the ideal templates for whatever situation is needed. Slidegeeks has experts for everything from amazing designs to valuable content, we have put everything into Relationship Management Automation Impact Of Supplier Relationship Management Mentioned slide demonstrates KPI for tracking impact of suppliers relationship management solutions on organisational production. It includes key performance indicators such as lead time compliance rate, defective product, product quality and timely product delivery.
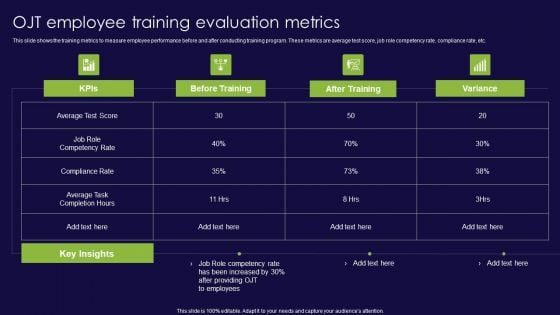
OJT Employee Training Evaluation Metrics Ppt PowerPoint Presentation File Mockup PDF
This slide shows the training metrics to measure employee performance before and after conducting training program. These metrics are average test score, job role competency rate, compliance rate, etc. Showcasing this set of slides titled OJT Employee Training Evaluation Metrics Ppt PowerPoint Presentation File Mockup PDF. The topics addressed in these templates are KPIs, Average Test Score, Compliance Rate. All the content presented in this PPT design is completely editable. Download it and make adjustments in color, background, font etc. as per your unique business setting.
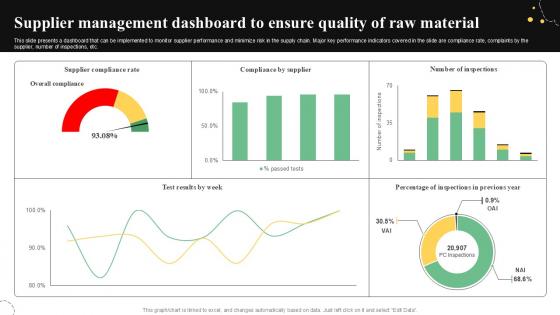
Supplier Management Dashboard Quality Control Guide For Food PPT Sample
This slide presents a dashboard that can be implemented to monitor supplier performance and minimize risk in the supply chain. Major key performance indicators covered in the slide are compliance rate, complaints by the supplier, number of inspections, etc. Present like a pro with Supplier Management Dashboard Quality Control Guide For Food PPT Sample. Create beautiful presentations together with your team, using our easy-to-use presentation slides. Share your ideas in real-time and make changes on the fly by downloading our templates. So whether you are in the office, on the go, or in a remote location, you can stay in sync with your team and present your ideas with confidence. With Slidegeeks presentation got a whole lot easier. Grab these presentations today. This slide presents a dashboard that can be implemented to monitor supplier performance and minimize risk in the supply chain. Major key performance indicators covered in the slide are compliance rate, complaints by the supplier, number of inspections, etc.
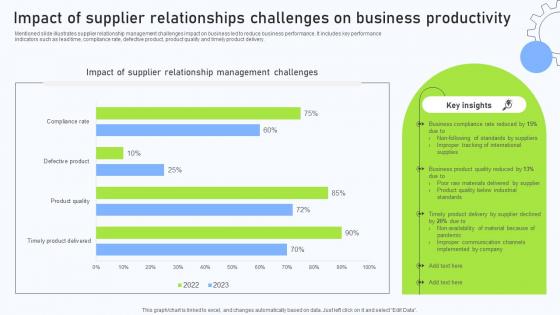
Relationship Management Automation Software Impact Of Supplier Relationships Challenges
Mentioned slide illustrates supplier relationship management challenges impact on business led to reduce business performance. It includes key performance indicators such as lead time, compliance rate, defective product, product quality and timely product delivery. Slidegeeks is one of the best resources for PowerPoint templates. You can download easily and regulate Relationship Management Automation Software Impact Of Supplier Relationships Challenges for your personal presentations from our wonderful collection. A few clicks is all it takes to discover and get the most relevant and appropriate templates. Use our Templates to add a unique zing and appeal to your presentation and meetings. All the slides are easy to edit and you can use them even for advertisement purposes. Mentioned slide illustrates supplier relationship management challenges impact on business led to reduce business performance. It includes key performance indicators such as lead time, compliance rate, defective product, product quality and timely product delivery.
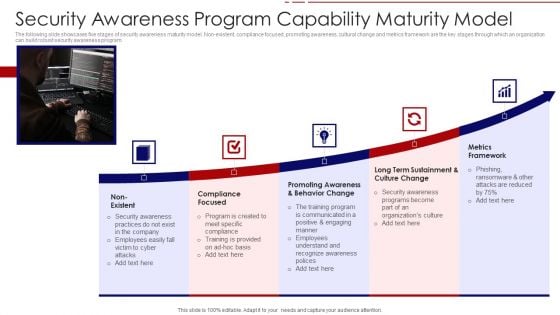
Security Awareness Program Capability Maturity Model Ppt PowerPoint Presentation File Portfolio PDF
The following slide showcases five stages of security awareness maturity model. Non-existent, compliance focused, promoting awareness, cultural change and metrics framework are the key stages through which an organization can build robust security awareness program. Persuade your audience using this security awareness program capability maturity model ppt powerpoint presentation file portfolio pdf. This PPT design covers five stages, thus making it a great tool to use. It also caters to a variety of topics including non existent, compliance focused, promoting awareness and behavior change, long term sustainment and culture change, metrics framework. Download this PPT design now to present a convincing pitch that not only emphasizes the topic but also showcases your presentation skills.

Cybersecurity Key Performance Indicators With Applications Summary Pdf
Pitch your topic with ease and precision using this Cybersecurity Key Performance Indicators With Applications Summary Pdf This layout presents information on Identify Weaknesses, Review Improvement, Security Policies It is also available for immediate download and adjustment. So, changes can be made in the color, design, graphics or any other component to create a unique layout. This slide showcases the cyber security key performance indicators with applications which helps an organization to determine readiness. It include details such as security policies, identify weaknesses, obligation to compliance framework, etc.
Online Product Planning Ecommerce Management KPIS And Dashboard Ppt Professional Example PDF
Presenting this set of slides with name online product planning ecommerce management kpis and dashboard ppt professional example pdf. This is a two stage process. The stages in this process are kpi metrics, kpi dashboards. This is a completely editable PowerPoint presentation and is available for immediate download. Download now and impress your audience.
Ecommerce Management Kpis And Dashboard Ppt PowerPoint Presentation Show Layouts PDF
Presenting this set of slides with name ecommerce management kpis and dashboard ppt powerpoint presentation show layouts pdf. This is a two stage process. The stages in this process are kpi metrics, kpi dashboards. This is a completely editable PowerPoint presentation and is available for immediate download. Download now and impress your audience.
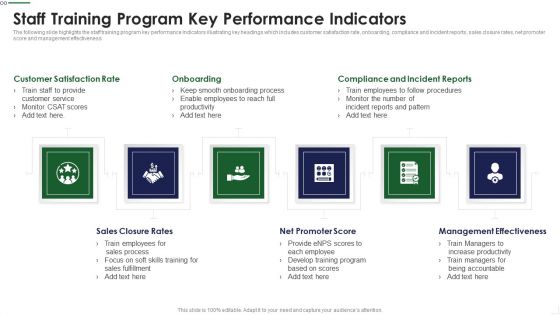
Staff Training Program Key Performance Indicators Diagrams PDF
The following slide highlights the staff training program key performance Indicators illustrating key headings which includes customer satisfaction rate, onboarding, compliance and incident reports, sales closure rates, net promoter score and management effectiveness Presenting Staff Training Program Key Performance Indicators Diagrams PDF to provide visual cues and insights. Share and navigate important information on six stages that need your due attention. This template can be used to pitch topics like Turnover Quarter, Turnover Type, Turnover Reasons In addtion, this PPT design contains high resolution images, graphics, etc, that are easily editable and available for immediate download.
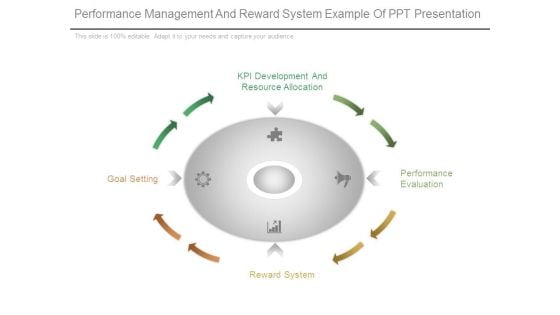
Performance Management And Reward System Example Of Ppt Presentation
This is a performance management and reward system example of ppt presentation. This is a six stage process. The stages in this process are kpi development and resource allocation, performance evaluation, goal setting, reward system.
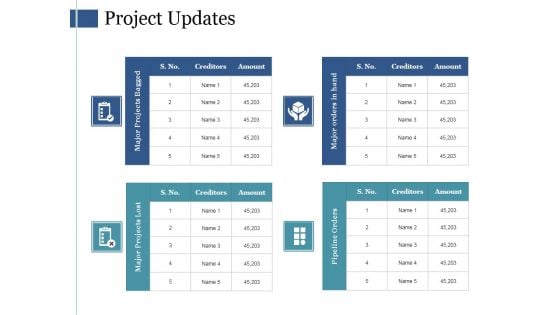
Project Updates Template Ppt PowerPoint Presentation File Graphic Images
This is a project updates template ppt powerpoint presentation file graphic images. This is a six stage process. The stages in this process are sales funnel results, sales process map, top clients, project updates, sales channel kpi tracker.
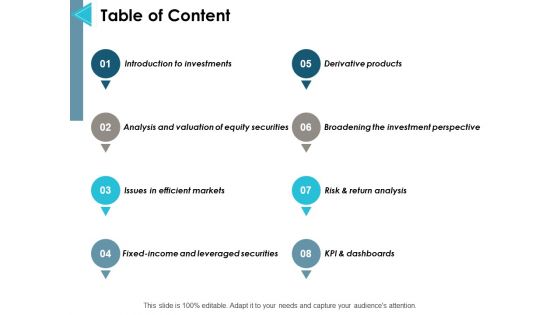
Table Of Content Ppt PowerPoint Presentation Gallery Graphic Tips
This is a table of content ppt powerpoint presentation gallery graphic tips. This is a eight stage process. The stages in this process are introduction to investments, risk and return analysis, issues in efficient markets, kpi and dashboards, management.
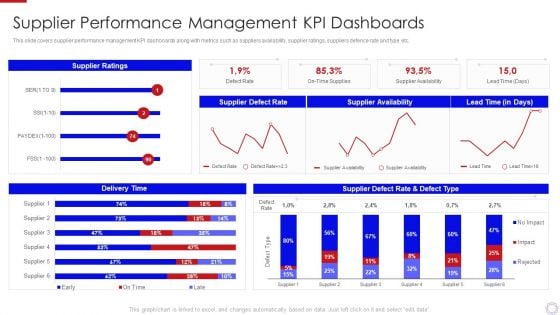
Major Strategies To Nurture Effective Vendor Association Supplier Performance Management Information PDF
This slide covers supplier performance management KPI dashboards along with metrics such as suppliers availability, supplier ratings, suppliers defence rate and type etc. Deliver and pitch your topic in the best possible manner with this major strategies to nurture effective vendor association supplier performance management information pdf. Use them to share invaluable insights on supplier performance management kpi dashboards and impress your audience. This template can be altered and modified as per your expectations. So, grab it now.
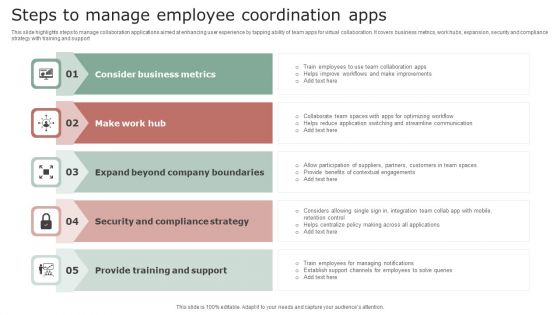
Steps To Manage Employee Coordination Apps Clipart PDF
This slide highlights steps to manage collaboration applications aimed at enhancing user experience by tapping ability of team apps for virtual collaboration. It covers business metrics, work hubs, expansion, security and compliance strategy with training and support. Presenting Steps To Manage Employee Coordination Apps Clipart PDF to dispense important information. This template comprises five stages. It also presents valuable insights into the topics including Consider Business Metrics, Make Work Hub, Expand Beyond Company. This is a completely customizable PowerPoint theme that can be put to use immediately. So, download it and address the topic impactfully.
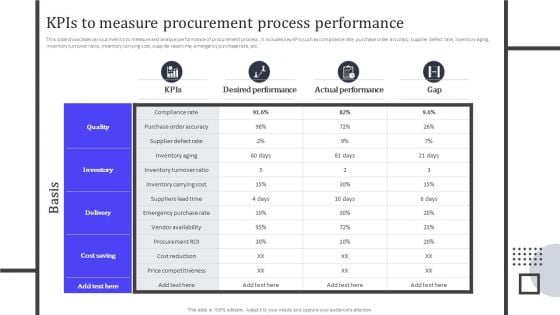
Kpis To Measure Procurement Process Performance Template PDF
This slide showcases various metrics to measure and analyze performance of procurement process . It includes key KPIs such as compliance rate, purchase order accuracy, supplier defect rate, inventory aging, inventory turnover ratio, inventory carrying cost, supplier lead time, emergency purchase rate, etc. From laying roadmaps to briefing everything in detail, our templates are perfect for you. You can set the stage with your presentation slides. All you have to do is download these easy to edit and customizable templates. Kpis To Measure Procurement Process Performance Template PDF will help you deliver an outstanding performance that everyone would remember and praise you for. Do download this presentation today.
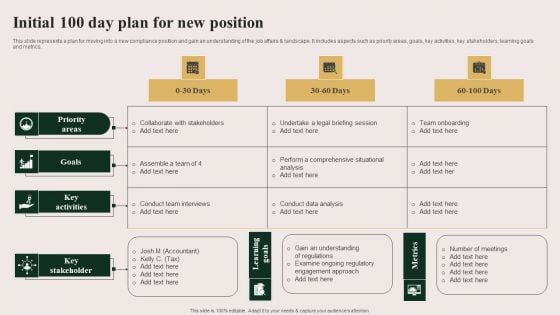
Initial 100 Day Plan For New Position Rules PDF
This slide represents a plan for moving into a new compliance position and gain an understanding of the job affairs and landscape. It includes aspects such as priority areas, goals, key activities, key stakeholders, learning goals and metrics. Pitch your topic with ease and precision using this Initial 100 Day Plan For New Position Rules PDF. This layout presents information on Priority Areas, Goals, Key Activities. It is also available for immediate download and adjustment. So, changes can be made in the color, design, graphics or any other component to create a unique layout.
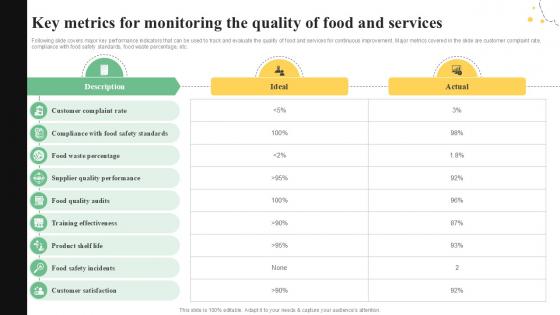
Key Metrics For Monitoring The Quality Control Guide For Food PPT Slide
Following slide covers major key performance indicators that can be used to track and evaluate the quality of food and services for continuous improvement. Major metrics covered in the slide are customer complaint rate, compliance with food safety standards, food waste percentage, etc. Explore a selection of the finest Key Metrics For Monitoring The Quality Control Guide For Food PPT Slide here. With a plethora of professionally designed and pre-made slide templates, you can quickly and easily find the right one for your upcoming presentation. You can use our Key Metrics For Monitoring The Quality Control Guide For Food PPT Slide to effectively convey your message to a wider audience. Slidegeeks has done a lot of research before preparing these presentation templates. The content can be personalized and the slides are highly editable. Grab templates today from Slidegeeks. Following slide covers major key performance indicators that can be used to track and evaluate the quality of food and services for continuous improvement. Major metrics covered in the slide are customer complaint rate, compliance with food safety standards, food waste percentage, etc.
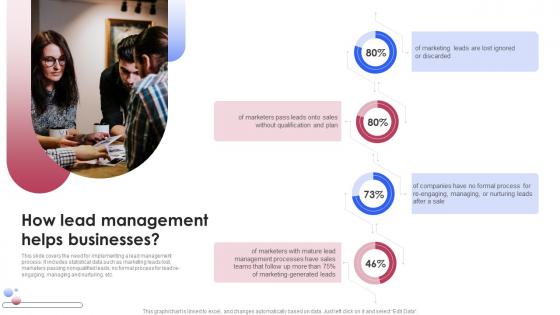
How Lead Management Helps Businesses Various Techniques For Managing Mockup PDF
This slide covers the KPI dashboard for tracking improved lead management system performance. It includes metrics such as visitors, social media followers, email subscribers, organic leads, etc. This slide covers the KPI dashboard for tracking improved lead management system performance. It includes metrics such as visitors, social media followers, email subscribers, organic leads, etc. Make sure to capture your audiences attention in your business displays with our gratis customizable How Lead Management Helps Businesses Various Techniques For Managing Mockup PDF. These are great for business strategies, office conferences, capital raising or task suggestions. If you desire to acquire more customers for your tech business and ensure they stay satisfied, create your own sales presentation with these plain slides. This slide covers the KPI dashboard for tracking improved lead management system performance. It includes metrics such as visitors, social media followers, email subscribers, organic leads, etc.
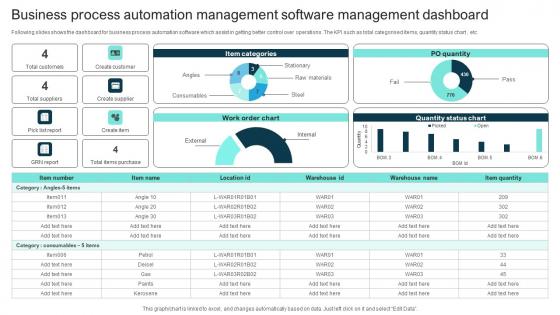
Business Process Automation Management Software Management Dashboard Themes Pdf
Following slides shows the dashboard for business process automation software which assist in getting better control over operations. The KPI such as total categorised items, quantity status chart, etc Showcasing this set of slides titled Business Process Automation Management Software Management Dashboard Themes Pdf The topics addressed in these templates are Item Categories, Warehouse, Business Process All the content presented in this PPT design is completely editable. Download it and make adjustments in color, background, font etc. as per your unique business setting. Following slides shows the dashboard for business process automation software which assist in getting better control over operations. The KPI such as total categorised items, quantity status chart, etc
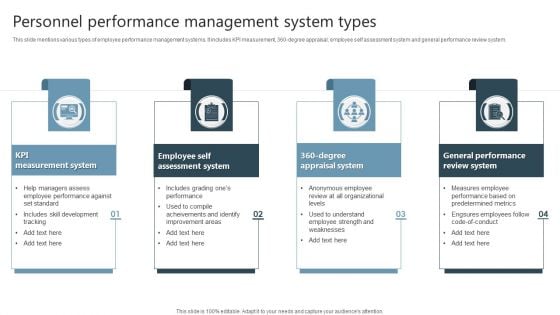
Personnel Performance Management System Types Sample PDF
This slide mentions various types of employee performance management systems. It includes KPI measurement, 360-degree appraisal, employee self assessment system and general performance review system. Persuade your audience using this Personnel Performance Management System Types Sample PDF. This PPT design covers four stages, thus making it a great tool to use. It also caters to a variety of topics including KPI Measurement System, General Performance, Review System. Download this PPT design now to present a convincing pitch that not only emphasizes the topic but also showcases your presentation skills.
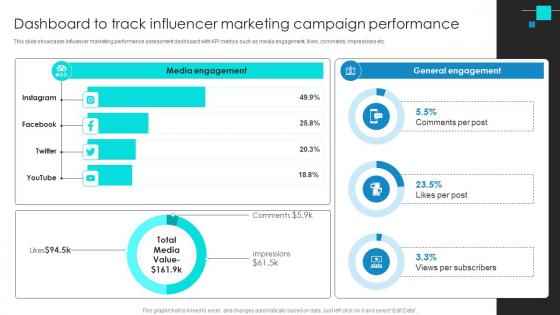
Project Benchmarking Process Dashboard To Track Influencer Marketing Campaign CRP DK SS V
This slide showcases influencer marketing performance assessment dashboard with KPI metrics such as media engagement, likes, comments, impressions etc. If your project calls for a presentation, then Slidegeeks is your go-to partner because we have professionally designed, easy-to-edit templates that are perfect for any presentation. After downloading, you can easily edit Project Benchmarking Process Dashboard To Track Influencer Marketing Campaign CRP DK SS V and make the changes accordingly. You can rearrange slides or fill them with different images. Check out all the handy templates This slide showcases influencer marketing performance assessment dashboard with KPI metrics such as media engagement, likes, comments, impressions etc.
Dashboard For Tracking The AQAM Effectiveness Mockup PDF
This slide illustrates the KPI dashboard used for tracking the effectiveness of agile quality assurance model. KPIs covered in the dashboard are release and quality compliance, test functions and defects. Deliver and pitch your topic in the best possible manner with this dashboard for tracking the aqam effectiveness mockup pdf. Use them to share invaluable insights on quality, application, dashboard and impress your audience. This template can be altered and modified as per your expectations. So, grab it now.
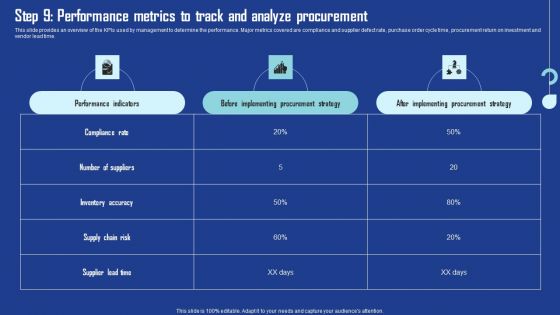
Step 9 Performance Metrics To Track And Analyze Procurement Diagrams PDF
This slide provides an overview of the KPIs used by management to determine the performance. Major metrics covered are compliance and supplier defect rate, purchase order cycle time, procurement return on investment and vendor lead time. Are you searching for a Step 9 Performance Metrics To Track And Analyze Procurement Diagrams PDF that is uncluttered, straightforward, and original Its easy to edit, and you can change the colors to suit your personal or business branding. For a presentation that expresses how much effort you have put in, this template is ideal. With all of its features, including tables, diagrams, statistics, and lists, its perfect for a business plan presentation. Make your ideas more appealing with these professional slides. Download Step 9 Performance Metrics To Track And Analyze Procurement Diagrams PDF from Slidegeeks today.


 Continue with Email

 Home
Home


