Kpi Customer
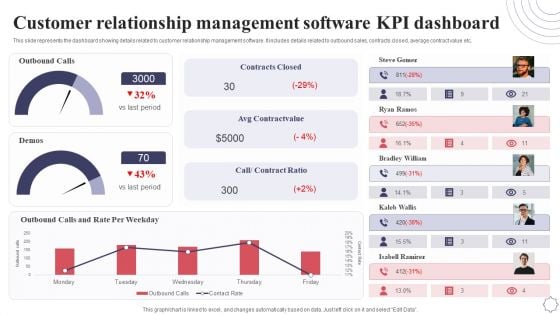
Customer Relationship Management Software KPI Dashboard Application Deployment Project Plan Infographics PDF
This slide represents the dashboard showing details related to customer relationship management software. It includes details related to outbound sales, contracts closed, average contract value etc. From laying roadmaps to briefing everything in detail, our templates are perfect for you. You can set the stage with your presentation slides. All you have to do is download these easy to edit and customizable templates. Customer Relationship Management Software KPI Dashboard Application Deployment Project Plan Infographics PDF will help you deliver an outstanding performance that everyone would remember and praise you for. Do download this presentation today.
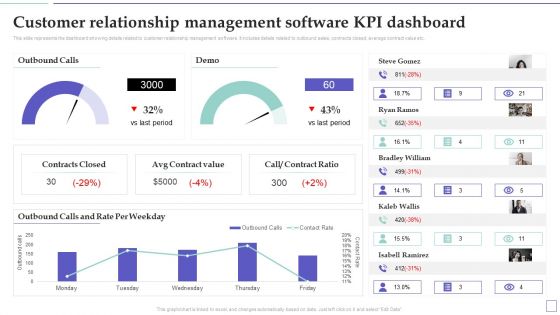
System Deployment Project Customer Relationship Management Software Kpi Dashboard Rules PDF
This slide represents the dashboard showing details related to customer relationship management software. It includes details related to outbound sales, contracts closed, average contract value etc. Present like a pro with System Deployment Project Customer Relationship Management Software Kpi Dashboard Rules PDF Create beautiful presentations together with your team, using our easy-to-use presentation slides. Share your ideas in real-time and make changes on the fly by downloading our templates. So whether youre in the office, on the go, or in a remote location, you can stay in sync with your team and present your ideas with confidence. With Slidegeeks presentation got a whole lot easier. Grab these presentations today.

Strategic Plan For Enterprise Customer Relationship Management Software KPI Dashboard Infographics PDF
This slide represents the dashboard showing details related to customer relationship management software. It includes details related to outbound sales, contracts closed, average contract value etc. Present like a pro with Strategic Plan For Enterprise Customer Relationship Management Software KPI Dashboard Infographics PDF Create beautiful presentations together with your team, using our easy-to-use presentation slides. Share your ideas in real-time and make changes on the fly by downloading our templates. So whether youre in the office, on the go, or in a remote location, you can stay in sync with your team and present your ideas with confidence. With Slidegeeks presentation got a whole lot easier. Grab these presentations today.
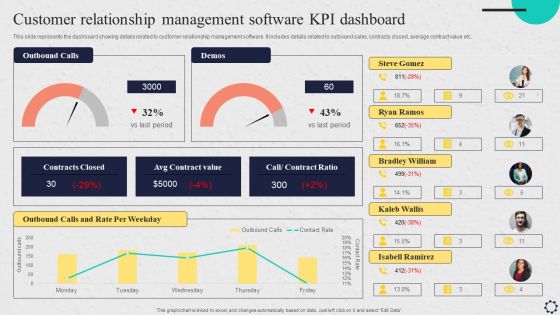
Software Implementation Strategy Customer Relationship Management Software Kpi Dashboard Clipart PDF
This slide represents the dashboard showing details related to customer relationship management software. It includes details related to outbound sales, contracts closed, average contract value etc. Are you in need of a template that can accommodate all of your creative concepts This one is crafted professionally and can be altered to fit any style. Use it with Google Slides or PowerPoint. Include striking photographs, symbols, depictions, and other visuals. Fill, move around, or remove text boxes as desired. Test out color palettes and font mixtures. Edit and save your work, or work with colleagues. Download Software Implementation Strategy Customer Relationship Management Software Kpi Dashboard Clipart PDF and observe how to make your presentation outstanding. Give an impeccable presentation to your group and make your presentation unforgettable.
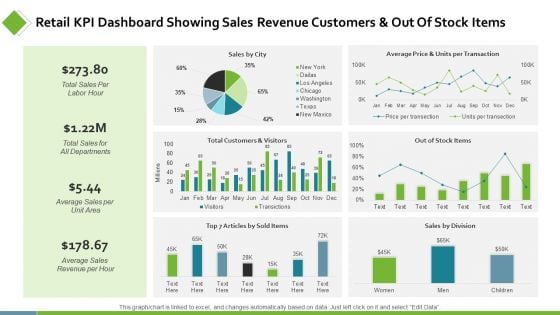
Retail KPI Dashboard Showing Sales Revenue Customers Ppt PowerPoint Presentation Show Background Designs
This is a retail kpi dashboard showing sales revenue customers ppt powerpoint presentation show background designs. This is a six stage process. The stages in this process are finance, analysis, business, investment, marketing.
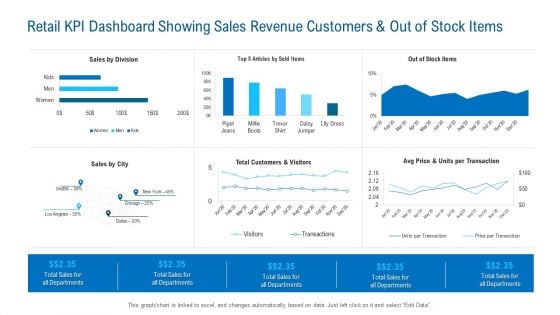
Retail KPI Dashboard Showing Sales Revenue Customers And Out Of Stock Items Rules PDF
Deliver an awe inspiring pitch with this creative retail kpi dashboard showing sales revenue customers and out of stock items rules pdf bundle. Topics like sales by division, sales by city, customers and visitors can be discussed with this completely editable template. It is available for immediate download depending on the needs and requirements of the user.
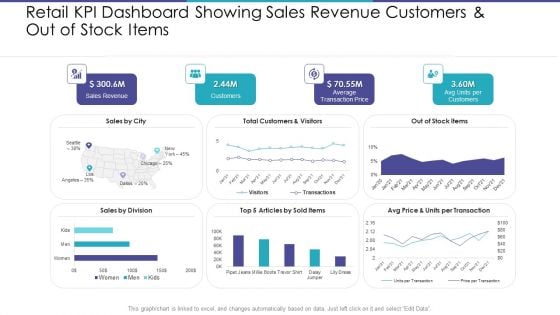
Retail KPI Dashboard Showing Sales Revenue Customers And Out Of Stock Items Elements PDF
Deliver an awe-inspiring pitch with this creative retail kpi dashboard showing sales revenue customers and out of stock items elements pdf. bundle. Topics like sales revenue, average transaction price, avg units per customers can be discussed with this completely editable template. It is available for immediate download depending on the needs and requirements of the user.
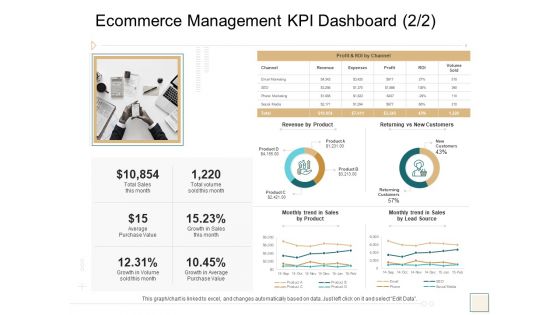
B2B Trade Management Ecommerce Management KPI Dashboard Returning Vs New Customers Brochure PDF
Deliver and pitch your topic in the best possible manner with this b2b trade management ecommerce management kpi dashboard returning vs new customers brochure pdf. Use them to share invaluable insights on profit and roi by channel, revenue product, returning vs new customers, revenue, expenses and impress your audience. This template can be altered and modified as per your expectations. So, grab it now.
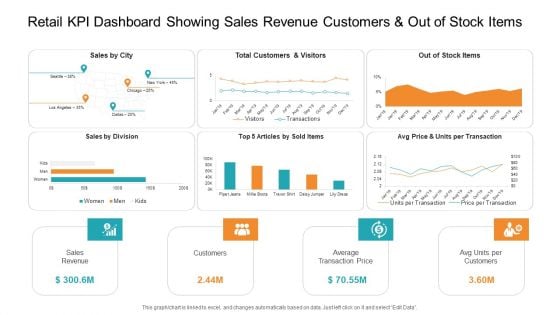
Retail KPI Dashboard Showing Sales Revenue Customers And Out Of Stock Items Introduction PDF
Deliver an awe-inspiring pitch with this creative retail KPI dashboard showing sales revenue customers and out of stock items introduction pdf. bundle. Topics like sales revenue, average transaction price, sales by division can be discussed with this completely editable template. It is available for immediate download depending on the needs and requirements of the user.
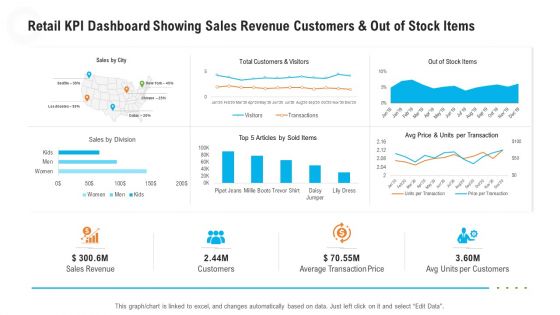
Retail KPI Dashboard Showing Sales Revenue Customers And Out Of Stock Items Guidelines PDF
Deliver an awe-inspiring pitch with this creative retail KPI dashboard showing sales revenue customers and out of stock items guidelines pdf. bundle. Topics like sales revenue, average transaction price can be discussed with this completely editable template. It is available for immediate download depending on the needs and requirements of the user.
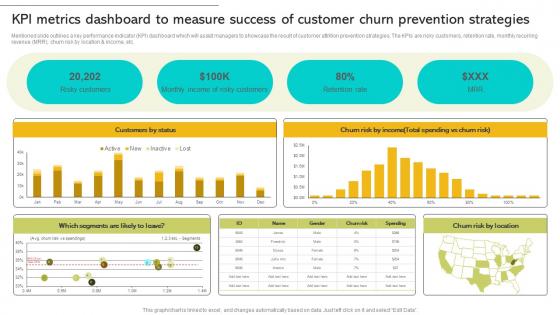
Implementing Strategies To Enhance Kpi Metrics Dashboard To Measure Success Of Customer Churn Ideas PDF
Mentioned slide outlines a key performance indicator KPI dashboard which will assist managers to showcase the result of customer attrition prevention strategies. The KPIs are risky customers, retention rate, monthly recurring revenue MRR, churn risk by location and income, etc. Explore a selection of the finest Implementing Strategies To Enhance Kpi Metrics Dashboard To Measure Success Of Customer Churn Ideas PDF here. With a plethora of professionally designed and pre-made slide templates, you can quickly and easily find the right one for your upcoming presentation. You can use our Implementing Strategies To Enhance Kpi Metrics Dashboard To Measure Success Of Customer Churn Ideas PDF to effectively convey your message to a wider audience. Slidegeeks has done a lot of research before preparing these presentation templates. The content can be personalized and the slides are highly editable. Grab templates today from Slidegeeks. Mentioned slide outlines a key performance indicator KPI dashboard which will assist managers to showcase the result of customer attrition prevention strategies. The KPIs are risky customers, retention rate, monthly recurring revenue MRR, churn risk by location and income, etc.
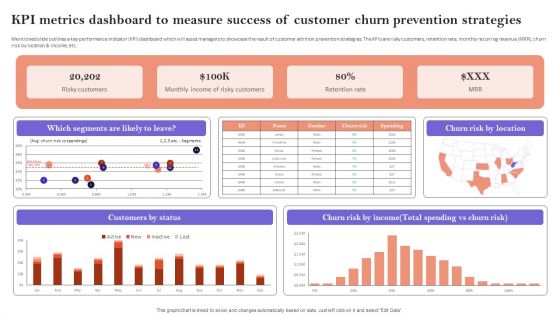
KPI Metrics Dashboard To Measure Success Of Customer Churn Prevention Strategies Diagrams PDF
Mentioned slide outlines a key performance indicator KPI dashboard which will assist managers to showcase the result of customer attrition prevention strategies. The KPIs are risky customers, retention rate, monthly recurring revenue MRR, churn risk by location and income, etc. This KPI Metrics Dashboard To Measure Success Of Customer Churn Prevention Strategies Diagrams PDF is perfect for any presentation, be it in front of clients or colleagues. It is a versatile and stylish solution for organizing your meetings. The KPI Metrics Dashboard To Measure Success Of Customer Churn Prevention Strategies Diagrams PDF features a modern design for your presentation meetings. The adjustable and customizable slides provide unlimited possibilities for acing up your presentation. Slidegeeks has done all the homework before launching the product for you. So, do not wait, grab the presentation templates today
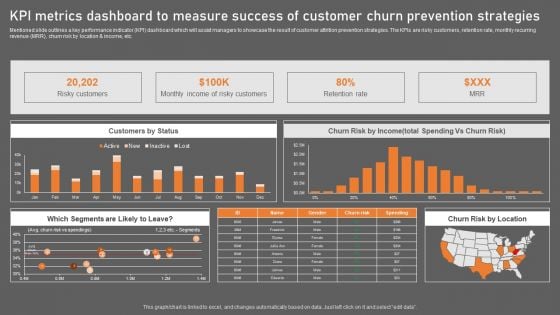
KPI Metrics Dashboard To Measure Success Of Customer Churn Prevention Strategies Structure PDF
There are so many reasons you need a KPI Metrics Dashboard To Measure Success Of Customer Churn Prevention Strategies Structure PDF. The first reason is you can not spend time making everything from scratch, Thus, Slidegeeks has made presentation templates for you too. You can easily download these templates from our website easily.
Sustainability Calculation With KPI Effective Rate Metrics By Customer And Offering Ppt PowerPoint Presentation Icon Files PDF
This slide covers effective rate metrics. It shows over year over comparison of effective rate per customer as well as effective rate per offering. Deliver an awe inspiring pitch with this creative sustainability calculation with kpi effective rate metrics by customer and offering ppt powerpoint presentation icon files pdf bundle. Topics like effective rate metrics by customer and offering can be discussed with this completely editable template. It is available for immediate download depending on the needs and requirements of the user.
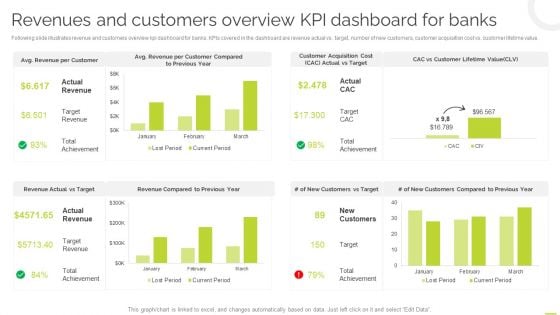
Effective BPM Tool For Business Process Management Revenues And Customers Overview KPI Dashboard For Banks Elements PDF
Following slide illustrates revenue and customers overview kpi dashboard for banks. KPIs covered in the dashboard are revenue actual vs target, number of new customers, customer acquisition cost vs. customer lifetime value. This Effective BPM Tool For Business Process Management Revenues And Customers Overview KPI Dashboard For Banks Elements PDF is perfect for any presentation, be it in front of clients or colleagues. It is a versatile and stylish solution for organizing your meetings. The Effective BPM Tool For Business Process Management Revenues And Customers Overview KPI Dashboard For Banks Elements PDF features a modern design for your presentation meetings. The adjustable and customizable slides provide unlimited possibilities for acing up your presentation. Slidegeeks has done all the homework before launching the product for you. So, do not wait, grab the presentation templates today.
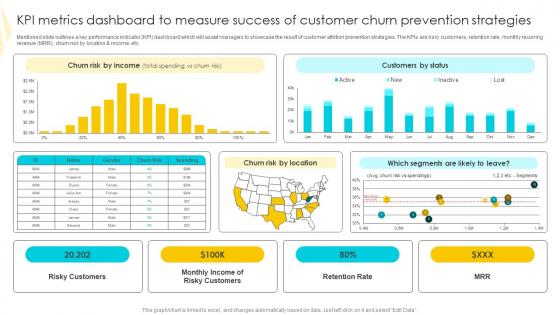
KPI Metrics Dashboard To Measure Strategies To Mitigate Customer Churn Formats Pdf
Mentioned slide outlines a key performance indicator KPI dashboard which will assist managers to showcase the result of customer attrition prevention strategies. The KPIs are risky customers, retention rate, monthly recurring revenue MRR, churn risk by location and income, etc. This KPI Metrics Dashboard To Measure Strategies To Mitigate Customer Churn Formats Pdf is perfect for any presentation, be it in front of clients or colleagues. It is a versatile and stylish solution for organizing your meetings. The KPI Metrics Dashboard To Measure Strategies To Mitigate Customer Churn Formats Pdf features a modern design for your presentation meetings. The adjustable and customizable slides provide unlimited possibilities for acing up your presentation. Slidegeeks has done all the homework before launching the product for you. So, do not wait, grab the presentation templates today Mentioned slide outlines a key performance indicator KPI dashboard which will assist managers to showcase the result of customer attrition prevention strategies. The KPIs are risky customers, retention rate, monthly recurring revenue MRR, churn risk by location and income, etc.
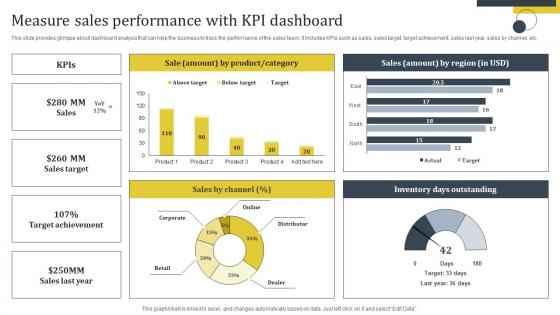
Enhance Customer Retention Measure Sales Performance With Kpi Dashboard Template Pdf
This slide provides glimpse about dashboard analysis that can help the business to track the performance of the sales team. It includes KPIs such as sales, sales target, target achievement, sales last year, sales by channel, etc. Explore a selection of the finest Enhance Customer Retention Measure Sales Performance With Kpi Dashboard Template Pdf here. With a plethora of professionally designed and pre-made slide templates, you can quickly and easily find the right one for your upcoming presentation. You can use our Enhance Customer Retention Measure Sales Performance With Kpi Dashboard Template Pdf to effectively convey your message to a wider audience. Slidegeeks has done a lot of research before preparing these presentation templates. The content can be personalized and the slides are highly editable. Grab templates today from Slidegeeks. This slide provides glimpse about dashboard analysis that can help the business to track the performance of the sales team. It includes KPIs such as sales, sales target, target achievement, sales last year, sales by channel, etc.
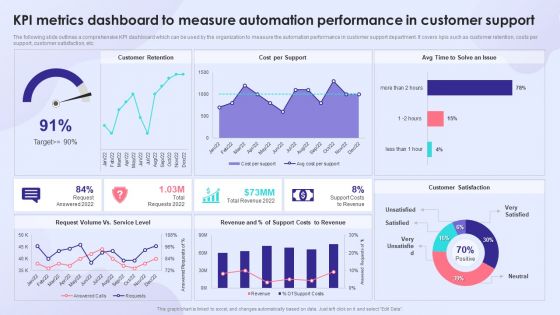
KPI Metrics Dashboard To Measure Automation Performance In Customer Support Professional PDF
The following slide outlines a comprehensive KPI dashboard which can be used by the organization to measure the automation performance in customer support department. It covers kpis such as customer retention, costs per support, customer satisfaction, etc. Deliver and pitch your topic in the best possible manner with this KPI Metrics Dashboard To Measure Automation Performance In Customer Support Professional PDF. Use them to share invaluable insights on Customer Retention, Cost Per Support, Support Costs To Revenue and impress your audience. This template can be altered and modified as per your expectations. So, grab it now.
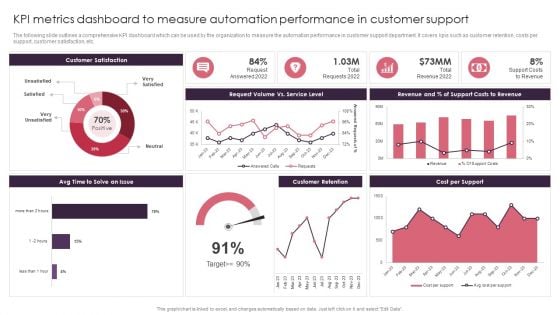
KPI Metrics Dashboard To Measure Automation Performance In Customer Support Themes PDF
The following slide outlines a comprehensive KPI dashboard which can be used by the organization to measure the automation performance in customer support department. It covers kpis such as customer retention, costs per support, customer satisfaction, etc. Present like a pro with KPI Metrics Dashboard To Measure Automation Performance In Customer Support Themes PDF Create beautiful presentations together with your team, using our easy to use presentation slides. Share your ideas in real time and make changes on the fly by downloading our templates. So whether you are in the office, on the go, or in a remote location, you can stay in sync with your team and present your ideas with confidence. With Slidegeeks presentation got a whole lot easier. Grab these presentations today.

Niche Marketing Guide To Target Specific Customer Groups Micromarketing ROI Assessment With KPI Structure PDF
The following slide showcases key metrics to assess micromarketing return on investment to determine profitability and efficiency. It includes elements such as total revenue, cost per acquisition, marketing spend, leads, profit per acquisition etc. Find a pre designed and impeccable Niche Marketing Guide To Target Specific Customer Groups Micromarketing ROI Assessment With KPI Structure PDF. The templates can ace your presentation without additional effort. You can download these easy to edit presentation templates to make your presentation stand out from others. So, what are you waiting for Download the template from Slidegeeks today and give a unique touch to your presentation.
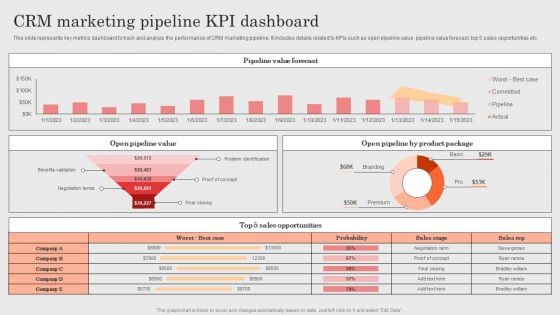
Integrating CRM Solution To Acquire Potential Customers CRM Marketing Pipeline KPI Dashboard Background PDF
This slide represents key metrics dashboard to track and analyze the performance of CRM marketing pipeline. It includes details related to KPIs such as open pipeline value, pipeline value forecast, top 5 sales opportunities etc. Crafting an eye catching presentation has never been more straightforward. Let your presentation shine with this tasteful yet straightforward Integrating CRM Solution To Acquire Potential Customers CRM Marketing Pipeline KPI Dashboard Background PDF template. It offers a minimalistic and classy look that is great for making a statement. The colors have been employed intelligently to add a bit of playfulness while still remaining professional. Construct the ideal Integrating CRM Solution To Acquire Potential Customers CRM Marketing Pipeline KPI Dashboard Background PDF that effortlessly grabs the attention of your audience. Begin now and be certain to wow your customers.
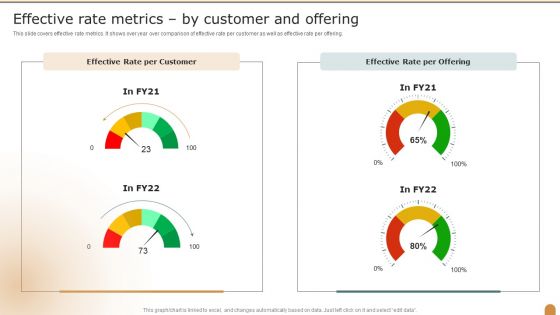
Effective Rate Metrics By Customer And Offering Company Performance Evaluation Using KPI Inspiration PDF
This slide covers effective rate metrics. It shows over year over comparison of effective rate per customer as well as effective rate per offering. Deliver an awe inspiring pitch with this creative Effective Rate Metrics By Customer And Offering Company Performance Evaluation Using KPI Inspiration PDF bundle. Topics like Effective Rate, Customer, Per Offering can be discussed with this completely editable template. It is available for immediate download depending on the needs and requirements of the user.
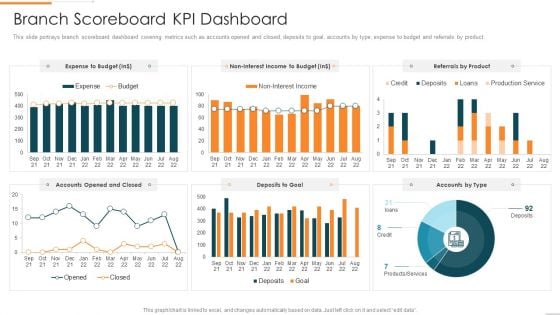
Enhanced Customer Banking Experience With Mobile Branch Scoreboard KPI Dashboard Graphics PDF
This slide portrays branch scoreboard dashboard covering metrics such as accounts opened and closed, deposits to goal, accounts by type, expense to budget and referrals by product.Deliver an awe inspiring pitch with this creative Enhanced Customer Banking Experience With Mobile Branch Scoreboard KPI Dashboard Graphics PDF bundle. Topics like Branch Scoreboard KPI Dashboard can be discussed with this completely editable template. It is available for immediate download depending on the needs and requirements of the user.
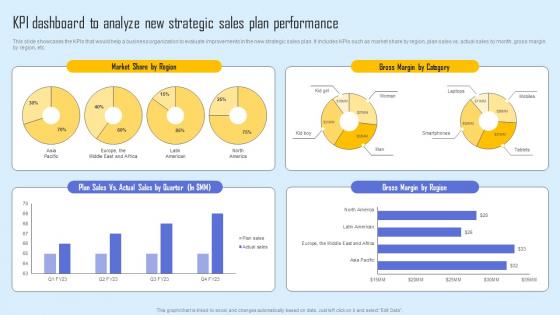
KPI Dashboard Analyze New Effective Sales Strategy To Enhance Customer Retention Background Pdf
This slide showcases the KPIs that would help a business organization to evaluate improvements in the new strategic sales plan. It includes KPIs such as market share by region, plan sales vs. actual sales by month, gross margin by region, etc. Explore a selection of the finest KPI Dashboard Analyze New Effective Sales Strategy To Enhance Customer Retention Background Pdf here. With a plethora of professionally designed and pre made slide templates, you can quickly and easily find the right one for your upcoming presentation. You can use our KPI Dashboard Analyze New Effective Sales Strategy To Enhance Customer Retention Background Pdf to effectively convey your message to a wider audience. Slidegeeks has done a lot of research before preparing these presentation templates. The content can be personalized and the slides are highly editable. Grab templates today from Slidegeeks. This slide showcases the KPIs that would help a business organization to evaluate improvements in the new strategic sales plan. It includes KPIs such as market share by region, plan sales vs. actual sales by month, gross margin by region, etc.
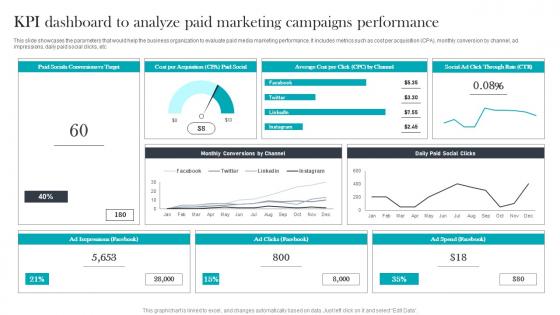
KPI Dashboard To Analyze Paid Media Advertising For Optimizing Customer Brochure Pdf
This slide showcases the parameters that would help the business organization to evaluate paid media marketing performance. It includes metrics such as cost per acquisition CPA, monthly conversion by channel, ad impressions, daily paid social clicks, etc Make sure to capture your audiences attention in your business displays with our gratis customizable KPI Dashboard To Analyze Paid Media Advertising For Optimizing Customer Brochure Pdf. These are great for business strategies, office conferences, capital raising or task suggestions. If you desire to acquire more customers for your tech business and ensure they stay satisfied, create your own sales presentation with these plain slides. This slide showcases the parameters that would help the business organization to evaluate paid media marketing performance. It includes metrics such as cost per acquisition CPA, monthly conversion by channel, ad impressions, daily paid social clicks, etc
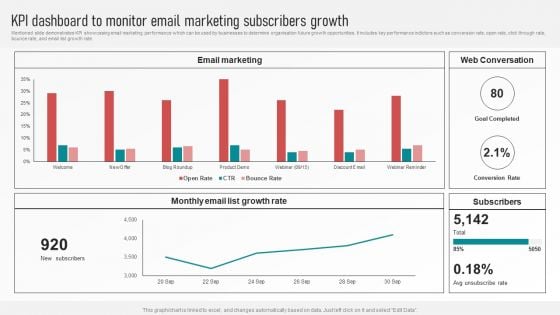
Customer Retention With Email Advertising Campaign Plan KPI Dashboard To Monitor Email Marketing Structure PDF
Mentioned slide demonstrates KPI showcasing email marketing performance which can be used by businesses to determine organisation future growth opportunities. It includes key performance indictors such as conversion rate, open rate, click through rate, bounce rate, and email list growth rate. Make sure to capture your audiences attention in your business displays with our gratis customizable Customer Retention With Email Advertising Campaign Plan KPI Dashboard To Monitor Email Marketing Structure PDF. These are great for business strategies, office conferences, capital raising or task suggestions. If you desire to acquire more customers for your tech business and ensure they stay satisfied, create your own sales presentation with these plain slides.
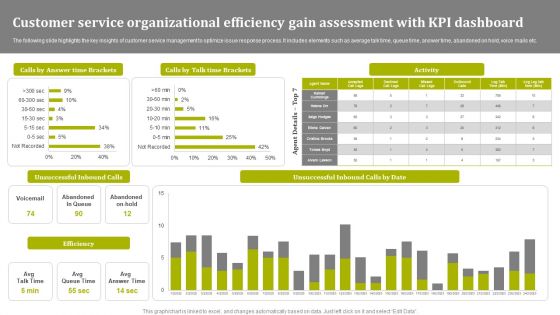
Customer Service Organizational Efficiency Gain Assessment With KPI Dashboard Slides PDF
The following slide highlights the key insights of customer service management to optimize issue response process. It includes elements such as average talk time, queue time, answer time, abandoned on hold, voice mails etc. Showcasing this set of slides titled Customer Service Organizational Efficiency Gain Assessment With KPI Dashboard Slides PDF. The topics addressed in these templates are Activity, Unsuccessful Inbound Calls, Efficiency. All the content presented in this PPT design is completely editable. Download it and make adjustments in color, background, font etc. as per your unique business setting.
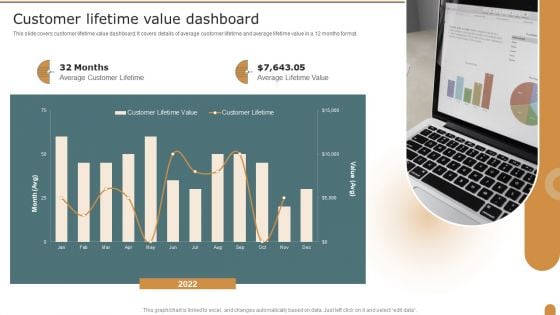
Customer Lifetime Value Dashboard Company Performance Evaluation Using KPI Formats PDF
This slide covers customer lifetime value dashboard. It covers details of average customer lifetime and average lifetime value in a 12 months format. Deliver and pitch your topic in the best possible manner with this Customer Lifetime Value Dashboard Company Performance Evaluation Using KPI Formats PDF. Use them to share invaluable insights on Customer Lifetime, Value Dashboard and impress your audience. This template can be altered and modified as per your expectations. So, grab it now.
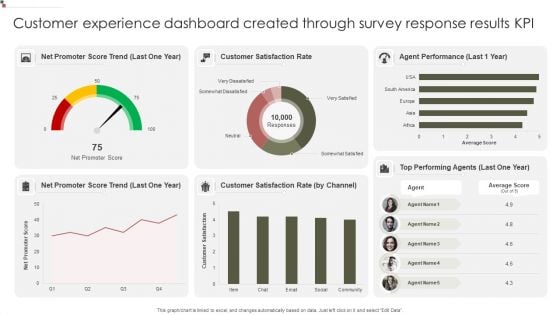
Customer Experience Dashboard Created Through Survey Response Results KPI Mockup PDF
Showcasing this set of slides titled Customer Experience Dashboard Created Through Survey Response Results KPI Mockup PDF. The topics addressed in these templates are Promoter Score, Customer Satisfaction, Agent Performance. All the content presented in this PPT design is completely editable. Download it and make adjustments in color, background, font etc. as per your unique business setting.
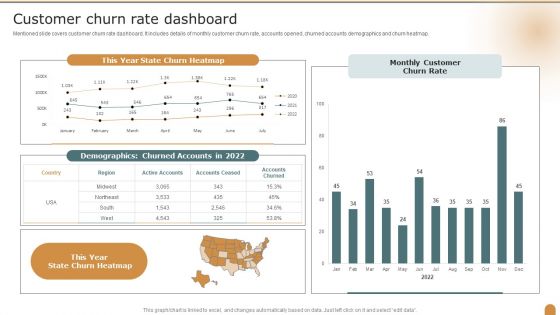
Customer Churn Rate Dashboard Company Performance Evaluation Using KPI Slides PDF
Mentioned slide covers customer churn rate dashboard. It includes details of monthly customer churn rate, accounts opened, churned accounts demographics and churn heatmap. Deliver an awe inspiring pitch with this creative Customer Churn Rate Dashboard Company Performance Evaluation Using KPI Slides PDF bundle. Topics like Churn Heatmap, Demographics, Churned Accounts can be discussed with this completely editable template. It is available for immediate download depending on the needs and requirements of the user.
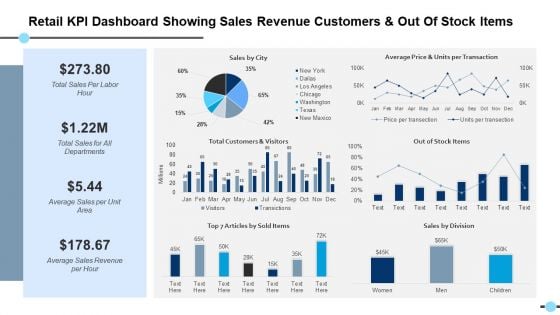
Retail Kpi Dashboard Showing Sales Revenue Customers And Out Of Stock Items Out Of Stock Items Ppt PowerPoint Presentation Files
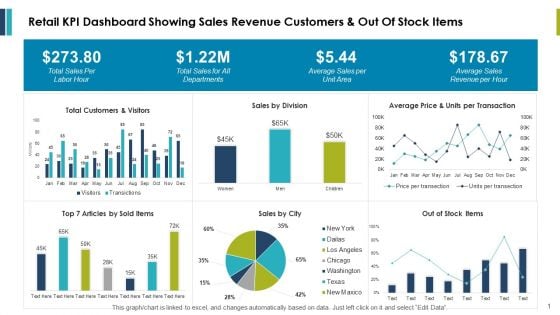
Retail Kpi Dashboard Showing Sales Revenue Customers And Out Of Stock Items Ppt PowerPoint Presentation Outline Example
This is a retail kpi dashboard showing sales revenue customers and out of stock items ppt powerpoint presentation outline example. This is a three stage process. The stages in this process are finance, marketing, management, investment, analysis.
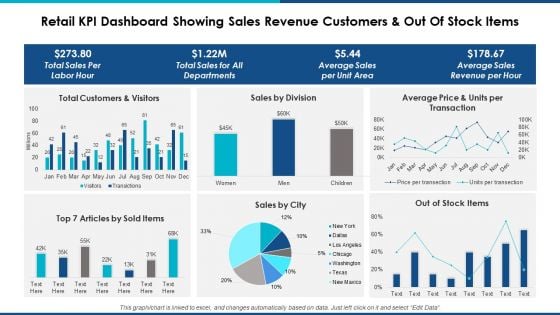
Retail Kpi Dashboard Showing Sales Revenue Customers And Out Of Stock Items Ppt Powerpoint Presentation Professional Background Designs
This is a retail kpi dashboard showing sales revenue customers and out of stock items ppt powerpoint presentation professional background designs. This is a six stage process. The stages in this process are finance, marketing, management, investment, analysis.
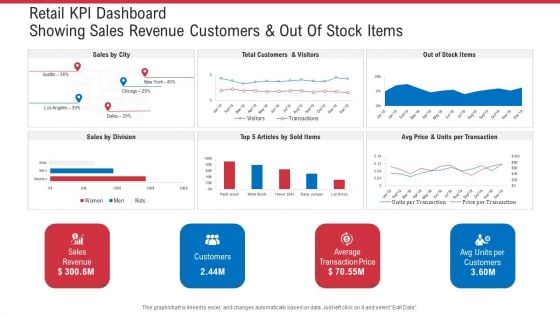
Retail KPI Dashboard Showing Sales Revenue Customers And Out Of Stock Items Ppt Ideas Graphics Design PDF
Deliver an awe-inspiring pitch with this creative retail KPI dashboard showing sales revenue customers and out of stock items ppt ideas graphics design pdf. bundle. Topics like sales revenue, average transaction price, avg units per customers can be discussed with this completely editable template. It is available for immediate download depending on the needs and requirements of the user.
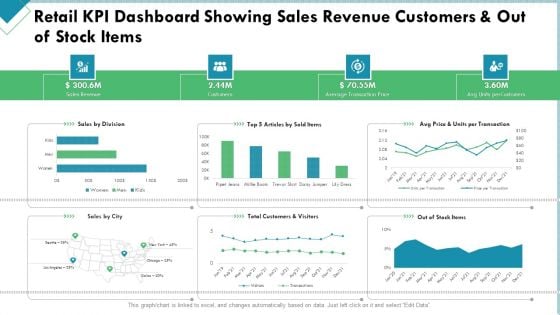
Market Analysis Of Retail Sector Retail KPI Dashboard Showing Sales Revenue Customers And Out Of Stock Items Structure PDF
Deliver and pitch your topic in the best possible manner with this market analysis of retail sector retail kpi dashboard showing sales revenue customers and out of stock items structure pdf. Use them to share invaluable insights on sales revenue, customers, average transaction price and impress your audience. This template can be altered and modified as per your expectations. So, grab it now.
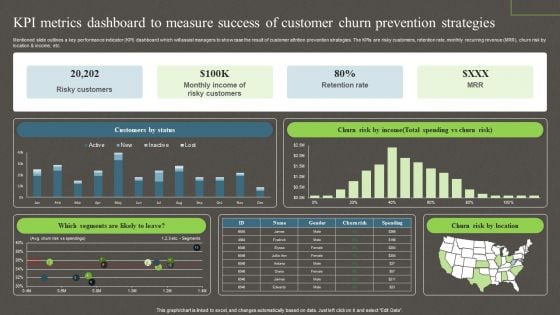
Kpi Metrics Dashboard To Measure Success Of Customer Churn Prevention Strategies Ppt PowerPoint Presentation File Model PDF
Mentioned slide outlines a key performance indicator KPI dashboard which will assist managers to showcase the result of customer attrition prevention strategies. The KPIs are risky customers, retention rate, monthly recurring revenue MRR, churn risk by location and income, etc. This Kpi Metrics Dashboard To Measure Success Of Customer Churn Prevention Strategies Ppt PowerPoint Presentation File Model PDF from Slidegeeks makes it easy to present information on your topic with precision. It provides customization options, so you can make changes to the colors, design, graphics, or any other component to create a unique layout. It is also available for immediate download, so you can begin using it right away. Slidegeeks has done good research to ensure that you have everything you need to make your presentation stand out. Make a name out there for a brilliant performance.
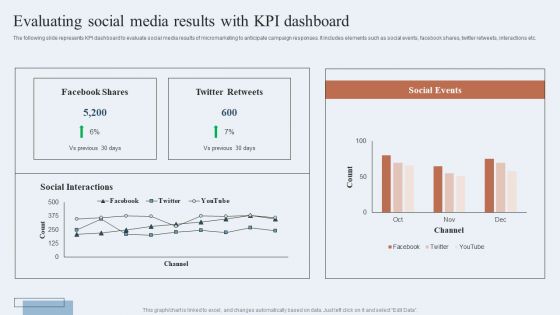
Niche Marketing Guide To Target Specific Customer Groups Evaluating Social Media Results With Kpi Dashboard Inspiration PDF
The following slide represents KPI dashboard to evaluate social media results of micromarketing to anticipate campaign responses. It includes elements such as social events, facebook shares, twitter retweets, interactions etc. Are you searching for a Niche Marketing Guide To Target Specific Customer Groups Evaluating Social Media Results With Kpi Dashboard Inspiration PDF that is uncluttered, straightforward, and original Its easy to edit, and you can change the colors to suit your personal or business branding. For a presentation that expresses how much effort you have put in, this template is ideal. With all of its features, including tables, diagrams, statistics, and lists, its perfect for a business plan presentation. Make your ideas more appealing with these professional slides. Download Niche Marketing Guide To Target Specific Customer Groups Evaluating Social Media Results With Kpi Dashboard Inspiration PDF from Slidegeeks today.
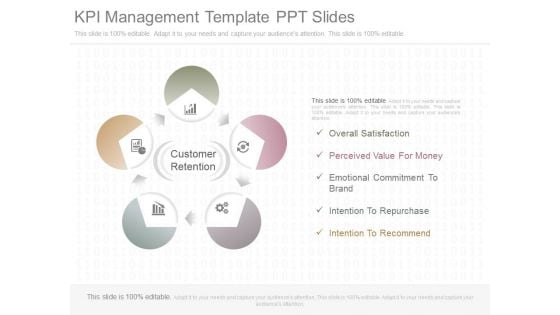
Kpi Management Template Ppt Slides
This is a kpi management template ppt slides. This is a five stage process. The stages in this process are overall satisfaction, perceived value for money, emotional commitment to brand, intention to repurchase, intention to recommend, customer retention.
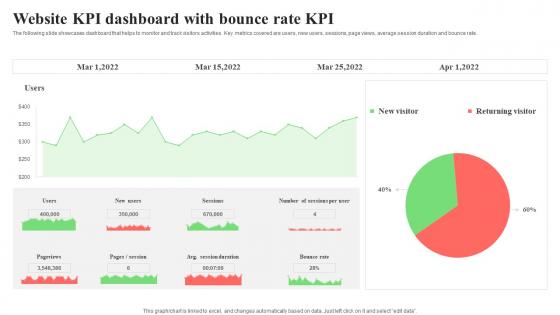
Website KPI Dashboard With Bounce Rate KPI Formats Pdf
The following slide showcases dashboard that helps to monitor and track visitors activities. Key metrics covered are users, new users, sessions, page views, average session duration and bounce rate. Pitch your topic with ease and precision using this Website KPI Dashboard With Bounce Rate KPI Formats Pdf. This layout presents information on Page Views, Average Session Duration, Bounce Rate. It is also available for immediate download and adjustment. So, changes can be made in the color, design, graphics or any other component to create a unique layout. The following slide showcases dashboard that helps to monitor and track visitors activities. Key metrics covered are users, new users, sessions, page views, average session duration and bounce rate.
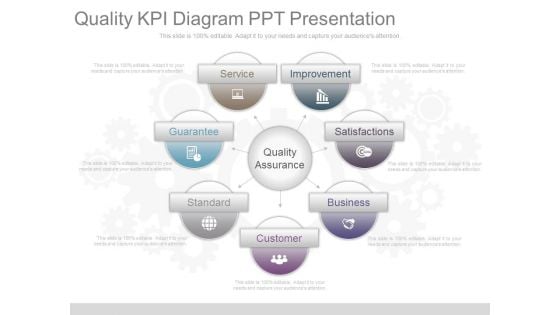
Quality Kpi Diagram Ppt Presentation
This is a quality kpi diagram ppt presentation. This is a seven stage process. The stages in this process are improvement, satisfactions, business, customer, standard, guarantee, service, quality assurance.
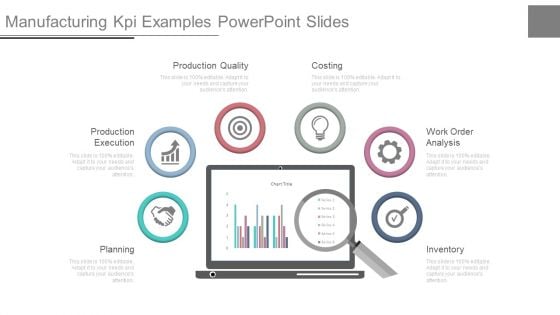
Manufacturing Kpi Examples Powerpoint Slides
This is a manufacturing kpi examples powerpoint slides. This is a six stage process. The stages in this process are planning, production execution, production quality, costing, work order analysis, inventory.
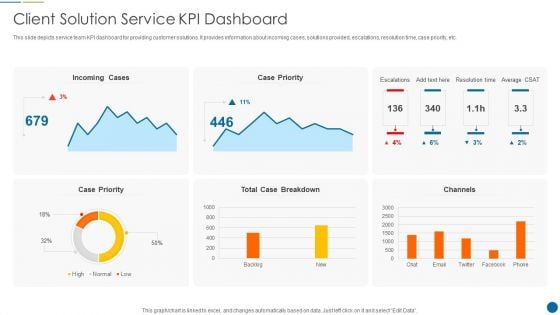
Client Solution Service Kpi Dashboard Sample PDF
This slide depicts service team KPI dashboard for providing customer solutions. It provides information about incoming cases, solutions provided, escalations, resolution time, case priority, etc. Showcasing this set of slides titled Client Solution Service Kpi Dashboard Sample PDF. The topics addressed in these templates are Client Solution Service KPI Dashboard. All the content presented in this PPT design is completely editable. Download it and make adjustments in color, background, font etc. as per your unique business setting
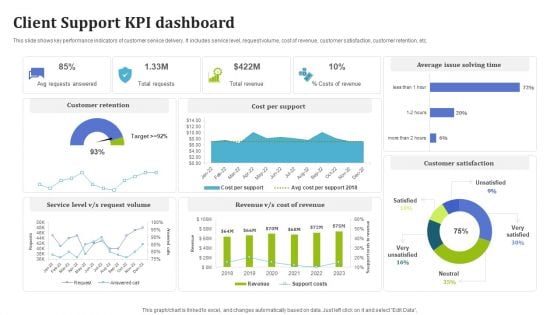
Client Support KPI Dashboard Rules PDF
This slide shows key performance indicators of customer service delivery. It includes service level, request volume, cost of revenue, customer satisfaction, customer retention, etc. Pitch your topic with ease and precision using this Client Support KPI Dashboard Rules PDF. This layout presents information on Customer Retention, Cost Per Support, Average Issue Solving Time. It is also available for immediate download and adjustment. So, changes can be made in the color, design, graphics or any other component to create a unique layout.
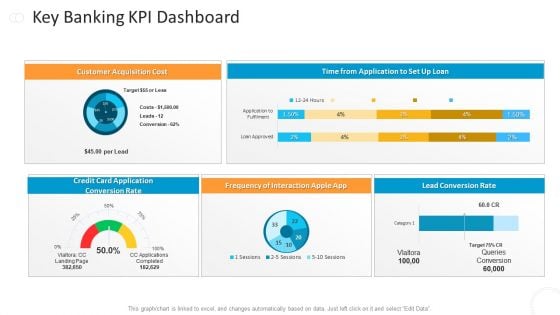
Key Banking KPI Dashboard Designs PDF
Deliver and pitch your topic in the best possible manner with this key banking kpi dashboard designs pdf. Use them to share invaluable insights on customer acquisition cost, credit card application conversion rate, frequency of interaction apple and impress your audience. This template can be altered and modified as per your expectations. So, grab it now.
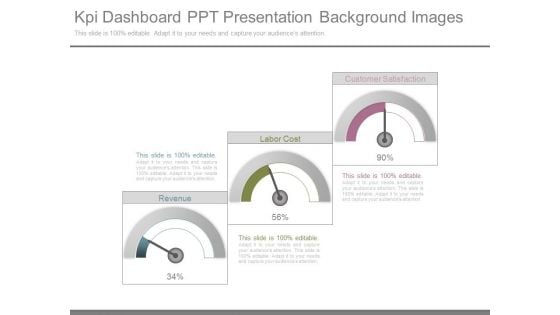
Kpi Dashboard Ppt Presentation Background Images
This is a kpi dashboard ppt presentation background images. This is a three stage process. The stages in this process are revenue, labor cost, customer satisfaction.
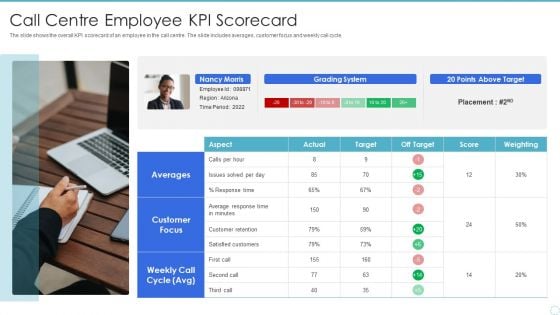
Call Centre Employee KPI Scorecard Information PDF
The slide shows the overall KPI scorecard of an employee in the call centre. The slide includes averages, customer focus and weekly call cycle. Persuade your audience using this Call Centre Employee KPI Scorecard Information PDF. This PPT design covers one stages, thus making it a great tool to use. It also caters to a variety of topics including Customer Focus, Customer Retention, Satisfied Customers. Download this PPT design now to present a convincing pitch that not only emphasizes the topic but also showcases your presentation skills.
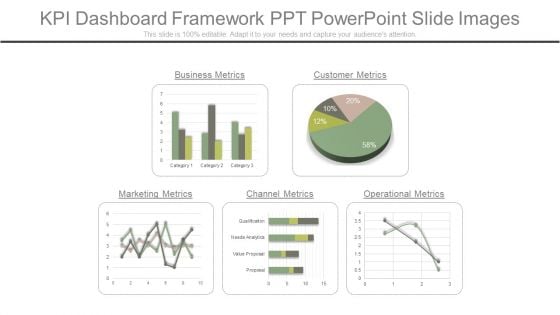
Kpi Dashboard Framework Ppt Powerpoint Slide Images
This is a kpi dashboard framework ppt powerpoint slide images. This is a five stage process. The stages in this process are business metrics, customer metrics, operational metrics, channel metrics, marketing metrics.
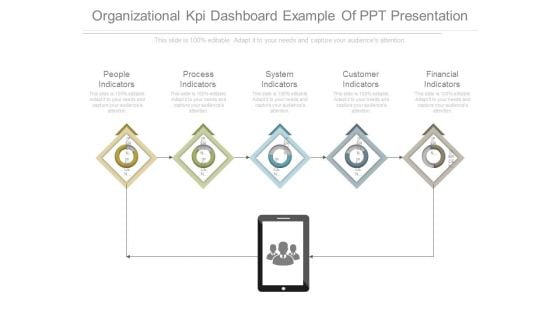
Organizational Kpi Dashboard Example Of Ppt Presentation
This is a organizational kpi dashboard example of ppt presentation. This is a five stage process. The stages in this process are people indicators, process indicators, system indicators, customer indicators, financial indicators.
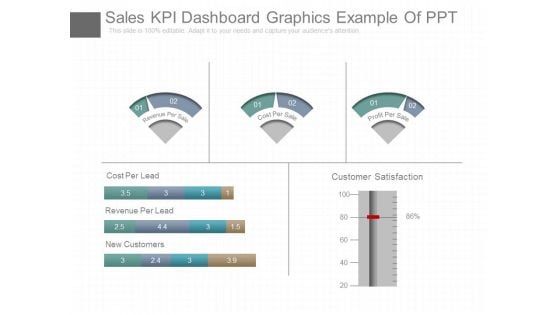
Sales Kpi Dashboard Graphics Example Of Ppt
This is a sales kpi dashboard graphics example of ppt. This is a five stage process. The stages in this process are cost per lead, revenue per lead, new customers, customer satisfaction, revenue per sale, cost per sale, profit per sale.
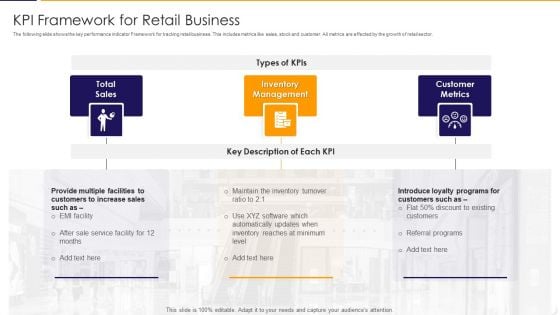
KPI Framework For Retail Business Elements PDF
The following slide shows the key performance indicator Framework for tracking retail business. This includes metrics like sales, stock and customer. All metrics are affected by the growth of retail sector. Presenting kpi framework for retail business elements pdf to dispense important information. This template comprises three stages. It also presents valuable insights into the topics including total sales, inventory management, customer metrics. This is a completely customizable PowerPoint theme that can be put to use immediately. So, download it and address the topic impactfully.
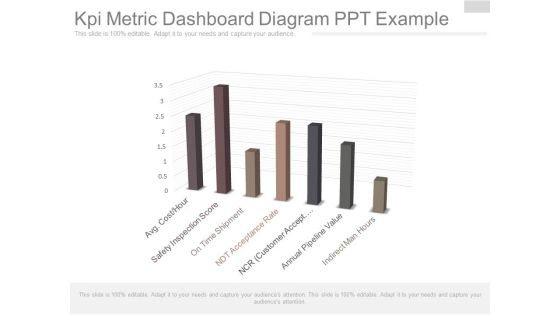
Kpi Metric Dashboard Diagram Ppt Example
This is a kpi metric dashboard diagram ppt example. This is a seven stage process. The stages in this process are avg cost hour, safety inspection score, on time shipment, ndt acceptance rate, ncr customer accept, annual pipeline value, indirect man hours.
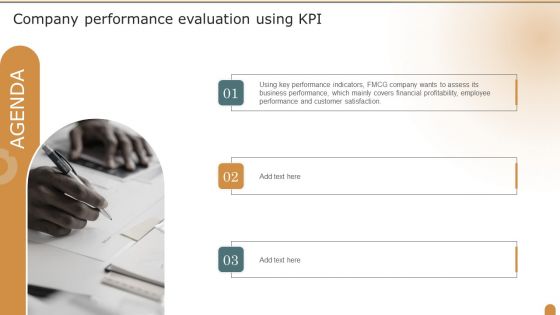
Agenda Company Performance Evaluation Using KPI Designs PDF
This is a Agenda Company Performance Evaluation Using KPI Designs PDF template with various stages. Focus and dispense information on three stages using this creative set, that comes with editable features. It contains large content boxes to add your information on topics like Company Performance, Evaluation Using KPI, Customer Satisfaction. You can also showcase facts, figures, and other relevant content using this PPT layout. Grab it now.
KPI Dashboard Of Client Support Icons PDF
This slide shows customer service delivery key performance indicators dashboard. It includes KPIs such as issues received, average time to close issues, first call resolution, top performers, etc. Pitch your topic with ease and precision using this KPI Dashboard Of Client Support Icons PDF. This layout presents information on KPI Dashboard, Client Support. It is also available for immediate download and adjustment. So, changes can be made in the color, design, graphics or any other component to create a unique layout.

Logistics KPI Status Dashboard With Monthly KPI Ppt Infographic Template Layout PDF
The following slide highlights the transportation status dashboard with monthly KPI illustrating order status with customer, order date and delivery date. It shows financial performance for four quarters as well as todays order, inventory and monthly KPI with Inventory, shipping cost for past 30 days. Pitch your topic with ease and precision using this Logistics KPI Status Dashboard With Monthly KPI Ppt Infographic Template Layout PDF. This layout presents information on Order Status, Today Order, Inventory, Monthly KPI. It is also available for immediate download and adjustment. So, changes can be made in the color, design, graphics or any other component to create a unique layout.
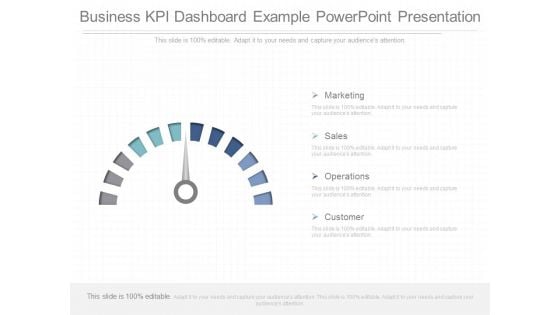
Business Kpi Dashboard Example Powerpoint Presentation
This is a business kpi dashboard example powerpoint presentation. This is a four stage process. The stages in this process are marketing, sales, operations, customer.
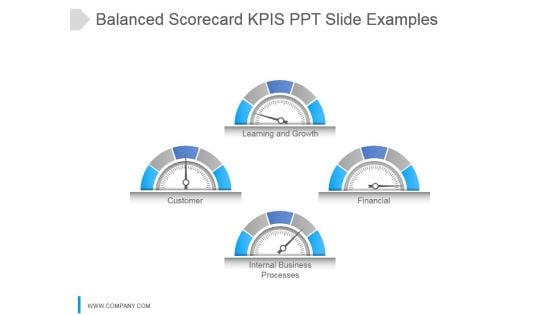
Balanced Scorecard Kpi S Ppt Slide Examples
This is a balanced scorecard kpi s ppt slide examples. This is a four stage process. The stages in this process are learning and growth, customer, financial, internal business processes.
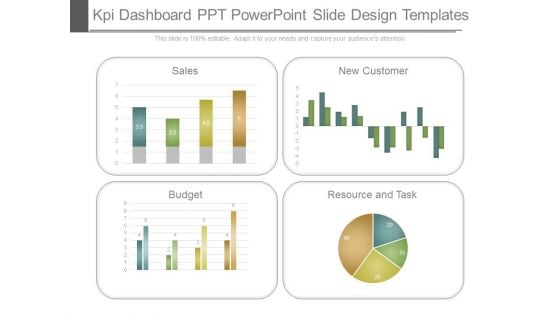
Kpi Dashboard Ppt Powerpoint Slide Design Templates
This is a kpi dashboard ppt powerpoint slide design templates. This is a four stage process. The stages in this process are sales, new customer, budget, resource and task.
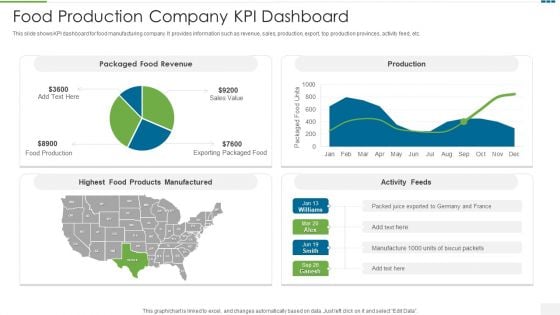
Food Production Company KPI Dashboard Formats PDF
This slide shows KPI dashboard for food manufacturing company. It provides information such as revenue, sales, production, export, top production provinces, activity feed, etc.Showcasing this set of slides titled food production company kpi dashboard formats pdf The topics addressed in these templates are food production company kpi dashboard All the content presented in this PPT design is completely editable. Download it and make adjustments in color, background, font etc. as per your unique business setting.
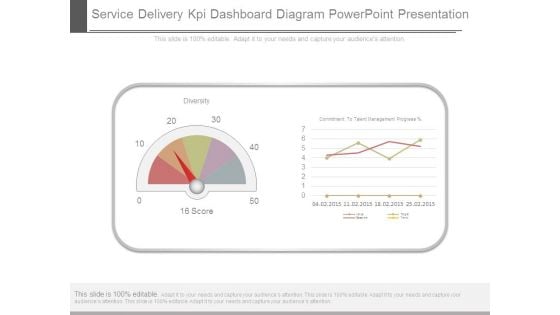
Service Delivery Kpi Dashboard Diagram Powerpoint Presentation
This is a service delivery kpi dashboard diagram powerpoint presentation. This is a two stage process. The stages in this process are diversity, commitment to talent management progress.

Sales Employee Kpi Progress Evaluation Ideas Pdf
This slide showcase performance indicators for progress review which helps in improving employee engagement and achieving results faster. It include indicators such as number of sales, conversion rate, lead generation and client acquisition rate. Pitch your topic with ease and precision using this Sales Employee Kpi Progress Evaluation Ideas Pdf This layout presents information on Meeting Conversion Rate, Conversion Rate, Lead Generation It is also available for immediate download and adjustment. So, changes can be made in the color, design, graphics or any other component to create a unique layout. This slide showcase performance indicators for progress review which helps in improving employee engagement and achieving results faster. It include indicators such as number of sales, conversion rate, lead generation and client acquisition rate.

 Home
Home