Kpi Dashboard
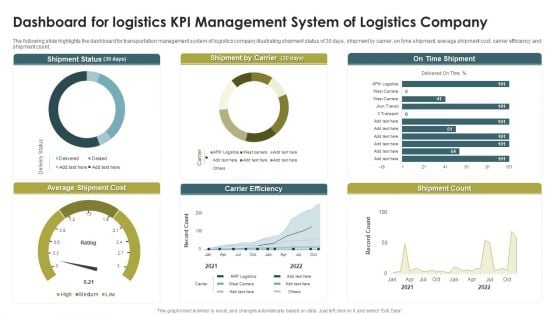
Dashboard For Logistics KPI Management System Of Logistics Company Infographics PDF
The following slide highlights the dashboard for transportation management system of logistics company illustrating shipment status of 30 days, shipment by carrier, on time shipment, average shipment cost, carrier efficiency and shipment count. Pitch your topic with ease and precision using this Dashboard For Logistics KPI Management System Of Logistics Company Infographics PDF. This layout presents information on Shipment Status, Shipment By Carrier, On Time Shipment. It is also available for immediate download and adjustment. So, changes can be made in the color, design, graphics or any other component to create a unique layout.
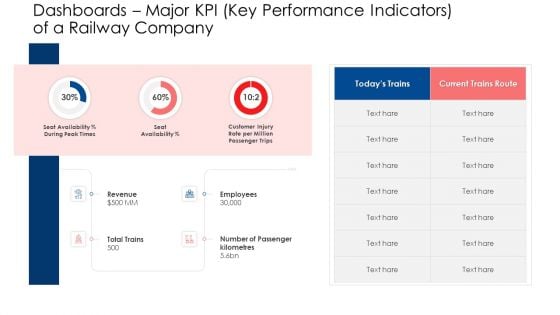
Dashboards Major KPI Key Performance Indicators Of A Railway Company Formats PDF
Deliver an awe inspiring pitch with this creative dashboards major kpi key performance indicators of a railway company formats pdf bundle. Topics like revenue, employees, dashboards can be discussed with this completely editable template. It is available for immediate download depending on the needs and requirements of the user.
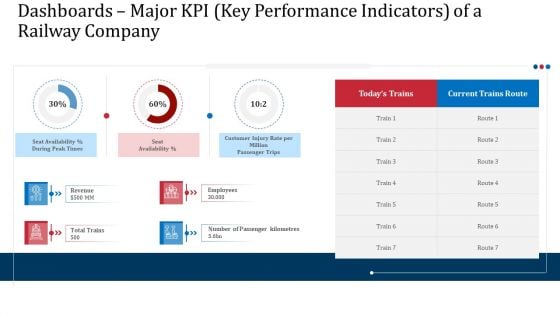
Dashboards Major KPI Key Performance Indicators Of A Railway Company Professional PDF
Deliver an awe inspiring pitch with this creative dashboards major kpi key performance indicators of a railway company professional pdf bundle. Topics like dashboards positive train control ptc implementation by freight and passenger trains can be discussed with this completely editable template. It is available for immediate download depending on the needs and requirements of the user.
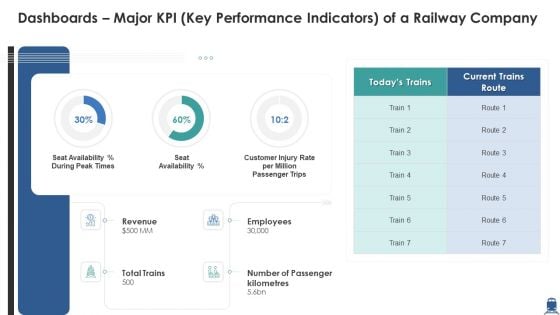
Dashboards Major KPI Key Performance Indicators Of A Railway Company Slides PDF
Deliver and pitch your topic in the best possible manner with this dashboards major kpi key performance indicators of a railway company slides pdf. Use them to share invaluable insights on revenue, employees, key performance indicators and impress your audience. This template can be altered and modified as per your expectations. So, grab it now.
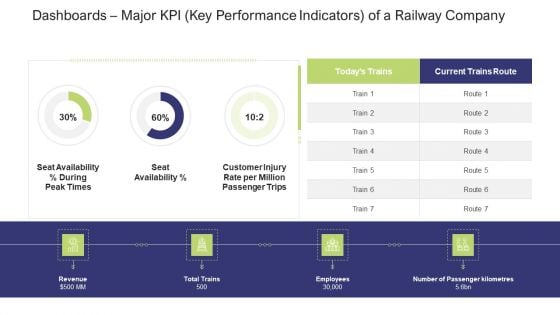
Dashboards Major KPI Key Performance Indicators Of A Railway Company Information PDF
Deliver an awe-inspiring pitch with this creative dashboards major KPI key performance indicators of a railway company information pdf. bundle. Topics like seat availability percent during, peak times, seat availability percent can be discussed with this completely editable template. It is available for immediate download depending on the needs and requirements of the user.
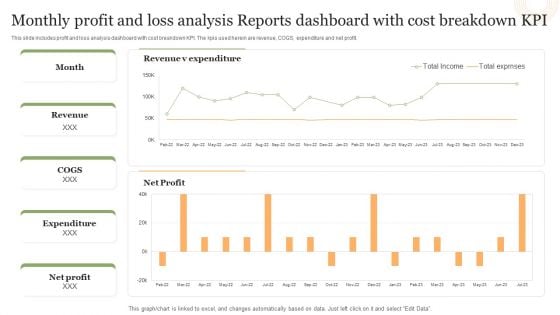
Monthly Profit And Loss Analysis Reports Dashboard With Cost Breakdown Kpi Structure PDF
This slide includes profit and loss analysis dashboard with cost breakdown KPI. The kpis used herein are revenue, COGS, expenditure and net profit.Pitch your topic with ease and precision using this Monthly Profit And Loss Analysis Reports Dashboard With Cost Breakdown Kpi Structure PDF. This layout presents information on Revenue Expenditure, Net Profit, Total Exprnses. It is also available for immediate download and adjustment. So, changes can be made in the color, design, graphics or any other component to create a unique layout.
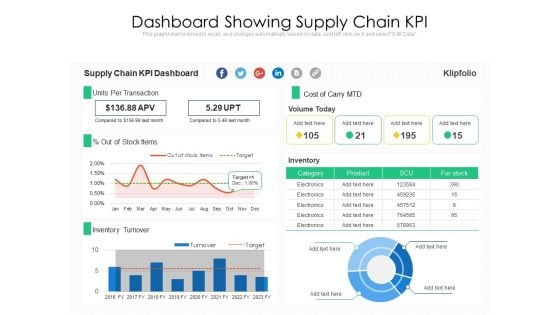
Dashboard Showing Supply Chain KPI Ppt PowerPoint Presentation Gallery Slide Portrait PDF
Showcasing this set of slides titled dashboard showing supply chain kpi ppt powerpoint presentation gallery slide portrait pdf. The topics addressed in these templates are inventory turnover, units per transaction, percent out of stock items. All the content presented in this PPT design is completely editable. Download it and make adjustments in color, background, font etc. as per your unique business setting.
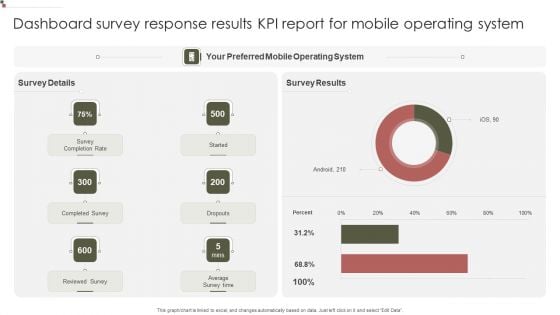
Dashboard Survey Response Results KPI Report For Mobile Operating System Designs PDF
Showcasing this set of slides titled Dashboard Survey Response Results KPI Report For Mobile Operating System Designs PDF. The topics addressed in these templates are Operating System, Survey Results, Completed Survey. All the content presented in this PPT design is completely editable. Download it and make adjustments in color, background, font etc. as per your unique business setting.
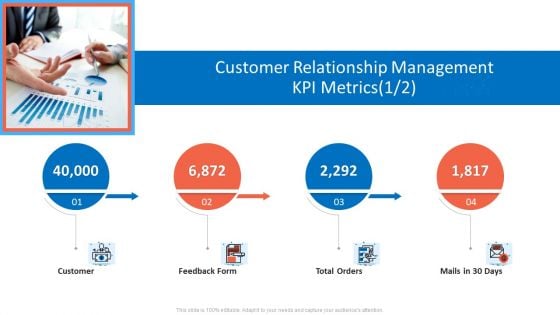
Customer Relationship Management Dashboard Customer Relationship Management KPI Metrics Form Elements PDF
Presenting customer relationship management dashboard customer relationship management kpi metrics form elements pdf to provide visual cues and insights. Share and navigate important information on four stages that need your due attention. This template can be used to pitch topics like customer, feedback form, total orders, mails in 30 days. In addtion, this PPT design contains high resolution images, graphics, etc, that are easily editable and available for immediate download.
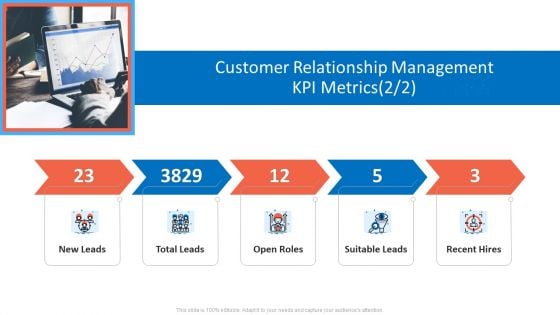
Customer Relationship Management Dashboard Customer Relationship Management KPI Metrics Open Ideas PDF
This is a customer relationship management dashboard customer relationship management kpi metrics open ideas pdf template with various stages. Focus and dispense information on five stages using this creative set, that comes with editable features. It contains large content boxes to add your information on topics like new leads, total leads, open roles, suitable leads, recent hires. You can also showcase facts, figures, and other relevant content using this PPT layout. Grab it now.
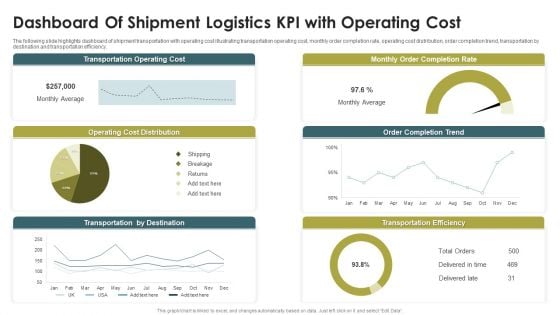
Dashboard Of Shipment Logistics KPI With Operating Cost Ppt Styles Example Topics PDF
The following slide highlights dashboard of shipment transportation with operating cost illustrating transportation operating cost, monthly order completion rate, operating cost distribution, order completion trend, transportation by destination and transportation efficiency. Showcasing this set of slides titled Dashboard Of Shipment Logistics KPI With Operating Cost Ppt Styles Example Topics PDF. The topics addressed in these templates are Transportation Operating Cost, Monthly Order, Completion Rate, Operating Cost Distribution. All the content presented in this PPT design is completely editable. Download it and make adjustments in color, background, font etc. as per your unique business setting.
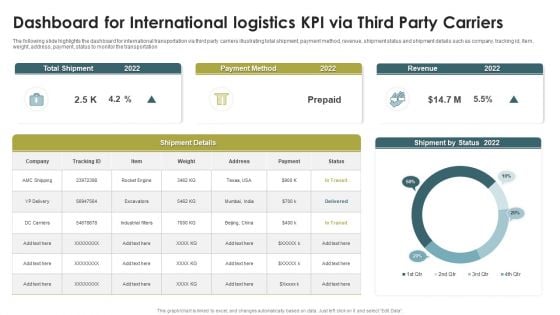
Dashboard For International Logistics KPI Via Third Party Carriers Rules PDF
The following slide highlights the dashboard for international transportation via third party carriers illustrating total shipment, payment method, revenue, shipment status and shipment details such as company, tracking id, Item, weight, address, payment, status to monitor the transportation. Showcasing this set of slides titled Dashboard For International Logistics KPI Via Third Party Carriers Rules PDF. The topics addressed in these templates are Total Shipment, Payment Method, Revenue, 20. All the content presented in this PPT design is completely editable. Download it and make adjustments in color, background, font etc. as per your unique business setting.
Robotic Process Automation Dashboard With Monthly Test Execution KPI Icons PDF
This slide covers RPA metrics for analyzing test execution on automated platforms. It also includes test execution metrics such as total test executed, test status, tests executed daily for different operation systems, etc. Pitch your topic with ease and precision using this Robotic Process Automation Dashboard With Monthly Test Execution KPI Icons PDF. This layout presents information on Robotic Process Automation Dashboard, Monthly Test Execution Kpi. It is also available for immediate download and adjustment. So, changes can be made in the color, design, graphics or any other component to create a unique layout.
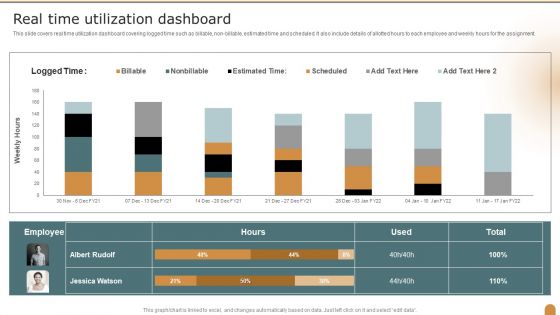
Real Time Utilization Dashboard Company Performance Evaluation Using KPI Clipart PDF
This slide covers real time utilization dashboard covering logged time such as billable, non-billable, estimated time and scheduled. It also include details of allotted hours to each employee and weekly hours for the assignment. Deliver an awe inspiring pitch with this creative Real Time Utilization Dashboard Company Performance Evaluation Using KPI Clipart PDF bundle. Topics like Real Time, Utilization Dashboard can be discussed with this completely editable template. It is available for immediate download depending on the needs and requirements of the user.
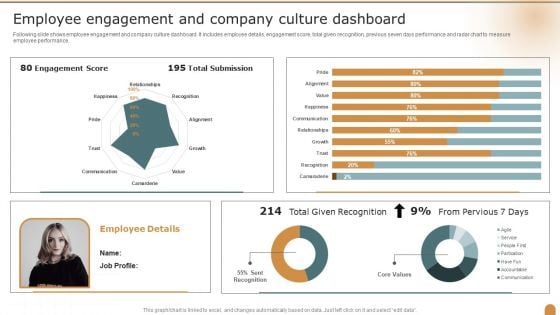
Employee Engagement And Company Culture Dashboard Company Performance Evaluation Using KPI Pictures PDF
Following slide shows employee engagement and company culture dashboard. It includes employee details, engagement score, total given recognition, previous seven days performance and radar chart to measure employee performance. Deliver an awe inspiring pitch with this creative Employee Engagement And Company Culture Dashboard Company Performance Evaluation Using KPI Pictures PDF bundle. Topics like Employee Engagement, Company, Culture Dashboard can be discussed with this completely editable template. It is available for immediate download depending on the needs and requirements of the user.
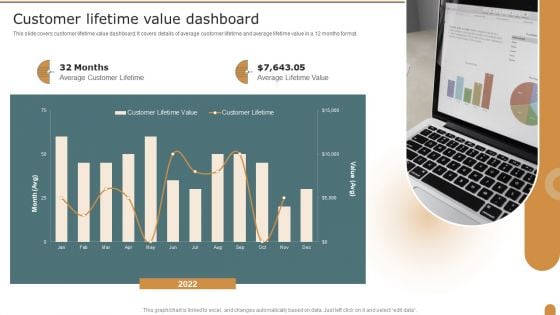
Customer Lifetime Value Dashboard Company Performance Evaluation Using KPI Formats PDF
This slide covers customer lifetime value dashboard. It covers details of average customer lifetime and average lifetime value in a 12 months format. Deliver and pitch your topic in the best possible manner with this Customer Lifetime Value Dashboard Company Performance Evaluation Using KPI Formats PDF. Use them to share invaluable insights on Customer Lifetime, Value Dashboard and impress your audience. This template can be altered and modified as per your expectations. So, grab it now.
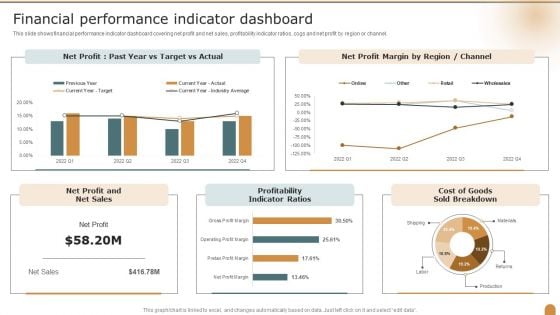
Financial Performance Indicator Dashboard Company Performance Evaluation Using KPI Structure PDF
This slide shows financial performance indicator dashboard covering net profit and net sales, profitability indicator ratios, cogs and net profit by region or channel. Deliver and pitch your topic in the best possible manner with this Financial Performance Indicator Dashboard Company Performance Evaluation Using KPI Structure PDF. Use them to share invaluable insights on Financial Performance, Indicator Dashboard, Profitability Indicator and impress your audience. This template can be altered and modified as per your expectations. So, grab it now.
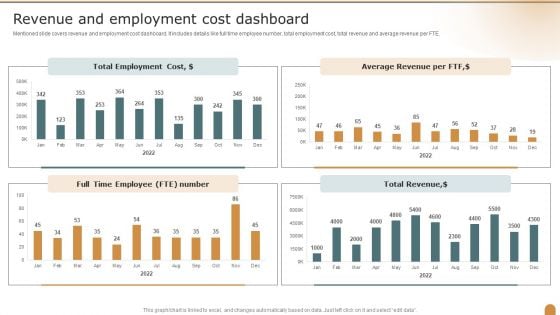
Revenue And Employment Cost Dashboard Company Performance Evaluation Using KPI Microsoft PDF
Mentioned slide covers revenue and employment cost dashboard. It includes details like full time employee number, total employment cost, total revenue and average revenue per FTE. Deliver and pitch your topic in the best possible manner with this Revenue And Employment Cost Dashboard Company Performance Evaluation Using KPI Microsoft PDF. Use them to share invaluable insights on Total Employment, Average Revenue, Dashboard and impress your audience. This template can be altered and modified as per your expectations. So, grab it now.
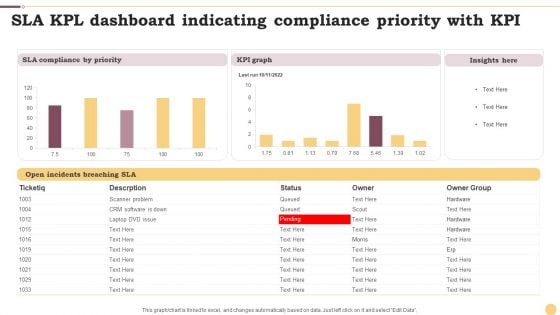
SLA KPL Dashboard Indicating Compliance Priority With KPI Ppt File Format PDF
This graph or chart is linked to excel, and changes automatically based on data. Just left click on it and select Edit Data. Showcasing this set of slides titled SLA KPL Dashboard Indicating Compliance Priority With KPI Ppt File Format PDF. The topics addressed in these templates are KPI Graph, Insights Here, SLA Compliance Priority. All the content presented in this PPT design is completely editable. Download it and make adjustments in color, background, font etc. as per your unique business setting.
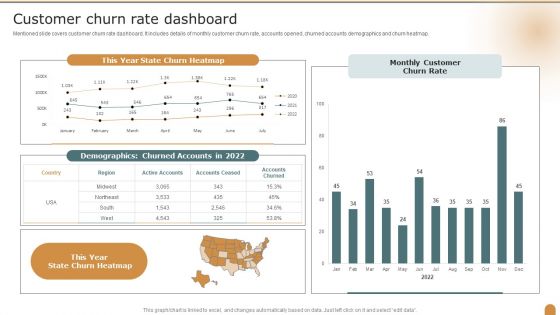
Customer Churn Rate Dashboard Company Performance Evaluation Using KPI Slides PDF
Mentioned slide covers customer churn rate dashboard. It includes details of monthly customer churn rate, accounts opened, churned accounts demographics and churn heatmap. Deliver an awe inspiring pitch with this creative Customer Churn Rate Dashboard Company Performance Evaluation Using KPI Slides PDF bundle. Topics like Churn Heatmap, Demographics, Churned Accounts can be discussed with this completely editable template. It is available for immediate download depending on the needs and requirements of the user.
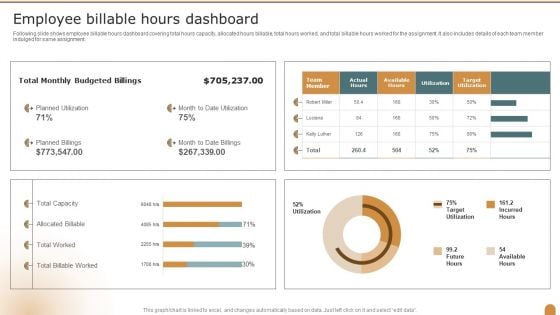
Employee Billable Hours Dashboard Company Performance Evaluation Using KPI Topics PDF
Following slide shows employee billable hours dashboard covering total hours capacity, allocated hours billable, total hours worked, and total billable hours worked for the assignment. It also includes details of each team member indulged for same assignment. Deliver and pitch your topic in the best possible manner with this Employee Billable Hours Dashboard Company Performance Evaluation Using KPI Topics PDF. Use them to share invaluable insights on Employee Billable, Hours Dashboard, Budgeted Billings and impress your audience. This template can be altered and modified as per your expectations. So, grab it now.
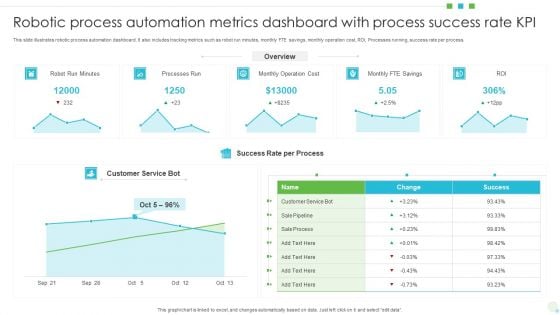
Robotic Process Automation Metrics Dashboard With Process Success Rate KPI Professional PDF
This slide illustrates robotic process automation dashboard. It also includes tracking metrics such as robot run minutes, monthly FTE savings, monthly operation cost, ROI, Processes running, success rate per process. Showcasing this set of slides titled Robotic Process Automation Metrics Dashboard With Process Success Rate KPI Professional PDF The topics addressed in these templates are Processes Run, Monthly Operation Cost, Customer Service Bot. All the content presented in this PPT design is completely editable. Download it and make adjustments in color, background, font etc. as per your unique business setting.
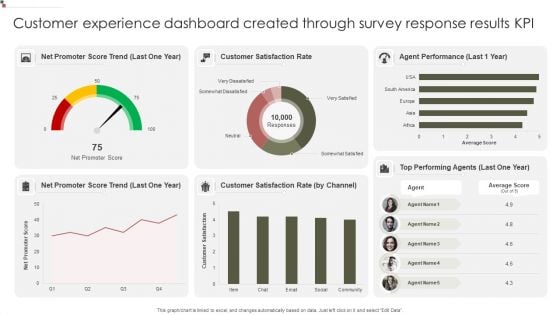
Customer Experience Dashboard Created Through Survey Response Results KPI Mockup PDF
Showcasing this set of slides titled Customer Experience Dashboard Created Through Survey Response Results KPI Mockup PDF. The topics addressed in these templates are Promoter Score, Customer Satisfaction, Agent Performance. All the content presented in this PPT design is completely editable. Download it and make adjustments in color, background, font etc. as per your unique business setting.

Dashboard Of Net Promoter Score Survey Response Results KPI Portrait PDF
Pitch your topic with ease and precision using this Dashboard Of Net Promoter Score Survey Response Results KPI Portrait PDF. This layout presents information on Product Average, Promoter Score, Product Experience. It is also available for immediate download and adjustment. So, changes can be made in the color, design, graphics or any other component to create a unique layout.
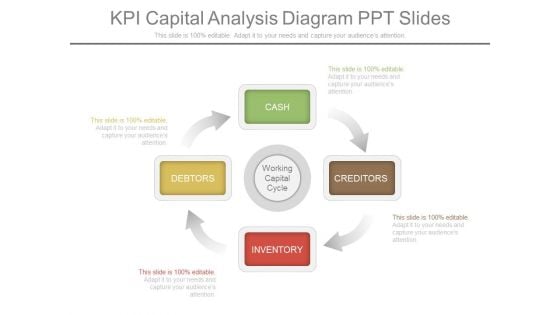
Kpi Capital Analysis Diagram Ppt Slides
This is a kpi capital dashboard ppt slides. This is a four stage process. The stages in this process are cash, creditors, inventory, debtors.
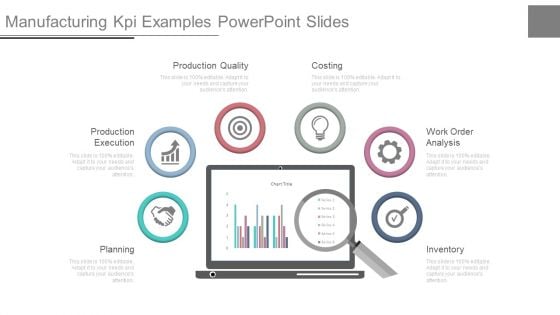
Manufacturing Kpi Examples Powerpoint Slides
This is a manufacturing kpi examples powerpoint slides. This is a six stage process. The stages in this process are planning, production execution, production quality, costing, work order analysis, inventory.
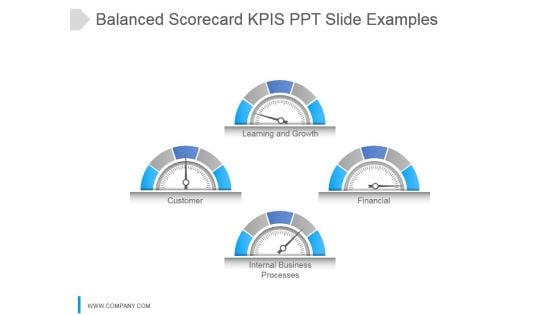
Balanced Scorecard Kpi S Ppt Slide Examples
This is a balanced scorecard kpi s ppt slide examples. This is a four stage process. The stages in this process are learning and growth, customer, financial, internal business processes.

Incremental Sales Kpi Measures Presentation Backgrounds
This is a incremental sales kpi measures presentation backgrounds. This is a four stage process. The stages in this process are marketing, promotion, sales revenue, social channels.
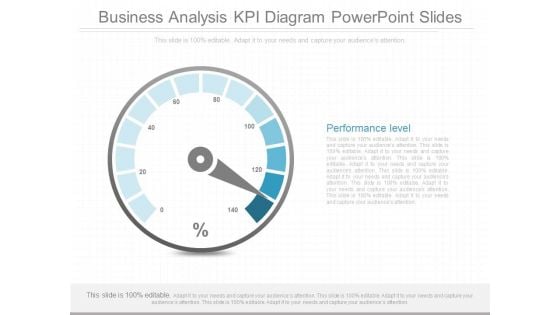
Business Analysis Kpi Diagram Powerpoint Slides
This is a business analysis kpi diagram powerpoint slides. This is a one stage process. The stages in this process are performance level.
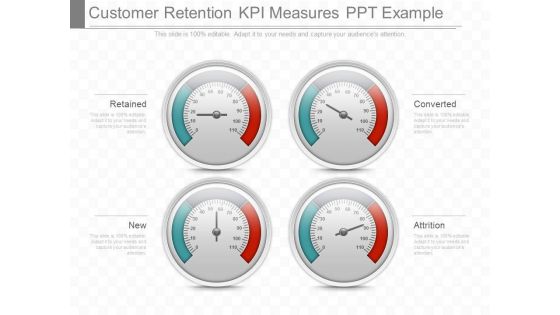
Customer Retention Kpi Measures Ppt Example
This is a customer retention kpi measures ppt example. This is a four stage process. The stages in this process are retained, new, converted, attrition.
Kpi Tracking Software Services Ppt Powerpoint Graphics
This is a kpi tracking software services ppt powerpoint graphics. This is a three stage process. The stages in this process are operations, revenue, manufacturing.
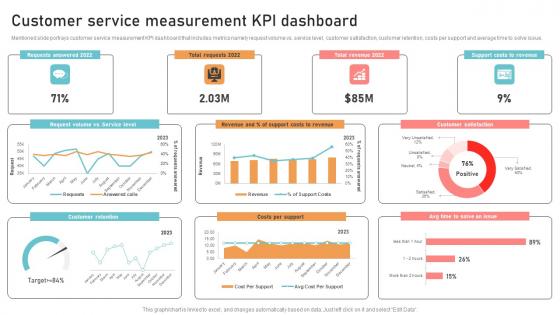
Optimizing Business Integration Customer Service Measurement KPI Template Pdf
Mentioned slide portrays customer service measurement KPI dashboard that includes metrics namely request volume vs. service level, customer satisfaction, customer retention, costs per support and average time to solve issue. Slidegeeks is here to make your presentations a breeze with Optimizing Business Integration Customer Service Measurement KPI Template Pdf With our easy to use and customizable templates, you can focus on delivering your ideas rather than worrying about formatting. With a variety of designs to choose from, you are sure to find one that suits your needs. And with animations and unique photos, illustrations, and fonts, you can make your presentation pop. So whether you are giving a sales pitch or presenting to the board, make sure to check out Slidegeeks first. Mentioned slide portrays customer service measurement KPI dashboard that includes metrics namely request volume vs. service level, customer satisfaction, customer retention, costs per support and average time to solve issue.

Inventory KPI Powerpoint Ppt Template Bundles
This Inventory Key Performance Indicators, Stock KPIs, Stock Metrics, Supply Chain KPIs, Metrics-slide Inventory KPI Powerpoint Ppt Template Bundles is your content ready tool to impress the stakeholders with your business planning and its manner of execution. Showcase your ideas and how you plan to make them real in detail with this PPT Template Bundle. The slides have the conceptual bandwidth to present the crucial aspects of your plan, such as funding, marketing, resource allocation, timeline, roadmap, and more. When you present your plans with this PPT Layout, the stakeholders are sure to come on board because you will be able to present a succinct, thought-out, winning project. Download this Complete Deck now to take control into your hands. The 100 percent customizable offer is just too good to be resisted. Key performance indicators KPIs in inventory management are measures that assists to monitor and make choices about your stock. Our Inventory KPI Powerpoint PPT Template Bundles are topically designed to provide an attractive backdrop to any subject.
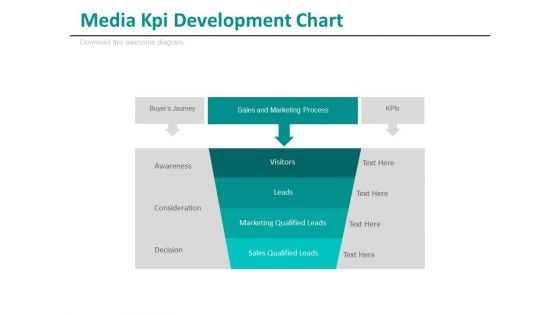
Media Kpi Development Chart Ppt Slides
This is a media KPI development chart ppt slides. This is a one stage process. The stages in this process are business, media, success.
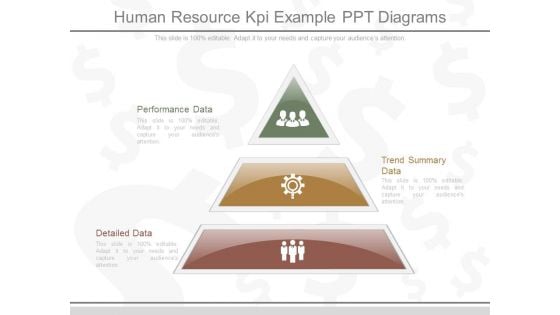
Human Resource Kpi Example Ppt Diagrams
This is a human resource kpi example ppt diagrams. This is a three stage process. The stages in this process are performance data, detailed data, trend summary data.
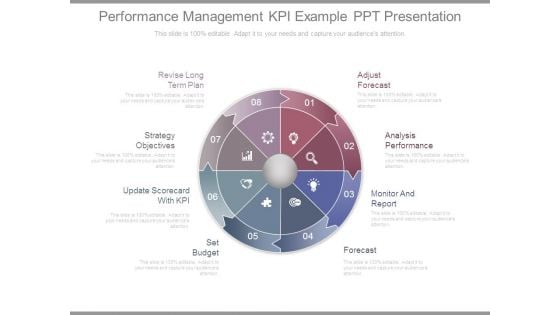
Performance Management Kpi Example Ppt Presentation
This is a performance management kpi example ppt presentation. This is a eight stage process. The stages in this process are revise long term plan, strategy objectives, update scorecard with kpi, set budget, forecast, monitor and report, analysis performance, adjust forecast.
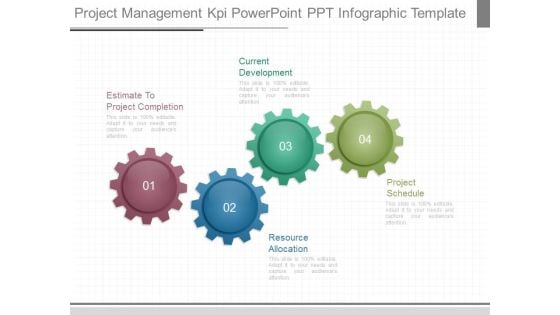
Project Management Kpi Powerpoint Ppt Infographic Template
This is a project management kpi powerpoint ppt infographic template. This is a four stage process. The stages in this process are estimate to project completion, resource allocation, current development, project schedule.

Scorecard Table With Kpi PowerPoint Presentation Template
Brace Yourself, Arm Your Thoughts. Prepare For The Hustle With Our Scorecard Table With KPI PowerPoint Presentation Template Powerpoint Templates. Generate Ecstasy With Our Marketing Plan Powerpoint Templates. Your Thoughts Will Delight Your Audience.
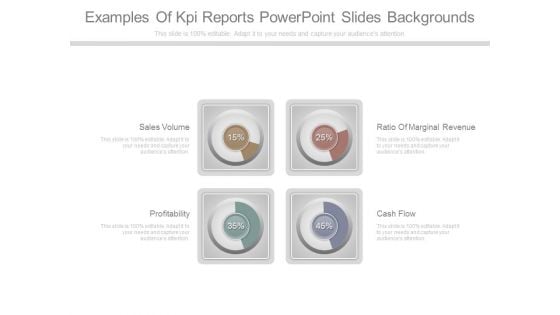
Examples Of Kpi Reports Powerpoint Slides Backgrounds
This is a examples of kpi reports powerpoint slides backgrounds. This is a four stage process. The stages in this process are sales volume, profitability, ratio of marginal revenue, cash flow.
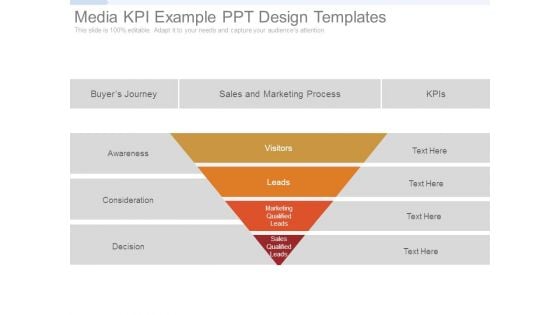
Media Kpi Example Ppt Design Templates
This is a media kpi example ppt design templates. This is a four stage process. The stages in this process are awareness, consideration, decision, visitors, leads, buyer journey, sales and marketing process, kpis, marketing qualified leads, sales qualified leads.
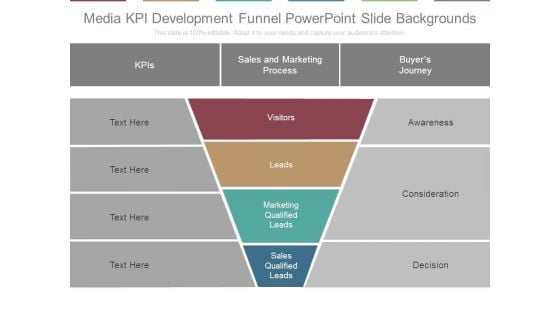
Media Kpi Development Funnel Powerpoint Slide Backgrounds
This is a media kpi development funnel powerpoint slide backgrounds. This is a four stage process. The stages in this process are kpis, sales and marketing process, buyers journey, awareness, consideration, decision, visitors, leads, marketing qualified leads, sales qualified leads.
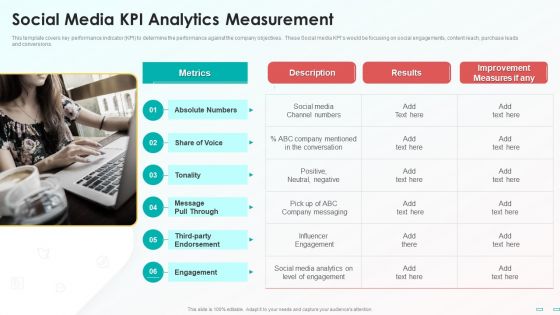
Social Media Kpi Analytics Measurement Demonstration PDF
This template covers key performance indicator KPI to determine the performance against the company objectives. These Social media KPIs would be focusing on social engagements, content reach, purchase leads and conversions. Presenting Social Media Kpi Analytics Measurement Demonstration PDF to provide visual cues and insights. Share and navigate important information on one stages that need your due attention. This template can be used to pitch topics like Metrics, Social Media, Improvement Measures. In addtion, this PPT design contains high resolution images, graphics, etc, that are easily editable and available for immediate download.
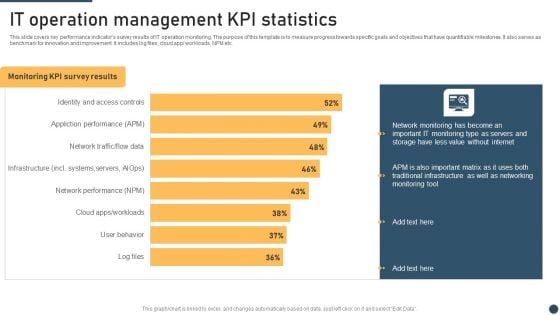
It Operation Management Kpi Statistics Graphics PDF
This slide covers key performance indicators survey results of IT operation monitoring. The purpose of this template is to measure progress towards specific goals and objectives that have quantifiable milestones. It also serves as benchmark for innovation and improvement. It includes log files, cloud app workloads, NPM etc. Showcasing this set of slides titled It Operation Management Kpi Statistics Graphics PDF. The topics addressed in these templates are KPI Statistics, Management, Network Monitoring. All the content presented in this PPT design is completely editable. Download it and make adjustments in color, background, font etc. as per your unique business setting.
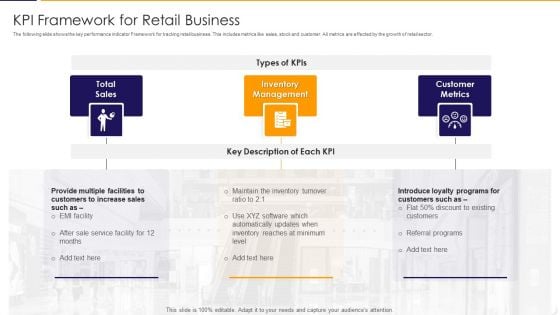
KPI Framework For Retail Business Elements PDF
The following slide shows the key performance indicator Framework for tracking retail business. This includes metrics like sales, stock and customer. All metrics are affected by the growth of retail sector. Presenting kpi framework for retail business elements pdf to dispense important information. This template comprises three stages. It also presents valuable insights into the topics including total sales, inventory management, customer metrics. This is a completely customizable PowerPoint theme that can be put to use immediately. So, download it and address the topic impactfully.
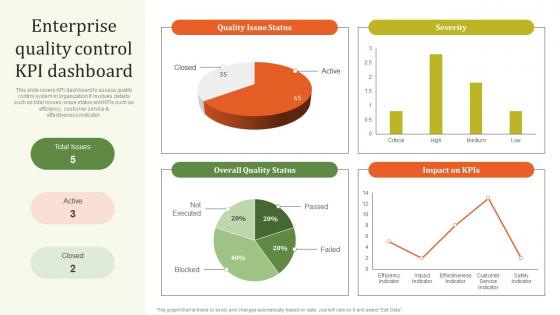
Enterprise Quality Control KPI Executing Effective Quality Enhancement Mockup Pdf
This slide covers KPI dashboard to assess quality control system in organization It involves details such as total issues, issue status and KPIs such as efficiency, customer service and effectiveness indicator. Find highly impressive Enterprise Quality Control KPI Executing Effective Quality Enhancement Mockup Pdf on Slidegeeks to deliver a meaningful presentation. You can save an ample amount of time using these presentation templates. No need to worry to prepare everything from scratch because Slidegeeks experts have already done a huge research and work for you. You need to download Enterprise Quality Control KPI Executing Effective Quality Enhancement Mockup Pdf for your upcoming presentation. All the presentation templates are 100 percent editable and you can change the color and personalize the content accordingly. Download now. This slide covers KPI dashboard to assess quality control system in organization It involves details such as total issues, issue status and KPIs such as efficiency, customer service and effectiveness indicator.
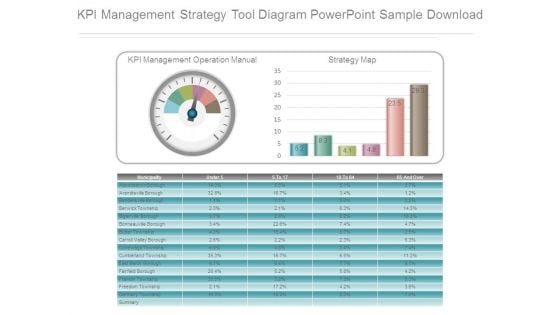
Kpi Management Strategy Tool Diagram Powerpoint Sample Download
This is a kpi management strategy tool diagram powerpoint sample download. This is a one stage process. The stages in this process are kpi management operation manual, strategy map.
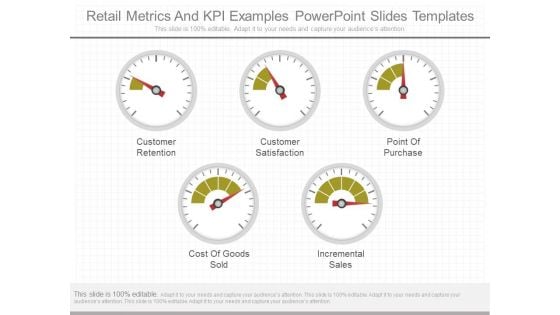
Retail Metrics And Kpi Examples Powerpoint Slides Templates
This is a retail metrics and kpi examples powerpoint slides templates. This is a five stage process. The stages in this process are customer retention, customer satisfaction, point of purchase, cost of goods sold, incremental sales.
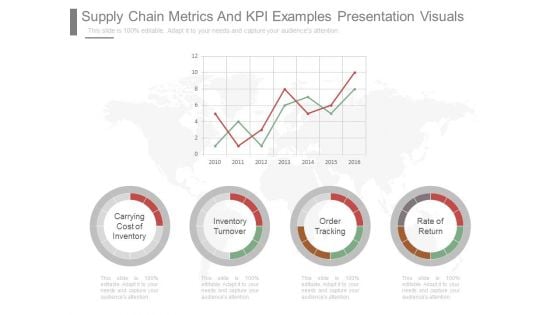
Supply Chain Metrics And Kpi Examples Presentation Visuals
This is a supply chain metrics and kpi examples presentation visuals. This is a four stage process. The stages in this process are carrying cost of inventory, inventory turnover, order tracking, rate of return.
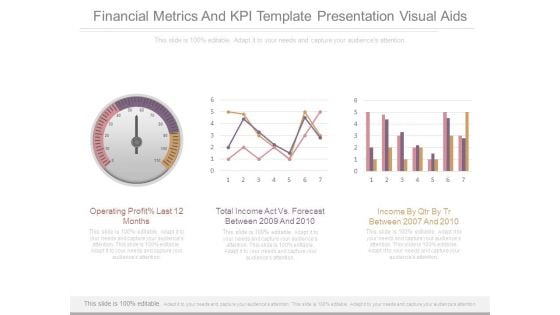
Financial Metrics And Kpi Template Presentation Visual Aids
This is a financial metrics and kpi template presentation visual aids. This is a three stage process. The stages in this process are operating profit last 12 months, total income act vs forecast between 2009 and 2010, income by qtr by tr between 2007 and 2010.
KPI Metrics Vector Icon Ppt PowerPoint Presentation Layouts Slide
This is a kpi metrics vector icon ppt powerpoint presentation layouts slide. This is a three stage process. The stages in this process are kpi proposal, kpi plan, kpi scheme.
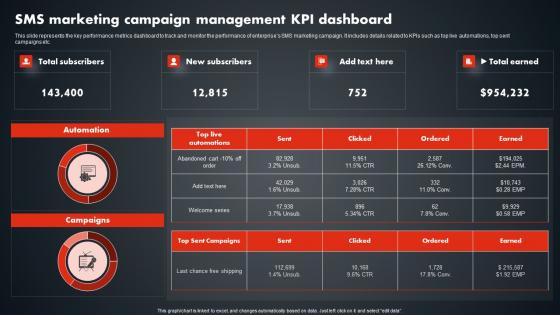
SMS Marketing Campaign Management Kpi SMS Promotional Tactics Graphics PDF
This slide represents the key performance metrics dashboard to track and monitor the performance of enterprises SMS marketing campaign. It includes details related to KPIs such as top live automations, top sent campaigns etc. There are so many reasons you need a SMS Marketing Campaign Management Kpi SMS Promotional Tactics Graphics PDF. The first reason is you can not spend time making everything from scratch, Thus, Slidegeeks has made presentation templates for you too. You can easily download these templates from our website easily. This slide represents the key performance metrics dashboard to track and monitor the performance of enterprises SMS marketing campaign. It includes details related to KPIs such as top live automations, top sent campaigns etc.
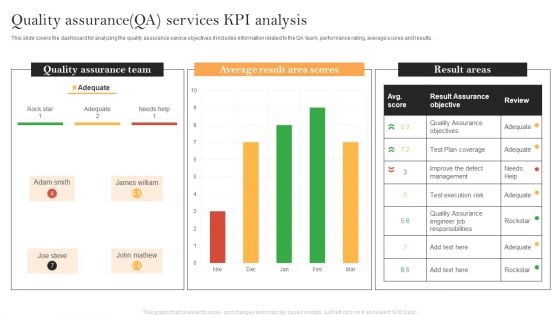
Quality Assurance QA Services KPI Analysis Demonstration PDF
This slide covers the dashboard for analyzing the quality assurance service objectives it includes information related to the QA team, performance rating, average scores and results. Showcasing this set of slides titled Quality Assurance QA Services KPI Analysis Demonstration PDF. The topics addressed in these templates are Quality Assurance Team, Average Result Area, Result Assurance Objective. All the content presented in this PPT design is completely editable. Download it and make adjustments in color, background, font etc. as per your unique business setting.
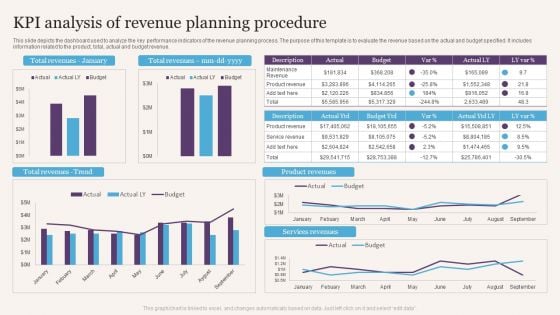
KPI Analysis Of Revenue Planning Procedure Professional PDF
This slide depicts the dashboard used to analyze the key performance indicators of the revenue planning process. The purpose of this template is to evaluate the revenue based on the actual and budget specified. It includes information related to the product, total, actual and budget revenue. Showcasing this set of slides titled KPI Analysis Of Revenue Planning Procedure Professional PDF. The topics addressed in these templates are Kpi Analysis, Revenue Planning Procedure. All the content presented in this PPT design is completely editable. Download it and make adjustments in color, background, font etc. as per your unique business setting.

Vendor Performance KPI With Rejection Rate Inspiration PDF
This slide exhibits supplier dashboard which allows organisation to monitor level of dependency towards supplier and analyse the quality of each of them. It includes elements such as number of suppliers currently, compliance rate, rejection rate, etc. Pitch your topic with ease and precision using this Vendor Performance KPI With Rejection Rate Inspiration PDF. This layout presents information on Vendor Performance KPI, Rejection Rate. It is also available for immediate download and adjustment. So, changes can be made in the color, design, graphics or any other component to create a unique layout.

Key Performance Indicators KPI Ppt PowerPoint Presentation Infographics Cpb
This is a key performance indicators kpi ppt powerpoint presentation infographics cpb. This is a five stage process. The stages in this process are key performance indicators kpi.
Employee Kpi Examples Ppt Powerpoint Presentation Infographics Backgrounds Cpb
This is a employee kpi examples ppt powerpoint presentation infographics backgrounds cpb. This is a seven stage process. The stages in this process are employee kpi examples.
Business Kpi Ppt Powerpoint Presentation Infographics Format Cpb
This is a business kpi ppt powerpoint presentation infographics format cpb. This is a four stage process. The stages in this process are business kpi.
Kpi Reports Examples Ppt Powerpoint Presentation Styles Demonstration Cpb
This is a kpi reports examples ppt powerpoint presentation styles demonstration cpb. This is a four stage process. The stages in this process are kpi reports examples.
Benchmark Bounce Rate KPI By Various Channels Infographics Pdf
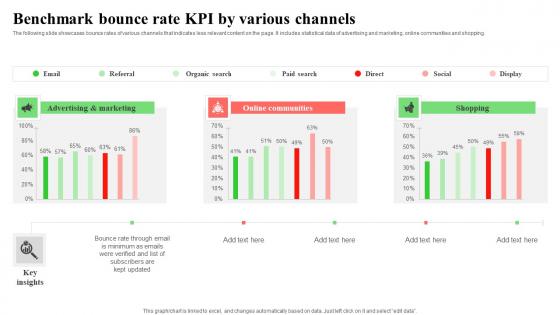
The following slide showcases bounce rates of various channels that indicates less relevant content on the page. It includes statistical data of advertising and marketing, online communities and shopping. Pitch your topic with ease and precision using this Benchmark Bounce Rate KPI By Various Channels Infographics Pdf. This layout presents information on Advertising,Marketing, Online Communities. It is also available for immediate download and adjustment. So, changes can be made in the color, design, graphics or any other component to create a unique layout. The following slide showcases bounce rates of various channels that indicates less relevant content on the page. It includes statistical data of advertising and marketing, online communities and shopping.
Various KPI For Cyber Security Breach Worldwide Pictures Pdf
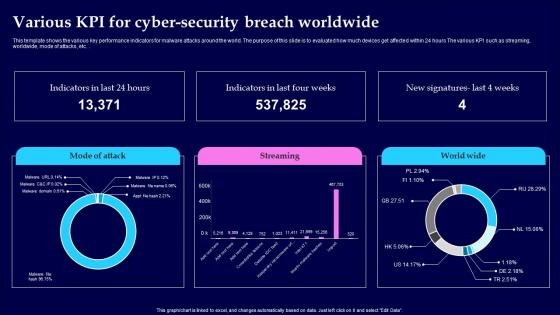
This template shows the various key performance indicators for malware attacks around the world. The purpose of this slide is to evaluated how much devices get affected within 24 hours The various KPI such as streaming, worldwide, mode of attacks, etc. Showcasing this set of slides titled Various KPI For Cyber Security Breach Worldwide Pictures Pdf The topics addressed in these templates are Cyber Security Breach, Worldwide All the content presented in this PPT design is completely editable. Download it and make adjustments in color, background, font etc. as per your unique business setting. This template shows the various key performance indicators for malware attacks around the world. The purpose of this slide is to evaluated how much devices get affected within 24 hours The various KPI such as streaming, worldwide, mode of attacks, etc.


 Continue with Email

 Home
Home


