Kpi Dashboard
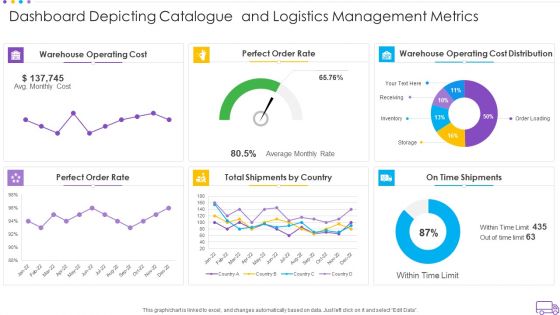
Dashboard Depicting Catalogue And Logistics Management Metrics Pictures PDF
Pitch your topic with ease and precision using this dashboard depicting catalogue and logistics management metrics pictures pdf. This layout presents information on warehouse operating cost, perfect order rate, warehouse operating cost distribution, perfect order rate, total shipments by country. It is also available for immediate download and adjustment. So, changes can be made in the color, design, graphics or any other component to create a unique layout.
Multi Cloud Complexity Management Cloud Performance Tracking Dashboard Clipart PDF
This slide covers the Key performance indicators for tracking performance of the cloud such as violations break down, sources, rules and severity. Deliver an awe inspiring pitch with this creative Multi Cloud Complexity Management Cloud Performance Tracking Dashboard Clipart PDF bundle. Topics like Violations Sources, Teams can be discussed with this completely editable template. It is available for immediate download depending on the needs and requirements of the user.
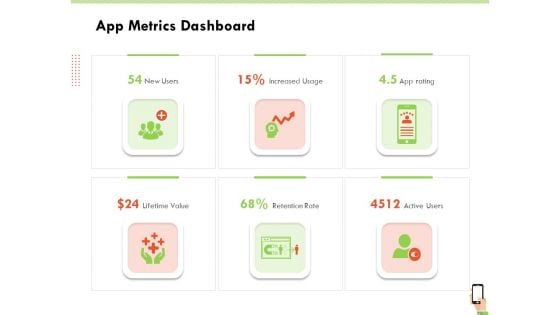
Multi Channel Online Commerce App Metrics Dashboard Sample PDF
This is a multi channel online commerce app metrics dashboard sample pdf template with various stages. Focus and dispense information on six stages using this creative set, that comes with editable features. It contains large content boxes to add your information on topics like lifetime value, active users, retention rate, increased usage. You can also showcase facts, figures, and other relevant content using this PPT layout. Grab it now.
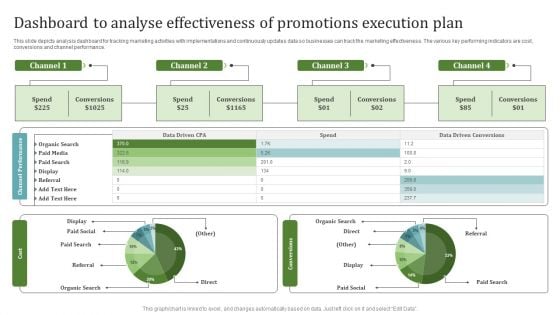
Dashboard To Analyse Effectiveness Of Promotions Execution Plan Diagrams PDF
This slide depicts analysis dashboard for tracking marketing activities with implementations and continuously updates data so businesses can track the marketing effectiveness. The various key performing indicators are cost, conversions and channel performance. Showcasing this set of slides titled Dashboard To Analyse Effectiveness Of Promotions Execution Plan Diagrams PDF. The topics addressed in these templates are Channel Performance, Cost, Conversions. All the content presented in this PPT design is completely editable. Download it and make adjustments in color, background, font etc. as per your unique business setting.
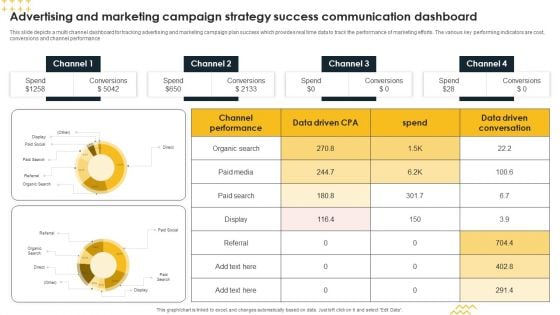
Advertising And Marketing Campaign Strategy Success Communication Dashboard Inspiration PDF
This slide depicts a multi channel dashboard for tracking advertising and marketing campaign plan success which provides real time data to track the performance of marketing efforts. The various key performing indicators are cost, conversions and channel performance Showcasing this set of slides titled Advertising And Marketing Campaign Strategy Success Communication Dashboard Inspiration PDF. The topics addressed in these templates are Conversions, Spend, Channel. All the content presented in this PPT design is completely editable. Download it and make adjustments in color, background, font etc. as per your unique business setting.
Plan Dashboard For Tracking Location Wise Revenue Diagrams PDF
This slide presents a dashboard which will assist managers to track the revenue of each branch having geographical presence in different corners of the world. The key performance indicators are total revenue, location wise rent, branch performance among many others.Pitch your topic with ease and precision using this Plan Dashboard For Tracking Location Wise Revenue Diagrams PDF. This layout presents information on Taxes Paid, Current Month, Branch Performance, Previous Quarter. It is also available for immediate download and adjustment. So, changes can be made in the color, design, graphics or any other component to create a unique layout.
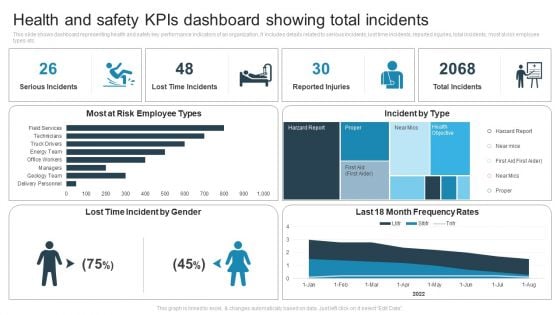
Health And Safety Kpis Dashboard Showing Total Incidents Pictures PDF
This slide shows dashboard representing health and safety key performance indicators of an organization. It includes details related to serious incidents, lost time incidents, reported injuries, total incidents, most at risk employee types etc. Showcasing this set of slides titled Health And Safety Kpis Dashboard Showing Total Incidents Pictures PDF. The topics addressed in these templates are Lost Time Incident, Most At Risk Employee, Incident By Type. All the content presented in this PPT design is completely editable. Download it and make adjustments in color, background, font etc. as per your unique business setting.
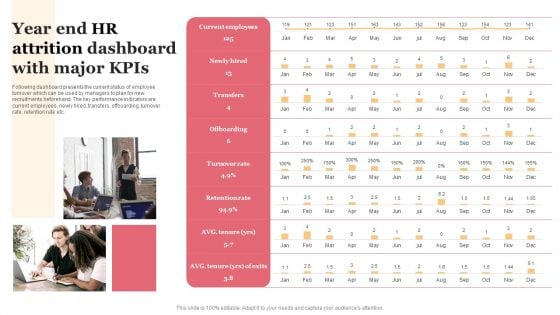
Year End HR Attrition Dashboard With Major Kpis Demonstration PDF
Following dashboard presents the current status of employee turnover which can be used by managers to plan for new recruitments beforehand. The key performance indicators are current employees, newly hired, transfers, offboarding, turnover rate, retention rate etc. Persuade your audience using this Year End HR Attrition Dashboard With Major Kpis Demonstration PDF. This PPT design covers one stages, thus making it a great tool to use. It also caters to a variety of topics including Retention Rate, Turnover Rate, Offboarding. Download this PPT design now to present a convincing pitch that not only emphasizes the topic but also showcases your presentation skills.
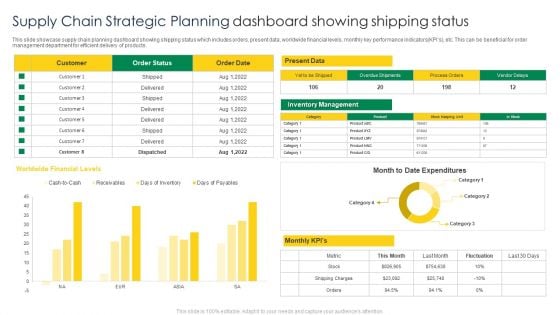
Supply Chain Strategic Planning Dashboard Showing Shipping Status Structure PDF
This slide showcase supply chain planning dashboard showing shipping status which includes orders, present data, worldwide financial levels, monthly key performance indicators KPIs, etc. This can be beneficial for order management department for efficient delivery of products. Showcasing this set of slides titled Supply Chain Strategic Planning Dashboard Showing Shipping Status Structure PDF. The topics addressed in these templates are Worldwide Financial Levels, Present Data, Customer. All the content presented in this PPT design is completely editable. Download it and make adjustments in color, background, font etc. as per your unique business setting.
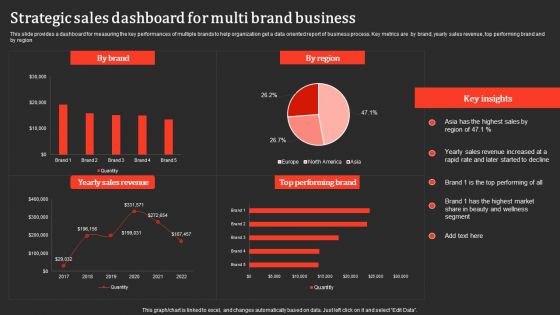
Strategic Sales Dashboard For Multi Brand Business Professional PDF
This slide provides a dashboard for measuring the key performances of multiple brands to help organization get a data oriented report of business process. Key metrics are by brand, yearly sales revenue, top performing brand and by region. Pitch your topic with ease and precision using this Strategic Sales Dashboard For Multi Brand Business Professional PDF. This layout presents information on Yearly Sales Revenue, Performing Brand. It is also available for immediate download and adjustment. So, changes can be made in the color, design, graphics or any other component to create a unique layout.
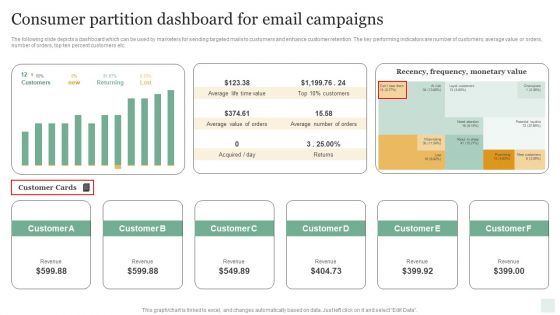
Consumer Partition Dashboard For Email Campaigns Infographics PDF
The following slide depicts a dashboard which can be used by marketers for sending targeted mails to customers and enhance customer retention. The key performing indicators are number of customers, average value or orders, number of orders, top ten percent customers etc. Showcasing this set of slides titled Consumer Partition Dashboard For Email Campaigns Infographics PDF. The topics addressed in these templates are Average Life Time Value, Average Value Of Orders, Returns, Average Number Of Orders. All the content presented in this PPT design is completely editable. Download it and make adjustments in color, background, font etc. as per your unique business setting.
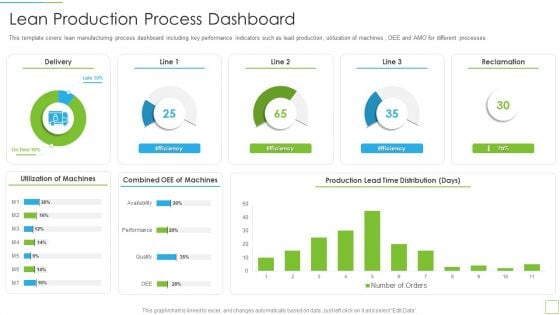
Hoshin Kanri Pitch Deck Lean Production Process Dashboard Guidelines PDF
This template covers lean manufacturing process dashboard including key performance indicators such as lead production, utilization of machines , OEE and AMO for different processes Deliver and pitch your topic in the best possible manner with this hoshin kanri pitch deck lean production process dashboard guidelines pdf Use them to share invaluable insights on utilization of machines, combined oee of machines, production lead time distribution and impress your audience. This template can be altered and modified as per your expectations. So, grab it now.
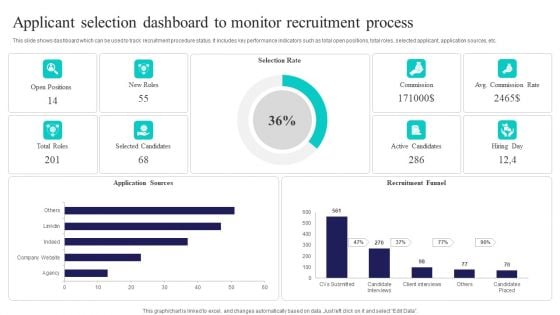
Applicant Selection Dashboard To Monitor Recruitment Process Sample PDF
This slide shows dashboard which can be used to track recruitment procedure status. It includes key performance indicators such as total open positions, total roles, selected applicant, application sources, etc. Pitch your topic with ease and precision using this Applicant Selection Dashboard To Monitor Recruitment Process Sample PDF. This layout presents information on Selection Rate, Recruitment Funnel, Application Sources. It is also available for immediate download and adjustment. So, changes can be made in the color, design, graphics or any other component to create a unique layout.
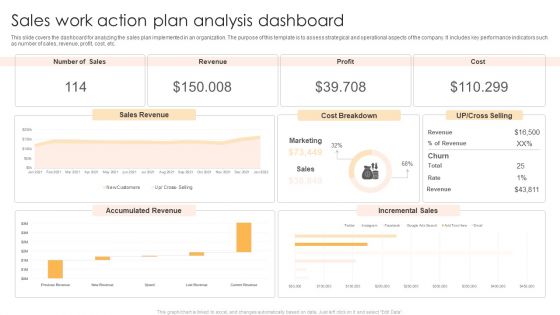
Sales Work Action Plan Analysis Dashboard Brochure PDF
This slide covers the dashboard for analyzing the sales plan implemented in an organization. The purpose of this template is to assess strategical and operational aspects of the company. It includes key performance indicators such as number of sales, revenue, profit, cost, etc. Showcasing this set of slides titled Sales Work Action Plan Analysis Dashboard Brochure PDF. The topics addressed in these templates are Sales Revenue, Cost Breakdown, Accumulated Revenue. All the content presented in this PPT design is completely editable. Download it and make adjustments in color, background, font etc. as per your unique business setting.
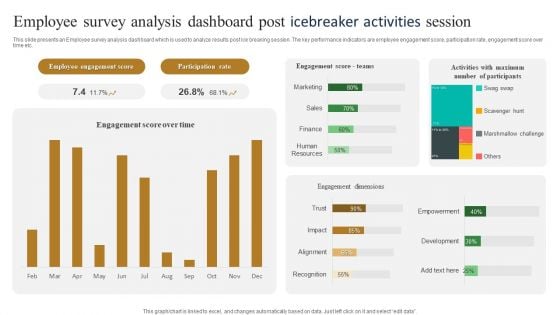
Employee Survey Analysis Dashboard Post Icebreaker Activities Session Slides PDF
This slide presents an Employee survey analysis dashboard which is used to analyze results post ice breaking session. The key performance indicators are employee engagement score, participation rate, engagement score over time etc. Pitch your topic with ease and precision using this Employee Survey Analysis Dashboard Post Icebreaker Activities Session Slides PDF. This layout presents information on Participation Rate, Employee Engagement Score. It is also available for immediate download and adjustment. So, changes can be made in the color, design, graphics or any other component to create a unique layout.
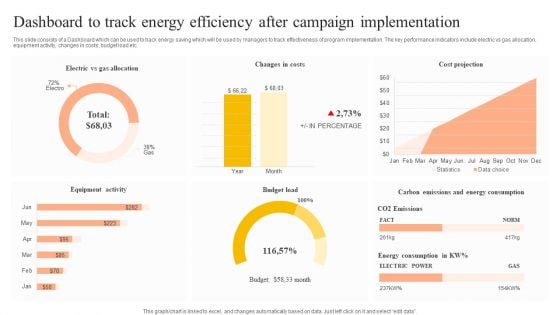
Dashboard To Track Energy Efficiency After Campaign Implementation Pictures PDF
This slide consists of a Dashboard which can be used to track energy saving which will be used by managers to track effectiveness of program implementation. The key performance indicators include electric vs gas allocation, equipment activity, changes in costs, budget load etc. Showcasing this set of slides titled Dashboard To Track Energy Efficiency After Campaign Implementation Pictures PDF. The topics addressed in these templates are Equipment Activity, Budget Load, Cost Projection. All the content presented in this PPT design is completely editable. Download it and make adjustments in color, background, font etc. as per your unique business setting.
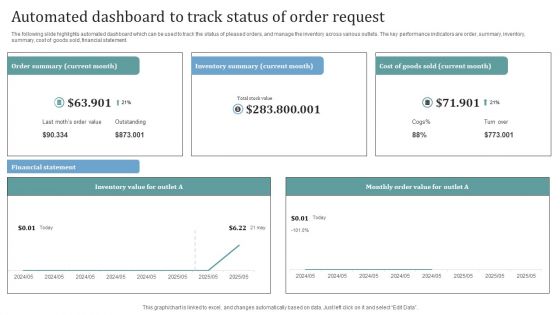
Automated Dashboard To Track Status Of Order Request Themes PDF
The following slide highlights automated dashboard which can be used to track the status of pleased orders, and manage the inventory across various outlets. The key performance indicators are order, summary, inventory, summary, cost of goods sold, financial statement. Showcasing this set of slides titled Automated Dashboard To Track Status Of Order Request Themes PDF. The topics addressed in these templates are Inventory Value, Inventory Summary, Cost. All the content presented in this PPT design is completely editable. Download it and make adjustments in color, background, font etc. as per your unique business setting.
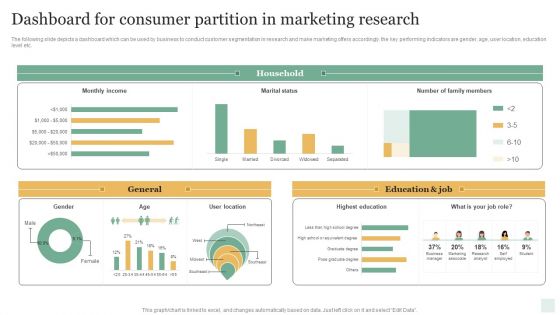
Dashboard For Consumer Partition In Marketing Research Microsoft PDF
The following slide depicts a dashboard which can be used by business to conduct customer segmentation in research and make marketing offers accordingly. the key performing indicators are gender, age, user location, education level etc. Showcasing this set of slides titled Dashboard For Consumer Partition In Marketing Research Microsoft PDF. The topics addressed in these templates are General, Education And Job, Household. All the content presented in this PPT design is completely editable. Download it and make adjustments in color, background, font etc. as per your unique business setting.
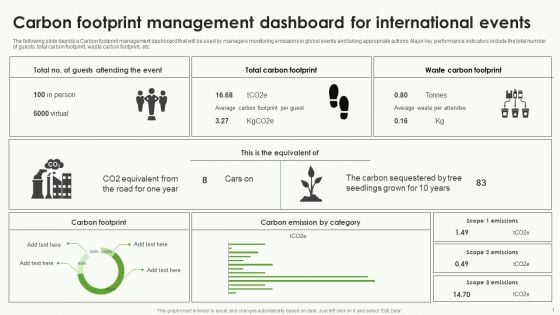
Carbon Footprint Management Dashboard For International Events Brochure PDF
The following slide depicts a Carbon footprint management dashboard that will be used by managers monitoring emissions in global events and taking appropriate actions. Major key performance indicators include the total number of guests, total carbon footprint, waste carbon footprint, etc. Showcasing this set of slides titled Carbon Footprint Management Dashboard For International Events Brochure PDF. The topics addressed in these templates are Carbon Footprint, Carbon Emission By Category, Waste Carbon Footprint. All the content presented in this PPT design is completely editable. Download it and make adjustments in color, background, font etc. as per your unique business setting.
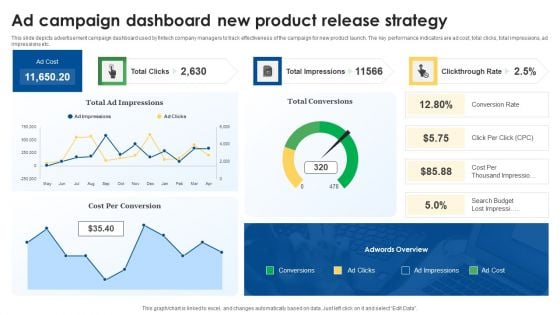
Ad Campaign Dashboard New Product Release Strategy Guidelines PDF
This slide depicts advertisement campaign dashboard used by fintech company managers to track effectiveness of the campaign for new product launch. The key performance indicators are ad cost, total clicks, total impressions, ad impressions etc. Pitch your topic with ease and precision using this Ad Campaign Dashboard New Product Release Strategy Guidelines PDF. This layout presents information on Impressions, Conversion, Strategy. It is also available for immediate download and adjustment. So, changes can be made in the color, design, graphics or any other component to create a unique layout.
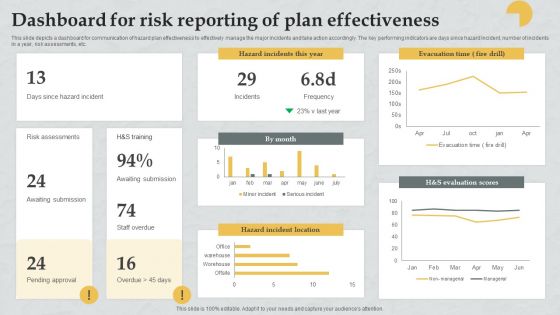
Dashboard For Risk Reporting Of Plan Effectiveness Download PDF
This slide depicts a dashboard for communication of hazard plan effectiveness to effectively manage the major incidents and take action accordingly. The key performing indicators are days since hazard incident, number of incidents in a year, risk assessments, etc. Showcasing this set of slides titled Dashboard For Risk Reporting Of Plan Effectiveness Download PDF. The topics addressed in these templates are Risk Assessments, Awaiting Submission, Awaiting Submission. All the content presented in this PPT design is completely editable. Download it and make adjustments in color, background, font etc. as per your unique business setting.
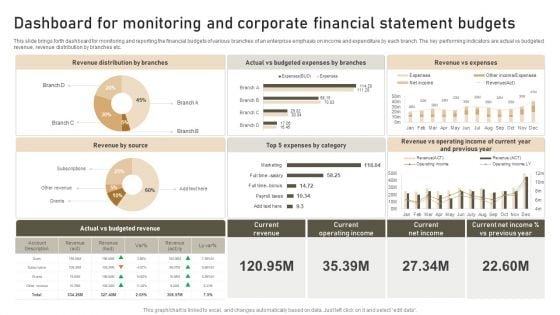
Dashboard For Monitoring And Corporate Financial Statement Budgets Template PDF
This slide brings forth dashboard for monitoring and reporting the financial budgets of various branches of an enterprise emphasis on income and expenditure by each branch. The key performing indicators are actual vs budgeted revenue, revenue distribution by branches etc. Showcasing this set of slides titled Dashboard For Monitoring And Corporate Financial Statement Budgets Template PDF. The topics addressed in these templates are Revenue Distribution, Revenue Source, Revenue Expenses. All the content presented in this PPT design is completely editable. Download it and make adjustments in color, background, font etc. as per your unique business setting.
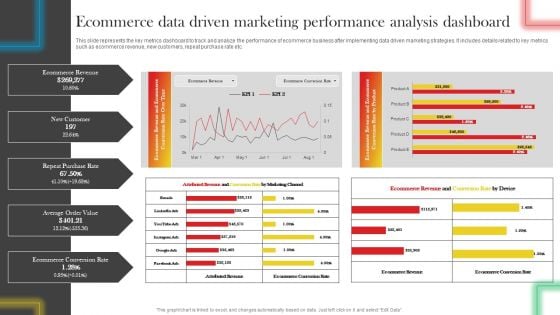
Ecommerce Data Driven Marketing Performance Analysis Dashboard Professional PDF
This slide represents the key metrics dashboard to track and analyze the performance of ecommerce business after implementing data driven marketing strategies. It includes details related to key metrics such as ecommerce revenue, new customers, repeat purchase rate etc. Get a simple yet stunning designed Ecommerce Data Driven Marketing Performance Analysis Dashboard Professional PDF. It is the best one to establish the tone in your meetings. It is an excellent way to make your presentations highly effective. So, download this PPT today from Slidegeeks and see the positive impacts. Our easy-to-edit Ecommerce Data Driven Marketing Performance Analysis Dashboard Professional PDF can be your go-to option for all upcoming conferences and meetings. So, what are you waiting for Grab this template today.
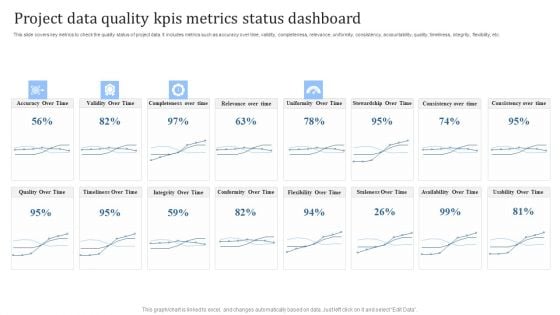
Project Data Quality Kpis Metrics Status Dashboard Designs PDF
This slide covers key metrics to check the quality status of project data. It includes metrics such as accuracy over time, validity, completeness, relevance, uniformity, consistency, accountability, quality, timeliness, integrity, flexibility, etc. Pitch your topic with ease and precision using this Project Data Quality Kpis Metrics Status Dashboard Designs PDF. This layout presents information on Accuracy Over Time, Validity Over Time. It is also available for immediate download and adjustment. So, changes can be made in the color, design, graphics or any other component to create a unique layout.
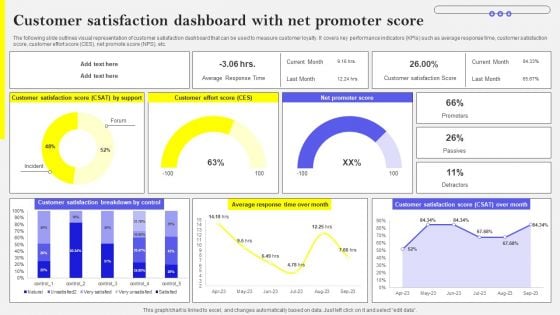
Customer Satisfaction Dashboard With Net Promoter Score Introduction PDF
The following slide outlines visual representation of customer satisfaction dashboard that can be used to measure customer loyalty. It covers key performance indicators KPIs such as average response time, customer satisfaction score, customer effort score CES, net promote score NPS, etc. Do you have to make sure that everyone on your team knows about any specific topic I yes, then you should give Customer Satisfaction Dashboard With Net Promoter Score Introduction PDF a try. Our experts have put a lot of knowledge and effort into creating this impeccable Customer Satisfaction Dashboard With Net Promoter Score Introduction PDF. You can use this template for your upcoming presentations, as the slides are perfect to represent even the tiniest detail. You can download these templates from the Slidegeeks website and these are easy to edit. So grab these today
Different Brands Performance Tracking Dashboard Ppt Gallery Infographics PDF
This slide provides information regarding different brands performance tracking dashboard in terms of brand metric, brand commitment, advertising metrics, and purchase metrics. Take your projects to the next level with our ultimate collection of Different Brands Performance Tracking Dashboard Ppt Gallery Infographics PDF. Slidegeeks has designed a range of layouts that are perfect for representing task or activity duration, keeping track of all your deadlines at a glance. Tailor these designs to your exact needs and give them a truly corporate look with your own brand colors they will make your projects stand out from the rest.
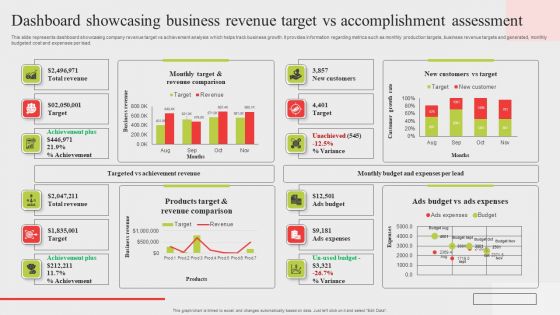
Dashboard Showcasing Business Revenue Target Vs Accomplishment Assessment Information PDF
This slide represents dashboard showcasing company revenue target vs achievement analysis which helps track business growth. It provides information regarding metrics such as monthly production targets, business revenue targets and generated, monthly budgeted cost and expenses per lead. Showcasing this set of slides titled Dashboard Showcasing Business Revenue Target Vs Accomplishment Assessment Information PDF. The topics addressed in these templates are Total Revenue, Target, Achievement. All the content presented in this PPT design is completely editable. Download it and make adjustments in color, background, font etc. as per your unique business setting.
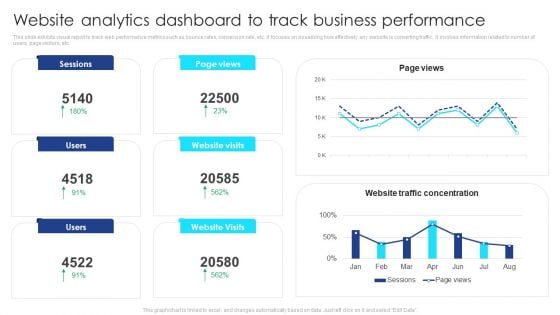
Website Analytics Dashboard To Track Business Performance Guidelines PDF
This slide exhibits visual report to track web performance metrics such as bounce rates, conversion rate, etc. It focuses on visualizing how effectively any website is converting traffic. It involves information related to number of users, page visitors, etc. Pitch your topic with ease and precision using this Website Analytics Dashboard To Track Business Performance Guidelines PDF. This layout presents information on Website Analytics, Dashboard To Track, Business Performance. It is also available for immediate download and adjustment. So, changes can be made in the color, design, graphics or any other component to create a unique layout.
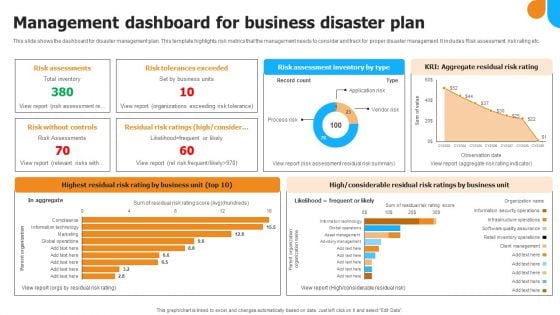
Management Dashboard For Business Disaster Plan Infographics PDF
This slide shows the dashboard for disaster management plan. This template highlights risk metrics that the management needs to consider and track for proper disaster management. It includes Risk assessment, risk rating etc. Showcasing this set of slides titled Management Dashboard For Business Disaster Plan Infographics PDF Graphics. The topics addressed in these templates are Risk Assessments, Risk Tolerances Exceeded, Risk Without Controls. All the content presented in this PPT design is completely editable. Download it and make adjustments in color, background, font etc. as per your unique business setting.
Digital Marketing Dashboard For Tracking Lead Generation Guidelines PDF
This slide showcases dashboard for digital marketing that can help organization track the monthly leads generated and performance of online marketing campaigns. Its key components are lead breakdown, total lead by program, web traffic targets, key conversion metrics, trial leads by region, total social media channels and key conversion metrics. Showcasing this set of slides titled Digital Marketing Dashboard For Tracking Lead Generation Guidelines PDF. The topics addressed in these templates are Lead By Program, Lead Breakdown, Key Conversion Metrics. All the content presented in this PPT design is completely editable. Download it and make adjustments in color, background, font etc. as per your unique business setting.
Brand Recognition Overview Different Brands Performance Tracking Dashboard Brochure PDF
This slide provides information regarding different brands performance tracking dashboard in terms of brand metric, brand commitment, advertising metrics, and purchase metrics. Do you have to make sure that everyone on your team knows about any specific topic I yes, then you should give Brand Recognition Overview Different Brands Performance Tracking Dashboard Brochure PDF a try. Our experts have put a lot of knowledge and effort into creating this impeccable Brand Recognition Overview Different Brands Performance Tracking Dashboard Brochure PDF. You can use this template for your upcoming presentations, as the slides are perfect to represent even the tiniest detail. You can download these templates from the Slidegeeks website and these are easy to edit. So grab these today
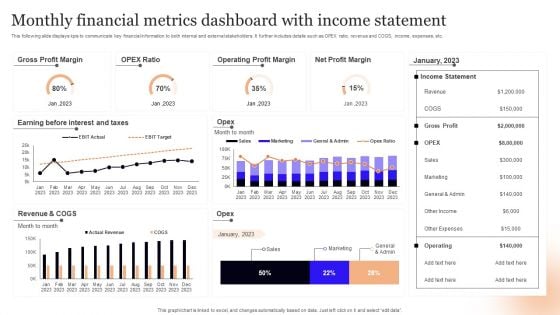
Monthly Financial Metrics Dashboard With Income Statement Infographics PDF
This following slide displays kpis to communicate key financial information to both internal and external stakeholders. It further includes details such as OPEX ratio, revenue and COGS, income, expenses, etc. Showcasing this set of slides titled Monthly Financial Metrics Dashboard With Income Statement Infographics PDF. The topics addressed in these templates are Gross Profit Margin, Taxes, Revenue. All the content presented in this PPT design is completely editable. Download it and make adjustments in color, background, font etc. as per your unique business setting.
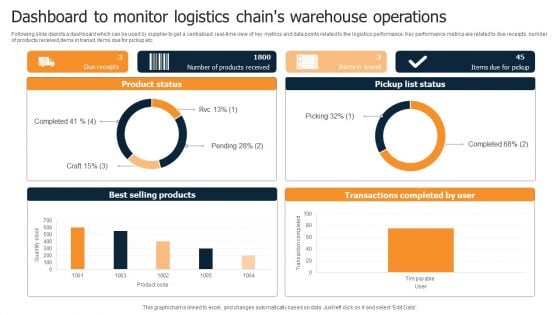
Dashboard To Monitor Logistics Chains Warehouse Operations Diagrams PDF
Following slide depicts a dashboard which can be used by supplier to get a centralized, real-time view of key metrics and data points related to the logistics performance. Key performance metrics are related to due receipts, number of products received,items in transit, items due for pickup etc. Pitch your topic with ease and precision using this Dashboard To Monitor Logistics Chains Warehouse Operations Diagrams PDF. This layout presents information on Product Status, Pickup List Status, Best Selling Products. It is also available for immediate download and adjustment. So, changes can be made in the color, design, graphics or any other component to create a unique layout.
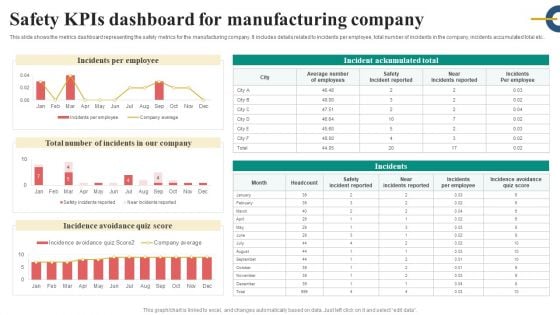
Safety Kpis Dashboard For Manufacturing Company Slides PDF
This slide shows the metrics dashboard representing the safety metrics for the manufacturing company. It includes details related to incidents per employee, total number of incidents in the company, incidents accumulated total etc.. Pitch your topic with ease and precision using this Safety Kpis Dashboard For Manufacturing Company Slides PDF. This layout presents information on Incidents Per Employee, Safety Incident Reported, Incidence Avoidance Quiz Score. It is also available for immediate download and adjustment. So, changes can be made in the color, design, graphics or any other component to create a unique layout.
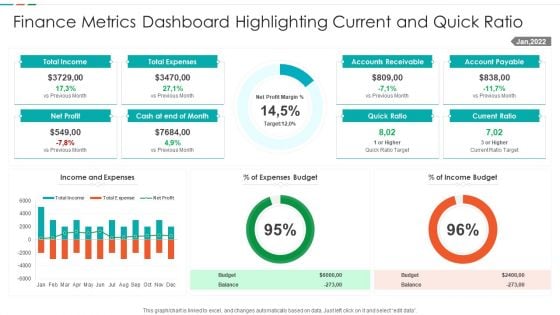
Finance Metrics Dashboard Highlighting Current And Quick Ratio Template PDF
This graph or chart is linked to excel, and changes automatically based on data. Just left click on it and select edit data. Showcasing this set of slides titled Finance Metrics Dashboard Highlighting Current And Quick Ratio Template PDF. The topics addressed in these templates are Total Income Budget, Total Expenses Balance, Net Profit Quick, Ratio Current Ratio. All the content presented in this PPT design is completely editable. Download it and make adjustments in color, background, font etc. as per your unique business setting.
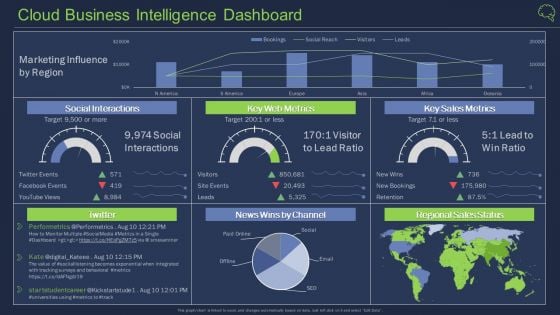
Cloud Business Intelligence Dashboard Ppt Outline Display PDF
Deliver and pitch your topic in the best possible manner with this cloud business intelligence dashboard ppt outline display pdf. Use them to share invaluable insights on social interactions, sales metrics, sales and impress your audience. This template can be altered and modified as per your expectations. So, grab it now.
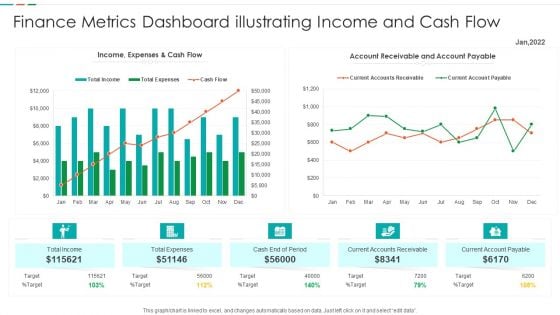
Finance Metrics Dashboard Illustrating Income And Cash Flow Template PDF
This graph or chart is linked to excel, and changes automatically based on data. Just left click on it and select edit data. Pitch your topic with ease and precision using this Finance Metrics Dashboard Illustrating Income And Cash Flow Template PDF. This layout presents information on Current Accounts Receivable, Current Account Payable, Cash End Period, Account Receivable Account. It is also available for immediate download and adjustment. So, changes can be made in the color, design, graphics or any other component to create a unique layout.
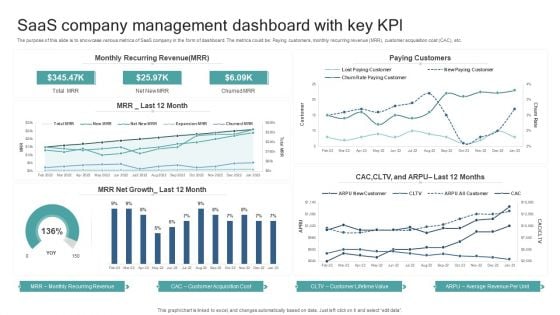
Saas Company Management Dashboard With Key Kpl Template PDF
The purpose of this slide is to showcase various metrics of SaaS company in the form of dashboard. The metrics could be, Paying customers, monthly recurring revenue MRR, customer acquisition cost CAC, etc. Showcasing this set of slides titled Saas Company Management Dashboard With Key Kpl Template PDF. The topics addressed in these templates are Monthly Recurring Revenue, Customer Acquisition Cost, Customer Lifetime Value, Average Revenue Per Unit. All the content presented in this PPT design is completely editable. Download it and make adjustments in color, background, font etc. as per your unique business setting.
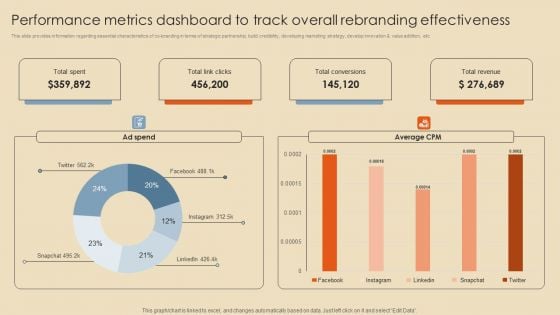
Performance Metrics Dashboard To Track Overall Rebranding Effectiveness Professional PDF
This slide provides information regarding essential characteristics of co-branding in terms of strategic partnership, build credibility, developing marketing strategy, develop innovation and value addition, etc. Make sure to capture your audiences attention in your business displays with our gratis customizable Performance Metrics Dashboard To Track Overall Rebranding Effectiveness Professional PDF. These are great for business strategies, office conferences, capital raising or task suggestions. If you desire to acquire more customers for your tech business and ensure they stay satisfied, create your own sales presentation with these plain slides.
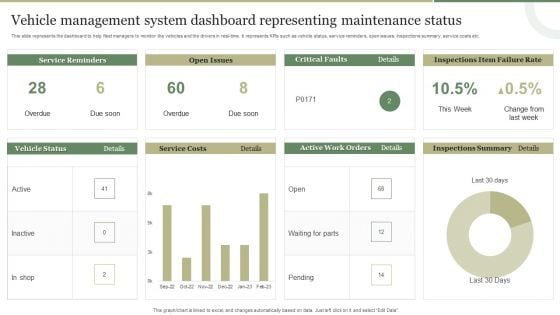
Vehicle Management System Dashboard Representing Maintenance Status Template PDF
This slide represents the dashboard representing the key metrics of the vehicle management system to monitor the vehicles and drivers in real-time. It includes key metrics such as service reminders, fuel costs, open issues, recent comments etc. Pitch your topic with ease and precision using this Vehicle Management System Dashboard Representing Maintenance Status Template PDF This layout presents information on Fuel Costs, Total Cost, Service Reminder, Recent Comments. It is also available for immediate download and adjustment. So, changes can be made in the color, design, graphics or any other component to create a unique layout.
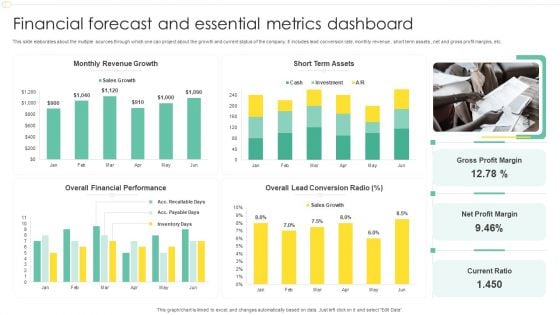
Financial Forecast And Essential Metrics Dashboard Ppt File Show PDF
This slide elaborates about the multiple sources through which one can project about the growth and current status of the company. It includes lead conversion rate, monthly revenue , short term assets , net and gross profit margins, etc. Pitch your topic with ease and precision using this Financial Forecast And Essential Metrics Dashboard Ppt File Show PDF. This layout presents information on Monthly Revenue Growth, Short Term Assets, Overall Financial Performance, Net Profit Margin. It is also available for immediate download and adjustment. So, changes can be made in the color, design, graphics or any other component to create a unique layout.
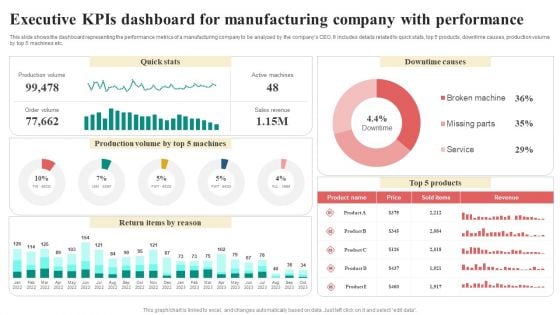
Executive Kpis Dashboard For Manufacturing Company With Performance Infographics PDF
This slide shows the dashboard representing the performance metrics of a manufacturing company to be analyzed by the companys CEO. It includes details related to quick stats, top 5 products, downtime causes, production volume by top 5 machines etc. Showcasing this set of slides titled Executive Kpis Dashboard For Manufacturing Company With Performance Infographics PDF. The topics addressed in these templates are Return Items By Reason, Quick Stats, Downtime Causes, Revenue. All the content presented in this PPT design is completely editable. Download it and make adjustments in color, background, font etc. as per your unique business setting.
Customer Attrition In A Bpo - Dashboard Icons PDF
Deliver an awe-inspiring pitch with this creative customer attrition in a bpo - dashboard icons pdf. bundle. Topics like web chart performance, telecom churn overview metrics, customer care call performance, telecom churn overview metrics, monthly revenue lost can be discussed with this completely editable template. It is available for immediate download depending on the needs and requirements of the user.
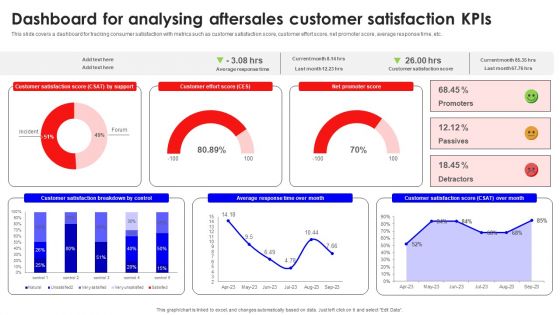
Dashboard For Analysing Aftersales Customer Satisfaction Kpis Mockup PDF
This slide covers a dashboard for tracking consumer satisfaction with metrics such as customer satisfaction score, customer effort score, net promoter score, average response time, etc. Are you searching for a Dashboard For Analysing Aftersales Customer Satisfaction Kpis Mockup PDF that is uncluttered, straightforward, and original Its easy to edit, and you can change the colors to suit your personal or business branding. For a presentation that expresses how much effort you have put in, this template is ideal With all of its features, including tables, diagrams, statistics, and lists, its perfect for a business plan presentation. Make your ideas more appealing with these professional slides. Download Dashboard For Analysing Aftersales Customer Satisfaction Kpis Mockup PDF from Slidegeeks today.
Multi Cloud Infrastructure Management Cloud Performance Tracking Dashboard Diagrams PDF
This slide covers the Key performance indicators for tracking performance of the cloud such as violations break down, sources, rules and severity. From laying roadmaps to briefing everything in detail, our templates are perfect for you. You can set the stage with your presentation slides. All you have to do is download these easy-to-edit and customizable templates. Multi Cloud Infrastructure Management Cloud Performance Tracking Dashboard Diagrams PDF will help you deliver an outstanding performance that everyone would remember and praise you for. Do download this presentation today.
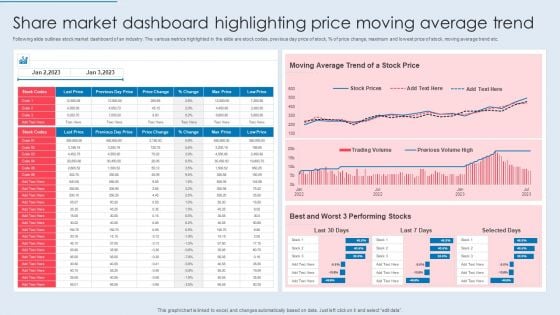
Share Market Dashboard Highlighting Price Moving Average Trend Themes PDF
Following slide outlines stock market dashboard of an industry. The various metrics highlighted in the slide are stock codes, previous day price of stock, percent of price change, maximum and lowest price of stock, moving average trend etc. Pitch your topic with ease and precision using this Share Market Dashboard Highlighting Price Moving Average Trend Themes PDF. This layout presents information on Moving Average, Stock Price, Performing Stocks. It is also available for immediate download and adjustment. So, changes can be made in the color, design, graphics or any other component to create a unique layout.
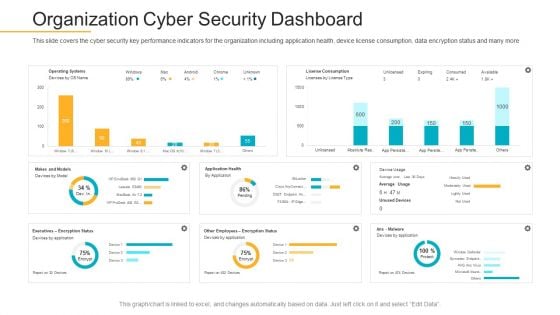
Data Breach Prevention Recognition Organization Cyber Security Dashboard Demonstration PDF
This slide covers the cyber security key performance indicators for the organization including application health, device license consumption, data encryption status and many more. Deliver and pitch your topic in the best possible manner with this data breach prevention recognition organization cyber security dashboard demonstration pdf. Use them to share invaluable insights on cyber security, key performance, organization and impress your audience. This template can be altered and modified as per your expectations. So, grab it now.
Cloud Computing Scalability Cloud Performance Tracking Dashboard Clipart PDF
This slide covers the Key performance indicators for tracking performance of the cloud such as violations break down, sources, rules and severity Present like a pro with Cloud Computing Scalability Cloud Performance Tracking Dashboard Clipart PDF Create beautiful presentations together with your team, using our easy-to-use presentation slides. Share your ideas in real-time and make changes on the fly by downloading our templates. So whether youre in the office, on the go, or in a remote location, you can stay in sync with your team and present your ideas with confidence. With Slidegeeks presentation got a whole lot easier. Grab these presentations today.
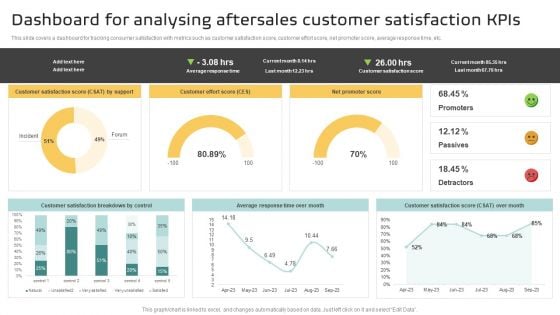
Dashboard For Analysing Aftersales Customer Satisfaction Kpis Information PDF
This slide covers a dashboard for tracking consumer satisfaction with metrics such as customer satisfaction score, customer effort score, net promoter score, average response time, etc. Find a pre designed and impeccable Dashboard For Analysing Aftersales Customer Satisfaction Kpis Information PDF. The templates can ace your presentation without additional effort. You can download these easy to edit presentation templates to make your presentation stand out from others. So, what are you waiting for Download the template from Slidegeeks today and give a unique touch to your presentation.
SMS Marketing Automated Campaigns Performance Tracking Dashboard Formats PDF
This slide represents the key metrics dashboard to track, monitor and analyze the performance of SMS marketing automated campaign. It includes details related to KPIs such as new subscribers, responses received, total earned and top live automations etc. Are you searching for a SMS Marketing Automated Campaigns Performance Tracking Dashboard Formats PDF that is uncluttered, straightforward, and original. Its easy to edit, and you can change the colors to suit your personal or business branding. For a presentation that expresses how much effort youve put in, this template is ideal. With all of its features, including tables, diagrams, statistics, and lists, its perfect for a business plan presentation. Make your ideas more appealing with these professional slides. Download SMS Marketing Automated Campaigns Performance Tracking Dashboard Formats PDF from Slidegeeks today.
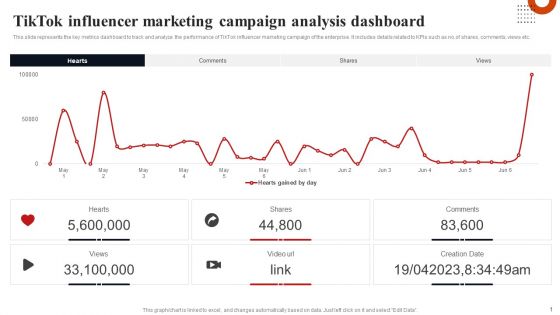
Tiktok Influencer Marketing Campaign Analysis Dashboard Formats PDF
This slide represents the key metrics dashboard to track and analyze the performance of TikTok influencer marketing campaign of the enterprise. It includes details related to KPIs such as no.of shares, comments, views etc. Formulating a presentation can take up a lot of effort and time, so the content and message should always be the primary focus. The visuals of the PowerPoint can enhance the presenters message, so our Tiktok Influencer Marketing Campaign Analysis Dashboard Formats PDF was created to help save time. Instead of worrying about the design, the presenter can concentrate on the message while our designers work on creating the ideal templates for whatever situation is needed. Slidegeeks has experts for everything from amazing designs to valuable content, we have put everything into Tiktok Influencer Marketing Campaign Analysis Dashboard Formats PDF.
SMS Marketing Automated Campaigns Performance Tracking Dashboard Professional PDF
This slide represents the key metrics dashboard to track, monitor and analyze the performance of SMS marketing automated campaign. It includes details related to KPIs such as new subscribers, responses received, total earned and top live automations etc. Get a simple yet stunning designed SMS Marketing Automated Campaigns Performance Tracking Dashboard Professional PDF. It is the best one to establish the tone in your meetings. It is an excellent way to make your presentations highly effective. So, download this PPT today from Slidegeeks and see the positive impacts. Our easy to edit SMS Marketing Automated Campaigns Performance Tracking Dashboard Professional PDF can be your go to option for all upcoming conferences and meetings. So, what are you waiting for Grab this template today.
Instagram Influencer Marketing Campaign Dashboard Ppt Icon Slide PDF
This slide represents key metrics dashboard to track and measure progress of Instagram influencer marketing campaign. It includes details related to KPIs such as impressions, likes, engagement rates etc. Explore a selection of the finest Instagram Influencer Marketing Campaign Dashboard Ppt Icon Slide PDF here. With a plethora of professionally designed and pre made slide templates, you can quickly and easily find the right one for your upcoming presentation. You can use our Instagram Influencer Marketing Campaign Dashboard Ppt Icon Slide PDF to effectively convey your message to a wider audience. Slidegeeks has done a lot of research before preparing these presentation templates. The content can be personalized and the slides are highly editable. Grab templates today from Slidegeeks.

Instagram Influencer Marketing Campaign Dashboard Ppt Infographic Template Topics PDF
This slide represents key metrics dashboard to track and measure progress of Instagram influencer marketing campaign. It includes details related to KPIs such as impressions, likes, engagement rates etc. Explore a selection of the finest Instagram Influencer Marketing Campaign Dashboard Ppt Infographic Template Topics PDF here. With a plethora of professionally designed and pre made slide templates, you can quickly and easily find the right one for your upcoming presentation. You can use our Instagram Influencer Marketing Campaign Dashboard Ppt Infographic Template Topics PDF to effectively convey your message to a wider audience. Slidegeeks has done a lot of research before preparing these presentation templates. The content can be personalized and the slides are highly editable. Grab templates today from Slidegeeks.
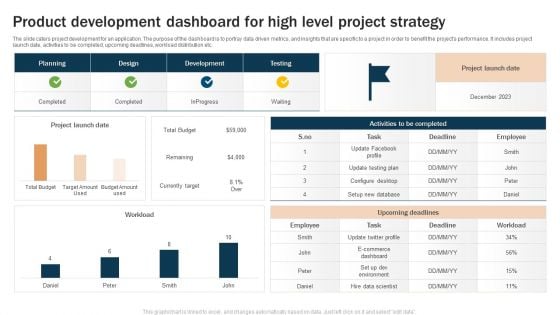
Product Development Dashboard For High Level Project Strategy Microsoft PDF
The slide caters project development for an application. The purpose of the dashboard is to portray data driven metrics, and insights that are specific to a project in order to benefit the projects performance. It includes project launch date, activities to be completed, upcoming deadlines, workload distribution etc. Showcasing this set of slides titled Product Development Dashboard For High Level Project Strategy Microsoft PDF. The topics addressed in these templates are Upcoming Deadlines, Project Launch, Upcoming Deadlines. All the content presented in this PPT design is completely editable. Download it and make adjustments in color, background, font etc. as per your unique business setting.
Monthly Sales Performance Tracking And Monitoring Dashboard Diagrams PDF
This slide showcases a dashboard presenting various metrics to measure and analyze sales performance for revenue growth. It includes key components such as number of sales, revenue, profit, cost, sales revenue, sales increment, cost analysis and cross sell. Make sure to capture your audiences attention in your business displays with our gratis customizable Monthly Sales Performance Tracking And Monitoring Dashboard Diagrams PDF. These are great for business strategies, office conferences, capital raising or task suggestions. If you desire to acquire more customers for your tech business and ensure they stay satisfied, create your own sales presentation with these plain slides.
Monthly Sales Performance Tracking And Monitoring Dashboard Designs PDF
This slide showcases a dashboard presenting various metrics to measure and analyze sales performance for revenue growth. It includes key components such as number of sales, revenue, profit, cost, sales revenue, sales increment, cost analysis and cross sell. Make sure to capture your audiences attention in your business displays with our gratis customizable Monthly Sales Performance Tracking And Monitoring Dashboard Designs PDF. These are great for business strategies, office conferences, capital raising or task suggestions. If you desire to acquire more customers for your tech business and ensure they stay satisfied, create your own sales presentation with these plain slides.
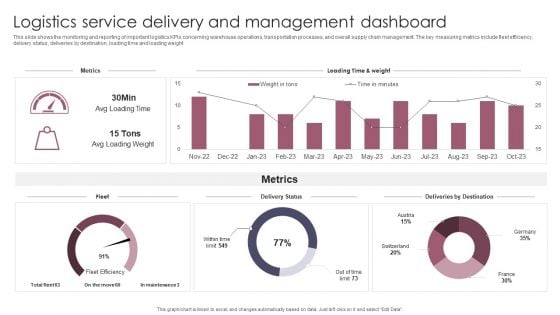
Logistics Service Delivery And Management Dashboard Introduction PDF
This slide shows the monitoring and reporting of important logistics KPIs concerning warehouse operations, transportation processes, and overall supply chain management. The key measuring metrics include fleet efficiency, delivery status, deliveries by destination, loading time and loading weight. Showcasing this set of slides titled Logistics Service Delivery And Management Dashboard Introduction PDF. The topics addressed in these templates are Logistics Service Delivery, Management Dashboard. All the content presented in this PPT design is completely editable. Download it and make adjustments in color, background, font etc. as per your unique business setting.
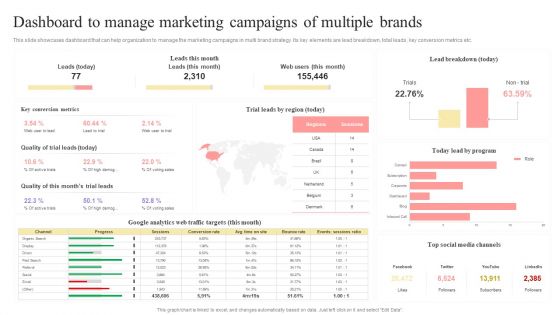
Dashboard To Manage Marketing Campaigns Of Multiple Brands Structure PDF
This slide showcases dashboard that can help organization to manage the marketing campaigns in multi brand strategy. Its key elements are lead breakdown, total leads, key conversion metrics etc.If you are looking for a format to display your unique thoughts, then the professionally designed Dashboard To Manage Marketing Campaigns Of Multiple Brands Structure PDF is the one for you. You can use it as a Google Slides template or a PowerPoint template. Incorporate impressive visuals, symbols, images, and other charts. Modify or reorganize the text boxes as you desire. Experiment with shade schemes and font pairings. Alter, share or cooperate with other people on your work. Download Dashboard To Manage Marketing Campaigns Of Multiple Brands Structure PDF and find out how to give a successful presentation. Present a perfect display to your team and make your presentation unforgettable.
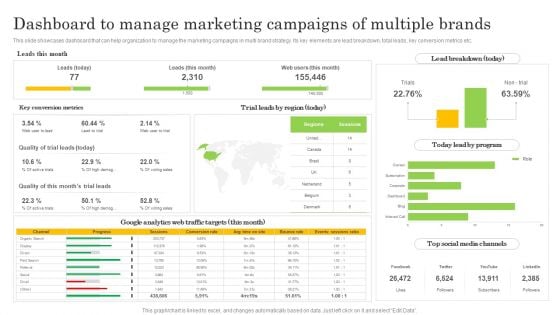
Dashboard To Manage Marketing Campaigns Of Multiple Brands Diagrams PDF
This slide showcases dashboard that can help organization to manage the marketing campaigns in multi brand strategy. Its key elements are lead breakdown, total leads, key conversion metrics etc. Here you can discover an assortment of the finest PowerPoint and Google Slides templates. With these templates, you can create presentations for a variety of purposes while simultaneously providing your audience with an eye catching visual experience. Download Dashboard To Manage Marketing Campaigns Of Multiple Brands Diagrams PDF to deliver an impeccable presentation. These templates will make your job of preparing presentations much quicker, yet still, maintain a high level of quality. Slidegeeks has experienced researchers who prepare these templates and write high quality content for you. Later on, you can personalize the content by editing the Dashboard To Manage Marketing Campaigns Of Multiple Brands Diagrams PDF.


 Continue with Email

 Home
Home


