Kpi Dashboard
Executive Dashboards For Tracking Key Performance Icons PDF
This slide represents the dashboard for the CEO to track the companys performance. It includes key performance indicators such as no. of deals, open deals, revenue, expected revenue and win percentage. Showcasing this set of slides titled Executive Dashboards For Tracking Key Performance Icons PDF. The topics addressed in these templates are Pen Deals, Revenue, Expected Revenue. All the content presented in this PPT design is completely editable. Download it and make adjustments in color, background, font etc. as per your unique business setting.
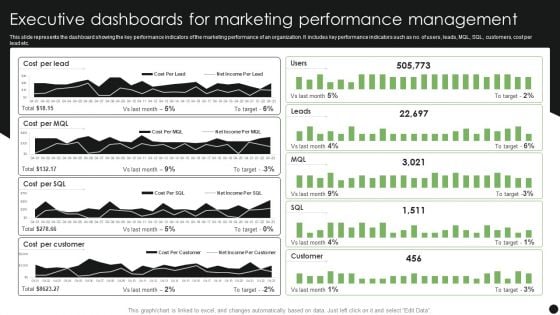
Executive Dashboards For Marketing Performance Management Slides PDF
This slide represents the dashboard showing the key performance indicators of the marketing performance of an organization. It includes key performance indicators such as no. of users, leads, MQL, SQL, customers, cost per lead etc. Pitch your topic with ease and precision using this Executive Dashboards For Marketing Performance Management Slides PDF. This layout presents information on Cost Per Lead, Cost Per Customer. It is also available for immediate download and adjustment. So, changes can be made in the color, design, graphics or any other component to create a unique layout.
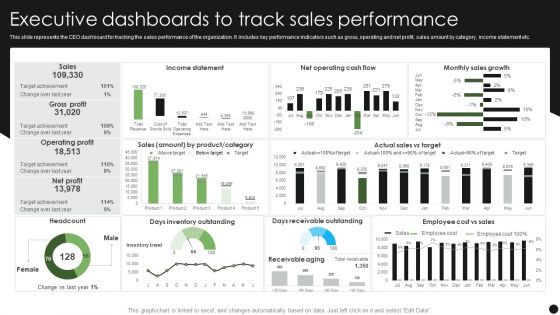
Executive Dashboards To Track Sales Performance Guidelines PDF
This slide represents the CEO dashboard for tracking the sales performance of the organization. It includes key performance indicators such as gross, operating and net profit, sales amount by category, income statement etc. Pitch your topic with ease and precision using this Executive Dashboards To Track Sales Performance Guidelines PDF. This layout presents information on Income Statement, Monthly Sales Growth, Days Receivable Outstanding. It is also available for immediate download and adjustment. So, changes can be made in the color, design, graphics or any other component to create a unique layout.
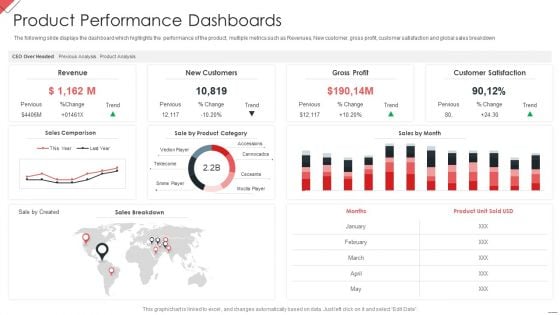
New Commodity Market Viability Review Product Performance Dashboards Guidelines PDF
The following slide displays the dashboard which highlights the performance of the product, multiple metrics such as Revenues, New customer, gross profit, customer satisfaction and global sales breakdown Deliver and pitch your topic in the best possible manner with this New Commodity Market Viability Review Product Performance Dashboards Guidelines PDF Use them to share invaluable insights on Gross Profit, Customer Satisfaction, Product Category and impress your audience. This template can be altered and modified as per your expectations. So, grab it now.
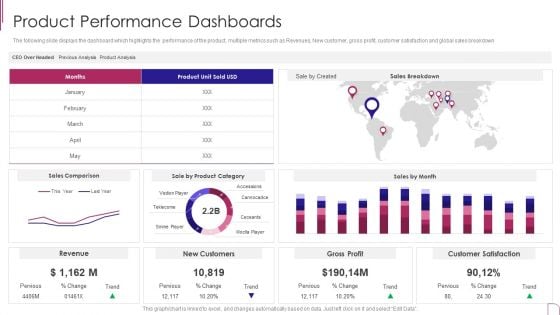
Yearly Product Performance Assessment Repor Product Performance Dashboards Designs PDF
The following slide displays the dashboard which highlights the performance of the product, multiple metrics such as Revenues, New customer, gross profit, customer satisfaction and global sales breakdown.Deliver and pitch your topic in the best possible manner with this Yearly Product Performance Assessment Repor Product Performance Dashboards Designs PDF Use them to share invaluable insights on Gross Profit, Customer Satisfaction, Sales Comparison and impress your audience. This template can be altered and modified as per your expectations. So, grab it now.
Executive Dashboards For Tracking Financial Health Of Enterprise Diagrams PDF
This slide represents the CEO dashboard to track the financial health of an organization. It includes key performance indicators such as revenue, expenses, activity ratio, gross profit margin, EBIT etc. Pitch your topic with ease and precision using this Executive Dashboards For Tracking Financial Health Of Enterprise Diagrams PDF. This layout presents information on Revenue, Expense, Activity Ratio. It is also available for immediate download and adjustment. So, changes can be made in the color, design, graphics or any other component to create a unique layout.
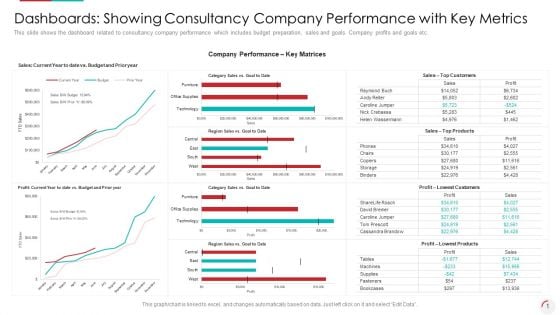
Dashboards Showing Consultancy Company Performance With Key Metrics Graphics PDF
Deliver an awe-inspiring pitch with this creative dashboards showing consultancy company performance with key metrics graphics pdf. bundle. Topics like dashboards showing consultancy company performance with key metrics can be discussed with this completely editable template. It is available for immediate download depending on the needs and requirements of the user.
Dashboards Key Metrics Of Performance Assessment Icons PDF
Deliver an awe-inspiring pitch with this creative dashboards key metrics of performance assessment icons pdf bundle. Topics like availability, performance, maintenance, delivery adherence, customer complaints can be discussed with this completely editable template. It is available for immediate download depending on the needs and requirements of the user.
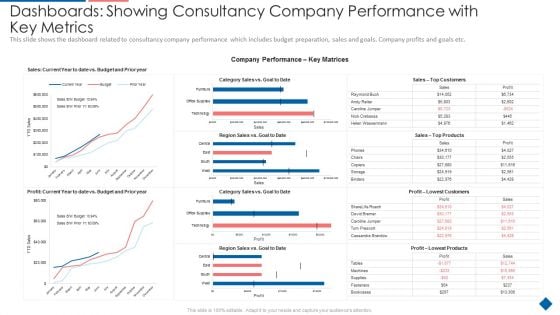
Dashboards Showing Consultancy Company Performance With Key Metrics Mockup PDF
Deliver and pitch your topic in the best possible manner with this dashboards showing consultancy company performance with key metrics mockup pdf. Use them to share invaluable insights on customers, top products, lowest customers, and impress your audience. This template can be altered and modified as per your expectations. So, grab it now.
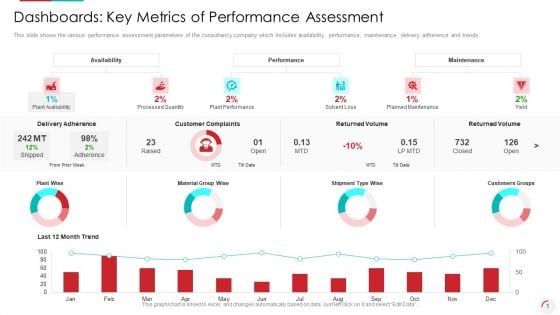
Dashboards Key Metrics Of Performance Assessment Summary PDF
Deliver and pitch your topic in the best possible manner with this dashboards key metrics of performance assessment summary pdf. Use them to share invaluable insights on delivery adherence, customer complaints, returned volume and impress your audience. This template can be altered and modified as per your expectations. So, grab it now.
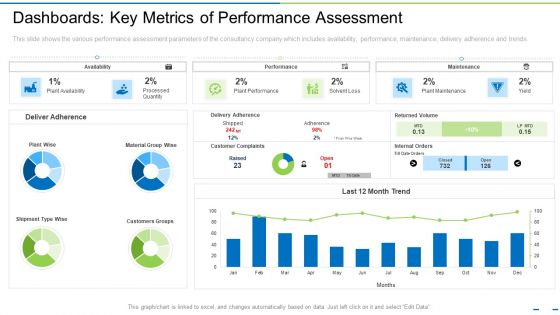
Dashboards Key Metrics Of Performance Assessment Ppt Model Skills PDF
This slide shows the various performance assessment parameters of the consultancy company which includes availability, performance, maintenance, delivery adherence and trends. Deliver and pitch your topic in the best possible manner with this dashboards key metrics of performance assessment ppt model skills pdf. Use them to share invaluable insights on customers groups, performance, customer complaints and impress your audience. This template can be altered and modified as per your expectations. So, grab it now.

Project Capabilities Kpis And Dashboards Ppt Gallery Slide Download PDF
Presenting this set of slides with name project capabilities kpis and dashboards ppt gallery slide download pdf. This is a two stage process. The stages in this process are metrics, dashboard. This is a completely editable PowerPoint presentation and is available for immediate download. Download now and impress your audience.
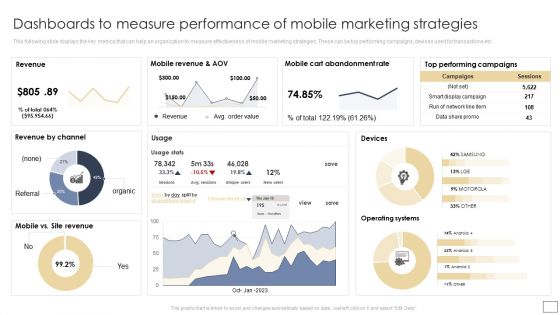
Dashboards To Measure Performance Of Mobile Marketing Strategies Graphics PDF
This following slide displays the key metrics that can help an organization to measure effectiveness of mobile marketing strategies. These can be top performing campaigns, devises used for transactions etc. There are so many reasons you need a Dashboards To Measure Performance Of Mobile Marketing Strategies Graphics PDF. The first reason is you can not spend time making everything from scratch, Thus, Slidegeeks has made presentation templates for you too. You can easily download these templates from our website easily.
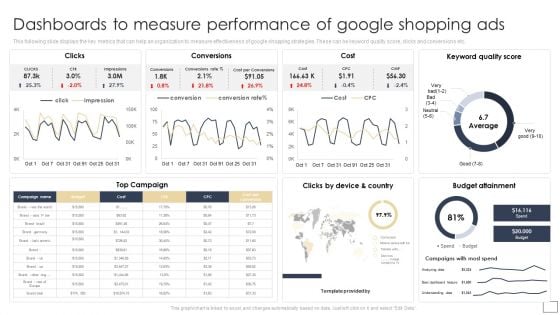
Dashboards To Measure Performance Of Google Shopping Ads Summary PDF
This following slide displays the key metrics that can help an organization to measure effectiveness of google shopping strategies. These can be keyword quality score, clicks and conversions etc.Want to ace your presentation in front of a live audience Our Dashboards To Measure Performance Of Google Shopping Ads Summary PDF can help you do that by engaging all the users towards you. Slidegeeks experts have put their efforts and expertise into creating these impeccable powerpoint presentations so that you can communicate your ideas clearly. Moreover, all the templates are customizable, and easy-to-edit and downloadable. Use these for both personal and commercial use.
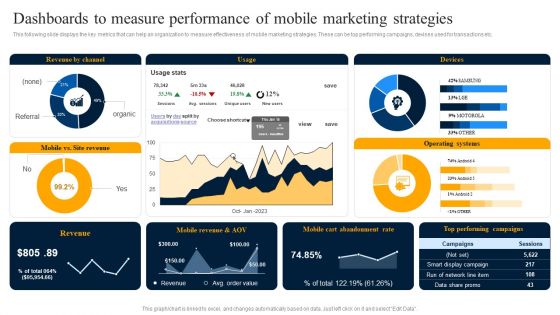
Dashboards To Measure Performance Of Mobile Marketing Strategies Rules PDF
This following slide displays the key metrics that can help an organization to measure effectiveness of mobile marketing strategies. These can be top performing campaigns, devises used for transactions etc. If your project calls for a presentation, then Slidegeeks is your go to partner because we have professionally designed, easy to edit templates that are perfect for any presentation. After downloading, you can easily edit Dashboards To Measure Performance Of Mobile Marketing Strategies Rules PDF and make the changes accordingly. You can rearrange slides or fill them with different images. Check out all the handy templates.
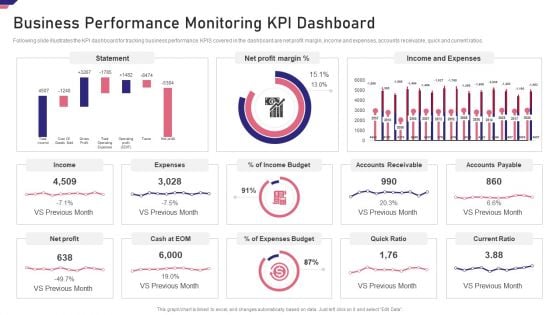
Mergers Acquisition Playbook Mergers Acquisition Playbook Business Performance Guidelines PDF
Following slide illustrates the KPI dashboard for tracking business performance. KPIS covered in the dashboard are net profit margin, income and expenses, accounts receivable, quick and current ratios.Deliver an awe inspiring pitch with this creative Mergers Acquisition Playbook Mergers Acquisition Playbook Business Performance Guidelines PDF bundle. Topics like Business Performance Monitoring KPI Dashboard can be discussed with this completely editable template. It is available for immediate download depending on the needs and requirements of the user.
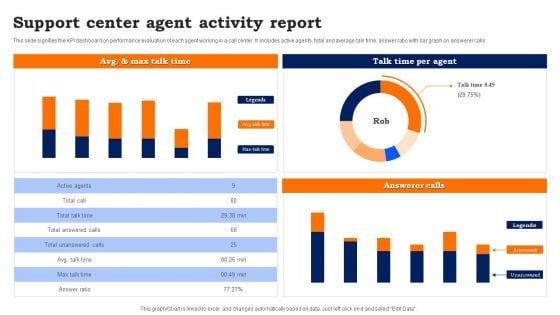
Support Center Agent Activity Report Guidelines PDF
This slide signifies the KPI dashboard on performance evaluation of each agent working in a call center. It includes active agents, total and average talk time, answer ratio with bar graph on answerer calls.
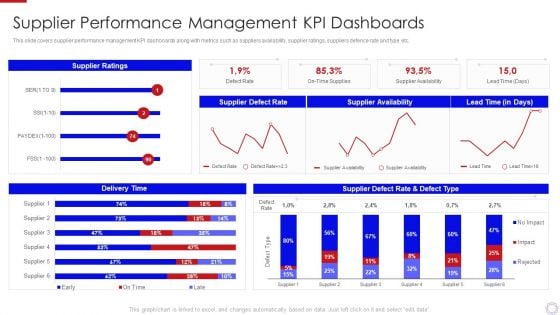
Major Strategies To Nurture Effective Vendor Association Supplier Performance Management Information PDF
This slide covers supplier performance management KPI dashboards along with metrics such as suppliers availability, supplier ratings, suppliers defence rate and type etc. Deliver and pitch your topic in the best possible manner with this major strategies to nurture effective vendor association supplier performance management information pdf. Use them to share invaluable insights on supplier performance management kpi dashboards and impress your audience. This template can be altered and modified as per your expectations. So, grab it now.
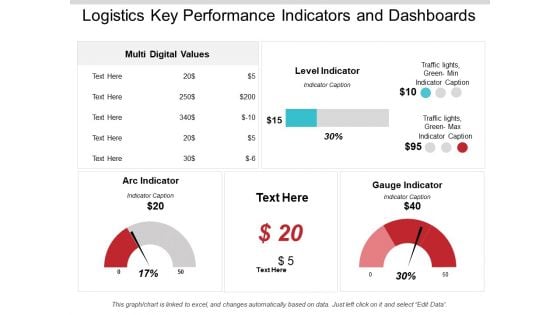
Logistics Key Performance Indicators And Dashboards Ppt PowerPoint Presentation Infographics Background Image
This is a logistics key performance indicators and dashboards ppt powerpoint presentation infographics background image. This is a three stage process. The stages in this process are logistics performance, logistics dashboard, logistics kpis.
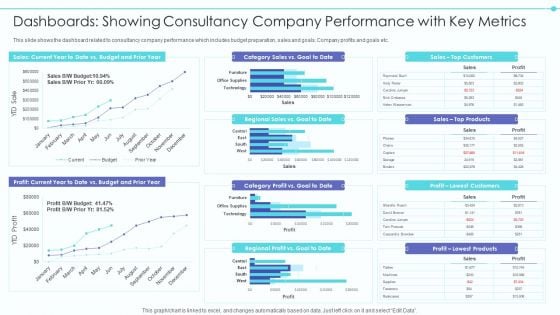
Business Model Of New Consultancy Firm Dashboards Showing Consultancy Company Portrait PDF
This slide shows the dashboard related to consultancy company performance which includes budget preparation, sales and goals. Company profits and goals etc. Deliver and pitch your topic in the best possible manner with this business model of new consultancy firm dashboards showing consultancy company portrait pdf. Use them to share invaluable insights on dashboards showing consultancy company performance with key metrics and impress your audience. This template can be altered and modified as per your expectations. So, grab it now.
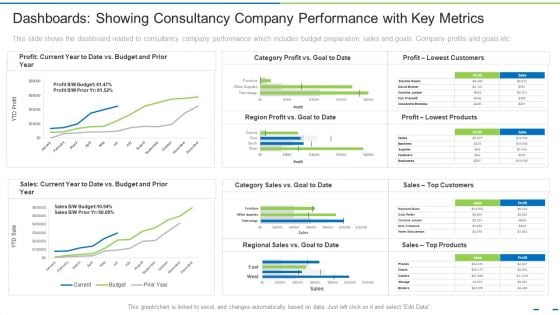
Dashboards Showing Consultancy Company Performance With Key Metrics Ppt Ideas Smartart PDF
This slide shows the dashboard related to consultancy company performance which includes budget preparation, sales and goals. Company profits and goals etc. Deliver an awe-inspiring pitch with this creative dashboards showing consultancy company performance with key metrics ppt ideas smartart pdf bundle. Topics like budget, products, customers can be discussed with this completely editable template. It is available for immediate download depending on the needs and requirements of the user.
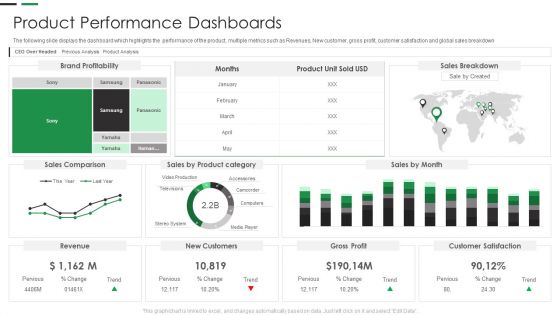
Evaluating New Commodity Impact On Market Product Performance Dashboards Template PDF
The following slide displays the dashboard which highlights the performance of the product, multiple metrics such as Revenues, New customer, gross profit, customer satisfaction and global sales breakdown Deliver and pitch your topic in the best possible manner with this Evaluating New Commodity Impact On Market Product Performance Dashboards Template PDF Use them to share invaluable insights on Brand Profitability, Customer Satisfaction, Gross Profit and impress your audience. This template can be altered and modified as per your expectations. So, grab it now.
Performance Analysis Of New Product Development Product Performance Dashboards Icons PDF
The following slide displays the dashboard which highlights the performance of the product, multiple metrics such as Revenues, New customer, gross profit, customer satisfaction and global sales breakdown. Deliver and pitch your topic in the best possible manner with this performance analysis of new product development product performance dashboards icons pdf. Use them to share invaluable insights on revenue, sales comparison, customer satisfaction, gross profit, new customers, sale by product category and impress your audience. This template can be altered and modified as per your expectations. So, grab it now.
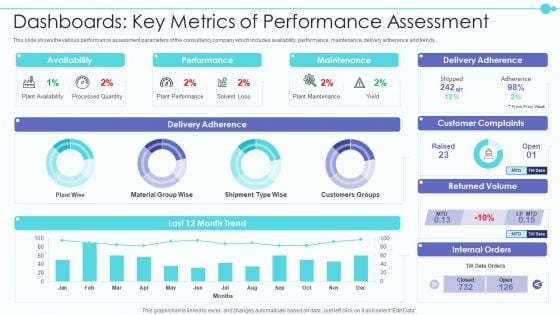
Business Model Of New Consultancy Firm Dashboards Key Metrics Of Performance Assessment Designs PDF
This slide shows the various performance assessment parameters of the consultancy company which includes availability, performance, maintenance, delivery adherence and trends. Deliver an awe inspiring pitch with this creative business model of new consultancy firm dashboards key metrics of performance assessment designs pdf bundle. Topics like availability, performance, maintenance, delivery adherence can be discussed with this completely editable template. It is available for immediate download depending on the needs and requirements of the user.
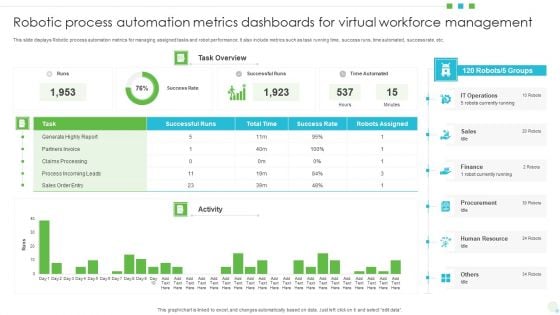
Robotic Process Automation Metrics Dashboards For Virtual Workforce Management Background PDF
This slide displays Robotic process automation metrics for managing assigned tasks and robot performance. It also include metrics such as task running time, success runs, time automated, success rate, etc. Showcasing this set of slides titled Robotic Process Automation Metrics Dashboards For Virtual Workforce Management Background PDF. The topics addressed in these templates are Finance, Sales, Human Resource. All the content presented in this PPT design is completely editable. Download it and make adjustments in color, background, font etc. as per your unique business setting.
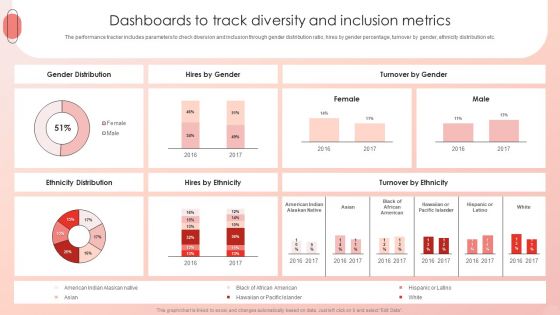
Improving HRM Process Dashboards To Track Diversity And Inclusion Metrics Background PDF
The performance tracker includes parameters to check diversion and inclusion through gender distribution ratio, hires by gender percentage, turnover by gender, ethnicity distribution etc. Are you in need of a template that can accommodate all of your creative concepts This one is crafted professionally and can be altered to fit any style. Use it with Google Slides or PowerPoint. Include striking photographs, symbols, depictions, and other visuals. Fill, move around, or remove text boxes as desired. Test out color palettes and font mixtures. Edit and save your work, or work with colleagues. Download Improving HRM Process Dashboards To Track Diversity And Inclusion Metrics Background PDF and observe how to make your presentation outstanding. Give an impeccable presentation to your group and make your presentation unforgettable.
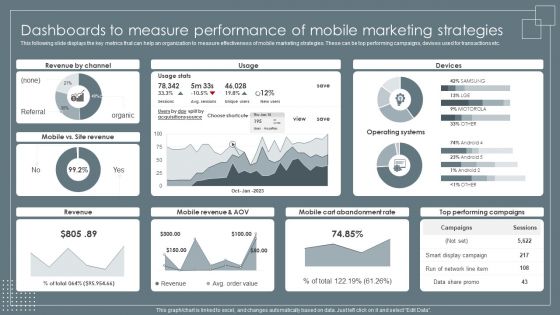
Dashboards To Measure Performance Of Mobile Retail Business Growth Marketing Techniques Professional PDF
This following slide displays the key metrics that can help an organization to measure effectiveness of mobile marketing strategies. These can be top performing campaigns, devises used for transactions etc. Crafting an eye catching presentation has never been more straightforward. Let your presentation shine with this tasteful yet straightforward Dashboards To Measure Performance Of Mobile Retail Business Growth Marketing Techniques Professional PDF template. It offers a minimalistic and classy look that is great for making a statement. The colors have been employed intelligently to add a bit of playfulness while still remaining professional. Construct the ideal Dashboards To Measure Performance Of Mobile Retail Business Growth Marketing Techniques Professional PDF that effortlessly grabs the attention of your audience. Begin now and be certain to wow your customers.
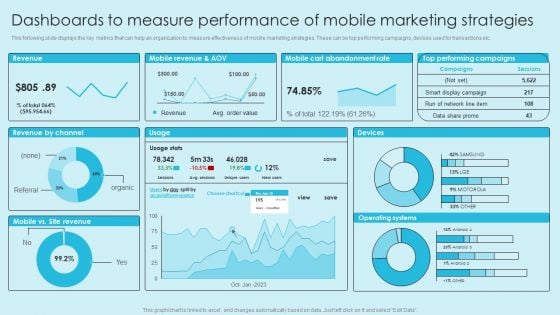
Online Marketing Techniques For Acquiring Clients Dashboards To Measure Performance Of Mobile Marketing Diagrams PDF
This following slide displays the key metrics that can help an organization to measure effectiveness of mobile marketing strategies. These can be top performing campaigns, devises used for transactions etc. Find a pre designed and impeccable Online Marketing Techniques For Acquiring Clients Dashboards To Measure Performance Of Mobile Marketing Diagrams PDF. The templates can ace your presentation without additional effort. You can download these easy to edit presentation templates to make your presentation stand out from others. So, what are you waiting for. Download the template from Slidegeeks today and give a unique touch to your presentation.

Dashboards To Measure Performance Of Google Retail Business Growth Marketing Techniques Background PDF
This following slide displays the key metrics that can help an organization to measure effectiveness of google shopping strategies. These can be keyword quality score, clicks and conversions etc. Are you in need of a template that can accommodate all of your creative concepts This one is crafted professionally and can be altered to fit any style. Use it with Google Slides or PowerPoint. Include striking photographs, symbols, depictions, and other visuals. Fill, move around, or remove text boxes as desired. Test out color palettes and font mixtures. Edit and save your work, or work with colleagues. Download Dashboards To Measure Performance Of Google Retail Business Growth Marketing Techniques Background PDF and observe how to make your presentation outstanding. Give an impeccable presentation to your group and make your presentation unforgettable.
Online Marketing Techniques For Acquiring Clients Dashboards To Measure Performance Of Google Icons PDF
This following slide displays the key metrics that can help an organization to measure effectiveness of google shopping strategies. These can be keyword quality score, clicks and conversions etc. Do you know about Slidesgeeks Online Marketing Techniques For Acquiring Clients Dashboards To Measure Performance Of Google Icons PDF. These are perfect for delivering any kind od presentation. Using it, create PowerPoint presentations that communicate your ideas and engage audiences. Save time and effort by using our pre designed presentation templates that are perfect for a wide range of topic. Our vast selection of designs covers a range of styles, from creative to business, and are all highly customizable and easy to edit. Download as a PowerPoint template or use them as Google Slides themes.

Customer Engagement Methods For Online Platforms Dashboards To Measure Performance Elements PDF
This following slide displays the key metrics that can help an organization to measure effectiveness of google shopping strategies. These can be keyword quality score, clicks and conversions etc. Slidegeeks is here to make your presentations a breeze with Customer Engagement Methods For Online Platforms Dashboards To Measure Performance Elements PDF With our easy to use and customizable templates, you can focus on delivering your ideas rather than worrying about formatting. With a variety of designs to choose from, youre sure to find one that suits your needs. And with animations and unique photos, illustrations, and fonts, you can make your presentation pop. So whether youre giving a sales pitch or presenting to the board, make sure to check out Slidegeeks first.
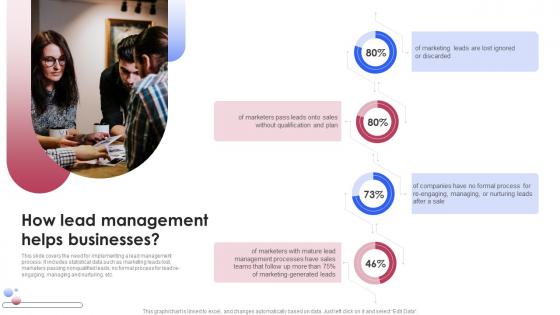
How Lead Management Helps Businesses Various Techniques For Managing Mockup PDF
This slide covers the KPI dashboard for tracking improved lead management system performance. It includes metrics such as visitors, social media followers, email subscribers, organic leads, etc. This slide covers the KPI dashboard for tracking improved lead management system performance. It includes metrics such as visitors, social media followers, email subscribers, organic leads, etc. Make sure to capture your audiences attention in your business displays with our gratis customizable How Lead Management Helps Businesses Various Techniques For Managing Mockup PDF. These are great for business strategies, office conferences, capital raising or task suggestions. If you desire to acquire more customers for your tech business and ensure they stay satisfied, create your own sales presentation with these plain slides. This slide covers the KPI dashboard for tracking improved lead management system performance. It includes metrics such as visitors, social media followers, email subscribers, organic leads, etc.
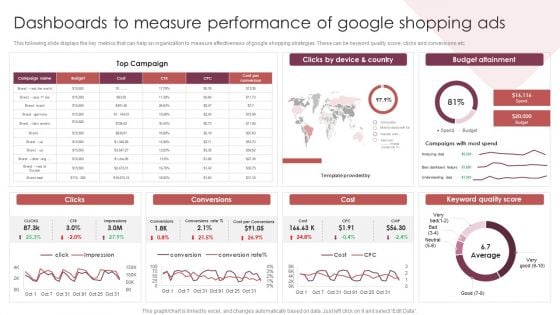
E Commerce Marketing Techniques To Boost Sales Dashboards To Measure Performance Of Google Shopping Ads Formats PDF
This following slide displays the key metrics that can help an organization to measure effectiveness of google shopping strategies. These can be keyword quality score, clicks and conversions etc. Whether you have daily or monthly meetings, a brilliant presentation is necessary. E Commerce Marketing Techniques To Boost Sales Dashboards To Measure Performance Of Google Shopping Ads Formats PDF can be your best option for delivering a presentation. Represent everything in detail using E Commerce Marketing Techniques To Boost Sales Dashboards To Measure Performance Of Google Shopping Ads Formats PDF and make yourself stand out in meetings. The template is versatile and follows a structure that will cater to your requirements. All the templates prepared by Slidegeeks are easy to download and edit. Our research experts have taken care of the corporate themes as well. So, give it a try and see the results.
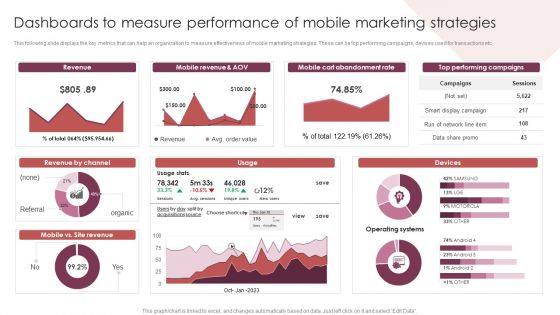
E Commerce Marketing Techniques To Boost Sales Dashboards To Measure Performance Of Mobile Marketing Strategies Elements PDF
This following slide displays the key metrics that can help an organization to measure effectiveness of mobile marketing strategies. These can be top performing campaigns, devises used for transactions etc. Find highly impressive E Commerce Marketing Techniques To Boost Sales Dashboards To Measure Performance Of Mobile Marketing Strategies Elements PDF on Slidegeeks to deliver a meaningful presentation. You can save an ample amount of time using these presentation templates. No need to worry to prepare everything from scratch because Slidegeeks experts have already done a huge research and work for you. You need to download E Commerce Marketing Techniques To Boost Sales Dashboards To Measure Performance Of Mobile Marketing Strategies Elements PDF for your upcoming presentation. All the presentation templates are 100 percent editable and you can change the color and personalize the content accordingly. Download now.
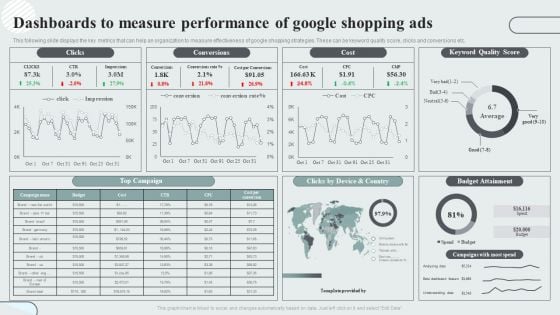
Techniques To Enhance Customer Engagement Via Digital Platforms Dashboards To Measure Performance Of Google Shopping Ads Structure PDF
This following slide displays the key metrics that can help an organization to measure effectiveness of google shopping strategies. These can be keyword quality score, clicks and conversions etc. Do you have an important presentation coming up. Are you looking for something that will make your presentation stand out from the rest. Look no further than Techniques To Enhance Customer Engagement Via Digital Platforms Dashboards To Measure Performance Of Google Shopping Ads Structure PDF. With our professional designs, you can trust that your presentation will pop and make delivering it a smooth process. And with Slidegeeks, you can trust that your presentation will be unique and memorable. So why wait. Grab Techniques To Enhance Customer Engagement Via Digital Platforms Dashboards To Measure Performance Of Google Shopping Ads Structure PDF today and make your presentation stand out from the rest.
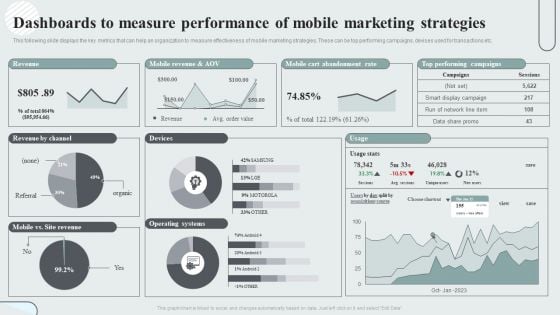
Techniques To Enhance Customer Engagement Via Digital Platforms Dashboards To Measure Performance Of Mobile Marketing Strategies Slides PDF
This following slide displays the key metrics that can help an organization to measure effectiveness of mobile marketing strategies. These can be top performing campaigns, devises used for transactions etc. Whether you have daily or monthly meetings, a brilliant presentation is necessary. Techniques To Enhance Customer Engagement Via Digital Platforms Dashboards To Measure Performance Of Mobile Marketing Strategies Slides PDF can be your best option for delivering a presentation. Represent everything in detail using Techniques To Enhance Customer Engagement Via Digital Platforms Dashboards To Measure Performance Of Mobile Marketing Strategies Slides PDF and make yourself stand out in meetings. The template is versatile and follows a structure that will cater to your requirements. All the templates prepared by Slidegeeks are easy to download and edit. Our research experts have taken care of the corporate themes as well. So, give it a try and see the results.
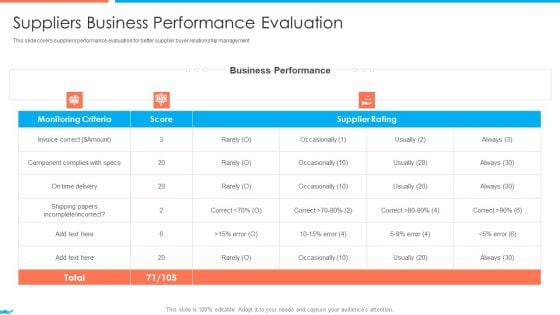
Supplier Association Management Techniques Suppliers Business Performance Evaluation Summary PDF
This slide covers suppliers performance evaluation for better supplier buyer relationship management. Deliver an awe inspiring pitch with this creative supplier association management techniques supplier performance management kpi dashboards guidelines pdf bundle. Topics like suppliers business performance evaluation can be discussed with this completely editable template. It is available for immediate download depending on the needs and requirements of the user.
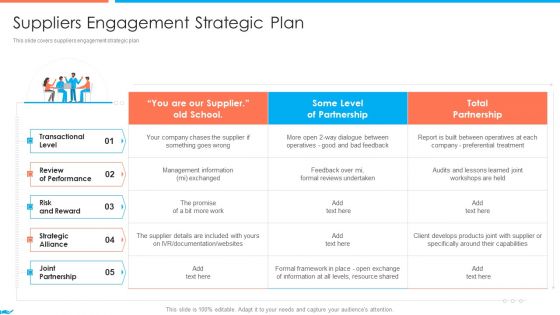
Supplier Association Management Techniques Suppliers Engagement Strategic Plan Sample PDF
This slide covers suppliers engagement strategic plan. Deliver and pitch your topic in the best possible manner with this supplier association management techniques supplier performance management kpi dashboards guidelines pdf. Use them to share invaluable insights on transactional level, review of performance, strategic alliance and impress your audience. This template can be altered and modified as per your expectations. So, grab it now.
Information Technology Service Integration Post Acquisition Merger Customer Service Measuring Icons PDF
This slide illustrates customer service dashboard covering informational stats about NPS score, growth rate, customer distribution, top customer locations, inbound leads and revenue by type. Deliver an awe inspiring pitch with this creative information technology service integration post acquisition merger customer service measuring icons pdf bundle. Topics like customer service measuring kpi dashboard can be discussed with this completely editable template. It is available for immediate download depending on the needs and requirements of the user.
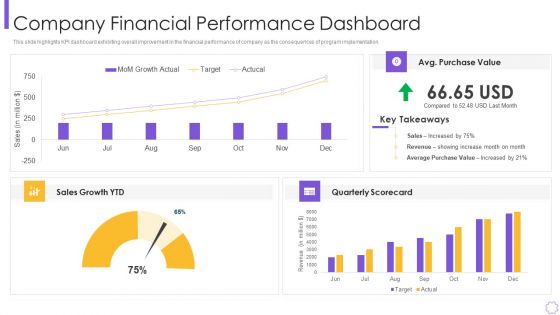
Organizational Program To Improve Team Productivity And Efficiency Company Financial Pictures PDF
This slide highlights KPI dashboard exhibiting overall improvement in the financial performance of company as the consequences of program implementation. Deliver an awe inspiring pitch with this creative organizational program to improve team productivity and efficiency company financial pictures pdf bundle. Topics like company financial performance dashboard can be discussed with this completely editable template. It is available for immediate download depending on the needs and requirements of the user.
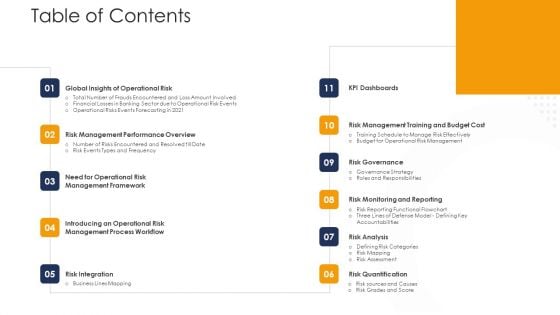
Strategies To Tackle Operational Risk In Banking Institutions Table Of Contents Portrait PDF
Deliver an awe inspiring pitch with this creative strategies to tackle operational risk in banking institutions table of contents portrait pdf bundle. Topics like risk governance, risk monitoring and reporting, risk analysis, risk quantification, kpi dashboards, risk integration can be discussed with this completely editable template. It is available for immediate download depending on the needs and requirements of the user.
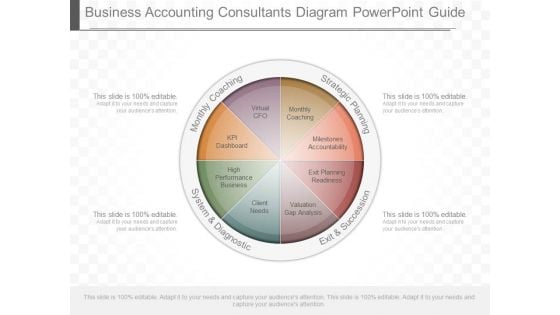
Business Accounting Consultants Diagram Powerpoint Guide
This is a business accounting consultants diagram powerpoint guide. This is a eight stage process. The stages in this process are monthly coaching, strategic planning, system and diagnostic, exit and succession, monthly coaching, milestones accountability, exit planning readiness, valuation gap analysis, client needs, high performance business, kpi dashboard, virtual cfo.
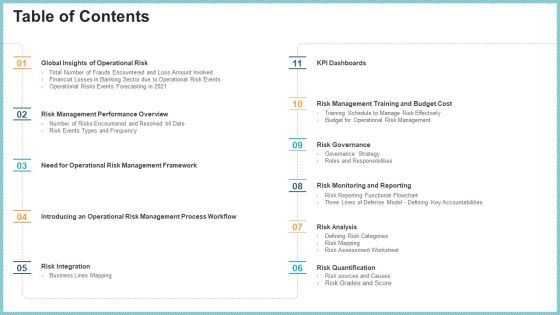
OP Risk Management Table Of Contents Elements PDF
Deliver an awe inspiring pitch with this creative op risk management table of contents elements pdf bundle. Topics like kpi dashboards, risk governance, risk analysis, risk integration, risk quantification can be discussed with this completely editable template. It is available for immediate download depending on the needs and requirements of the user.
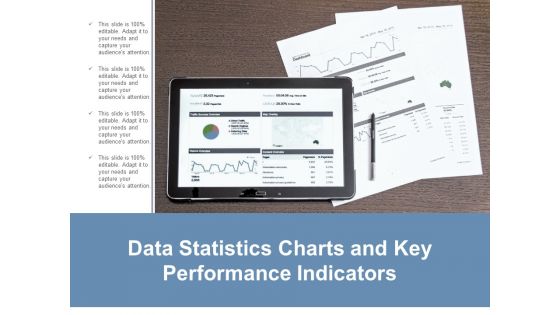
Data Statistics Charts And Key Performance Indicators Ppt Powerpoint Presentation Layouts Guide
This is a data statistics charts and key performance indicators ppt powerpoint presentation layouts guide. This is a four stage process. The stages in this process are business metrics, business kpi, business dashboard.
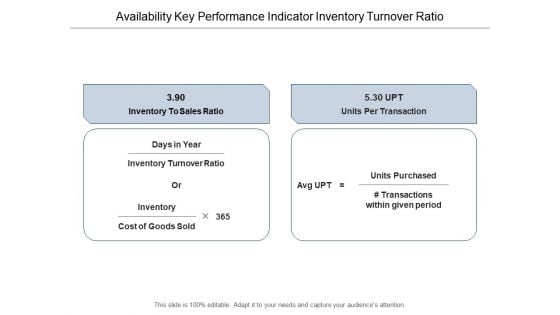
Availability Key Performance Indicator Inventory Turnover Ratio Ppt Powerpoint Presentation Layouts Graphics Download
This is a availability key performance indicator inventory turnover ratio ppt powerpoint presentation layouts graphics download. This is a two stage process. The stages in this process are availability kpi, availability dashboard, availability metrics.

Business Analysis Data Charts And Reports Ppt Powerpoint Presentation Ideas Portrait
This is a business analysis data charts and reports ppt powerpoint presentation ideas portrait. This is a three stage process. The stages in this process are business metrics, business kpi, business dashboard.
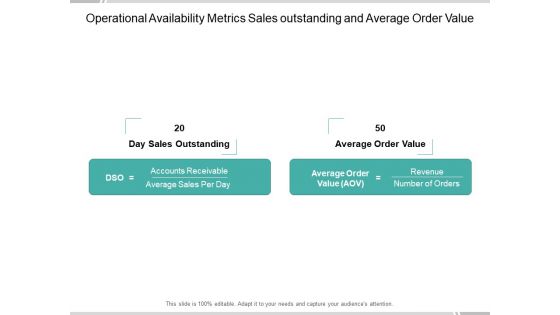
Operational Availability Metrics Sales Outstanding And Average Order Value Ppt Powerpoint Presentation Infographic Template Introduction
This is a operational availability metrics sales outstanding and average order value ppt powerpoint presentation infographic template introduction. This is a two stage process. The stages in this process are availability kpi, availability dashboard, availability metrics.
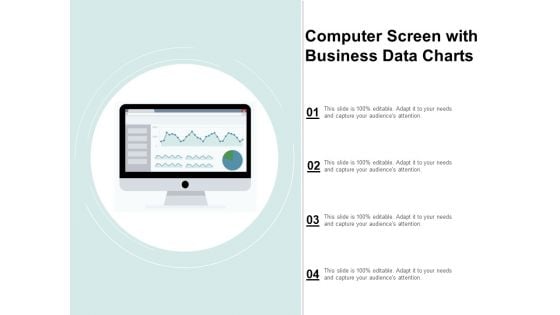
Computer Screen With Business Data Charts Ppt Powerpoint Presentation Show Vector
This is a computer screen with business data charts ppt powerpoint presentation show vector. This is a four stage process. The stages in this process are business metrics, business kpi, business dashboard.
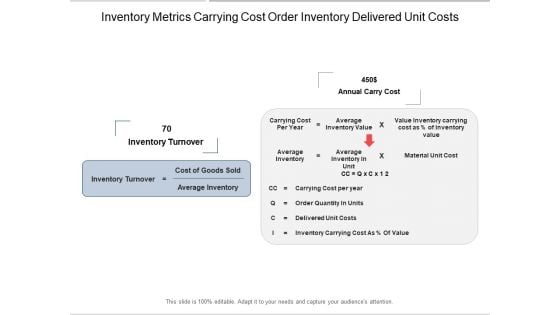
Inventory Metrics Carrying Cost Order Inventory Delivered Unit Costs Ppt Powerpoint Presentation Layouts Guidelines
This is a inventory metrics carrying cost order inventory delivered unit costs ppt powerpoint presentation layouts guidelines. This is a two stage process. The stages in this process are availability kpi, availability dashboard, availability metrics.

Calculator With Business Reports For Operational Efficiency Ppt Powerpoint Presentation Ideas Infographic Template
This is a calculator with business reports for operational efficiency ppt powerpoint presentation ideas infographic template. This is a four stage process. The stages in this process are business metrics, business kpi, business dashboard.
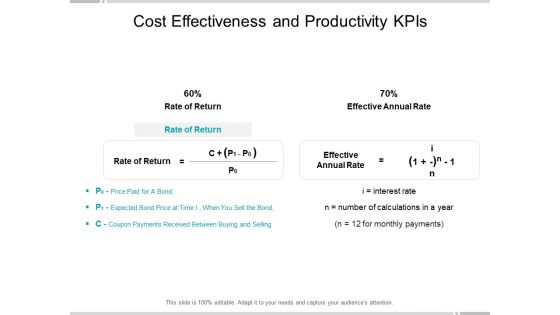
Cost Effectiveness And Productivity Kpis Ppt Powerpoint Presentation Portfolio Demonstration
This is a cost effectiveness and productivity kpis ppt powerpoint presentation portfolio demonstration. This is a two stage process. The stages in this process are availability kpi, availability dashboard, availability metrics.

Bar Chart With Magnifying Glass For Financial Analysis Ppt Powerpoint Presentation Infographics Designs Download
This is a bar chart with magnifying glass for financial analysis ppt powerpoint presentation infographics designs download. This is a three stage process. The stages in this process are business metrics, business kpi, business dashboard.
Business Strategic Performance Report Ppt Powerpoint Presentation Show Background Image
This is a business strategic performance report ppt powerpoint presentation show background image. This is a four stage process. The stages in this process are business metrics, business kpi, business dashboard.
Essentials Of Statistics For Business And Economics Ppt Powerpoint Presentation Pictures Styles
This is a essentials of statistics for business and economics ppt powerpoint presentation pictures styles. This is a three stage process. The stages in this process are business metrics, business kpi, business dashboard.
Track Business Performance And Profitability Ppt Powerpoint Presentation File Master Slide
This is a track business performance and profitability ppt powerpoint presentation file master slide. This is a four stage process. The stages in this process are business metrics, business kpi, business dashboard.
Financial Charts And Graphs For Statistical Analysis Ppt Powerpoint Presentation Show Layout
This is a financial charts and graphs for statistical analysis ppt powerpoint presentation show layout. This is a four stage process. The stages in this process are business metrics, business kpi, business dashboard.
Measure Performance And Set Targets Ppt Powerpoint Presentation Gallery Guidelines
This is a measure performance and set targets ppt powerpoint presentation gallery guidelines. This is a three stage process. The stages in this process are business metrics, business kpi, business dashboard.
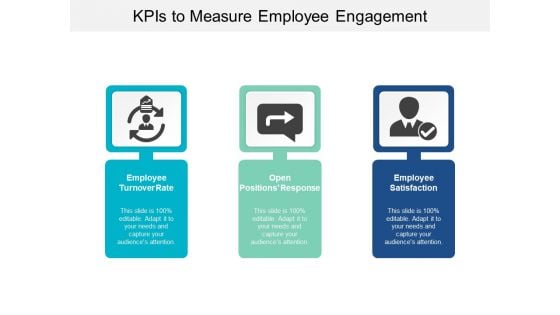
Kpis To Measure Employee Engagement Ppt Powerpoint Presentation Pictures Gridlines
This is a kpis to measure employee engagement ppt powerpoint presentation pictures gridlines. This is a three stage process. The stages in this process are dashboard, kpi, metrics.
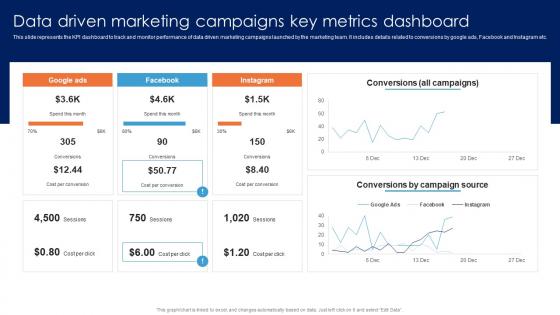
Data Driven Marketing Campaigns Key Metrics Guide For Data Driven Advertising Guidelines Pdf
This slide represents the KPI dashboard to track and monitor performance of data driven marketing campaigns launched by the marketing team. It includes details related to conversions by google ads, Facebook and Instagram etc.The Data Driven Marketing Campaigns Key Metrics Guide For Data Driven Advertising Guidelines Pdf is a compilation of the most recent design trends as a series of slides. It is suitable for any subject or industry presentation, containing attractive visuals and photo spots for businesses to clearly express their messages. This template contains a variety of slides for the user to input data, such as structures to contrast two elements, bullet points, and slides for written information. Slidegeeks is prepared to create an impression. This slide represents the KPI dashboard to track and monitor performance of data driven marketing campaigns launched by the marketing team. It includes details related to conversions by google ads, Facebook and Instagram etc.
Facebook Ad Campaign Performance Tracking Guide For Data Driven Advertising Pictures Pdf
This slide represents the KPI dashboard to effectively measure and monitor performance of Facebook marketing campaign conducted by the organization to enhance customer engagement. It includes details related to KPIs such as ad impressions, ad reach etc.Take your projects to the next level with our ultimate collection of Facebook Ad Campaign Performance Tracking Guide For Data Driven Advertising Pictures Pdf. Slidegeeks has designed a range of layouts that are perfect for representing task or activity duration, keeping track of all your deadlines at a glance. Tailor these designs to your exact needs and give them a truly corporate look with your own brand colors they all make your projects stand out from the rest. This slide represents the KPI dashboard to effectively measure and monitor performance of Facebook marketing campaign conducted by the organization to enhance customer engagement. It includes details related to KPIs such as ad impressions, ad reach etc.


 Continue with Email

 Home
Home


