Kpi Excel
Establishing Metrics Measuring Managing Risks And Establishing Trust Through Efficient Ideas Pdf
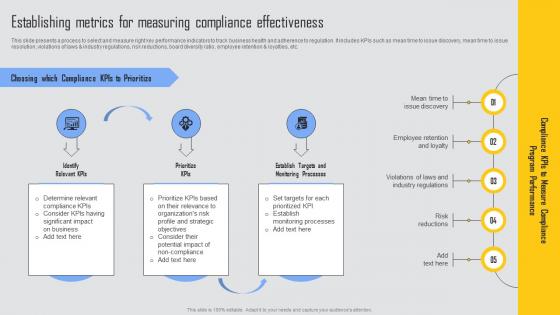
This slide presents a process to select and measure right key performance indicators to track business health and adherence to regulation. It includes KPIs such as mean time to issue discovery, mean time to issue resolution, violations of laws and industry regulations, risk reductions, board diversity ratio, employee retention and loyalties, etc. Do you have to make sure that everyone on your team knows about any specific topic I yes, then you should give Establishing Metrics Measuring Managing Risks And Establishing Trust Through Efficient Ideas Pdf a try. Our experts have put a lot of knowledge and effort into creating this impeccable Establishing Metrics Measuring Managing Risks And Establishing Trust Through Efficient Ideas Pdf. You can use this template for your upcoming presentations, as the slides are perfect to represent even the tiniest detail. You can download these templates from the Slidegeeks website and these are easy to edit. So grab these today This slide presents a process to select and measure right key performance indicators to track business health and adherence to regulation. It includes KPIs such as mean time to issue discovery, mean time to issue resolution, violations of laws and industry regulations, risk reductions, board diversity ratio, employee retention and loyalties, etc.
Client Helpline Dashboard Performance Key Metrics Ppt Outline Deck PDF
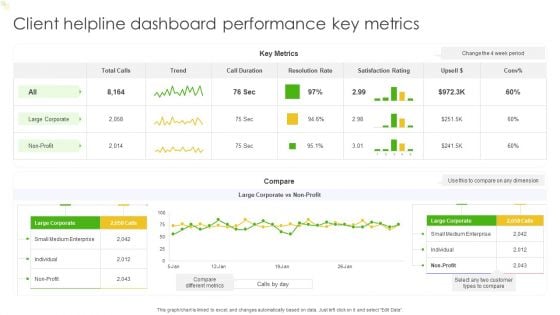
This graph or chart is linked to excel, and changes automatically based on data. Just left click on it and select Edit Data. Pitch your topic with ease and precision using this Client Helpline Dashboard Performance Key Metrics Ppt Outline Deck PDF. This layout presents information on Key Metrics, Trend, Compare. It is also available for immediate download and adjustment. So, changes can be made in the color, design, graphics or any other component to create a unique layout.
Finance Metrics Dashboard Indicating Product And Service Revenue Designs PDF
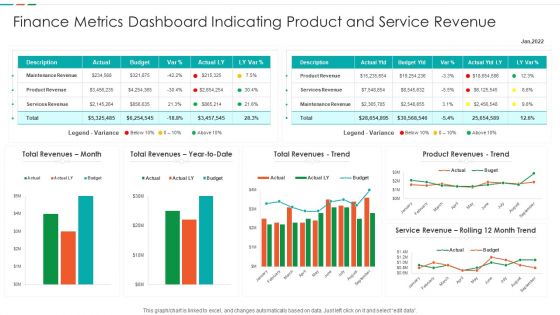
This graph or chart is linked to excel, and changes automatically based on data. Just left click on it and select edit data. Showcasing this set of slides titled Finance Metrics Dashboard Indicating Product And Service Revenue Designs PDF. The topics addressed in these templates are Maintenance Revenue Product, Revenue Product Revenues, Service Revenue Rolling. All the content presented in this PPT design is completely editable. Download it and make adjustments in color, background, font etc. as per your unique business setting.
Human Capital Metrics For Proper Management Ppt Show Inspiration PDF
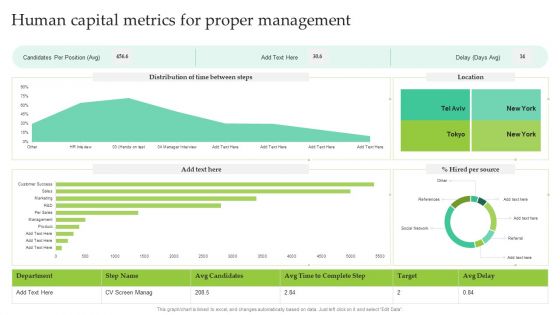
This graph or chart is linked to excel, and changes automatically based on data. Just left click on it and select Edit Data. Showcasing this set of slides titled Human Capital Metrics For Proper Management Ppt Show Inspiration PDF. The topics addressed in these templates are Candidates Per Position, Hired Per Source, Location. All the content presented in this PPT design is completely editable. Download it and make adjustments in color, background, font etc. as per your unique business setting.
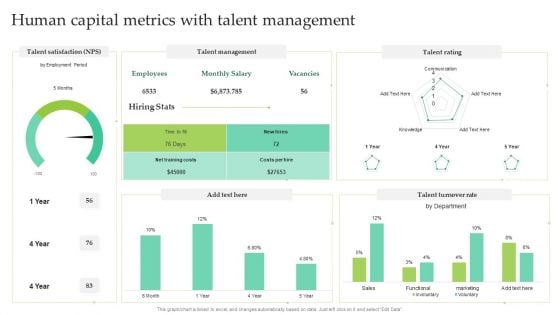
Human Capital Metrics With Talent Management Ppt Layouts Mockup PDF
This graph or chart is linked to excel, and changes automatically based on data. Just left click on it and select Edit Data. Showcasing this set of slides titled Human Capital Metrics With Talent Management Ppt Layouts Mockup PDF. The topics addressed in these templates are Talent Management, Talent Rating, Talent Turnover Rate. All the content presented in this PPT design is completely editable. Download it and make adjustments in color, background, font etc. as per your unique business setting.
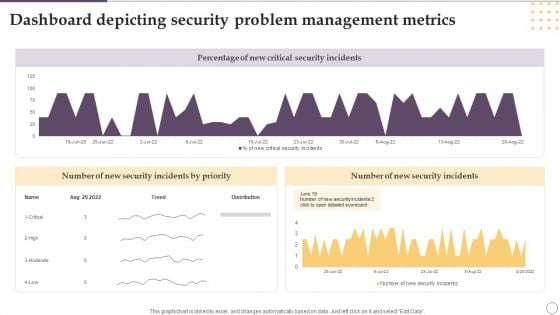
Dashboard Depicting Security Problem Management Metrics Ppt Gallery Designs PDF
This graph or chart is linked to excel, and changes automatically based on data. Just left click on it and select Edit Data. Showcasing this set of slides titled Dashboard Depicting Security Problem Management Metrics Ppt Gallery Designs PDF. The topics addressed in these templates are Percentage, New Critical, Security Incidents. All the content presented in this PPT design is completely editable. Download it and make adjustments in color, background, font etc. as per your unique business setting.
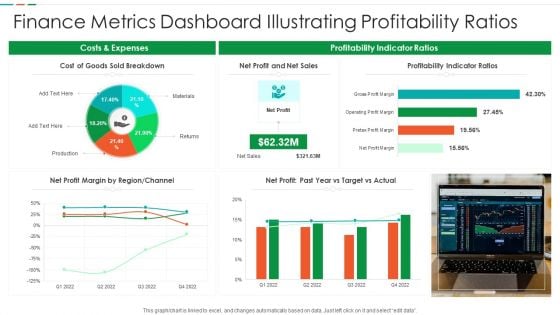
Finance Metrics Dashboard Illustrating Profitability Ratios Diagrams PDF
This graph or chart is linked to excel, and changes automatically based on data. Just left click on it and select edit data. Pitch your topic with ease and precision using this Finance Metrics Dashboard Illustrating Profitability Ratios Diagrams PDF. This layout presents information on Cost Goods Sold, Net Profit Net, Sales Profitability Indicator. It is also available for immediate download and adjustment. So, changes can be made in the color, design, graphics or any other component to create a unique layout.
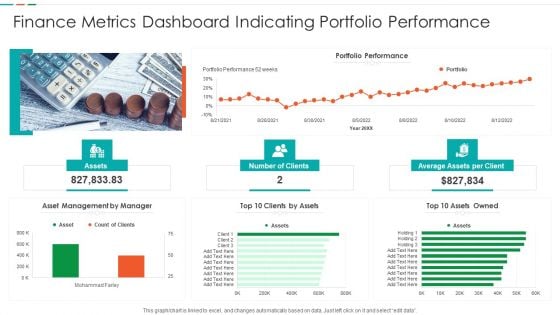
Finance Metrics Dashboard Indicating Portfolio Performance Microsoft PDF
This graph or chart is linked to excel, and changes automatically based on data. Just left click on it and select edit data. Pitch your topic with ease and precision using this Finance Metrics Dashboard Indicating Portfolio Performance Microsoft PDF. This layout presents information on Portfolio Performance Portfolio, Asset Management Manager, Top 10 Assets. It is also available for immediate download and adjustment. So, changes can be made in the color, design, graphics or any other component to create a unique layout.
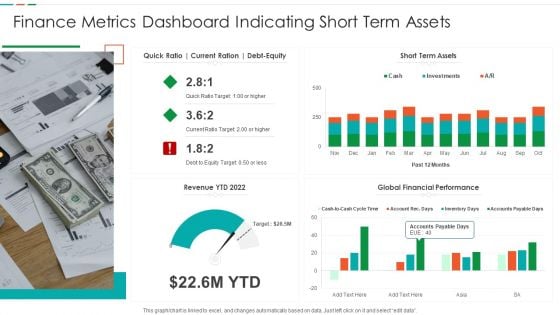
Finance Metrics Dashboard Indicating Short Term Assets Download PDF
This graph or chart is linked to excel, and changes automatically based on data. Just left click on it and select edit data. Pitch your topic with ease and precision using this Finance Metrics Dashboard Indicating Short Term Assets Download PDF. This layout presents information on Short Term Assets, Global Financial Performance, Revenue YTD 2022. It is also available for immediate download and adjustment. So, changes can be made in the color, design, graphics or any other component to create a unique layout.
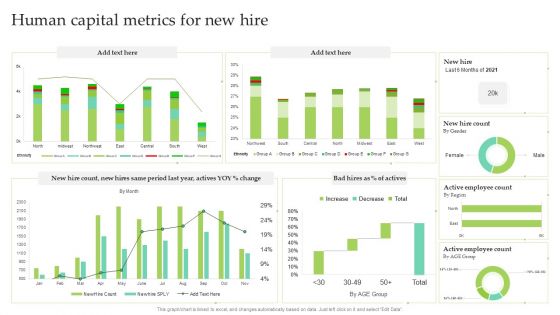
Human Capital Metrics For New Hire Ppt Pictures Brochure PDF
This graph or chart is linked to excel, and changes automatically based on data. Just left click on it and select Edit Data. Pitch your topic with ease and precision using this Human Capital Metrics For New Hire Ppt Pictures Brochure PDF. This layout presents information on Active Employee Count, New Hire Count, New Hire. It is also available for immediate download and adjustment. So, changes can be made in the color, design, graphics or any other component to create a unique layout.
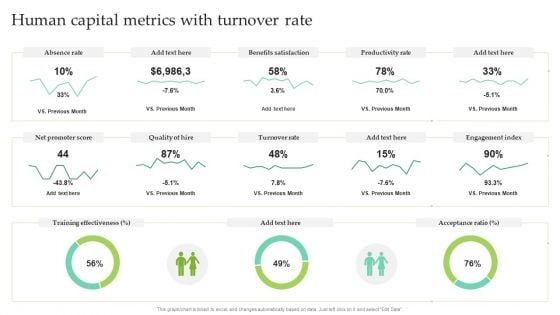
Human Capital Metrics With Turnover Rate Ppt Pictures Outline PDF
This graph or chart is linked to excel, and changes automatically based on data. Just left click on it and select Edit Data. Pitch your topic with ease and precision using this Human Capital Metrics With Turnover Rate Ppt Pictures Outline PDF. This layout presents information on Absence Rate, Benefits Satisfaction, Productivity Rate. It is also available for immediate download and adjustment. So, changes can be made in the color, design, graphics or any other component to create a unique layout.
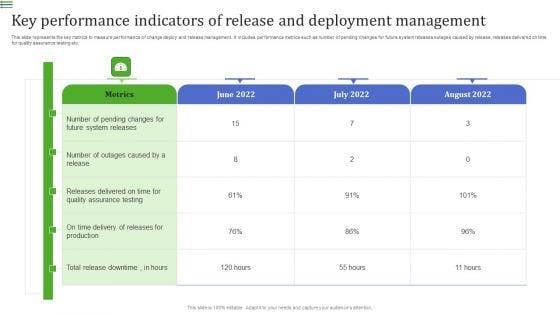
Key Performance Indicators Of Release And Deployment Management Demonstration PDF
This slide represents the key metrics to measure performance of change deploy and release management. It includes performance metrics such as number of pending changes for future system releases outages caused by release, releases delivered on time for quality assurance testing etc.Pitch your topic with ease and precision using this Key Performance Indicators Of Release And Deployment Management Demonstration PDF. This layout presents information on System Releases, Assurance Testing, Outages Caused. It is also available for immediate download and adjustment. So, changes can be made in the color, design, graphics or any other component to create a unique layout.
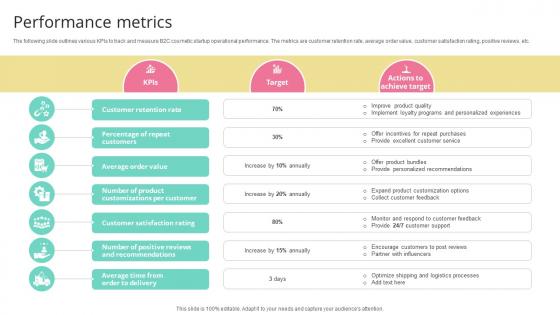
Performance Metrics Skincare Startup GTM Strategy GTM SS V
The following slide outlines various KPIs to track and measure B2C cosmetic startup operational performance. The metrics are customer retention rate, average order value, customer satisfaction rating, positive reviews, etc.Make sure to capture your audiences attention in your business displays with our gratis customizable Performance Metrics Skincare Startup GTM Strategy GTM SS V. These are great for business strategies, office conferences, capital raising or task suggestions. If you desire to acquire more customers for your tech business and ensure they stay satisfied, create your own sales presentation with these plain slides. The following slide outlines various KPIs to track and measure B2C cosmetic startup operational performance. The metrics are customer retention rate, average order value, customer satisfaction rating, positive reviews, etc.
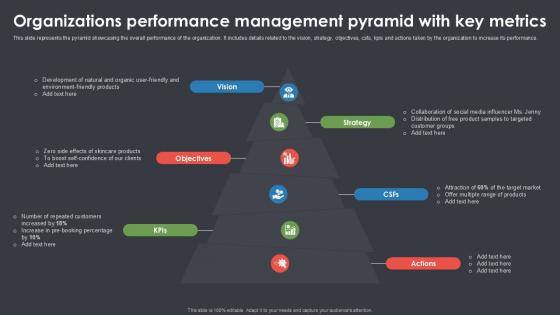
Organizations Performance Management Pyramid With Key Metrics Ppt Example SS
The following slide showcases business sustainability dashboard highlighting multiple sources of technology. It provides information about renewable energy, plant age, solar, wind, biomass, regionality, etc. Here you can discover an assortment of the finest PowerPoint and Google Slides templates. With these templates, you can create presentations for a variety of purposes while simultaneously providing your audience with an eye-catching visual experience. Download Organizations Performance Management Pyramid With Key Metrics Ppt Example SS to deliver an impeccable presentation. These templates will make your job of preparing presentations much quicker, yet still, maintain a high level of quality. Slidegeeks has experienced researchers who prepare these templates and write high-quality content for you. Later on, you can personalize the content by editing the Organizations Performance Management Pyramid With Key Metrics Ppt Example SS The following slide showcases business sustainability dashboard highlighting multiple sources of technology. It provides information about renewable energy, plant age, solar, wind, biomass, regionality, etc.
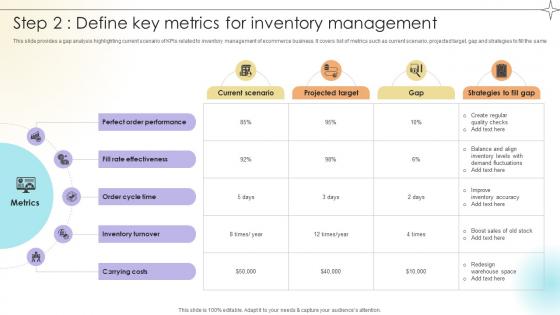
Step 2 Define Key Metrics For Inventory Management Data Analytics SS V
This slide provides a gap analysis highlighting current scenario of KPIs related to inventory management of ecommerce business. It covers list of metrics such as current scenario, projected target, gap and strategies to fill the same.Make sure to capture your audiences attention in your business displays with our gratis customizable Step 2 Define Key Metrics For Inventory Management Data Analytics SS V. These are great for business strategies, office conferences, capital raising or task suggestions. If you desire to acquire more customers for your tech business and ensure they stay satisfied, create your own sales presentation with these plain slides. This slide provides a gap analysis highlighting current scenario of KPIs related to inventory management of ecommerce business. It covers list of metrics such as current scenario, projected target, gap and strategies to fill the same.
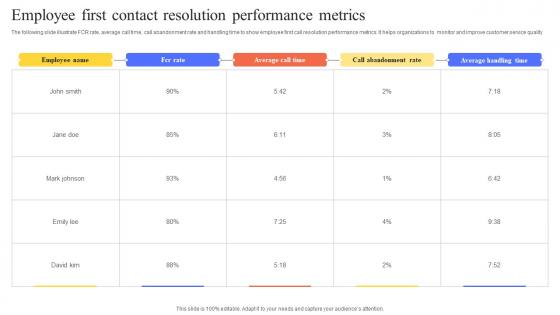
Employee First Contact Resolution Performance Metrics Demonstration Pdf
The following slide illustrate FCR rate, average call time, call abandonment rate and handling time to show employee first call resolution performance metrics. It helps organizations to monitor and improve customer service quality.Showcasing this set of slides titled Employee First Contact Resolution Performance Metrics Demonstration Pdf The topics addressed in these templates are Average Call Time, Abandonment Rate, Average Handling Time All the content presented in this PPT design is completely editable. Download it and make adjustments in color, background, font etc. as per your unique business setting. The following slide illustrate FCR rate, average call time, call abandonment rate and handling time to show employee first call resolution performance metrics. It helps organizations to monitor and improve customer service quality
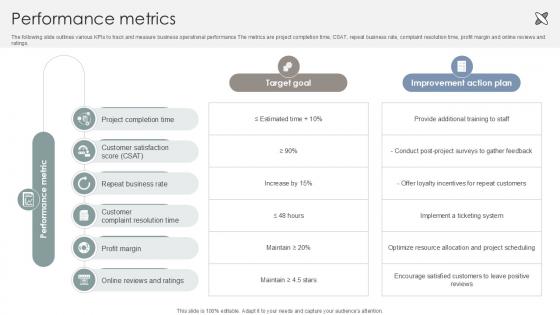
Performance Metrics Interior Design Company Market Entry Plan PPT PowerPoint GTM SS V
The following slide outlines various KPIs to track and measure business operational performance The metrics are project completion time, CSAT, repeat business rate, complaint resolution time, profit margin and online reviews and ratings. Crafting an eye-catching presentation has never been more straightforward. Let your presentation shine with this tasteful yet straightforward Performance Metrics Interior Design Company Market Entry Plan PPT PowerPoint GTM SS V template. It offers a minimalistic and classy look that is great for making a statement. The colors have been employed intelligently to add a bit of playfulness while still remaining professional. Construct the ideal Performance Metrics Interior Design Company Market Entry Plan PPT PowerPoint GTM SS V that effortlessly grabs the attention of your audience Begin now and be certain to wow your customers The following slide outlines various KPIs to track and measure business operational performance The metrics are project completion time, CSAT, repeat business rate, complaint resolution time, profit margin and online reviews and ratings.

Automotive Industry Metrics Ppt PowerPoint Presentation Complete Deck With Slides
Improve your presentation delivery using this Automotive Industry Metrics Ppt PowerPoint Presentation Complete Deck With Slides. Support your business vision and objectives using this well structured PPT deck. This template offers a great starting point for delivering beautifully designed presentations on the topic of your choice. Comprising eighteen this professionally designed template is all you need to host discussion and meetings with collaborators. Each slide is self explanatory and equipped with high quality graphics that can be adjusted to your needs. Therefore, you will face no difficulty in portraying your desired content using this PPT slideshow. This PowerPoint slideshow contains every important element that you need for a great pitch. It is not only editable but also available for immediate download and utilization. The color, font size, background, shapes everything can be modified to create your unique presentation layout. Therefore, download it now. Our Automotive Industry Metrics Ppt PowerPoint Presentation Complete Deck With Slides are topically designed to provide an attractive backdrop to any subject. Use them to look like a presentation pro.

HR Analytics Metrics Ppt Powerpoint Presentation Complete Deck With Slides
Improve your presentation delivery using this HR Analytics Metrics Ppt Powerpoint Presentation Complete Deck With Slides Support your business vision and objectives using this well-structured PPT deck. This template offers a great starting point for delivering beautifully designed presentations on the topic of your choice. Comprising twelve this professionally designed template is all you need to host discussion and meetings with collaborators. Each slide is self-explanatory and equipped with high-quality graphics that can be adjusted to your needs. Therefore, you will face no difficulty in portraying your desired content using this PPT slideshow. This PowerPoint slideshow contains every important element that you need for a great pitch. It is not only editable but also available for immediate download and utilization. The color, font size, background, shapes everything can be modified to create your unique presentation layout. Therefore, download it now. Our HR Analytics Metrics Ppt Powerpoint Presentation Complete Deck With Slides are topically designed to provide an attractive backdrop to any subject. Use them to look like a presentation pro.
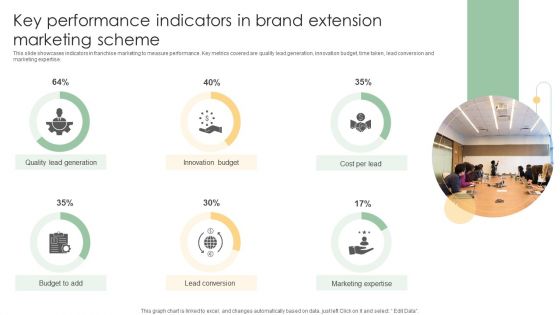
Key Performance Indicators In Brand Extension Marketing Scheme Ideas PDF
This slide showcases indicators in franchise marketing to measure performance. Key metrics covered are quality lead generation, innovation budget, time taken, lead conversion and marketing expertise.Pitch your topic with ease and precision using this Key Performance Indicators In Brand Extension Marketing Scheme Ideas PDF. This layout presents information on Quality Lead Generation, Innovation Budget, Lead Conversion. It is also available for immediate download and adjustment. So, changes can be made in the color, design, graphics or any other component to create a unique layout.
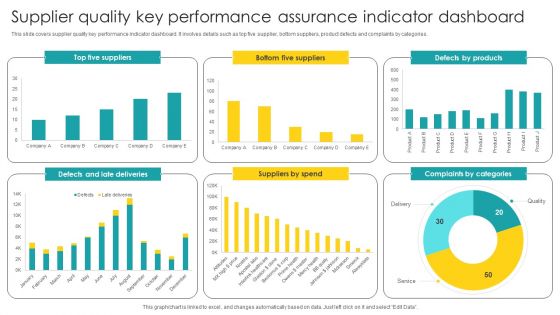
Supplier Quality Key Performance Assurance Indicator Dashboard Diagrams PDF
Showcasing this set of slides titled Supplier Quality Key Performance Assurance Indicator Dashboard Diagrams PDF. The topics addressed in these templates are Supplier Quality, Key Performance, Assurance Indicator. All the content presented in this PPT design is completely editable. Download it and make adjustments in color, background, font etc. as per your unique business setting.
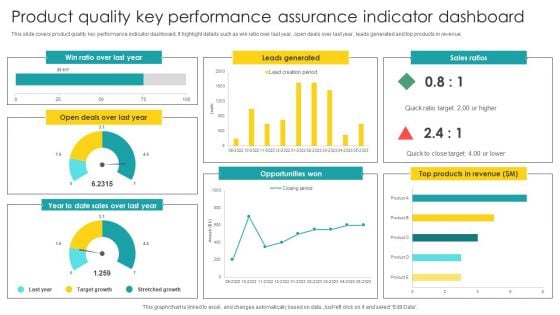
Product Quality Key Performance Assurance Indicator Dashboard Graphics PDF
Showcasing this set of slides titled Product Quality Key Performance Assurance Indicator Dashboard Graphics PDF. The topics addressed in these templates are Key Performance, Assurance Indicator, Dashboard. All the content presented in this PPT design is completely editable. Download it and make adjustments in color, background, font etc. as per your unique business setting.
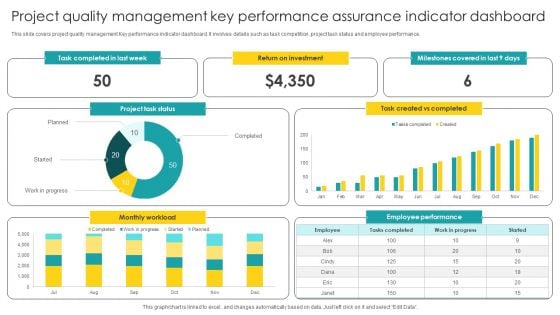
Project Quality Management Key Performance Assurance Indicator Dashboard Guidelines PDF
Pitch your topic with ease and precision using this Project Quality Management Key Performance Assurance Indicator Dashboard Guidelines PDF. This layout presents information on Management Key, Performance Assurance, Indicator Dashboard. It is also available for immediate download and adjustment. So, changes can be made in the color, design, graphics or any other component to create a unique layout.
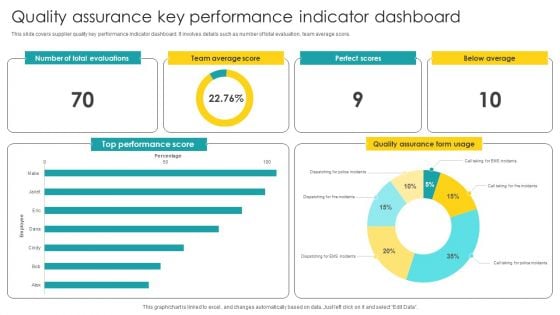
Quality Assurance Key Performance Indicator Dashboard Structure PDF
Showcasing this set of slides titled Quality Assurance Key Performance Indicator Dashboard Structure PDF. The topics addressed in these templates are Key Performance, Indicator Dashboard. All the content presented in this PPT design is completely editable. Download it and make adjustments in color, background, font etc. as per your unique business setting.

Key Metrics Used To Track Product Analytics Product Analytics Implementation Data Analytics V
This slide outlines major metrics used by businesses to analyse product performance aimed at making necessary improvements. It covers key metrics such as engagement, retention, customer lifetime value, number of crashes and feature adoption rate with benefits Do you know about Slidesgeeks Key Metrics Used To Track Product Analytics Product Analytics Implementation Data Analytics V These are perfect for delivering any kind od presentation. Using it, create PowerPoint presentations that communicate your ideas and engage audiences. Save time and effort by using our pre-designed presentation templates that are perfect for a wide range of topic. Our vast selection of designs covers a range of styles, from creative to business, and are all highly customizable and easy to edit. Download as a PowerPoint template or use them as Google Slides themes. This slide outlines major metrics used by businesses to analyse product performance aimed at making necessary improvements. It covers key metrics such as engagement, retention, customer lifetime value, number of crashes and feature adoption rate with benefits
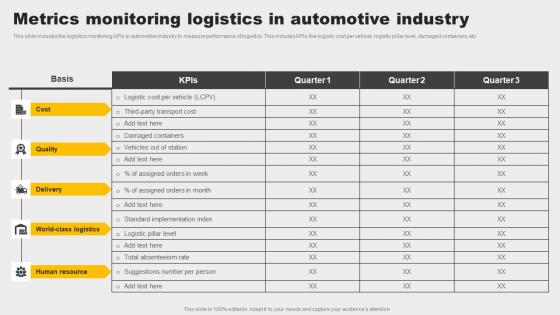
Metrics Monitoring Logistics In Automotive Industry Designs Pdf
This slide includes the logistics monitoring KPIs in automotive industry to measure performance of logistics. This includes KPIs like logistic cost per vehicle, logistic pillar level, damaged containers, etc. Showcasing this set of slides titled Metrics Monitoring Logistics In Automotive Industry Designs Pdf. The topics addressed in these templates are Quality, Cost, Human Resource. All the content presented in this PPT design is completely editable. Download it and make adjustments in color, background, font etc. as per your unique business setting. This slide includes the logistics monitoring KPIs in automotive industry to measure performance of logistics. This includes KPIs like logistic cost per vehicle, logistic pillar level, damaged containers, etc.

Performance Metrics Information Technology Startup Go To Market Strategy GTM SS V
The following slide outlines various KPIs to track and measure IT startup operational performance. The metrics are response time, user satisfaction, error rate, time to resolution, capacity utilization, etc.Make sure to capture your audiences attention in your business displays with our gratis customizable Performance Metrics Information Technology Startup Go To Market Strategy GTM SS V. These are great for business strategies, office conferences, capital raising or task suggestions. If you desire to acquire more customers for your tech business and ensure they stay satisfied, create your own sales presentation with these plain slides. The following slide outlines various KPIs to track and measure IT startup operational performance. The metrics are response time, user satisfaction, error rate, time to resolution, capacity utilization, etc.
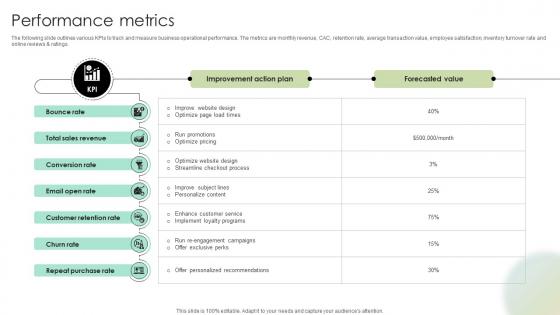
Performance Metrics Digital Fashion Brand Portal Market Entry Plan GTM SS V
The following slide outlines various KPIs to track and measure business operational performance. The metrics are monthly revenue, CAC, retention rate, average transaction value, employee satisfaction, inventory turnover rate and online reviews and ratings.Crafting an eye-catching presentation has never been more straightforward. Let your presentation shine with this tasteful yet straightforward Performance Metrics Digital Fashion Brand Portal Market Entry Plan GTM SS V template. It offers a minimalistic and classy look that is great for making a statement. The colors have been employed intelligently to add a bit of playfulness while still remaining professional. Construct the ideal Performance Metrics Digital Fashion Brand Portal Market Entry Plan GTM SS V that effortlessly grabs the attention of your audience Begin now and be certain to wow your customers The following slide outlines various KPIs to track and measure business operational performance. The metrics are monthly revenue, CAC, retention rate, average transaction value, employee satisfaction, inventory turnover rate and online reviews and ratings.
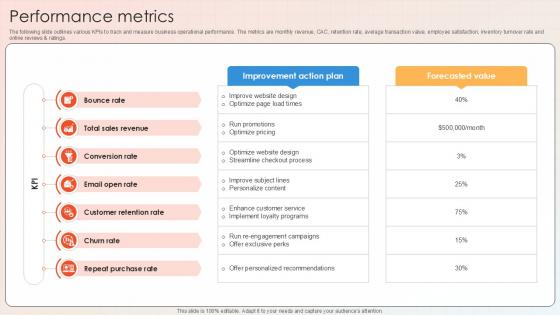
Performance Metrics Apparel And Shoes E Commerce Market PPT Slide GTM SS V
The following slide outlines various KPIs to track and measure business operational performance. The metrics are monthly revenue, CAC, retention rate, average transaction value, employee satisfaction, inventory turnover rate and online reviews and ratings. Crafting an eye-catching presentation has never been more straightforward. Let your presentation shine with this tasteful yet straightforward Performance Metrics Apparel And Shoes E Commerce Market PPT Slide GTM SS V template. It offers a minimalistic and classy look that is great for making a statement. The colors have been employed intelligently to add a bit of playfulness while still remaining professional. Construct the ideal Performance Metrics Apparel And Shoes E Commerce Market PPT Slide GTM SS V that effortlessly grabs the attention of your audience Begin now and be certain to wow your customers The following slide outlines various KPIs to track and measure business operational performance. The metrics are monthly revenue, CAC, retention rate, average transaction value, employee satisfaction, inventory turnover rate and online reviews and ratings.
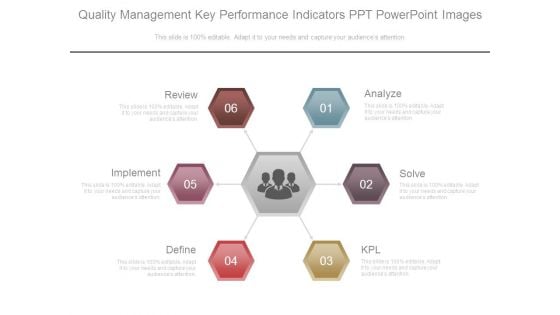
Quality Management Key Performance Indicators Ppt Powerpoint Images
This is a quality management key performance indicators ppt powerpoint images. This is a six stage process. The stages in this process are review, implement, define, kpl, solve, analyze.
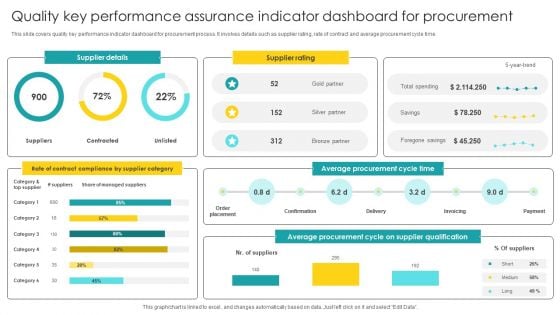
Quality Key Performance Assurance Indicator Dashboard For Procurement Elements PDF
Pitch your topic with ease and precision using this Quality Key Performance Assurance Indicator Dashboard For Procurement Elements PDF. This layout presents information on Indicator Dashboard, Procurement. It is also available for immediate download and adjustment. So, changes can be made in the color, design, graphics or any other component to create a unique layout.
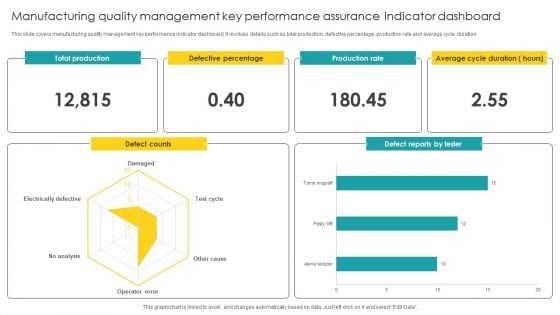
Manufacturing Quality Management Key Performance Assurance Indicator Dashboard Microsoft PDF
Pitch your topic with ease and precision using this Manufacturing Quality Management Key Performance Assurance Indicator Dashboard Microsoft PDF. This layout presents information on Quality Management, Key Performance Assurance. It is also available for immediate download and adjustment. So, changes can be made in the color, design, graphics or any other component to create a unique layout.
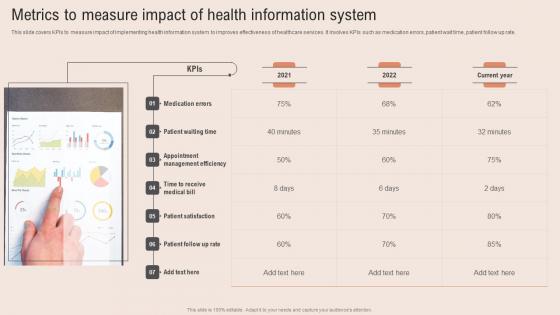
Metrics To Measure Impact Healthcare Information Tech To Enhance Medical Facilities Infographics Pdf
This slide covers KPIs to measure impact of implementing health information system to improves effectiveness of healthcare services. It involves KPIs such as medication errors, patient wait time, patient follow up rate. Do you know about Slidesgeeks Metrics To Measure Impact Healthcare Information Tech To Enhance Medical Facilities Infographics Pdf These are perfect for delivering any kind od presentation. Using it, create PowerPoint presentations that communicate your ideas and engage audiences. Save time and effort by using our pre designed presentation templates that are perfect for a wide range of topic. Our vast selection of designs covers a range of styles, from creative to business, and are all highly customizable and easy to edit. Download as a PowerPoint template or use them as Google Slides themes. This slide covers KPIs to measure impact of implementing health information system to improves effectiveness of healthcare services. It involves KPIs such as medication errors, patient wait time, patient follow up rate.
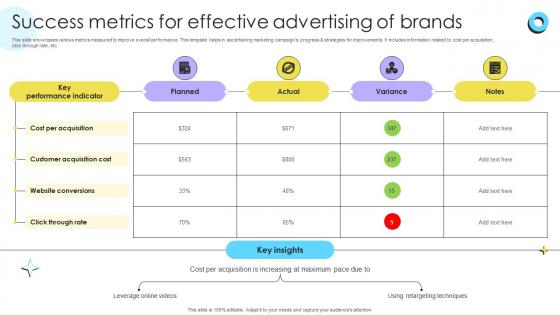
Success Metrics For Effective Advertising Encouraging Repetitive Customer Purchase Ppt Powerpoint
This slide showcases various metrics measured to improve overall performance. This template helps in ascertaining marketing campaigns progress and strategies for improvements. It includes information related to cost per acquisition, click through rate, etc. Retrieve professionally designed Success Metrics For Effective Advertising Encouraging Repetitive Customer Purchase Ppt Powerpoint to effectively convey your message and captivate your listeners. Save time by selecting pre-made slideshows that are appropriate for various topics, from business to educational purposes. These themes come in many different styles, from creative to corporate, and all of them are easily adjustable and can be edited quickly. Access them as PowerPoint templates or as Google Slides themes. You do not have to go on a hunt for the perfect presentation because Slidegeeks got you covered from everywhere. This slide showcases various metrics measured to improve overall performance. This template helps in ascertaining marketing campaigns progress and strategies for improvements. It includes information related to cost per acquisition, click through rate, etc.

Track Client Health Score Using Key Performance Indicators Summary PDF
This slide illustrates various key performance indicators used to analyze the performance of products and helps in measuring customer health scores. It includes metrics such as customer sentiment, customer engagement, customer ROI and customer feedback. Persuade your audience using this Track Client Health Score Using Key Performance Indicators Summary PDF. This PPT design covers four stages, thus making it a great tool to use. It also caters to a variety of topics including Customer Sentiment, Customer Engagement, Customer ROI. Download this PPT design now to present a convincing pitch that not only emphasizes the topic but also showcases your presentation skills.
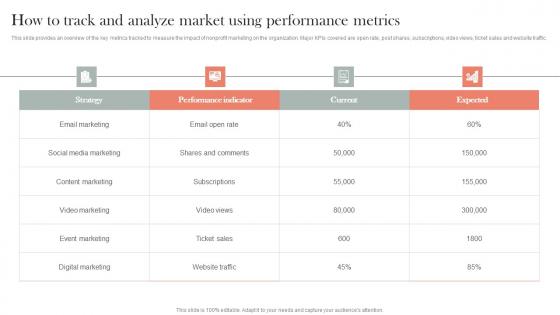
How To Track And Analyze Market Using Metrics Efficient Nonprofit Marketing Ideas Pdf
This slide provides an overview of the key metrics tracked to measure the impact of nonprofit marketing on the organization. Major KPIs covered are open rate, post shares, subscriptions, video views, ticket sales and website traffic.Are you searching for a How To Track And Analyze Market Using Metrics Efficient Nonprofit Marketing Ideas Pdf that is uncluttered, straightforward, and original Its easy to edit, and you can change the colors to suit your personal or business branding. For a presentation that expresses how much effort you have put in, this template is ideal. With all of its features, including tables, diagrams, statistics, and lists, its perfect for a business plan presentation. Make your ideas more appealing with these professional slides. Download How To Track And Analyze Market Using Metrics Efficient Nonprofit Marketing Ideas Pdf from Slidegeeks today. This slide provides an overview of the key metrics tracked to measure the impact of nonprofit marketing on the organization. Major KPIs covered are open rate, post shares, subscriptions, video views, ticket sales and website traffic.
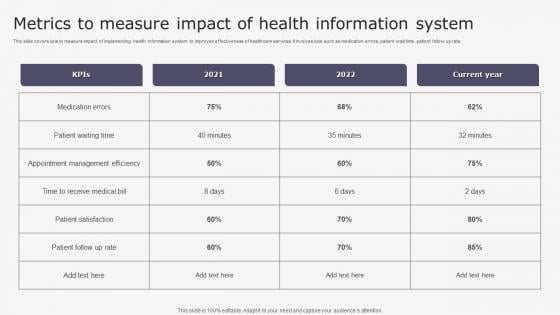
Metrics To Measure Impact Transforming Medicare Services Using Health Structure Pdf
This slide covers kpis to measure impact of implementing health information system to improves effectiveness of healthcare services. It involves kpis such as medication errors, patient wait time, patient follow up rate. Retrieve professionally designed Metrics To Measure Impact Transforming Medicare Services Using Health Structure Pdf to effectively convey your message and captivate your listeners. Save time by selecting pre made slideshows that are appropriate for various topics, from business to educational purposes. These themes come in many different styles, from creative to corporate, and all of them are easily adjustable and can be edited quickly. Access them as PowerPoint templates or as Google Slides themes. You do not have to go on a hunt for the perfect presentation because Slidegeeks got you covered from everywhere. This slide covers kpis to measure impact of implementing health information system to improves effectiveness of healthcare services. It involves kpis such as medication errors, patient wait time, patient follow up rate.
Setting Goals And Success Metrics For Retail Digital Optimizing Retail Operations With Digital DT SS V
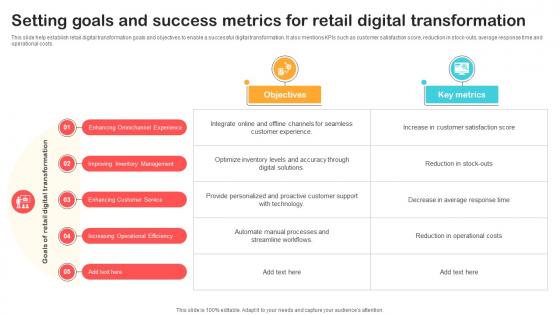
This slide help establish retail digital transformation goals and objectives to enable a successful digital transformation. It also mentions KPIs such as customer satisfaction score, reduction in stock-outs, average response time and operational costs.Are you searching for a Setting Goals And Success Metrics For Retail Digital Optimizing Retail Operations With Digital DT SS V that is uncluttered, straightforward, and original Its easy to edit, and you can change the colors to suit your personal or business branding. For a presentation that expresses how much effort you have put in, this template is ideal With all of its features, including tables, diagrams, statistics, and lists, its perfect for a business plan presentation. Make your ideas more appealing with these professional slides. Download Setting Goals And Success Metrics For Retail Digital Optimizing Retail Operations With Digital DT SS V from Slidegeeks today. This slide help establish retail digital transformation goals and objectives to enable a successful digital transformation. It also mentions KPIs such as customer satisfaction score, reduction in stock-outs, average response time and operational costs.
Setting Goals And Success Metrics For Retail Digital Transformation DT SS V
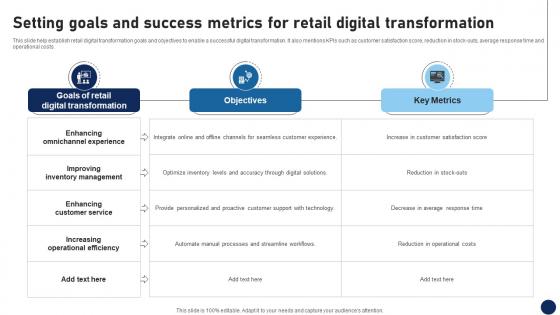
This slide help establish retail digital transformation goals and objectives to enable a successful digital transformation. It also mentions KPIs such as customer satisfaction score, reduction in stock-outs, average response time and operational costs.Are you searching for a Setting Goals And Success Metrics For Retail Digital Transformation DT SS V that is uncluttered, straightforward, and original Its easy to edit, and you can change the colors to suit your personal or business branding. For a presentation that expresses how much effort you have put in, this template is ideal With all of its features, including tables, diagrams, statistics, and lists, its perfect for a business plan presentation. Make your ideas more appealing with these professional slides. Download Setting Goals And Success Metrics For Retail Digital Transformation DT SS V from Slidegeeks today. This slide help establish retail digital transformation goals and objectives to enable a successful digital transformation. It also mentions KPIs such as customer satisfaction score, reduction in stock-outs, average response time and operational costs.
Key Performance Indicators For Staff Performance Management Clipart PDF
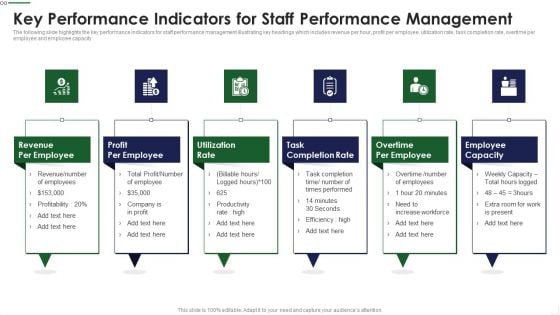
The following slide highlights the key performance Indicators for staff performance management illustrating key headings which includes revenue per hour, profit per employee, utilization rate, task completion rate, overtime per employee and employee capacity Persuade your audience using this Key Performance Indicators For Staff Growth Topics PDF This PPT design covers six stages, thus making it a great tool to use. It also caters to a variety of topics including Revenue Employee, Profit Employee, Task Completion Download this PPT design now to present a convincing pitch that not only emphasizes the topic but also showcases your presentation skills.
Workforce Performance Scorecard With Leading Key Performance Indicator Information PDF
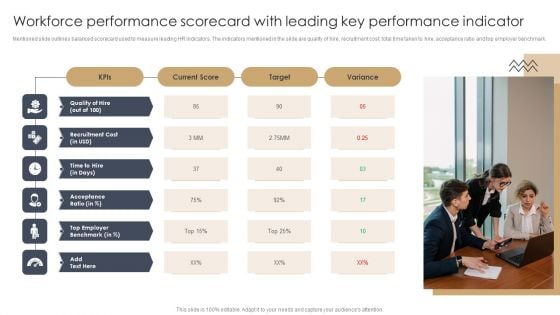
Mentioned slide outlines balanced scorecard used to measure leading HR indicators. The indicators mentioned in the slide are quality of hire, recruitment cost, total time taken to hire, acceptance ratio and top employer benchmark.Presenting Workforce Performance Scorecard With Leading Key Performance Indicator Information PDF to dispense important information. This template comprises one stage. It also presents valuable insights into the topics including Top Employer, Acceptance Ratio, Recruitment Cost. This is a completely customizable PowerPoint theme that can be put to use immediately. So, download it and address the topic impactfully.
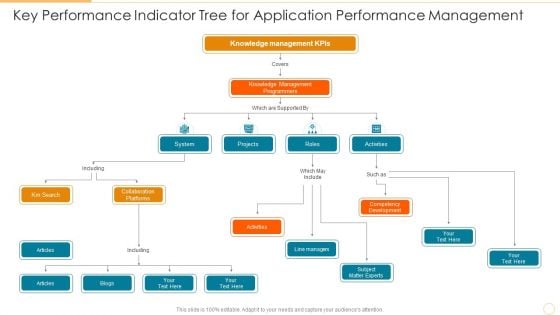
Key Performance Indicator Tree For Application Performance Management Background PDF
Persuade your audience using this key performance indicator tree for application performance management background pdf. This PPT design covers six stages, thus making it a great tool to use. It also caters to a variety of topics including collaboration platforms, competency development, knowledge management programmers. Download this PPT design now to present a convincing pitch that not only emphasizes the topic but also showcases your presentation skills.
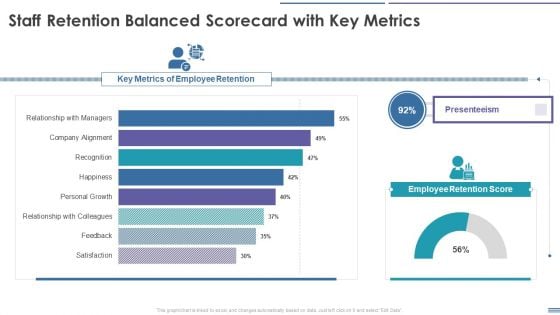
Staff Retention Balanced Scorecard Staff Retention Balanced Scorecard With Key Metrics Demonstration PDF
This graph or chart is linked to excel, and changes automatically based on data. Just left click on it and select Edit Data. Deliver and pitch your topic in the best possible manner with this Staff Retention Balanced Scorecard Staff Retention Balanced Scorecard With Key Metrics Demonstration PDF. Use them to share invaluable insights on Key Metrics Of Employee Retention, Presenteeism, Employee Retention Score and impress your audience. This template can be altered and modified as per your expectations. So, grab it now.
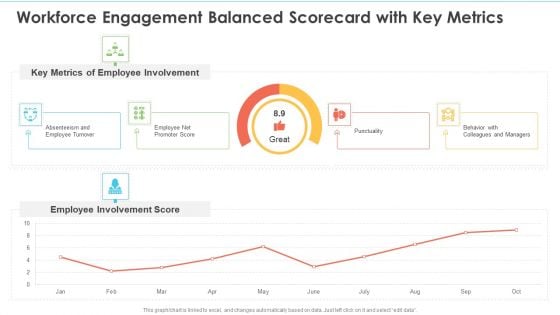
Workforce Engagement Balanced Scorecard With Key Metrics Ppt Inspiration Deck PDF
This graph or chart is linked to excel, and changes automatically based on data. Just left click on it and select edit data. Deliver an awe inspiring pitch with this creative Workforce Engagement Balanced Scorecard With Key Metrics Ppt Inspiration Deck PDF bundle. Topics like Key Metrics, Employee Involvement, Employee Involvement Score can be discussed with this completely editable template. It is available for immediate download depending on the needs and requirements of the user.
Finance Metrics Dashboard Illustrating Gross And Operating Profit Margin Icons PDF
This graph or chart is linked to excel, and changes automatically based on data. Just left click on it and select edit data. Showcasing this set of slides titled Finance Metrics Dashboard Illustrating Gross And Operating Profit Margin Icons PDF. The topics addressed in these templates are Gross Profit Margin, Operating Profit Margin, Net Profit Margin. All the content presented in this PPT design is completely editable. Download it and make adjustments in color, background, font etc. as per your unique business setting.
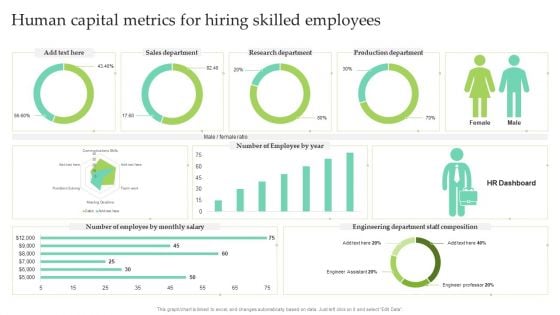
Human Capital Metrics For Hiring Skilled Employees Ppt Slides Themes PDF
This graph or chart is linked to excel, and changes automatically based on data. Just left click on it and select Edit Data. Showcasing this set of slides titled Human Capital Metrics For Hiring Skilled Employees Ppt Slides Themes PDF. The topics addressed in these templates are Sales Department, Research Department, Production Department. All the content presented in this PPT design is completely editable. Download it and make adjustments in color, background, font etc. as per your unique business setting.
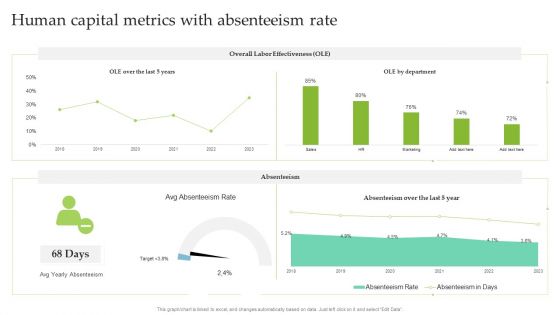
Human Capital Metrics With Absenteeism Rate Ppt Infographic Template Ideas PDF
This graph or chart is linked to excel, and changes automatically based on data. Just left click on it and select Edit Data. Pitch your topic with ease and precision using this Human Capital Metrics With Absenteeism Rate Ppt Infographic Template Ideas PDF. This layout presents information on Overall Labor Effectiveness, OLE Department, Absenteeism. It is also available for immediate download and adjustment. So, changes can be made in the color, design, graphics or any other component to create a unique layout.
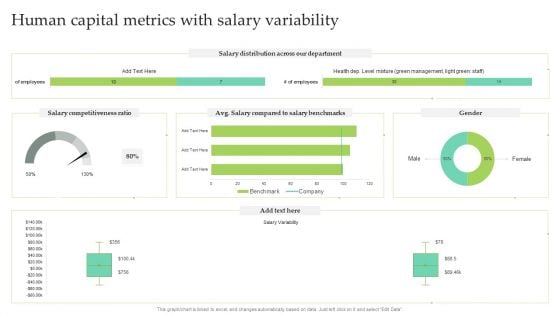
Human Capital Metrics With Salary Variability Ppt Infographic Template Designs PDF
This graph or chart is linked to excel, and changes automatically based on data. Just left click on it and select Edit Data. Pitch your topic with ease and precision using this Human Capital Metrics With Salary Variability Ppt Infographic Template Designs PDF. This layout presents information on Salary Distribution, Salary Competitiveness Ratio, Male. It is also available for immediate download and adjustment. So, changes can be made in the color, design, graphics or any other component to create a unique layout.
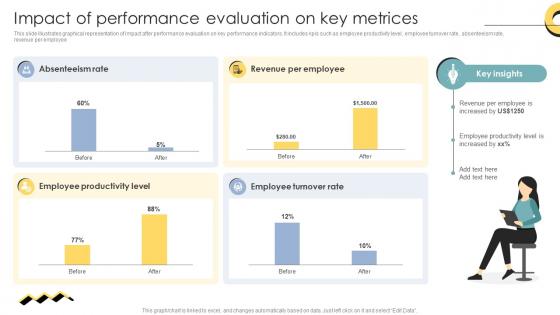
Skill Enhancement Performance Impact Of Performance Evaluation On Key Metrices
This slide illustrates graphical representation of impact after performance evaluation on key performance indicators. It includes kpis such as employee productivity level, employee turnover rate, absenteeism rate, revenue per employee. Do you have to make sure that everyone on your team knows about any specific topic I yes, then you should give Skill Enhancement Performance Impact Of Performance Evaluation On Key Metrices a try. Our experts have put a lot of knowledge and effort into creating this impeccable Skill Enhancement Performance Impact Of Performance Evaluation On Key Metrices. You can use this template for your upcoming presentations, as the slides are perfect to represent even the tiniest detail. You can download these templates from the Slidegeeks website and these are easy to edit. So grab these today This slide illustrates graphical representation of impact after performance evaluation on key performance indicators. It includes kpis such as employee productivity level, employee turnover rate, absenteeism rate, revenue per employee.
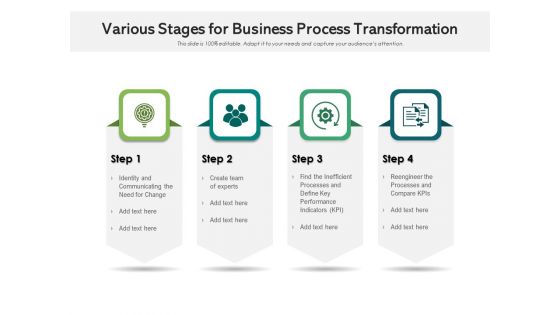
Various Stages For Business Process Transformation Ppt PowerPoint Presentation Model Slideshow PDF
Persuade your audience using this various stages for business process transformation ppt powerpoint presentation model slideshow pdf. This PPT design covers four stages, thus making it a great tool to use. It also caters to a variety of topics including identity and communicating the need for change, create team of experts, find the inefficient processes and define key performance indicators kpi, reengineer the processes and compare kpis. Download this PPT design now to present a convincing pitch that not only emphasizes the topic but also showcases your presentation skills.
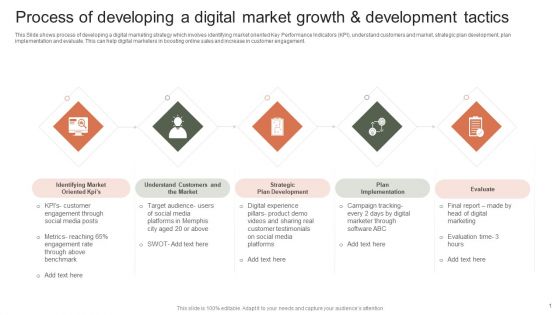
Process Of Developing A Digital Market Growth And Development Tactics Elements PDF
This Slide shows process of developing a digital marketing strategy which involves identifying market oriented Key Performance Indicators KPI, understand customers and market, strategic plan development, plan implementation and evaluate. This can help digital marketers in boosting online sales and increase in customer engagement. Persuade your audience using this Process Of Developing A Digital Market Growth And Development Tactics Elements PDF. This PPT design covers five stages, thus making it a great tool to use. It also caters to a variety of topics including Strategic Plan Development, Plan Implementation, Evaluate. Download this PPT design now to present a convincing pitch that not only emphasizes the topic but also showcases your presentation skills.
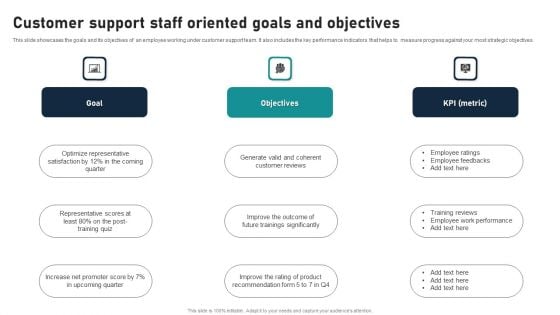
Customer Support Staff Oriented Goals And Objectives Download PDF
This slide showcases the goals and its objectives of an employee working under customer support team. It also includes the key performance indicators that helps to measure progress against your most strategic objectives. Persuade your audience using this Customer Support Staff Oriented Goals And Objectives Download PDF. This PPT design covers three stages, thus making it a great tool to use. It also caters to a variety of topics including Goal, Objectives, KPI. Download this PPT design now to present a convincing pitch that not only emphasizes the topic but also showcases your presentation skills.
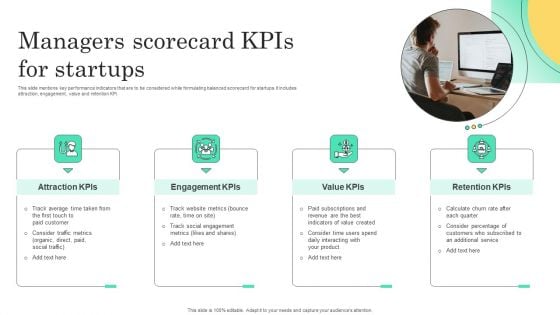
Managers Scorecard Kpis For Startups Slides PDF
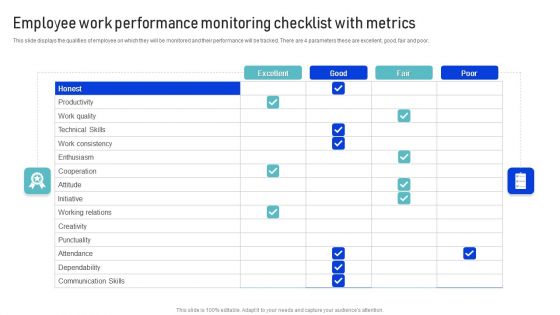
Employee Work Performance Monitoring Checklist With Metrics Infographics PDF
This slide displays the qualities of employee on which they will be monitored and their performance will be tracked. There are 4 parameters these are excellent, good, fair and poor. Showcasing this set of slides titled Employee Work Performance Monitoring Checklist With Metrics Infographics PDF. The topics addressed in these templates are Work Quality, Productivity, Communication Skills. All the content presented in this PPT design is completely editable. Download it and make adjustments in color, background, font etc. as per your unique business setting.
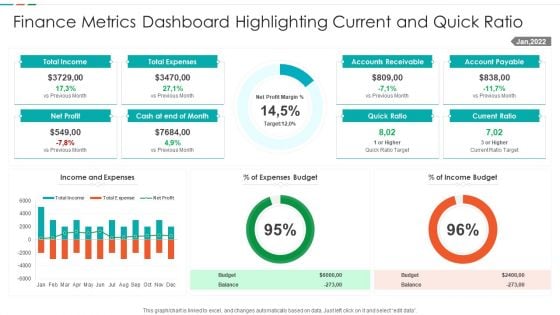
Finance Metrics Dashboard Highlighting Current And Quick Ratio Template PDF
This graph or chart is linked to excel, and changes automatically based on data. Just left click on it and select edit data. Showcasing this set of slides titled Finance Metrics Dashboard Highlighting Current And Quick Ratio Template PDF. The topics addressed in these templates are Total Income Budget, Total Expenses Balance, Net Profit Quick, Ratio Current Ratio. All the content presented in this PPT design is completely editable. Download it and make adjustments in color, background, font etc. as per your unique business setting.
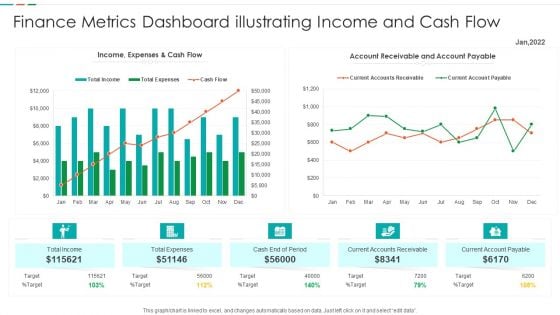
Finance Metrics Dashboard Illustrating Income And Cash Flow Template PDF
This graph or chart is linked to excel, and changes automatically based on data. Just left click on it and select edit data. Pitch your topic with ease and precision using this Finance Metrics Dashboard Illustrating Income And Cash Flow Template PDF. This layout presents information on Current Accounts Receivable, Current Account Payable, Cash End Period, Account Receivable Account. It is also available for immediate download and adjustment. So, changes can be made in the color, design, graphics or any other component to create a unique layout.
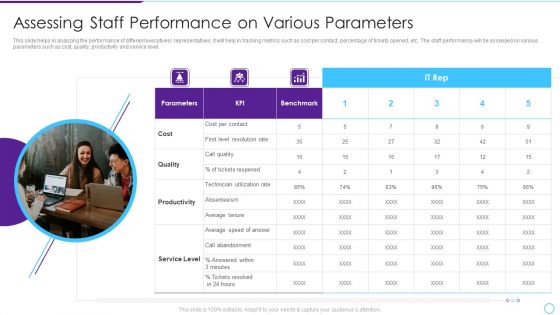
Intelligent Infrastructure Assessing Staff Performance On Various Parameters Summary PDF
This slide helps in analyzing the performance of different executives or representatives. It will help in tracking metrics such as cost per contact, percentage of tickets opened, etc. The staff performance will be assessed on various parameters such as cost, quality, productivity and service level. This is a Intelligent Infrastructure Assessing Staff Performance On Various Parameters Summary PDF template with various stages. Focus and dispense information on three stages using this creative set, that comes with editable features. It contains large content boxes to add your information on topics like Parameters, Cost, KPI, Productivity, Service Level. You can also showcase facts, figures, and other relevant content using this PPT layout. Grab it now.
Finance Metrics Dashboard Illustrating Account Payables Icons PDF
This graph or chart is linked to excel, and changes automatically based on data. Just left click on it and select edit data. Pitch your topic with ease and precision using this Total Income Budget, Total Expenses Balance, Net Profit Quick, Ratio Current Ratio. This layout presents information on Account Payable Age, Average Creditor Days, Cash On Hand. It is also available for immediate download and adjustment. So, changes can be made in the color, design, graphics or any other component to create a unique layout.

Five Dimensions Of Multichannel Banking Management Framework Ppt Outline Files PDF
This slide represents the framework showing the five dimensions of omnichannel banking. It includes five dimensions of omnichannel strategy, client focus, organization, steering model and KPI, technology and infrastructure. Persuade your audience using this Five Dimensions Of Multichannel Banking Management Framework Ppt Outline Files PDF. This PPT design covers five stages, thus making it a great tool to use. It also caters to a variety of topics including Omnichannel Strategy, Client Focus, Organization. Download this PPT design now to present a convincing pitch that not only emphasizes the topic but also showcases your presentation skills.
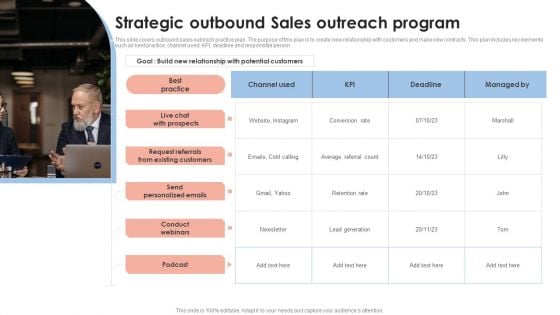
Strategic Outbound Sales Outreach Program Rules PDF
This slide covers outbound sales outreach practice plan. The purpose of this plan is to create new relationship with customers and make new contracts. This plan includes key elements such as best practice, channel used, KPI, deadline and responsible person. Persuade your audience using this Strategic Outbound Sales Outreach Program Rules PDF. This PPT design covers one stages, thus making it a great tool to use. It also caters to a variety of topics including Best Practice, Send Personalized Emails, Conduct Webinars. Download this PPT design now to present a convincing pitch that not only emphasizes the topic but also showcases your presentation skills.


 Continue with Email

 Home
Home


