Kpi Performance Employee
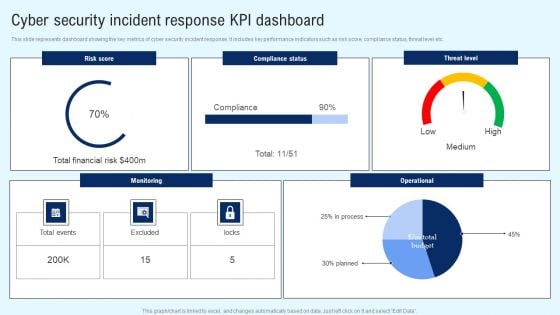
Implementing Cyber Security Incident Cyber Security Incident Response KPI Dashboard Clipart PDF
This slide represents dashboard showing the key metrics of cyber security incident response. It includes key performance indicators such as risk score, compliance status, threat level etc. There are so many reasons you need a Implementing Cyber Security Incident Cyber Security Incident Response KPI Dashboard Clipart PDF. The first reason is you cannot spend time making everything from scratch, Thus, Slidegeeks has made presentation templates for you too. You can easily download these templates from our website easily.
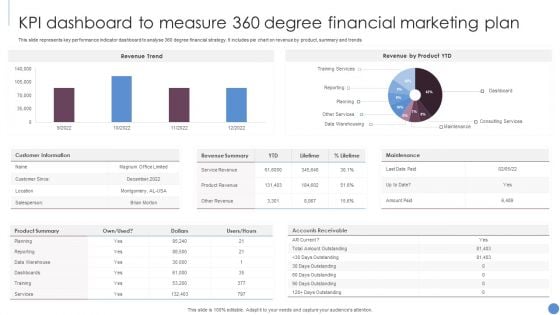
KPI Dashboard To Measure 360 Degree Financial Marketing Plan Slides PDF
This slide represents key performance indicator dashboard to analyse 360 degree financial strategy. It includes pie chart on revenue by product, summary and trends. Showcasing this set of slides titled KPI Dashboard To Measure 360 Degree Financial Marketing Plan Slides PDF. The topics addressed in these templates are Revenue Trend, Revenue Product YTD, Customer Information. All the content presented in this PPT design is completely editable. Download it and make adjustments in color, background, font etc. as per your unique business setting.
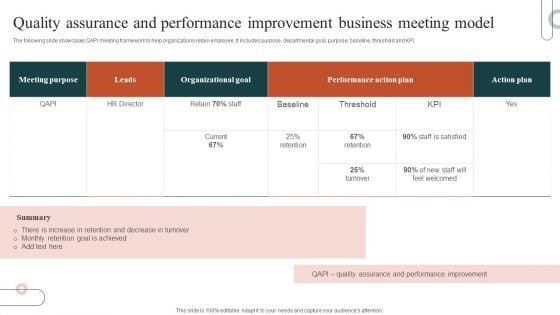
Quality Assurance And Performance Improvement Business Meeting Model Background PDF
The following slide showcases QAPI meeting framework to help organizations retain employee. It includes purpose, departmental goal, purpose, baseline, threshold and KPI. Showcasing this set of slides titled Quality Assurance And Performance Improvement Business Meeting Model Background PDF. The topics addressed in these templates are Organizational Goal, Performance Action Plan, Action Plan. All the content presented in this PPT design is completely editable. Download it and make adjustments in color, background, font etc. as per your unique business setting.
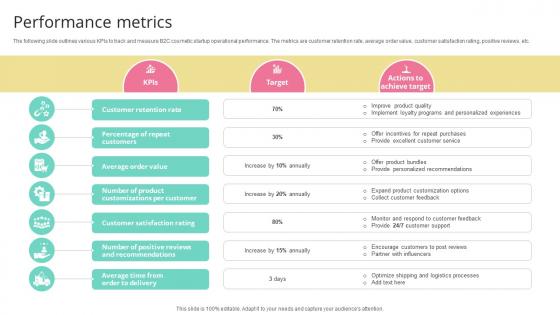
Performance Metrics Skincare Startup GTM Strategy GTM SS V
The following slide outlines various KPIs to track and measure B2C cosmetic startup operational performance. The metrics are customer retention rate, average order value, customer satisfaction rating, positive reviews, etc.Make sure to capture your audiences attention in your business displays with our gratis customizable Performance Metrics Skincare Startup GTM Strategy GTM SS V. These are great for business strategies, office conferences, capital raising or task suggestions. If you desire to acquire more customers for your tech business and ensure they stay satisfied, create your own sales presentation with these plain slides. The following slide outlines various KPIs to track and measure B2C cosmetic startup operational performance. The metrics are customer retention rate, average order value, customer satisfaction rating, positive reviews, etc.

Carbon Usage Effectiveness Cue Performance Metric Eco Friendly Computing IT
This slide outlines the overview of carbon usage effectiveness performance matric of a green data center. The purpose of this slide is to give an overview of the metric, including its calculation method and two types of certifications such as Leadership in Energy and Environmental Design LEED and Energy Star.Create an editable Carbon Usage Effectiveness Cue Performance Metric Eco Friendly Computing IT that communicates your idea and engages your audience. Whether you are presenting a business or an educational presentation, pre-designed presentation templates help save time. Carbon Usage Effectiveness Cue Performance Metric Eco Friendly Computing IT is highly customizable and very easy to edit, covering many different styles from creative to business presentations. Slidegeeks has creative team members who have crafted amazing templates. So, go and get them without any delay. This slide outlines the overview of carbon usage effectiveness performance matric of a green data center. The purpose of this slide is to give an overview of the metric, including its calculation method and two types of certifications such as Leadership in Energy and Environmental Design ,LEED and Energy Star.

Performance Metrics Smart Home Startup GTM Strategy GTM SS V
The following slide outlines various KPIs to track and measure smart home automation startup operational performance. The metrics are CAC, CLTV, churn rate MRR, ARPU, etc.Welcome to our selection of the Performance Metrics Smart Home Startup GTM Strategy GTM SS V. These are designed to help you showcase your creativity and bring your sphere to life. Planning and Innovation are essential for any business that is just starting out. This collection contains the designs that you need for your everyday presentations. All of our PowerPoints are 100 percent editable, so you can customize them to suit your needs. This multi-purpose template can be used in various situations. Grab these presentation templates today. The following slide outlines various KPIs to track and measure smart home automation startup operational performance. The metrics are CAC, CLTV, churn rate MRR, ARPU, etc.
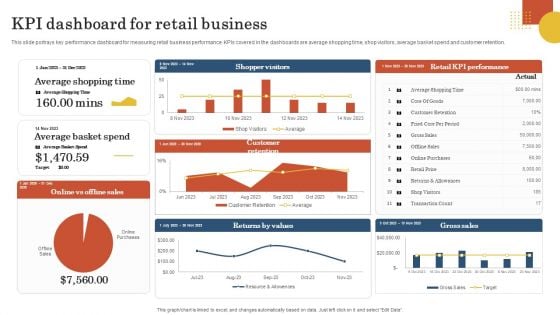
Retail Business Operation Management To Optimize Customer Experience KPI Dashboard For Retail Business Download PDF
This slide portrays key performance dashboard for measuring retail business performance. KPIs covered in the dashboards are average shopping time, shop visitors, average basket spend and customer retention. Are you in need of a template that can accommodate all of your creative concepts This one is crafted professionally and can be altered to fit any style. Use it with Google Slides or PowerPoint. Include striking photographs, symbols, depictions, and other visuals. Fill, move around, or remove text boxes as desired. Test out color palettes and font mixtures. Edit and save your work, or work with colleagues. Download Retail Business Operation Management To Optimize Customer Experience KPI Dashboard For Retail Business Download PDF and observe how to make your presentation outstanding. Give an impeccable presentation to your group and make your presentation unforgettable.
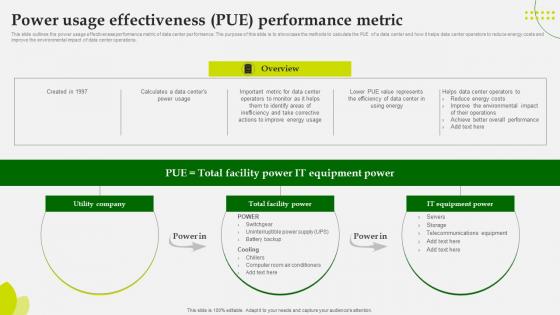
Green Computing Power Usage Effectiveness Pue Performance Metric
This slide outlines the power usage effectiveness performance metric of data center performance. The purpose of this slide is to showcase the methods to calculate the PUE of a data center and how it helps data center operators to reduce energy costs and improve the environmental impact of data center operations. Create an editable Green Computing Power Usage Effectiveness Pue Performance Metric that communicates your idea and engages your audience. Whether you are presenting a business or an educational presentation, pre-designed presentation templates help save time. Green Computing Power Usage Effectiveness Pue Performance Metric is highly customizable and very easy to edit, covering many different styles from creative to business presentations. Slidegeeks has creative team members who have crafted amazing templates. So, go and get them without any delay. This slide outlines the power usage effectiveness performance metric of data center performance. The purpose of this slide is to showcase the methods to calculate the PUE of a data center and how it helps data center operators to reduce energy costs and improve the environmental impact of data center operations.

KPI Dashboard To Track Sales And Operations Process Of Manufacturing Enterprise Brochure PDF
This slide depicts a dashboard to track the key performance metrics in sales and operations process of a manufacturing enterprise to analyze deviations in the actual and planned output. The key performing indicators are percentage deviation, dollar deviation, inventory in hand etc.Pitch your topic with ease and precision using this KPI Dashboard To Track Sales And Operations Process Of Manufacturing Enterprise Brochure PDF. This layout presents information on Planned Output, Yearly Growth, Inventory Hand. It is also available for immediate download and adjustment. So, changes can be made in the color, design, graphics or any other component to create a unique layout.

Information Technology Security KPI With Measures Taken By The Company Formats PDF
This slide covers the KPIs of the company used for the security of data or privacy of the customers or businesss own confidential information. It also includes the things that is to be covered under each KPI. Some of them are NHT, days to patch, intrusion attempts ,etc. Presenting Information Technology Security KPI With Measures Taken By The Company Formats PDF to dispense important information. This template comprises three stages. It also presents valuable insights into the topics including Key Performance Indicators, Measures Taken, Intrusion Attempts. This is a completely customizable PowerPoint theme that can be put to use immediately. So, download it and address the topic impactfully.
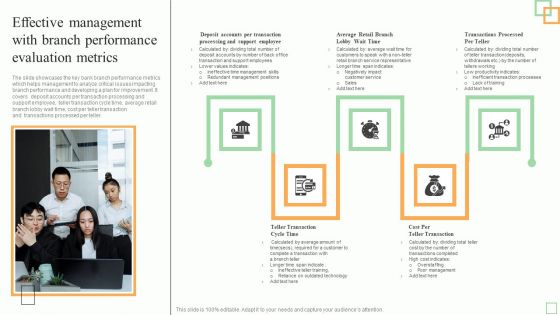
Effective Management With Branch Performance Evaluation Metrics Information PDF
The slide showcases the key bank branch performance metrics which helps management to analyze critical issues impacting branch performance and developing a plan for improvement. It covers deposit accounts per transaction processing and support employee, teller transaction cycle time, average retail branch lobby wait time, cost per teller transaction and transactions processed per teller.Presenting Effective Management With Branch Performance Evaluation Metrics Information PDF to dispense important information. This template comprises five stages. It also presents valuable insights into the topics including Support Employee, Complete Transaction, Outdated Technology. This is a completely customizable PowerPoint theme that can be put to use immediately. So, download it and address the topic impactfully.

Performance Metrics Pastry Shop Market Entry Plan GTM SS V
The following slide outlines various KPIs to track and measure business operational performance The metrics are revenue, sales growth, retention rate, gross profit, inventory turnover, customer feedback, operation efficiency metrics and ROI. Crafting an eye-catching presentation has never been more straightforward. Let your presentation shine with this tasteful yet straightforward Performance Metrics Pastry Shop Market Entry Plan GTM SS V template. It offers a minimalistic and classy look that is great for making a statement. The colors have been employed intelligently to add a bit of playfulness while still remaining professional. Construct the ideal Performance Metrics Pastry Shop Market Entry Plan GTM SS V that effortlessly grabs the attention of your audience Begin now and be certain to wow your customers The following slide outlines various KPIs to track and measure business operational performance The metrics are revenue, sales growth, retention rate, gross profit, inventory turnover, customer feedback, operation efficiency metrics and ROI.
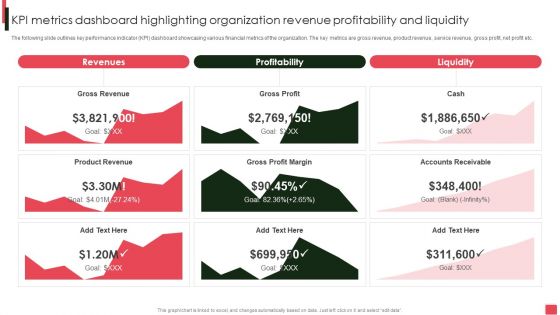
Overview Of Organizational Kpi Metrics Dashboard Highlighting Organization Revenue Brochure PDF
The following slide outlines key performance indicator KPI dashboard showcasing various financial metrics of the organization. The key metrics are gross revenue, product revenue, service revenue, gross profit, net profit etc. If your project calls for a presentation, then Slidegeeks is your go-to partner because we have professionally designed, easy-to-edit templates that are perfect for any presentation. After downloading, you can easily edit Overview Of Organizational Kpi Metrics Dashboard Highlighting Organization Revenue Brochure PDF and make the changes accordingly. You can rearrange slides or fill them with different images. Check out all the handy templates.
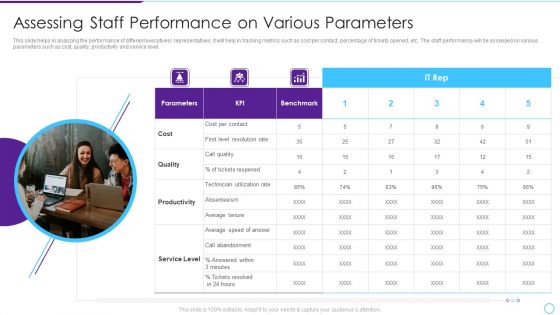
Intelligent Infrastructure Assessing Staff Performance On Various Parameters Summary PDF
This slide helps in analyzing the performance of different executives or representatives. It will help in tracking metrics such as cost per contact, percentage of tickets opened, etc. The staff performance will be assessed on various parameters such as cost, quality, productivity and service level. This is a Intelligent Infrastructure Assessing Staff Performance On Various Parameters Summary PDF template with various stages. Focus and dispense information on three stages using this creative set, that comes with editable features. It contains large content boxes to add your information on topics like Parameters, Cost, KPI, Productivity, Service Level. You can also showcase facts, figures, and other relevant content using this PPT layout. Grab it now.
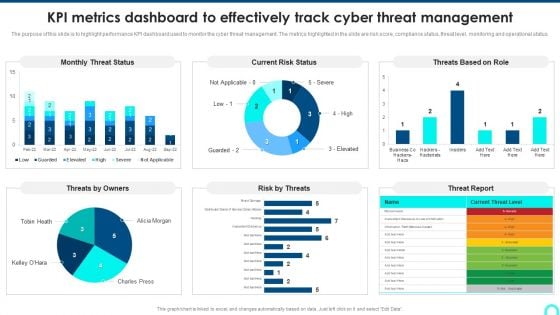
KPI Metrics Dashboard To Effectively Track Cyber Threat Management Demonstration PDF
The purpose of this slide is to highlight performance KPI dashboard used to monitor the cyber threat management. The metrics highlighted in the slide are risk score, compliance status, threat level, monitoring and operational status. Deliver an awe inspiring pitch with this creative KPI Metrics Dashboard To Effectively Track Cyber Threat Management Demonstration PDF bundle. Topics like Threat Status, Current Risk, Threat Report can be discussed with this completely editable template. It is available for immediate download depending on the needs and requirements of the user.
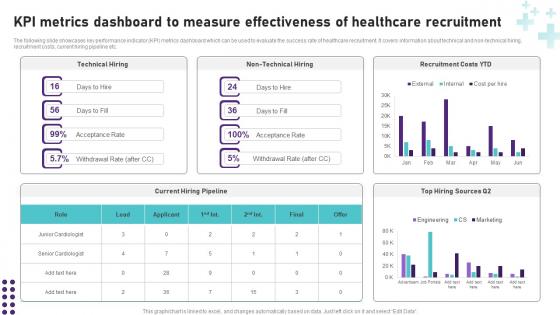
KPI Metrics Dashboard To Measure Healthcare Operational Areas Healthcare Brochure PDF
Retrieve professionally designed KPI Metrics Dashboard To Measure Healthcare Operational Areas Healthcare Brochure PDF to effectively convey your message and captivate your listeners. Save time by selecting pre-made slideshows that are appropriate for various topics, from business to educational purposes. These themes come in many different styles, from creative to corporate, and all of them are easily adjustable and can be edited quickly. Access them as PowerPoint templates or as Google Slides themes. You do not have to go on a hunt for the perfect presentation because Slidegeeks got you covered from everywhere. The following slide showcases key performance indicator KPI metrics dashboard which can be used to evaluate the success rate of healthcare recruitment. It covers information about technical and non-technical hiring, recruitment costs, current hiring pipeline etc.
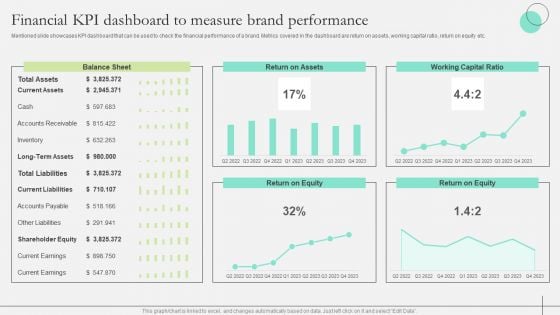
Comprehensive Guide To Strengthen Brand Equity Financial KPI Dashboard Measure Brand Structure PDF
Mentioned slide showcases KPI dashboard that can be used to check the financial performance of a brand. Metrics covered in the dashboard are return on assets, working capital ratio, return on equity etc. Take your projects to the next level with our ultimate collection of Comprehensive Guide To Strengthen Brand Equity Financial KPI Dashboard Measure Brand Structure PDF. Slidegeeks has designed a range of layouts that are perfect for representing task or activity duration, keeping track of all your deadlines at a glance. Tailor these designs to your exact needs and give them a truly corporate look with your own brand colors they will make your projects stand out from the rest
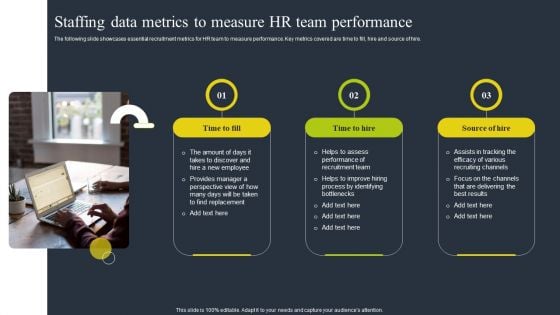
Staffing Data Metrics To Measure HR Team Performance Graphics PDF
The following slide showcases essential recruitment metrics for HR team to measure performance. Key metrics covered are time to fill, hire and source of hire. Presenting Staffing Data Metrics To Measure HR Team Performance Graphics PDF to dispense important information. This template comprises three stages. It also presents valuable insights into the topics including Employee, Recruitment Team, Recruiting Channels. This is a completely customizable PowerPoint theme that can be put to use immediately. So, download it and address the topic impactfully.
Personalized Email Marketing Campaign Kpi Dashboard Guide For Data Driven Advertising Icons Pdf
This slide represents the key performance metrics to dashboard to monitor and analyze progress of personalized email marketing campaign conducted by the enterprise. It includes details related to KPIs such as wen conversions, subscribers, list growth rate etc.Coming up with a presentation necessitates that the majority of the effort goes into the content and the message you intend to convey. The visuals of a PowerPoint presentation can only be effective if it supplements and supports the story that is being told. Keeping this in mind our experts created Personalized Email Marketing Campaign Kpi Dashboard Guide For Data Driven Advertising Icons Pdf to reduce the time that goes into designing the presentation. This way, you can concentrate on the message while our designers take care of providing you with the right template for the situation. This slide represents the key performance metrics to dashboard to monitor and analyze progress of personalized email marketing campaign conducted by the enterprise. It includes details related to KPIs such as wen conversions, subscribers, list growth rate etc.
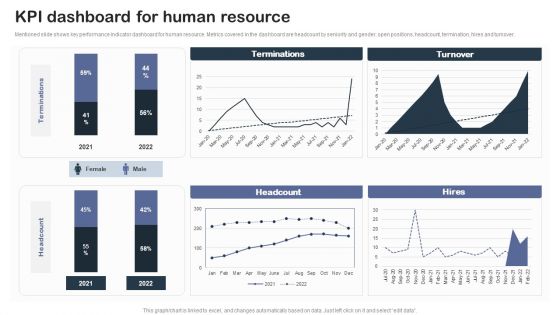
Staff Succession Planning And Development Strategy Kpi Dashboard For Human Clipart PDF
Mentioned slide shows key performance indicator dashboard for human resource. Metrics covered in the dashboard are headcount by seniority and gender, open positions, headcount, termination, hires and turnover.If your project calls for a presentation, then Slidegeeks is your go-to partner because we have professionally designed, easy-to-edit templates that are perfect for any presentation. After downloading, you can easily edit Staff Succession Planning And Development Strategy Kpi Dashboard For Human Clipart PDF and make the changes accordingly. You can rearrange slides or fill them with different images. Check out all the handy templates.
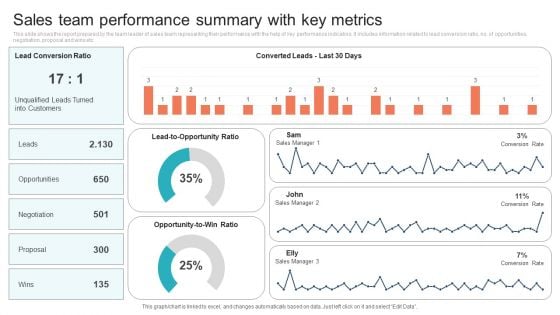
Sales Team Performance Summary With Key Metrics Background PDF
This slide shows the report prepared by the team leader of sales team representing their performance with the help of key performance indicators. It includes information related to lead conversion ratio, no. of opportunities, negotiation, proposal and wins etc. Showcasing this set of slides titled Sales Team Performance Summary With Key Metrics Background PDF. The topics addressed in these templates are Opportunities, Negotiation, Proposal. All the content presented in this PPT design is completely editable. Download it and make adjustments in color, background, font etc. as per your unique business setting.
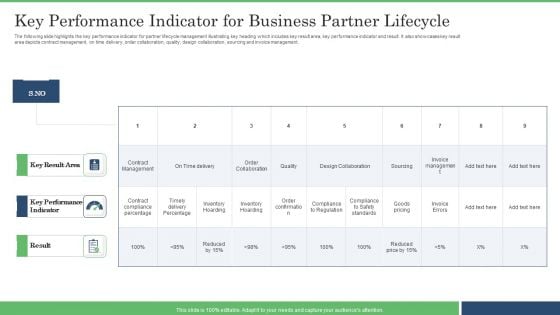
Key Performance Indicator For Business Partner Lifecycle Brochure PDF
The following slide highlights the key performance indicator for partner lifecycle management illustrating key heading which includes key result area, key performance indicator and result. It also showcases key result area depicts contract management, on time delivery, order collaboration, quality, design collaboration, sourcing and invoice management. Showcasing this set of slides titled Key Performance Indicator For Business Partner Lifecycle Brochure PDF. The topics addressed in these templates are Key Performance Indicator, Inventory Hoarding, Design Collaboration. All the content presented in this PPT design is completely editable. Download it and make adjustments in color, background, font etc. as per your unique business setting.
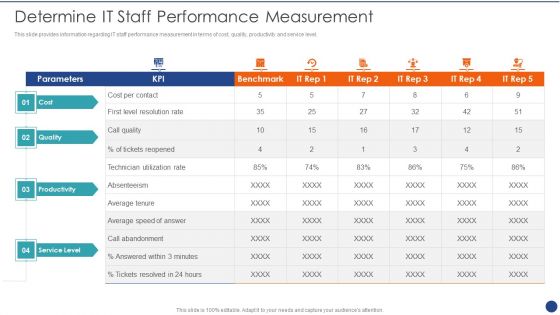
Cios Value Optimization Determine IT Staff Performance Measurement Diagrams PDF
This slide provides information regarding IT staff performance measurement in terms of cost, quality, productivity and service level. Deliver an awe inspiring pitch with this creative Cios Value Optimization Determine IT Staff Performance Measurement Diagrams PDF bundle. Topics like Parameters KPI, Cost Per, Service Level can be discussed with this completely editable template. It is available for immediate download depending on the needs and requirements of the user.
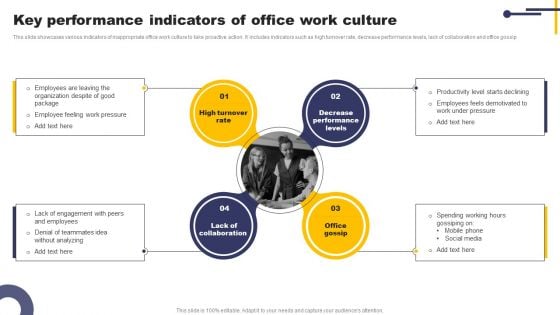
Key Performance Indicators Of Office Work Culture Inspiration PDF
This slide showcases various indicators of inappropriate office work culture to take proactive action. It includes indicators such as high turnover rate, decrease performance levels, lack of collaboration and office gossip. Presenting Key Performance Indicators Of Office Work Culture Inspiration PDF to dispense important information. This template comprises four stages. It also presents valuable insights into the topics including High Turnover Rate, Decrease Performance Levels, Office Gossip. This is a completely customizable PowerPoint theme that can be put to use immediately. So, download it and address the topic impactfully.
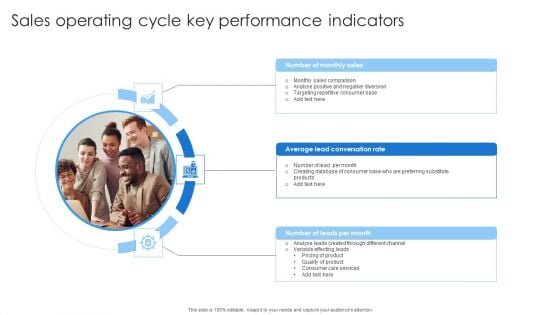
Sales Operating Cycle Key Performance Indicators Professional PDF
Presenting Sales Operating Cycle Key Performance Indicators Professional PDF to dispense important information. This template comprises three stages. It also presents valuable insights into the topics including Sales Comparison, Lead Conversation, Quality Product. This is a completely customizable PowerPoint theme that can be put to use immediately. So, download it and address the topic impactfully.
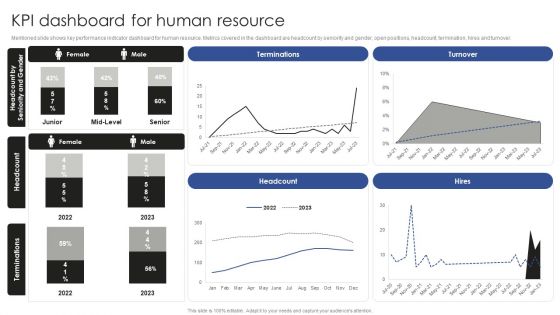
Talent Administration And Succession KPI Dashboard For Human Resource Rules PDF
Mentioned slide shows key performance indicator dashboard for human resource. Metrics covered in the dashboard are headcount by seniority and gender, open positions, headcount, termination, hires and turnover. If your project calls for a presentation, then Slidegeeks is your go-to partner because we have professionally designed, easy-to-edit templates that are perfect for any presentation. After downloading, you can easily edit Talent Administration And Succession KPI Dashboard For Human Resource Rules PDF and make the changes accordingly. You can rearrange slides or fill them with different images. Check out all the handy templates
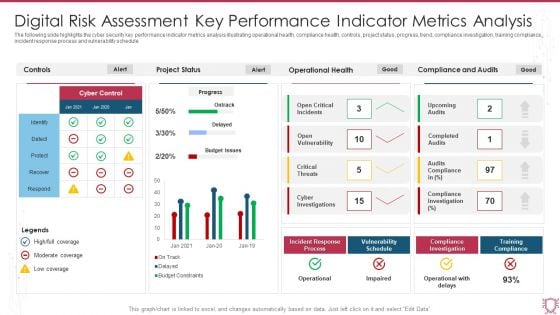
Digital Risk Assessment Key Performance Indicator Metrics Analysis Infographics PDF
The following slide highlights the cyber security key performance indicator metrics analysis illustrating operational health, compliance health, controls, project status, progress, trend, compliance investigation, training compliance, incident response process and vulnerability schedule. Showcasing this set of slides titled Digital Risk Assessment Key Performance Indicator Metrics Analysis Infographics PDF. The topics addressed in these templates are Project Status, Operational Health, Compliance And Audits. All the content presented in this PPT design is completely editable. Download it and make adjustments in color, background, font etc. as per your unique business setting.
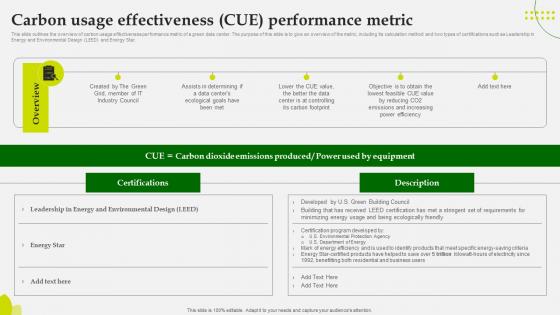
Green Computing Carbon Usage Effectiveness Cue Performance Metric
This slide outlines the overview of carbon usage effectiveness performance matric of a green data center. The purpose of this slide is to give an overview of the metric, including its calculation method and two types of certifications such as Leadership in Energy and Environmental Design LEED and Energy Star. Create an editable Green Computing Carbon Usage Effectiveness Cue Performance Metric that communicates your idea and engages your audience. Whether you are presenting a business or an educational presentation, pre-designed presentation templates help save time. Green Computing Carbon Usage Effectiveness Cue Performance Metric is highly customizable and very easy to edit, covering many different styles from creative to business presentations. Slidegeeks has creative team members who have crafted amazing templates. So, go and get them without any delay. This slide outlines the overview of carbon usage effectiveness performance matric of a green data center. The purpose of this slide is to give an overview of the metric, including its calculation method and two types of certifications such as Leadership in Energy and Environmental Design LEED and Energy Star.
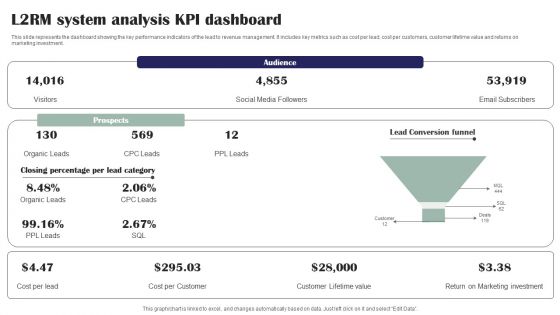
L2RM System Analysis KPI Dashboard Ppt PowerPoint Presentation File Microsoft PDF
This slide represents the dashboard showing the key performance indicators of the lead to revenue management. It includes key metrics such as cost per lead, cost per customers, customer lifetime value and returns on marketing investment. Presenting L2RM System Analysis KPI Dashboard Ppt PowerPoint Presentation File Microsoft PDF to dispense important information. This template comprises one stages. It also presents valuable insights into the topics including Audience, Prospects, Lead Conversion Funnel. This is a completely customizable PowerPoint theme that can be put to use immediately. So, download it and address the topic impactfully.
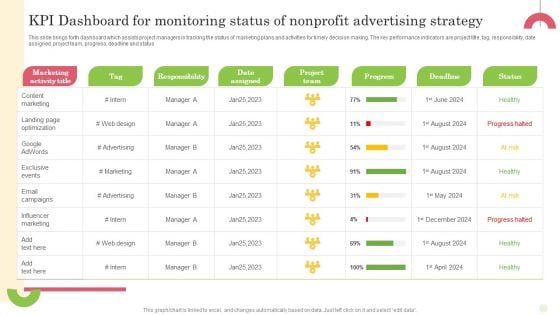
Kpi Dashboard For Monitoring Status Of Nonprofit Advertising Strategy Portrait PDF
This slide brings forth dashboard which assists project managers in tracking the status of marketing plans and activities for timely decision making. The key performance indicators are project title, tag, responsibility, date assigned, project team, progress, deadline and status Pitch your topic with ease and precision using this Kpi Dashboard For Monitoring Status Of Nonprofit Advertising Strategy Portrait PDF. This layout presents information on Tag, Responsibility, Date Assigned. It is also available for immediate download and adjustment. So, changes can be made in the color, design, graphics or any other component to create a unique layout.
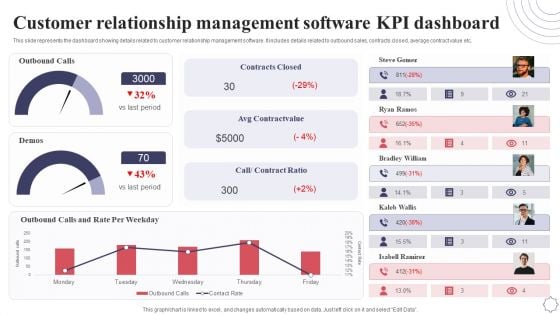
Customer Relationship Management Software KPI Dashboard Application Deployment Project Plan Infographics PDF
This slide represents the dashboard showing details related to customer relationship management software. It includes details related to outbound sales, contracts closed, average contract value etc. From laying roadmaps to briefing everything in detail, our templates are perfect for you. You can set the stage with your presentation slides. All you have to do is download these easy to edit and customizable templates. Customer Relationship Management Software KPI Dashboard Application Deployment Project Plan Infographics PDF will help you deliver an outstanding performance that everyone would remember and praise you for. Do download this presentation today.
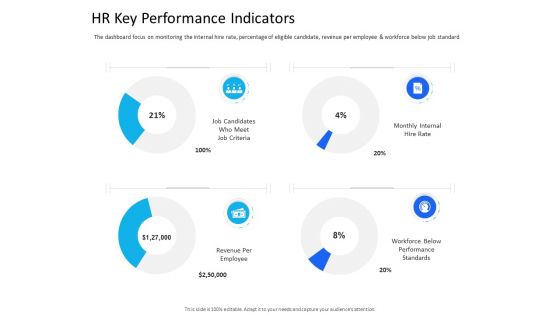
Organization Manpower Management Technology HR Key Performance Indicators Graphics PDF
Deliver an awe inspiring pitch with this creative organization manpower management technology hr key performance indicators graphics pdf bundle. Topics like criteria, workforce, performance, revenue, internal can be discussed with this completely editable template. It is available for immediate download depending on the needs and requirements of the user.
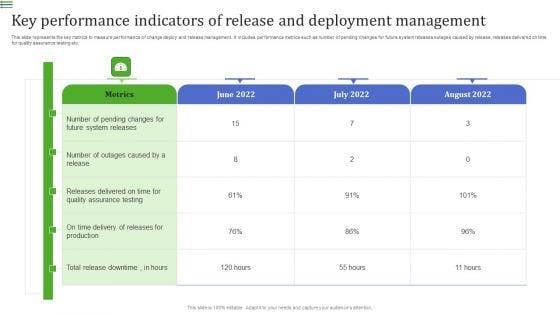
Key Performance Indicators Of Release And Deployment Management Demonstration PDF
This slide represents the key metrics to measure performance of change deploy and release management. It includes performance metrics such as number of pending changes for future system releases outages caused by release, releases delivered on time for quality assurance testing etc.Pitch your topic with ease and precision using this Key Performance Indicators Of Release And Deployment Management Demonstration PDF. This layout presents information on System Releases, Assurance Testing, Outages Caused. It is also available for immediate download and adjustment. So, changes can be made in the color, design, graphics or any other component to create a unique layout.
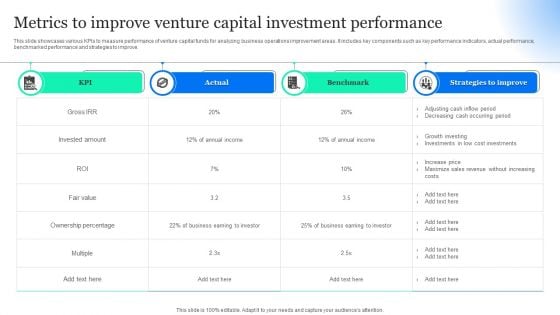
Metrics To Improve Venture Capital Investment Performance Information PDF
This slide showcases various KPIs to measure performance of venture capital funds for analyzing business operations improvement areas. It includes key components such as key performance indicators, actual performance, benchmarked performance and strategies to improve. Pitch your topic with ease and precision using this Metrics To Improve Venture Capital Investment Performance Information PDF. This layout presents information on Actual, Strategies Improve, Benchmark. It is also available for immediate download and adjustment. So, changes can be made in the color, design, graphics or any other component to create a unique layout.
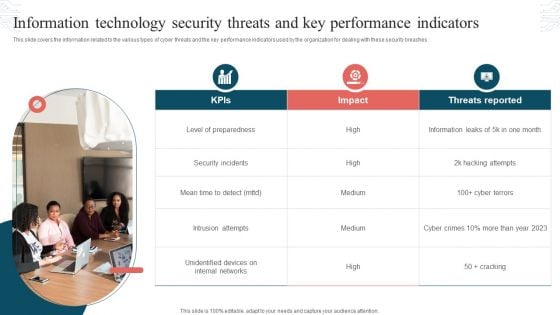
Information Technology Security Threats And Key Performance Indicators Formats PDF
This slide covers the information related to the various types of cyber threats and the key performance indicators used by the organization for dealing with these security breaches. Presenting Information Technology Security Threats And Key Performance Indicators Formats PDF to dispense important information. This template comprises three stages. It also presents valuable insights into the topics including Threats Reported, Security Incidents, Intrusion Attempts. This is a completely customizable PowerPoint theme that can be put to use immediately. So, download it and address the topic impactfully.
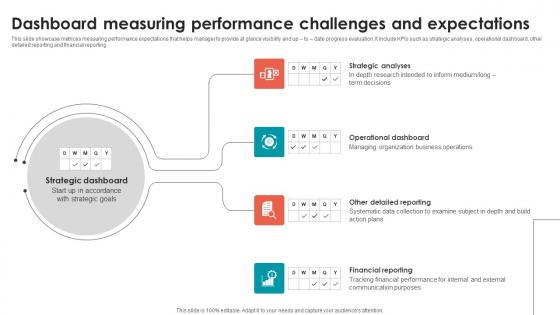
Dashboard Measuring Performance Challenges And Expectations Portrait Pdf
This slide showcase metrices measuring performance expectations that helps manager to provide at glance visibility and up to date progress evaluation. It include KPIs such as strategic analyses, operational dashboard, other detailed reporting and financial reporting. Showcasing this set of slides titled Dashboard Measuring Performance Challenges And Expectations Portrait Pdf. The topics addressed in these templates are Operational Dashboard, Strategic Analyses, Financial Reporting. All the content presented in this PPT design is completely editable. Download it and make adjustments in color, background, font etc. as per your unique business setting. This slide showcase metrices measuring performance expectations that helps manager to provide at glance visibility and up to date progress evaluation. It include KPIs such as strategic analyses, operational dashboard, other detailed reporting and financial reporting.
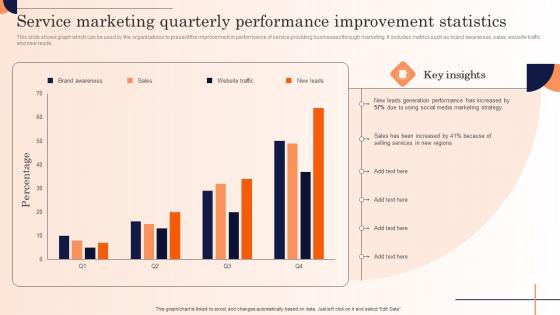
Service Marketing Quarterly Performance Strategic Marketing Campaign Demonstration Pdf
This slide shows graph which can be used by the organizations to present the improvement in performance of service providing businesses through marketing. It includes metrics such as brand awareness, sales, website traffic and new leads.Take your projects to the next level with our ultimate collection of Service Marketing Quarterly Performance Strategic Marketing Campaign Demonstration Pdf. Slidegeeks has designed a range of layouts that are perfect for representing task or activity duration, keeping track of all your deadlines at a glance. Tailor these designs to your exact needs and give them a truly corporate look with your own brand colors they all make your projects stand out from the rest. This slide shows graph which can be used by the organizations to present the improvement in performance of service providing businesses through marketing. It includes metrics such as brand awareness, sales, website traffic and new leads.
Key Performance Indicators For Smarketing Ppt Icon Graphic Images PDF
This slide shows various KPIs which can be used to measure marketing and sales alignment. These are overall revenue, sales cycle length, marketing qualified leads, etc. Presenting Key Performance Indicators For Smarketing Ppt Icon Graphic Images PDF to dispense important information. This template comprises one stages. It also presents valuable insights into the topics including KPIs, Overall Revenue, Sales Cycle Length. This is a completely customizable PowerPoint theme that can be put to use immediately. So, download it and address the topic impactfully.
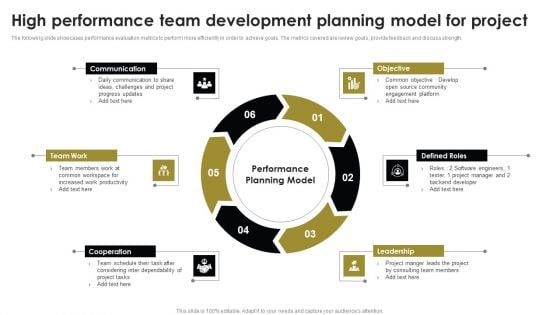
High Performance Team Development Planning Model For Project Brochure PDF
The following slide showcases performance evaluation metrics to perform more efficiently in order to achieve goals. The metrics covered are review goals, provide feedback and discuss strength. Presenting High Performance Team Development Planning Model For Project Brochure PDF to dispense important information. This template comprises six stages. It also presents valuable insights into the topics including Communication, Performance Planning Model, Leadership. This is a completely customizable PowerPoint theme that can be put to use immediately. So, download it and address the topic impactfully.
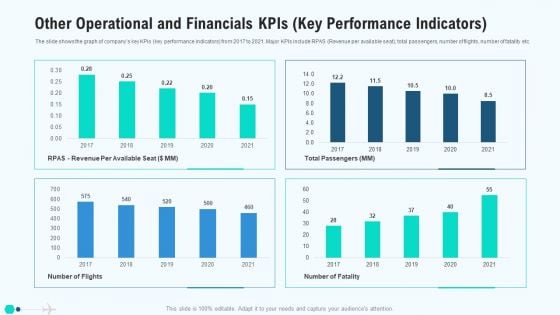
Other Operational And Financials Kpis Key Performance Indicators Clipart PDF
The slide shows the graph of companys key KPIs key performance indicators from 2017 to 2021. Major KPIs include RPAS Revenue per available seat, total passengers, number of flights, number of fatality etc. Deliver an awe inspiring pitch with this creative other operational and financials kpis key performance indicators clipart pdf bundle. Topics like other operational and financials kpis key performance indicators can be discussed with this completely editable template. It is available for immediate download depending on the needs and requirements of the user.
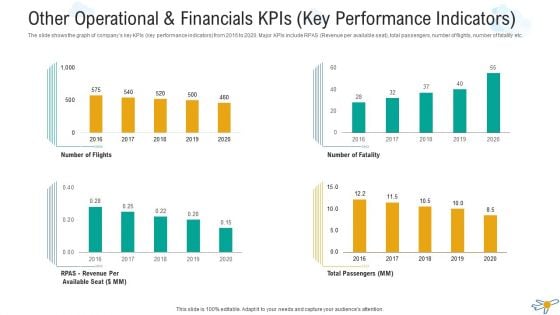
Other Operational And Financials Kpis Key Performance Indicators Professional PDF
The slide shows the graph of companys key KPIs key performance indicators from 2016 to 2020. Major KPIs include RPAS Revenue per available seat, total passengers, number of flights, number of fatality etc. Deliver an awe-inspiring pitch with this creative other operational and financials kpis key performance indicators professional pdf bundle. Topics like other operational and financials kpis key performance indicators can be discussed with this completely editable template. It is available for immediate download depending on the needs and requirements of the user.
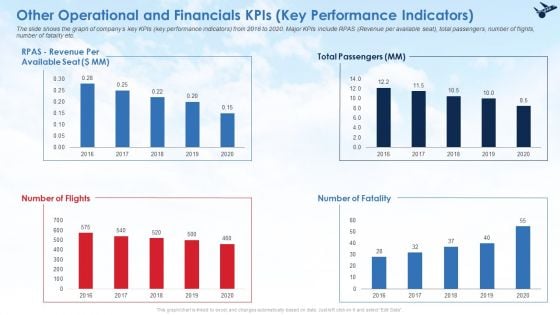
Other Operational And Financials Kpis Key Performance Indicators Ideas PDF
The slide shows the graph of companys key KPIs key performance indicators from 2016 to 2020. Major KPIs include RPAS Revenue per available seat, total passengers, number of flights, number of fatality etc. Deliver an awe inspiring pitch with this creative other operational and financials kpis key performance indicators ideas pdf bundle. Topics like other operational and financials kpis key performance indicators can be discussed with this completely editable template. It is available for immediate download depending on the needs and requirements of the user.

Call Center Process Key Performance Indicator Dashboard Mockup PDF
This slide showcases call center process measurements and key performance indicators so managers and teams can keep track of and improve performance . It includes received calls, calculating speed of answering calls , ended calls before starting conversations , average calls per minute etc. Showcasing this set of slides titled Call Center Process Key Performance Indicator Dashboard Mockup PDF. The topics addressed in these templates are Received Calls, Conversation, Abandon Rate. All the content presented in this PPT design is completely editable. Download it and make adjustments in color, background, font etc. as per your unique business setting.
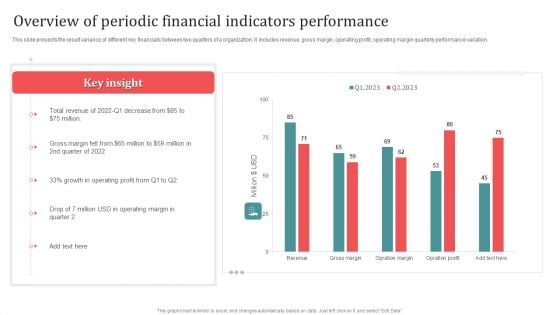
Overview Of Periodic Financial Indicators Performance Designs PDF
This slide presents the result variance of different key financials between two quarters of a organization. It includes revenue, gross margin, operating profit, operating margin quarterly performance variation. Showcasing this set of slides titled Overview Of Periodic Financial Indicators Performance Designs PDF. The topics addressed in these templates are Overview Of Periodic, Financial Indicators Performance. All the content presented in this PPT design is completely editable. Download it and make adjustments in color, background, font etc. as per your unique business setting.
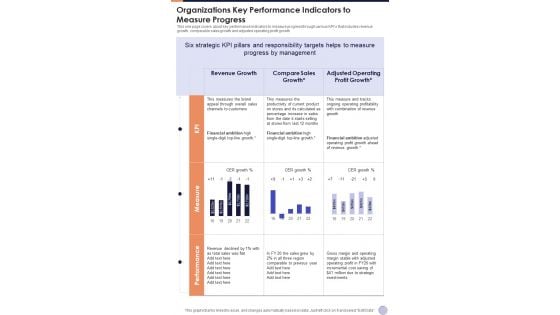
Organizations Key Performance Indicators To Measure Progress One Pager Documents
This one page covers about key performance indicators to measure progress through various KPIs that includes revenue growth, comparable sales growth and adjusted operating profit growth. Presenting you a fantastic Organizations Key Performance Indicators To Measure Progress One Pager Documents. This piece is crafted on hours of research and professional design efforts to ensure you have the best resource. It is completely editable and its design allow you to rehash its elements to suit your needs. Get this Organizations Key Performance Indicators To Measure Progress One Pager Documents A4 One-pager now.
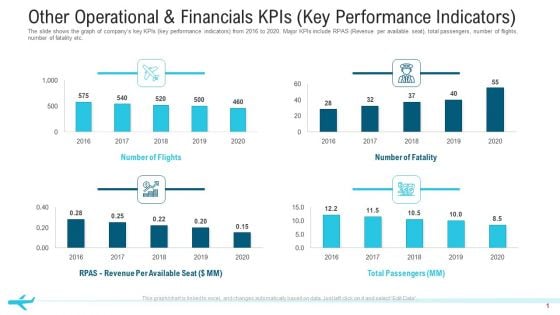
Other Operational And Financials Kpis Key Performance Indicators Structure PDF
The slide shows the graph of companys key KPIs key performance indicators from 2016 to 2020. Major KPIs include RPAS Revenue per available seat, total passengers, number of flights, number of fatality etc.Deliver an awe-inspiring pitch with this creative other operational and financials KPIs key performance indicators structure pdf. bundle. Topics like total passengers, number of flights,2016 to 2020 can be discussed with this completely editable template. It is available for immediate download depending on the needs and requirements of the user.
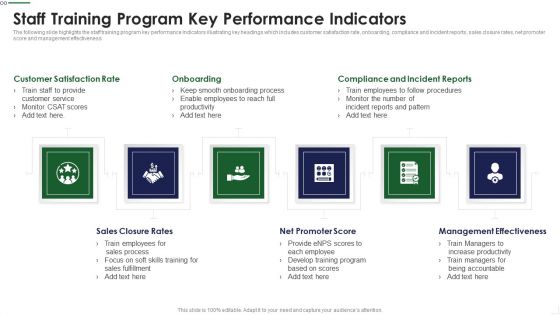
Staff Training Program Key Performance Indicators Diagrams PDF
The following slide highlights the staff training program key performance Indicators illustrating key headings which includes customer satisfaction rate, onboarding, compliance and incident reports, sales closure rates, net promoter score and management effectiveness Presenting Staff Training Program Key Performance Indicators Diagrams PDF to provide visual cues and insights. Share and navigate important information on six stages that need your due attention. This template can be used to pitch topics like Turnover Quarter, Turnover Type, Turnover Reasons In addtion, this PPT design contains high resolution images, graphics, etc, that are easily editable and available for immediate download.
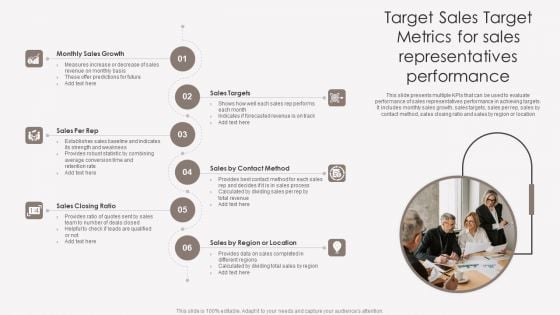
Target Sales Target Metrics For Sales Representatives Performance Ideas PDF
This slide presents multiple KPIs that can be used to evaluate performance of sales representatives performance in achieving targets. It includes monthly sales growth, sales targets, sales per rep, sales by contact method, sales closing ratio and sales by region or location. Persuade your audience using this Target Sales Target Metrics For Sales Representatives Performance Ideas PDF. This PPT design covers six stages, thus making it a great tool to use. It also caters to a variety of topics including Monthly Sales Growth, Sales Closing Ratio, Region Or Location. Download this PPT design now to present a convincing pitch that not only emphasizes the topic but also showcases your presentation skills.
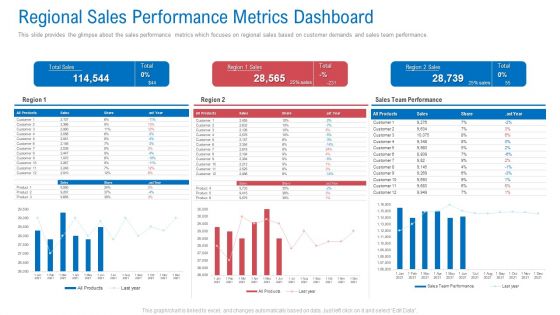
Regional Marketing Planning Regional Sales Performance Metrics Dashboard Information PDF
This slide provides the glimpse about the sales performance metrics which focuses on regional sales based on customer demands and sales team performance. Deliver an awe inspiring pitch with this creative regional marketing planning regional sales performance metrics dashboard information pdf bundle. Topics like regional sales performance metrics dashboard can be discussed with this completely editable template. It is available for immediate download depending on the needs and requirements of the user.

Market Area Analysis Regional Sales Performance Metrics Dashboard Designs PDF
This slide provides the glimpse about the sales performance metrics which focuses on regional sales based on customer demands and sales team performance. Deliver and pitch your topic in the best possible manner with this market area analysis regional sales performance metrics dashboard designs pdf. Use them to share invaluable insights on regional sales performance metrics dashboard and impress your audience. This template can be altered and modified as per your expectations. So, grab it now.

Regional Marketing Strategies Regional Sales Performance Metrics Dashboard Infographics PDF
This slide provides the glimpse about the sales performance metrics which focuses on regional sales based on customer demands and sales team performance. Deliver and pitch your topic in the best possible manner with this regional marketing strategies regional sales performance metrics dashboard infographics pdf. Use them to share invaluable insights on regional sales performance metrics dashboard and impress your audience. This template can be altered and modified as per your expectations. So, grab it now.
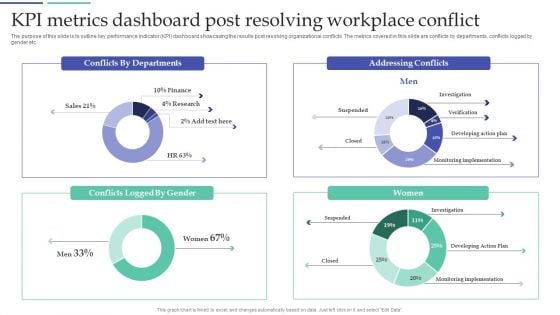
Resolving Team Disputes In Organization KPI Metrics Dashboard Post Resolving Workplace Conflict Pictures PDF
The purpose of this slide is to outline key performance indicator KPI dashboard showcasing the results post resolving organizational conflicts. The metrics covered in this slide are conflicts by departments, conflicts logged by gender etc. Get a simple yet stunning designed Resolving Team Disputes In Organization KPI Metrics Dashboard Post Resolving Workplace Conflict Pictures PDF. It is the best one to establish the tone in your meetings. It is an excellent way to make your presentations highly effective. So, download this PPT today from Slidegeeks and see the positive impacts. Our easy to edit Resolving Team Disputes In Organization KPI Metrics Dashboard Post Resolving Workplace Conflict Pictures PDF can be your go-to option for all upcoming conferences and meetings. So, what are you waiting for Grab this template today.
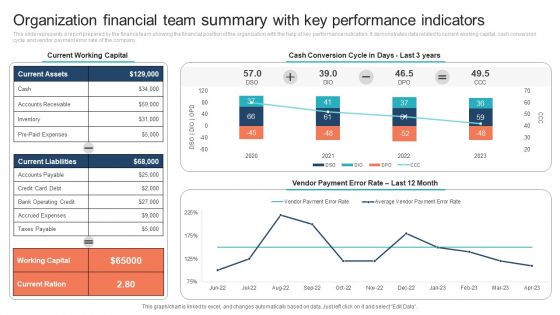
Organization Financial Team Summary With Key Performance Indicators Clipart PDF
This slide represents a report prepared by the finance team showing the financial position of the organization with the help of key performance indicators. It demonstrates data related to current working capital, cash conversion cycle and vendor payment error rate of the company. Pitch your topic with ease and precision using this Organization Financial Team Summary With Key Performance Indicators Clipart PDF. This layout presents information on Current Working Capital, Cash Conversion Cycle. It is also available for immediate download and adjustment. So, changes can be made in the color, design, graphics or any other component to create a unique layout.
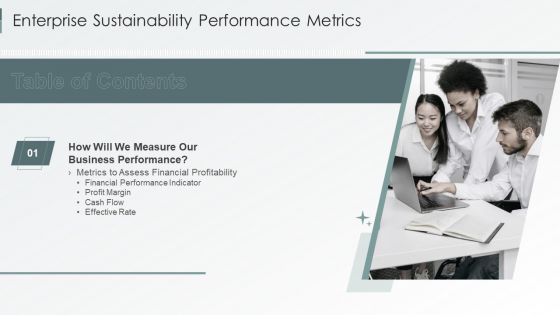
Table Of Contents Enterprise Sustainability Performance Metrics Rules Pictures PDF
This is a Table Of Contents Enterprise Sustainability Performance Metrics Rules Pictures PDF template with various stages. Focus and dispense information on one stage using this creative set, that comes with editable features. It contains large content boxes to add your information on topics like Business Performance, Assess Financial, Performance Indicator. You can also showcase facts, figures, and other relevant content using this PPT layout. Grab it now.
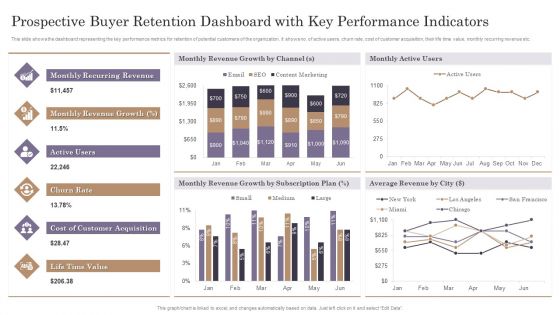
Prospective Buyer Retention Dashboard With Key Performance Indicators Themes PDF
This slide shows the dashboard representing the key performance metrics for retention of potential customers of the organization. It shows no. of active users, churn rate, cost of customer acquisition, their life time value, monthly recurring revenue etc.Pitch your topic with ease and precision using this Prospective Buyer Retention Dashboard With Key Performance Indicators Themes PDF. This layout presents information on Recurring Revenue, Revenue Growth, Customer Acquisition. It is also available for immediate download and adjustment. So, changes can be made in the color, design, graphics or any other component to create a unique layout.
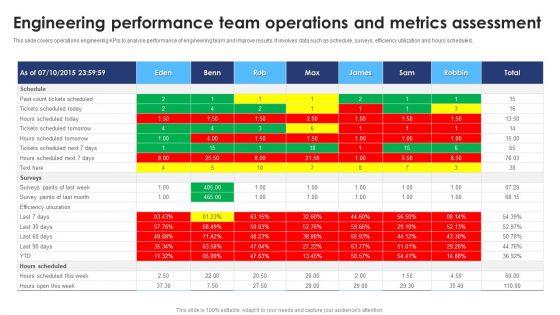
Engineering Performance Team Operations And Metrics Assessment Demonstration PDF
This slide covers operations engineering KPIs to analyse performance of engineering team and improve results. It involves data such as schedule, surveys, efficiency utilization and hours scheduled. Showcasing this set of slides titled Engineering Performance Team Operations And Metrics Assessment Demonstration PDF. The topics addressed in these templates are Engineering Performance Team Operations, Metrics Assessment. All the content presented in this PPT design is completely editable. Download it and make adjustments in color, background, font etc. as per your unique business setting.
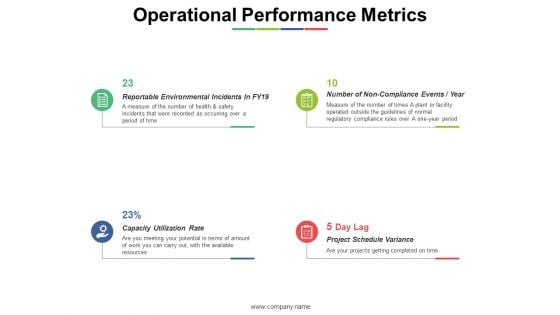
Operational Performance Metrics Ppt PowerPoint Presentation Styles Inspiration
This is a operational performance metrics ppt powerpoint presentation styles inspiration. This is a four stage process. The stages in this process are capacity utilization rate, project schedule variance, operational performance metrics.
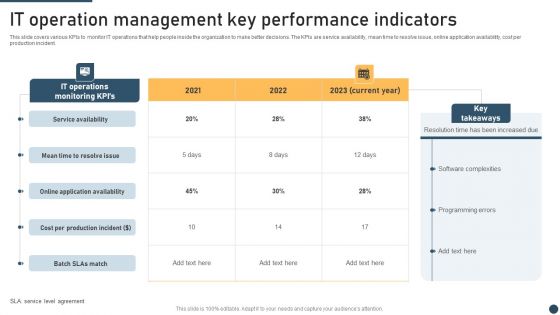
It Operation Management Key Performance Indicators Template PDF
This slide covers various KPIs to monitor IT operations that help people inside the organization to make better decisions. The KPIs are service availability, mean time to resolve issue, online application availability, cost per production incident. Showcasing this set of slides titled It Operation Management Key Performance Indicators Template PDF. The topics addressed in these templates are Service Availability, Cost Per Production, Performance Indicators. All the content presented in this PPT design is completely editable. Download it and make adjustments in color, background, font etc. as per your unique business setting.
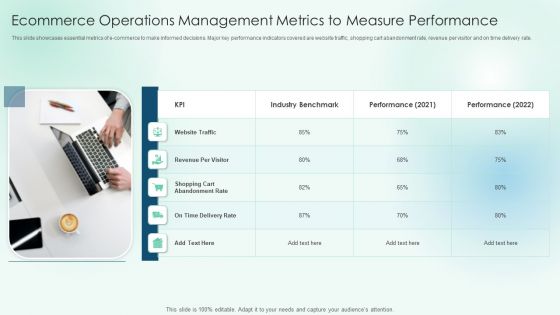
Ecommerce Operations Management Metrics To Measure Performance Professional PDF
This slide showcases essential metrics of e-commerce to make informed decisions. Major key performance indicators covered are website traffic, shopping cart abandonment rate, revenue per visitor and on time delivery rate. Presenting Ecommerce Operations Management Metrics To Measure Performance Professional PDF to dispense important information. This template comprises one stage. It also presents valuable insights into the topics including Abandonment Rate, Industry Benchmark, Performance. This is a completely customizable PowerPoint theme that can be put to use immediately. So, download it and address the topic impactfully.
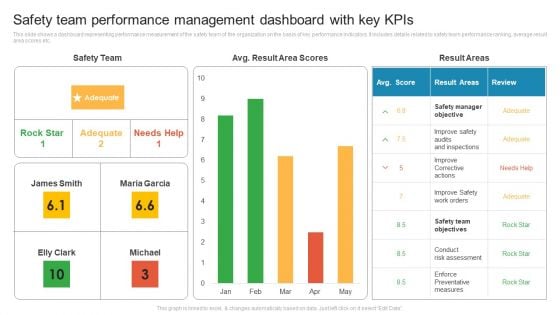
Safety Team Performance Management Dashboard With Key Kpis Rules PDF
This slide shows a dashboard representing performance measurement of the safety team of the organization on the basis of key performance indicators. It includes details related to safety team performance ranking, average result area scores etc. Pitch your topic with ease and precision using this Safety Team Performance Management Dashboard With Key Kpis Rules PDF. This layout presents information on Improve Corrective Actions, Safety Manager Objective, Conduct Risk Assessment. It is also available for immediate download and adjustment. So, changes can be made in the color, design, graphics or any other component to create a unique layout.


 Continue with Email

 Home
Home


