Kpi Roadmap
Understanding Search Paid Media Advertising For Optimizing Customer Structure Pdf
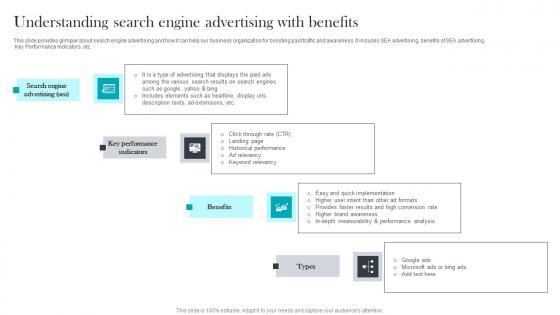
This slide provides glimpse about search engine advertising and how it can help our business organization for boosting paid traffic and awareness. It includes SEA advertising, benefits of SEA advertising, Key Performance Indicators, etc. From laying roadmaps to briefing everything in detail, our templates are perfect for you. You can set the stage with your presentation slides. All you have to do is download these easy to edit and customizable templates. Understanding Search Paid Media Advertising For Optimizing Customer Structure Pdf will help you deliver an outstanding performance that everyone would remember and praise you for. Do download this presentation today. This slide provides glimpse about search engine advertising and how it can help our business organization for boosting paid traffic and awareness. It includes SEA advertising, benefits of SEA advertising, Key Performance Indicators, etc.

Marketing Growth Strategy To Kpis To Measure Success Of Influencer Marketing Strategy SS V
The following slide outlines different success metrics through which marketing executives can measure effectiveness of influencer marketing campaigns. The key performance indicators KPIs outlined in slide are brand reach, impressions, followers growth, click-through rate CTR, customer engagement rate, etc. From laying roadmaps to briefing everything in detail, our templates are perfect for you. You can set the stage with your presentation slides. All you have to do is download these easy-to-edit and customizable templates. Marketing Growth Strategy To Kpis To Measure Success Of Influencer Marketing Strategy SS V will help you deliver an outstanding performance that everyone would remember and praise you for. Do download this presentation today. The following slide outlines different success metrics through which marketing executives can measure effectiveness of influencer marketing campaigns. The key performance indicators KPIs outlined in slide are brand reach, impressions, followers growth, click-through rate CTR, customer engagement rate, etc.
Using Loyalty Program To Boost Customer Business Sales Enhancement Campaign Graphics Pdf
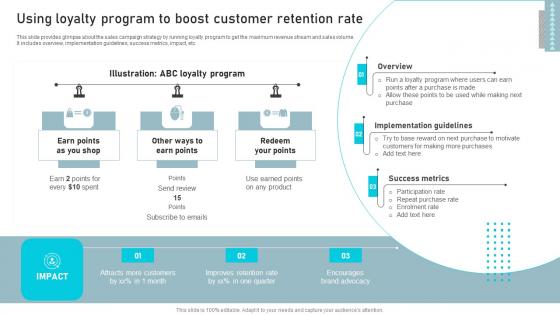
This slide provides glimpse about the sales campaign strategy by running loyalty program to get the maximum revenue stream and sales volume. It includes overview, implementation guidelines, success metrics, impact, etc. From laying roadmaps to briefing everything in detail, our templates are perfect for you. You can set the stage with your presentation slides. All you have to do is download these easy to edit and customizable templates. Using Loyalty Program To Boost Customer Business Sales Enhancement Campaign Graphics Pdf will help you deliver an outstanding performance that everyone would remember and praise you for. Do download this presentation today. This slide provides glimpse about the sales campaign strategy by running loyalty program to get the maximum revenue stream and sales volume. It includes overview, implementation guidelines, success metrics, impact, etc.
Campaign Illustration 3 Hybrid Driving Business Success Hosting Experiential Mockup Pdf
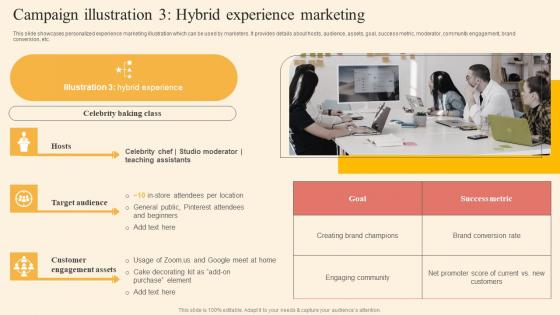
This slide showcases personalized experience marketing illustration which can be used by marketers. It provides details about hosts, audience, assets, goal, success metric, moderator, community engagement, brand conversion, etc. From laying roadmaps to briefing everything in detail, our templates are perfect for you. You can set the stage with your presentation slides. All you have to do is download these easy to edit and customizable templates. Campaign Illustration 3 Hybrid Driving Business Success Hosting Experiential Mockup Pdf will help you deliver an outstanding performance that everyone would remember and praise you for. Do download this presentation today. This slide showcases personalized experience marketing illustration which can be used by marketers. It provides details about hosts, audience, assets, goal, success metric, moderator, community engagement, brand conversion, etc.
Buy More And Save More Business Sales Enhancement Campaign Download Pdf
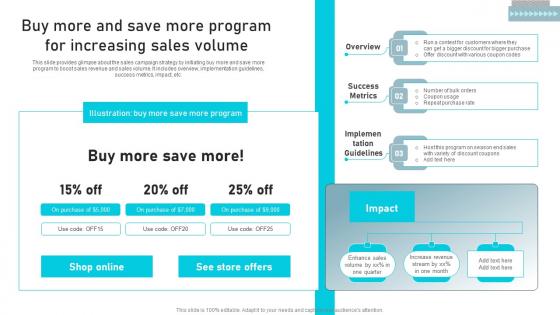
This slide provides glimpse about the sales campaign strategy by initiating buy more and save more program to boost sales revenue and sales volume. It includes overview, implementation guidelines, success metrics, impact, etc. From laying roadmaps to briefing everything in detail, our templates are perfect for you. You can set the stage with your presentation slides. All you have to do is download these easy to edit and customizable templates. Buy More And Save More Business Sales Enhancement Campaign Download Pdf will help you deliver an outstanding performance that everyone would remember and praise you for. Do download this presentation today. This slide provides glimpse about the sales campaign strategy by initiating buy more and save more program to boost sales revenue and sales volume. It includes overview, implementation guidelines, success metrics, impact, etc.
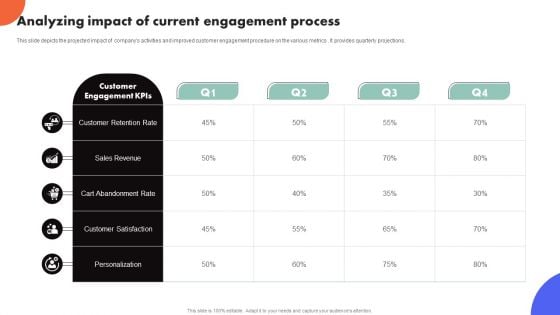
Improving Buyer Journey Through Strategic Customer Engagement Analyzing Impact Of Current Engagement Process Structure PDF
This slide depicts the projected impact of companys activities and improved customer engagement procedure on the various metrics . It provides quarterly projections. This slide depicts the projected impact of companys activities and improved customer engagement procedure on the various metrics . It provides quarterly projections. From laying roadmaps to briefing everything in detail, our templates are perfect for you. You can set the stage with your presentation slides. All you have to do is download these easy-to-edit and customizable templates. Improving Buyer Journey Through Strategic Customer Engagement Analyzing Impact Of Current Engagement Process Structure PDF will help you deliver an outstanding performance that everyone would remember and praise you for. Do download this presentation today.

Online Payment Techniques Impact Of Implementing Gift Card Method
Following slide provides information about key impacts of leveraging gift card cashless payment options on business growth. It includes key metrices such as brand awareness, business revenue, customer engagement, stock clearance, and cash flow ratio. From laying roadmaps to briefing everything in detail, our templates are perfect for you. You can set the stage with your presentation slides. All you have to do is download these easy-to-edit and customizable templates. Online Payment Techniques Impact Of Implementing Gift Card Method will help you deliver an outstanding performance that everyone would remember and praise you for. Do download this presentation today. Following slide provides information about key impacts of leveraging gift card cashless payment options on business growth. It includes key metrices such as brand awareness, business revenue, customer engagement, stock clearance, and cash flow ratio.
Kpis And Dashboards Vector Icons Ppt Powerpoint Presentation Infographics Outline
This is a kpis and dashboards vector icons ppt powerpoint presentation infographics outline. This is a eight stage process. The stages in this process are dashboard, kpi, metrics.
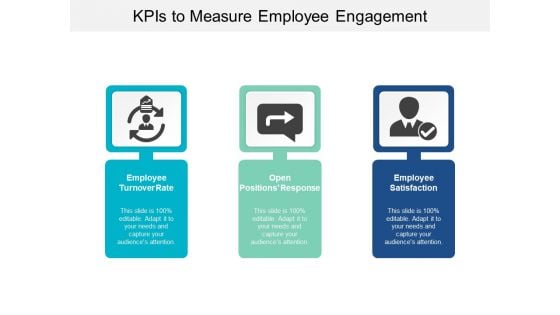
Kpis To Measure Employee Engagement Ppt Powerpoint Presentation Pictures Gridlines
This is a kpis to measure employee engagement ppt powerpoint presentation pictures gridlines. This is a three stage process. The stages in this process are dashboard, kpi, metrics.
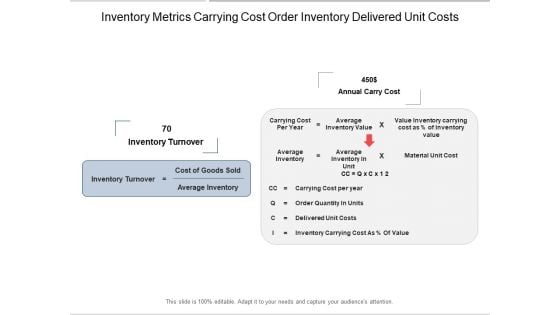
Inventory Metrics Carrying Cost Order Inventory Delivered Unit Costs Ppt Powerpoint Presentation Layouts Guidelines
This is a inventory metrics carrying cost order inventory delivered unit costs ppt powerpoint presentation layouts guidelines. This is a two stage process. The stages in this process are availability kpi, availability dashboard, availability metrics.
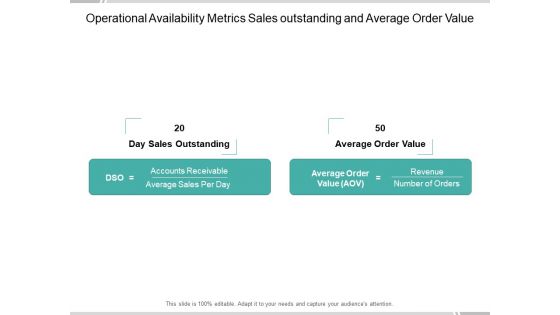
Operational Availability Metrics Sales Outstanding And Average Order Value Ppt Powerpoint Presentation Infographic Template Introduction
This is a operational availability metrics sales outstanding and average order value ppt powerpoint presentation infographic template introduction. This is a two stage process. The stages in this process are availability kpi, availability dashboard, availability metrics.
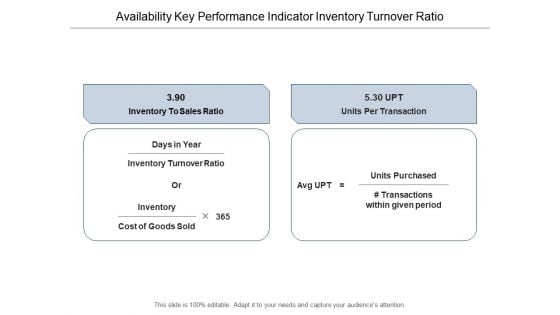
Availability Key Performance Indicator Inventory Turnover Ratio Ppt Powerpoint Presentation Layouts Graphics Download
This is a availability key performance indicator inventory turnover ratio ppt powerpoint presentation layouts graphics download. This is a two stage process. The stages in this process are availability kpi, availability dashboard, availability metrics.
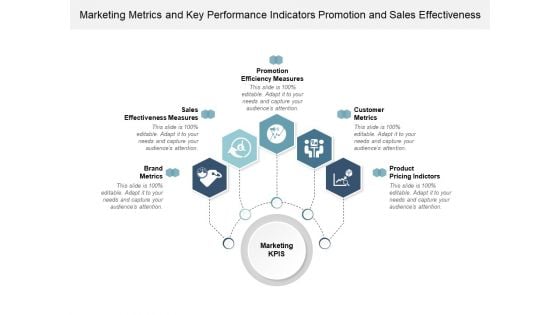
Marketing Metrics And Key Performance Indicators Promotion And Sales Effectiveness Ppt Powerpoint Presentation Infographics Graphics Example
This is a marketing metrics and key performance indicators promotion and sales effectiveness ppt powerpoint presentation infographics graphics example. This is a five stage process. The stages in this process are dashboard, kpi, metrics.
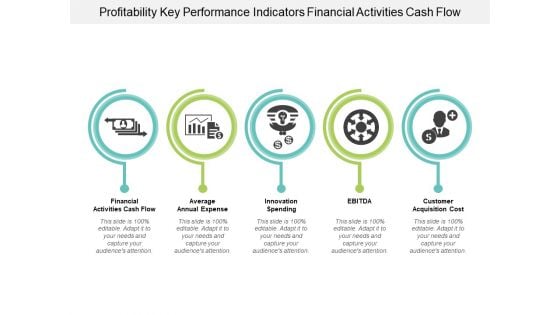
Profitability Key Performance Indicators Financial Activities Cash Flow Ppt Powerpoint Presentation Portfolio Clipart Images
This is a profitability key performance indicators financial activities cash flow ppt powerpoint presentation portfolio clipart images. This is a five stage process. The stages in this process are dashboard, kpi, metrics.
Ten Examples Of Key Performance Indicators Ppt Powerpoint Presentation Layouts Professional
This is a ten examples of key performance indicators ppt powerpoint presentation layouts professional. This is a ten stage process. The stages in this process are dashboard, kpi, metrics.
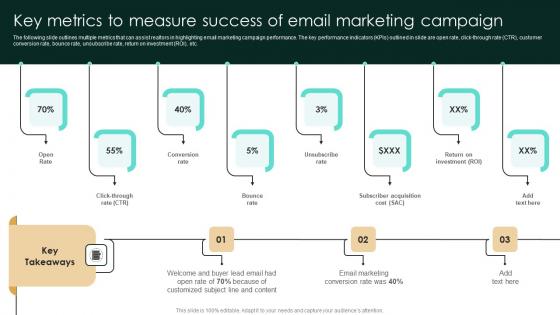
Key Metrics To Measure Success Of Email Marketing Campaign Diagrams Pdf
The following slide outlines multiple metrics that can assist realtors in highlighting email marketing campaign performance. The key performance indicators KPIs outlined in slide are open rate, click-through rate CTR, customer conversion rate, bounce rate, unsubscribe rate, return on investment ROI, etc. Retrieve professionally designed Key Metrics To Measure Success Of Email Marketing Campaign Diagrams Pdf to effectively convey your message and captivate your listeners. Save time by selecting pre-made slideshows that are appropriate for various topics, from business to educational purposes. These themes come in many different styles, from creative to corporate, and all of them are easily adjustable and can be edited quickly. Access them as PowerPoint templates or as Google Slides themes. You do not have to go on a hunt for the perfect presentation because Slidegeeks got you covered from everywhere. The following slide outlines multiple metrics that can assist realtors in highlighting email marketing campaign performance. The key performance indicators KPIs outlined in slide are open rate, click-through rate CTR, customer conversion rate, bounce rate, unsubscribe rate, return on investment ROI, etc.
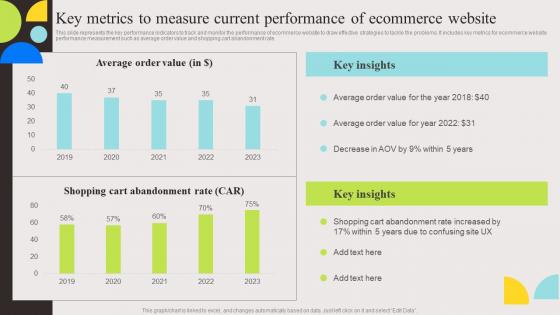
Key Metrics To Measure Current Evaluation And Deployment Of Enhanced Professional Pdf
This slide represents the key performance indicators to track and monitor the performance of ecommerce website to draw effective strategies to tackle the problems. It includes key metrics for ecommerce website performance measurement such as average order value and shopping cart abandonment rate. Are you searching for a Key Metrics To Measure Current Evaluation And Deployment Of Enhanced Professional Pdf that is uncluttered, straightforward, and original It is easy to edit, and you can change the colors to suit your personal or business branding. For a presentation that expresses how much effort you have put in, this template is ideal With all of its features, including tables, diagrams, statistics, and lists, it is perfect for a business plan presentation. Make your ideas more appealing with these professional slides. Download Key Metrics To Measure Current Evaluation And Deployment Of Enhanced Professional Pdf from Slidegeeks today. This slide represents the key performance indicators to track and monitor the performance of ecommerce website to draw effective strategies to tackle the problems. It includes key metrics for ecommerce website performance measurement such as average order value and shopping cart abandonment rate.
Performance Indicators Of Business Icons Ppt Powerpoint Presentation Infographics Graphics Template
This is a performance indicators of business icons ppt powerpoint presentation infographics graphics template. This is a four stage process. The stages in this process are dashboard, kpi, metrics.
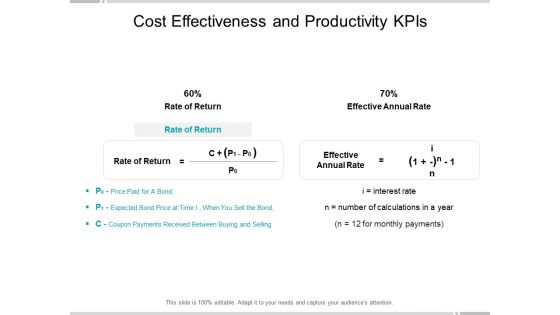
Cost Effectiveness And Productivity Kpis Ppt Powerpoint Presentation Portfolio Demonstration
This is a cost effectiveness and productivity kpis ppt powerpoint presentation portfolio demonstration. This is a two stage process. The stages in this process are availability kpi, availability dashboard, availability metrics.
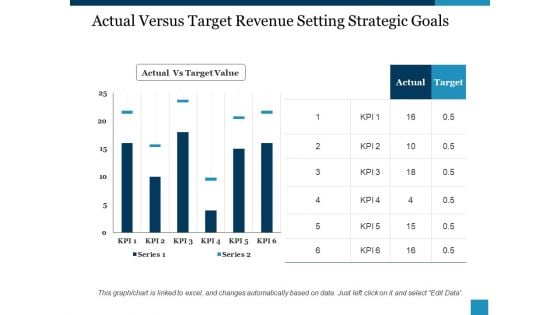
Actual Versus Target Revenue Setting Strategic Goals Ppt PowerPoint Presentation Visual Aids Diagrams
This is a actual versus target revenue setting strategic goals ppt powerpoint presentation visual aids diagrams. This is a six stage process. The stages in this process are actual vs target value, actual, target, kpi, series.
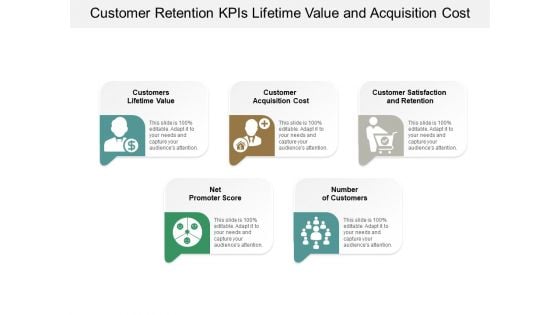
Customer Retention Kpis Lifetime Value And Acquisition Cost Ppt Powerpoint Presentation Model Samples
This is a customer retention kpis lifetime value and acquisition cost ppt powerpoint presentation model samples. This is a five stage process. The stages in this process are dashboard, kpi, metrics.
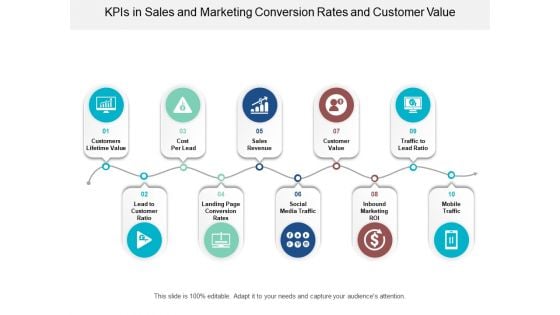
Kpis In Sales And Marketing Conversion Rates And Customer Value Ppt Powerpoint Presentation File Information
This is a kpis in sales and marketing conversion rates and customer value ppt powerpoint presentation file information. This is a ten stage process. The stages in this process are dashboard, kpi, metrics.
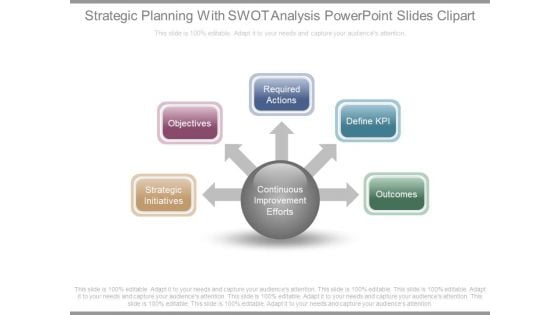
Strategic Planning With Swot Analysis Powerpoint Slides Clipart
This is a strategic planning with swot analysis powerpoint slides clipart. This is a five stage process. The stages in this process are continuous improvement efforts, strategic initiatives, objectives, required actions, define kpi, outcomes.
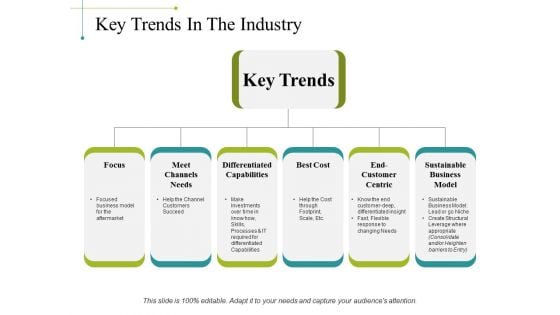
Key Trends In The Industry Ppt PowerPoint Presentation Portfolio Design Inspiration
This is a key trends in the industry ppt powerpoint presentation portfolio design inspiration. This is a six stage process. The stages in this process are focus, meet channels needs, differentiated capabilities, best cost, sustainable business model.
Inventory Metrics Carrying Cost Order Inventory Delivered Unit Costs Ppt PowerPoint Presentation Icon Example
Presenting this set of slides with name inventory metrics carrying cost order inventory delivered unit costs ppt powerpoint presentation icon example. The topics discussed in these slides are availability kpi, availability dashboard, availability metrics. This is a completely editable PowerPoint presentation and is available for immediate download. Download now and impress your audience.
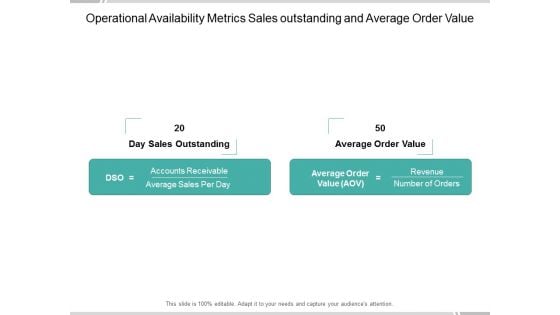
Operational Availability Metrics Sales Outstanding And Average Order Value Ppt PowerPoint Presentation Ideas Tips
Presenting this set of slides with name operational availability metrics sales outstanding and average order value ppt powerpoint presentation ideas tips. The topics discussed in these slides are availability kpi, availability dashboard, availability metrics. This is a completely editable PowerPoint presentation and is available for immediate download. Download now and impress your audience.
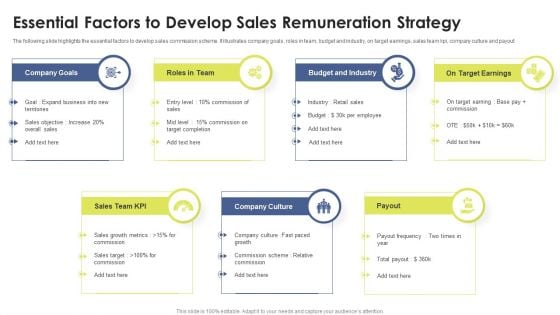
Essential Factors To Develop Sales Remuneration Strategy Ppt Gallery Graphics PDF
The following slide highlights the essential factors to develop sales commission scheme. It illustrates company goals, roles in team, budget and industry, on target earnings, sales team kpi, company culture and payout. Persuade your audience using this Essential Factors To Develop Sales Remuneration Strategy Ppt Gallery Graphics PDF. This PPT design covers seven stages, thus making it a great tool to use. It also caters to a variety of topics including Company Goals, Budget And Industry, On Target Earnings, Sales Team KPI. Download this PPT design now to present a convincing pitch that not only emphasizes the topic but also showcases your presentation skills.
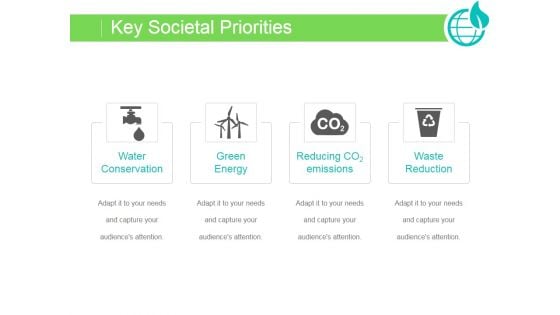
Key Societal Priorities Ppt PowerPoint Presentation Graphics
This is a key societal priorities ppt powerpoint presentation graphics. This is a four stage process. The stages in this process are water conservation, green energy, reducing co emissions, waste reduction.
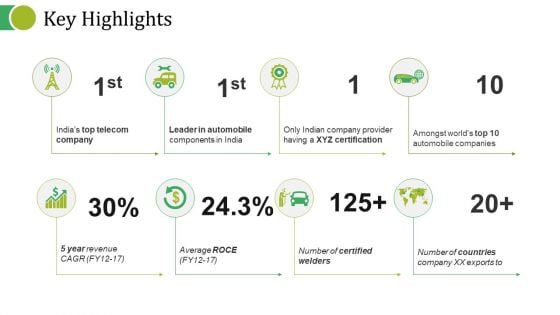
Key Highlights Ppt PowerPoint Presentation Summary Demonstration
This is a key highlights ppt powerpoint presentation summary demonstration. This is a eight stage process. The stages in this process are top telecom company, leader in automobile, xyz certification, automobile companies.
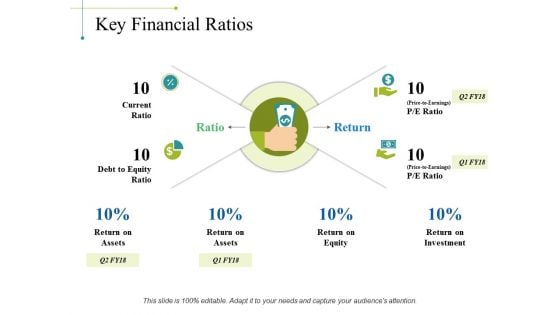
Key Financial Ratios Ppt PowerPoint Presentation Guidelines
This is a key financial ratios ppt powerpoint presentation guidelines. This is a four stage process. The stages in this process are current ratio, debt to equity ratio, ratio, return, return on assets.
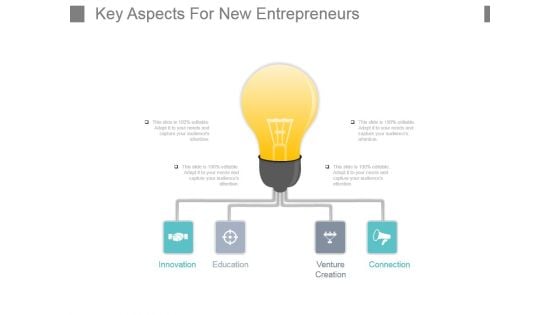
Key Aspects For New Entrepreneurs Powerpoint Slide Ideas
This is a key aspects for new entrepreneurs powerpoint slide ideas. This is a four stage process. The stages in this process are innovation, education, venture creation, connection.
Our Keys To Success Template Ppt PowerPoint Presentation Guide
This is a our keys to success template ppt powerpoint presentation guide. This is a four stage process. The stages in this process are shapes, key, business, marketing, strategy.
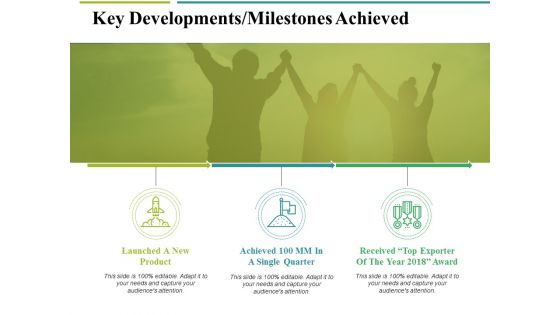
Key Developments Milestones Achieved Ppt PowerPoint Presentation Ideas Styles
This is a key developments milestones achieved ppt powerpoint presentation ideas styles. This is a three stage process. The stages in this process are launched a new product, single quarter, key developments, business, marketing.
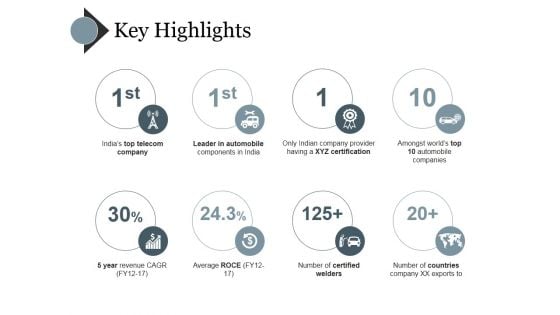
Key Highlights Ppt PowerPoint Presentation Gallery Deck
This is a key highlights ppt powerpoint presentation gallery deck. This is a eight stage process. The stages in this process are indias top telecom company, leader in automobile components in india, only indian company provider having a xyz certification, amongst worlds top 10 automobile companies, number of certified welders.
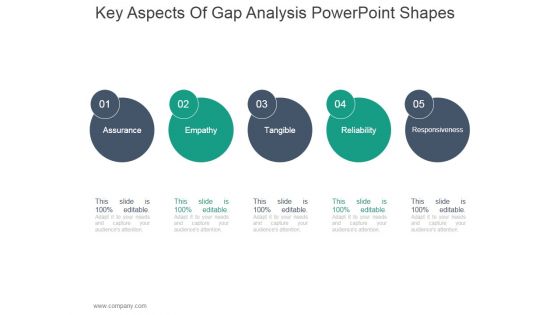
Key Aspects Of Gap Analysis Ppt PowerPoint Presentation Guide
This is a key aspects of gap analysis ppt powerpoint presentation guide. This is a five stage process. The stages in this process are assurance, empathy, tangible, reliability, responsiveness.
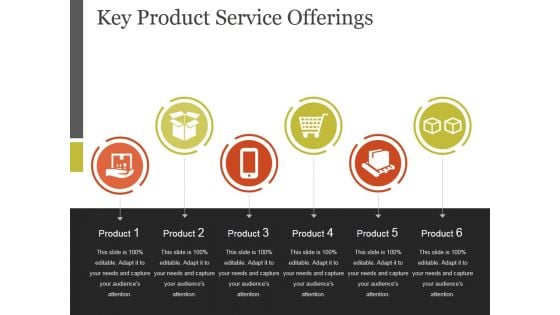
Key Product Service Offerings Template 2 Ppt PowerPoint Presentation Templates
This is a key product service offerings template 2 ppt powerpoint presentation templates. This is a six stage process. The stages in this process are product, marketing, business, management, strategy.
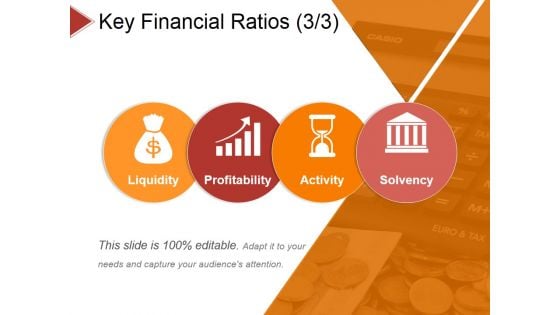
Key Financial Ratios Template 3 Ppt PowerPoint Presentation Summary Sample
This is a key financial ratios template 3 ppt powerpoint presentation summary sample. This is a four stage process. The stages in this process are liquidity, profitability, activity, solvency.
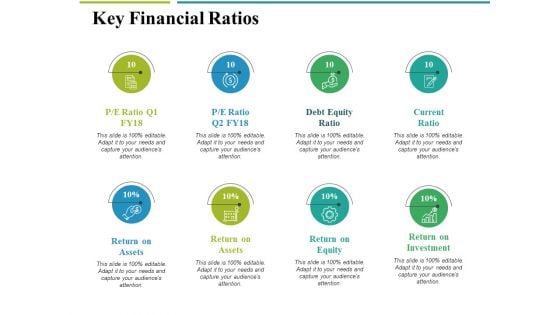
Key Financial Ratios Ppt PowerPoint Presentation Portfolio Summary
This is a key financial ratios ppt powerpoint presentation portfolio summary. This is a eight stage process. The stages in this process are return on assets, return on equity, return on investment, debt equity ratio, current ratio.
4 Key Market Drivers Of Economic Growth Ppt PowerPoint Presentation Templates
This is a 4 key market drivers of economic growth ppt powerpoint presentation templates. This is a four stage process. The stages in this process are key market driver.
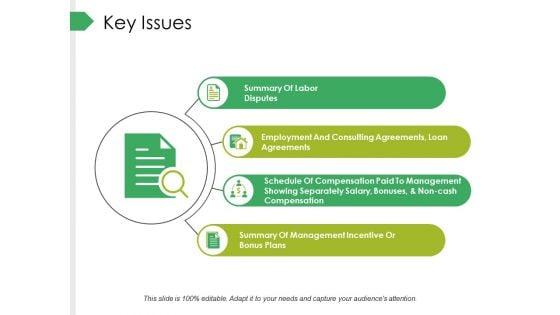
Key Issues Ppt PowerPoint Presentation Professional Design Inspiration
This is a key issues ppt powerpoint presentation professional design inspiration. This is a four stage process. The stages in this process are business, summary of labor disputes, summary of management incentive or bonus plans, employment and consulting agreements, loan agreements, marketing.
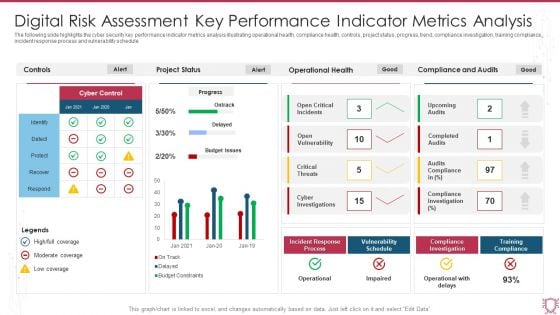
Digital Risk Assessment Key Performance Indicator Metrics Analysis Infographics PDF
The following slide highlights the cyber security key performance indicator metrics analysis illustrating operational health, compliance health, controls, project status, progress, trend, compliance investigation, training compliance, incident response process and vulnerability schedule. Showcasing this set of slides titled Digital Risk Assessment Key Performance Indicator Metrics Analysis Infographics PDF. The topics addressed in these templates are Project Status, Operational Health, Compliance And Audits. All the content presented in this PPT design is completely editable. Download it and make adjustments in color, background, font etc. as per your unique business setting.
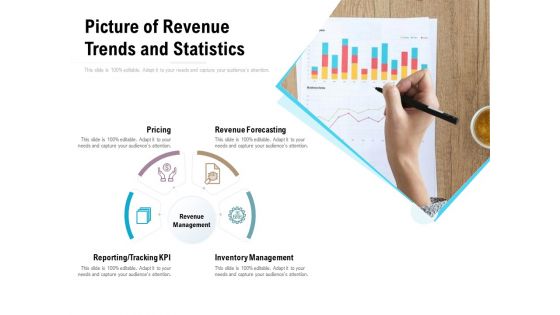
Picture Of Revenue Trends And Statistics Ppt PowerPoint Presentation Ideas Backgrounds
Presenting this set of slides with name picture of revenue trends and statistics ppt powerpoint presentation ideas backgrounds. This is a four stage process. The stages in this process are pricing, revenue forecasting, inventory management, reporting, tracking kpi, revenue management. This is a completely editable PowerPoint presentation and is available for immediate download. Download now and impress your audience.
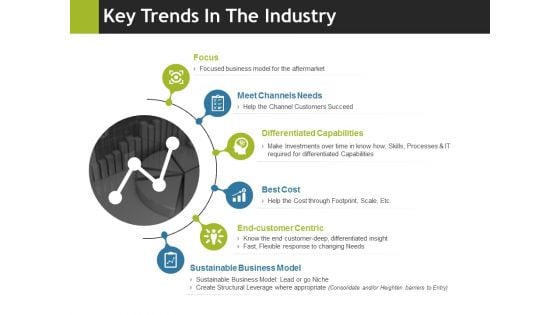
Key Trends In The Industry Ppt PowerPoint Presentation Professional Backgrounds
This is a key trends in the industry ppt powerpoint presentation professional backgrounds. This is a six stage process. The stages in this process are focus, meet channels needs, differentiated capabilities, best cost, end customer centric.
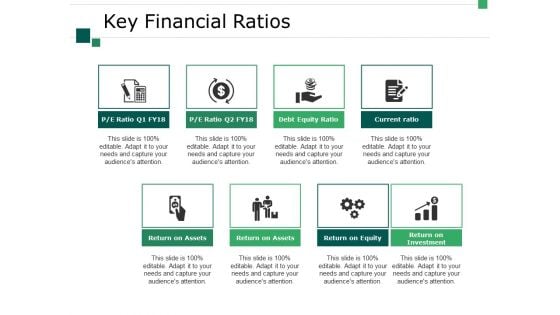
Key Financial Ratios Ppt PowerPoint Presentation Outline Slide
This is a key financial ratios ppt powerpoint presentation outline slide. This is a eight stage process. The stages in this process are return on assets, return on equity, return on investment, current ratio, debt equity ratio.
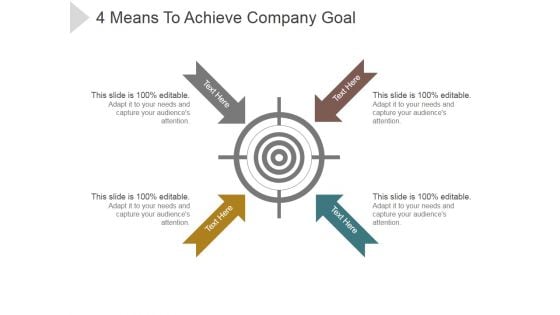
4 Means To Achieve Company Goal Ppt PowerPoint Presentation Clipart
This is a 4 means to achieve company goal ppt powerpoint presentation clipart. This is a four stage process. The stages in this process are arrows, targets, success, marketing, presentation.
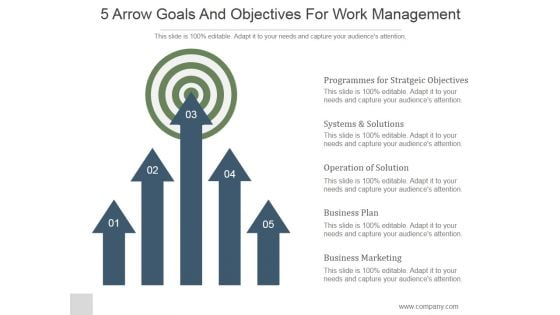
5 Arrow Goals And Objectives For Work Management Ppt PowerPoint Presentation Example File
This is a 5 arrow goals and objectives for work management ppt powerpoint presentation example file. This is a five stage process. The stages in this process are programmer for strategic objectives, systems and solutions, operation of solution, business plan, business marketing.
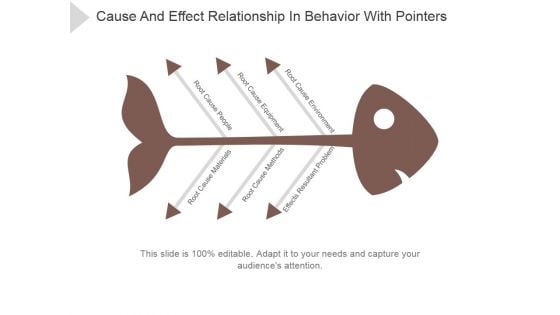
Cause And Effect Relationship In Behavior With Pointers Ppt PowerPoint Presentation Shapes
This is a cause and effect relationship in behavior with pointers ppt powerpoint presentation shapes. This is a six stage process. The stages in this process are root cause materials, root cause methods, effects resultant problem, root cause people, root cause equipment.
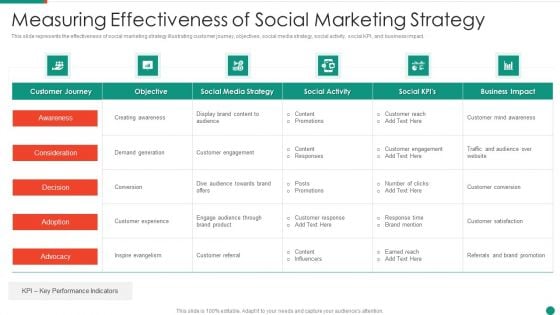
Measuring Effectiveness Of Social Marketing Strategy Diagrams PDF
This slide represents the effectiveness of social marketing strategy illustrating customer journey, objectives, social media strategy, social activity, social KPI, and business impact.Pitch your topic with ease and precision using this Measuring Effectiveness Of Social Marketing Strategy Diagrams PDF This layout presents information on Customer Journey, Consideration, Inspire Evangelism It is also available for immediate download and adjustment. So, changes can be made in the color, design, graphics or any other component to create a unique layout.
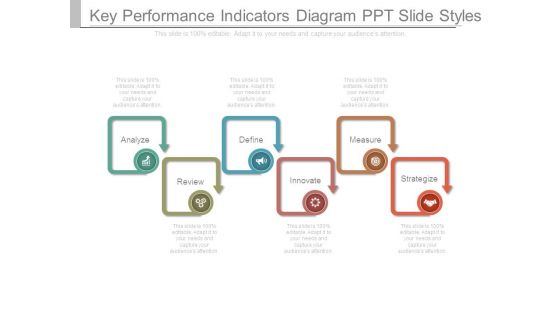
Key Performance Indicators Diagram Ppt Slide Styles
This is a key performance indicators diagram ppt slide styles. This is a six stage process. The stages in this process are analyze, define, measure, review, innovate, strategize.
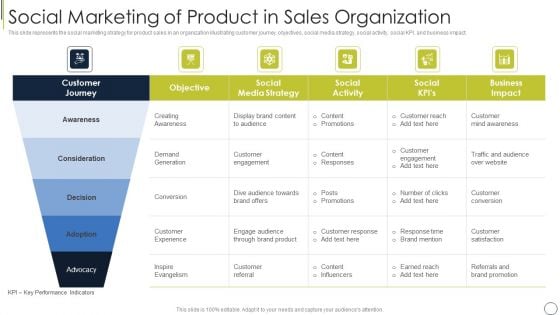
Social Marketing Of Product In Sales Organization Introduction PDF
This slide represents the social marketing strategy for product sales in an organization illustrating customer journey, objectives, social media strategy, social activity, social KPI, and business impact. Showcasing this set of slides titled social marketing of product in sales organization introduction pdf. The topics addressed in these templates are awareness, customer experience, social. All the content presented in this PPT design is completely editable. Download it and make adjustments in color, background, font etc. as per your unique business setting.
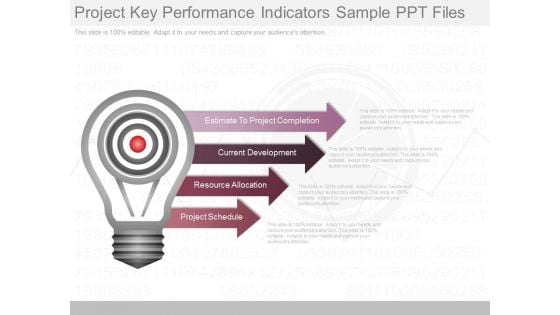
Project Key Performance Indicators Sample Ppt Files
This is a project key performance indicators sample ppt files. This is a four stage process. The stages in this process are estimate to project completion, current development, resource allocation, project schedule.
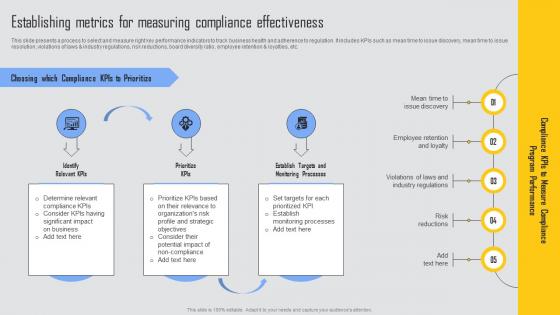
Establishing Metrics Measuring Managing Risks And Establishing Trust Through Efficient Ideas Pdf
This slide presents a process to select and measure right key performance indicators to track business health and adherence to regulation. It includes KPIs such as mean time to issue discovery, mean time to issue resolution, violations of laws and industry regulations, risk reductions, board diversity ratio, employee retention and loyalties, etc. Do you have to make sure that everyone on your team knows about any specific topic I yes, then you should give Establishing Metrics Measuring Managing Risks And Establishing Trust Through Efficient Ideas Pdf a try. Our experts have put a lot of knowledge and effort into creating this impeccable Establishing Metrics Measuring Managing Risks And Establishing Trust Through Efficient Ideas Pdf. You can use this template for your upcoming presentations, as the slides are perfect to represent even the tiniest detail. You can download these templates from the Slidegeeks website and these are easy to edit. So grab these today This slide presents a process to select and measure right key performance indicators to track business health and adherence to regulation. It includes KPIs such as mean time to issue discovery, mean time to issue resolution, violations of laws and industry regulations, risk reductions, board diversity ratio, employee retention and loyalties, etc.
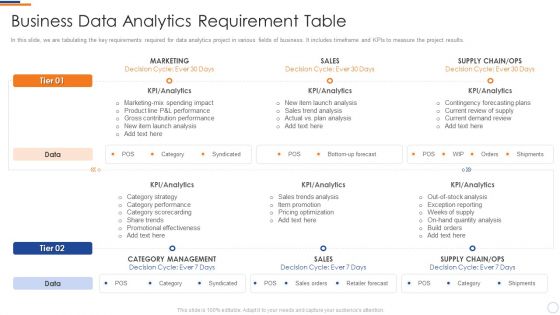
Business Intelligence And Big Business Data Analytics Requirement Table Formats PDF
In this slide, we are tabulating the key requirements required for data analytics project in various fields of business. It includes timeframe and KPIs to measure the project results. Deliver an awe inspiring pitch with this creative business intelligence and big business data analytics requirement table formats pdf bundle. Topics like category management, kpi, analytics, sales orders, retailer forecast can be discussed with this completely editable template. It is available for immediate download depending on the needs and requirements of the user.
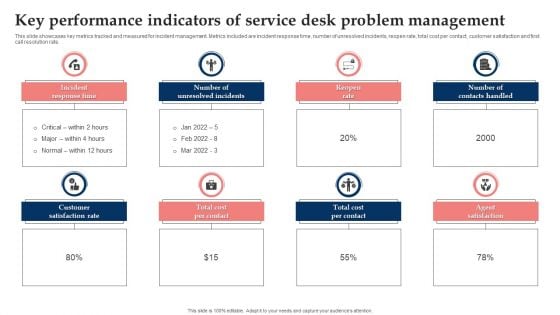
Key Performance Indicators Of Service Desk Problem Management Elements PDF
This slide showcases key metrics tracked and measured for incident management. Metrics included are incident response time, number of unresolved incidents, reopen rate, total cost per contact, customer satisfaction and first call resolution rate. Presenting Key Performance Indicators Of Service Desk Problem Management Elements PDF to dispense important information. This template comprises eight stages. It also presents valuable insights into the topics including Incident Response Time, Number Of Unresolved Incidents, Number Of Contacts Handled. This is a completely customizable PowerPoint theme that can be put to use immediately. So, download it and address the topic impactfully.
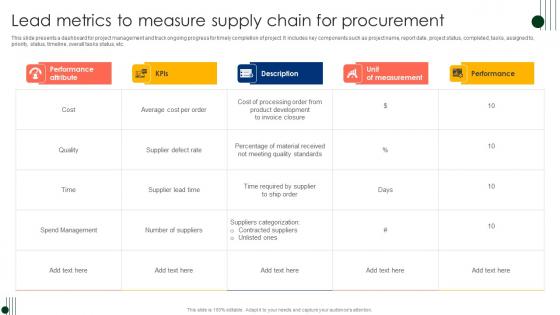
Lead Metrics To Measure Supply Chain For Procurement Ppt Professional Design Inspiration Pdf
This slide presents a dashboard for project management and track ongoing progress for timely completion of project. It includes key components such as project name, report date, project status, completed, tasks, assigned to, priority, status, timeline, overall tasks status, etc. Showcasing this set of slides titled Lead Metrics To Measure Supply Chain For Procurement Ppt Professional Design Inspiration Pdf. The topics addressed in these templates are Project Status, Completed, Tasks, Assigned To, Priority. All the content presented in this PPT design is completely editable. Download it and make adjustments in color, background, font etc. as per your unique business setting. This slide presents a dashboard for project management and track ongoing progress for timely completion of project. It includes key components such as project name, report date, project status, completed, tasks, assigned to, priority, status, timeline, overall tasks status, etc.

Track Client Health Score Using Key Performance Indicators Summary PDF
This slide illustrates various key performance indicators used to analyze the performance of products and helps in measuring customer health scores. It includes metrics such as customer sentiment, customer engagement, customer ROI and customer feedback. Persuade your audience using this Track Client Health Score Using Key Performance Indicators Summary PDF. This PPT design covers four stages, thus making it a great tool to use. It also caters to a variety of topics including Customer Sentiment, Customer Engagement, Customer ROI. Download this PPT design now to present a convincing pitch that not only emphasizes the topic but also showcases your presentation skills.
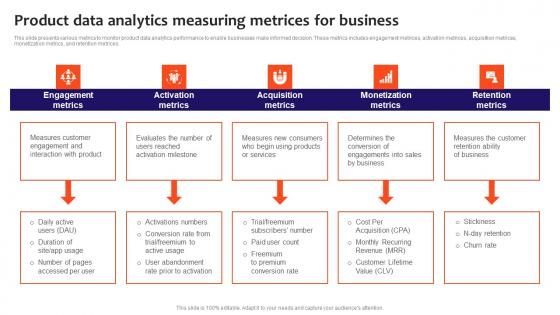
Product Data Analytics Measuring Metrices For Business Ideas Pdf
This slide presents various metrics to monitor product data analytics performance to enable businesses make informed decision. These metrics includes engagement metrices, activation metrices, acquisition metrices, monetization metrics, and retention metrices. Showcasing this set of slides titled Product Data Analytics Measuring Metrices For Business Ideas Pdf. The topics addressed in these templates are Engagement Metrics, Activation Metrics, Acquisition Metrics. All the content presented in this PPT design is completely editable. Download it and make adjustments in color, background, font etc. as per your unique business setting. This slide presents various metrics to monitor product data analytics performance to enable businesses make informed decision. These metrics includes engagement metrices, activation metrices, acquisition metrices, monetization metrics, and retention metrices.
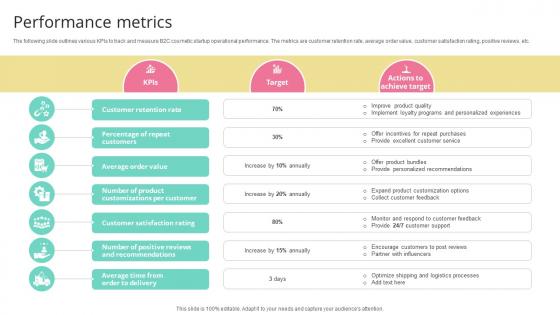
Performance Metrics Skincare Startup GTM Strategy GTM SS V
The following slide outlines various KPIs to track and measure B2C cosmetic startup operational performance. The metrics are customer retention rate, average order value, customer satisfaction rating, positive reviews, etc.Make sure to capture your audiences attention in your business displays with our gratis customizable Performance Metrics Skincare Startup GTM Strategy GTM SS V. These are great for business strategies, office conferences, capital raising or task suggestions. If you desire to acquire more customers for your tech business and ensure they stay satisfied, create your own sales presentation with these plain slides. The following slide outlines various KPIs to track and measure B2C cosmetic startup operational performance. The metrics are customer retention rate, average order value, customer satisfaction rating, positive reviews, etc.
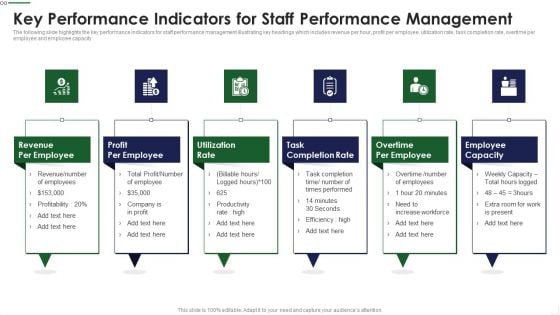
Key Performance Indicators For Staff Performance Management Clipart PDF
The following slide highlights the key performance Indicators for staff performance management illustrating key headings which includes revenue per hour, profit per employee, utilization rate, task completion rate, overtime per employee and employee capacity Persuade your audience using this Key Performance Indicators For Staff Growth Topics PDF This PPT design covers six stages, thus making it a great tool to use. It also caters to a variety of topics including Revenue Employee, Profit Employee, Task Completion Download this PPT design now to present a convincing pitch that not only emphasizes the topic but also showcases your presentation skills.
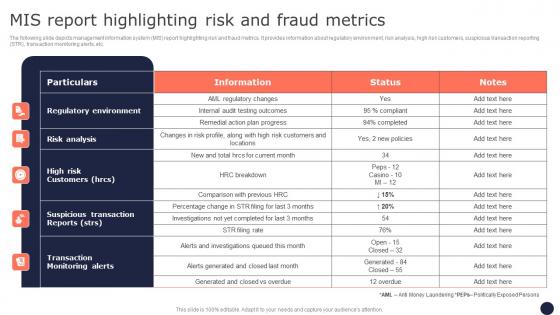
Mis Report Highlighting Risk And Fraud Metrics Mitigating Corporate Scams And Robberies Portrait Pdf
The following slide depicts management information system MIS report highlighting risk and fraud metrics. It provides information about regulatory environment, risk analysis, high risk customers, suspicious transaction reporting STR, transaction monitoring alerts, etc. The Mis Report Highlighting Risk And Fraud Metrics Mitigating Corporate Scams And Robberies Portrait Pdf is a compilation of the most recent design trends as a series of slides. It is suitable for any subject or industry presentation, containing attractive visuals and photo spots for businesses to clearly express their messages. This template contains a variety of slides for the user to input data, such as structures to contrast two elements, bullet points, and slides for written information. Slidegeeks is prepared to create an impression. The following slide depicts management information system MIS report highlighting risk and fraud metrics. It provides information about regulatory environment, risk analysis, high risk customers, suspicious transaction reporting STR, transaction monitoring alerts, etc.


 Continue with Email

 Home
Home


