Kpi Security

Document Management Process Flow With Version Control Ppt PowerPoint Presentation File Master Slide PDF
Persuade your audience using this document management process flow with version control ppt powerpoint presentation file master slide pdf. This PPT design covers eight stages, thus making it a great tool to use. It also caters to a variety of topics including security, capability, metrics. Download this PPT design now to present a convincing pitch that not only emphasizes the topic but also showcases your presentation skills.
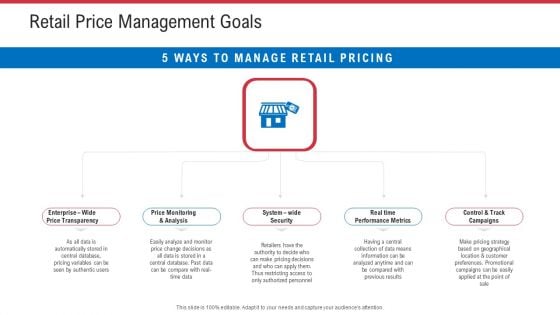
Retail Sector Analysis Retail Price Management Goals Ppt Model Influencers PDF
Presenting retail sector analysis retail price management goals ppt model influencers pdf. to provide visual cues and insights. Share and navigate important information on five stages that need your due attention. This template can be used to pitch topics like price monitoring and analysis, system wide security, time performance metrics. In addtion, this PPT design contains high resolution images, graphics, etc, that are easily editable and available for immediate download.
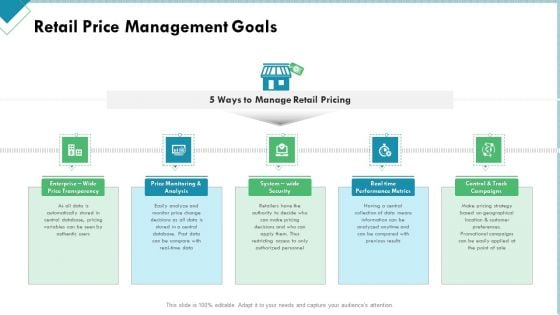
Market Analysis Of Retail Sector Retail Price Management Goals Ppt File Graphics Download PDF
Presenting market analysis of retail sector retail price management goals ppt file graphics download pdf to provide visual cues and insights. Share and navigate important information on five stages that need your due attention. This template can be used to pitch topics like performance metrics, campaigns, security, analysis, price transparency. In addtion, this PPT design contains high resolution images, graphics, etc, that are easily editable and available for immediate download.
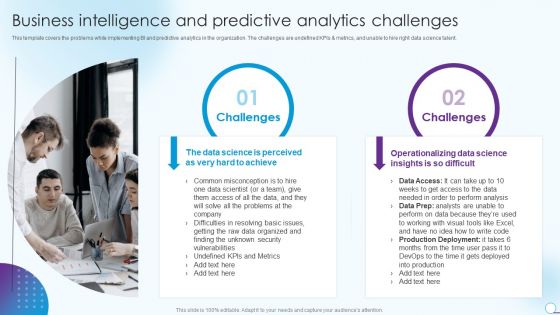
Information Analytics And Ml Strategy Playbook Business Intelligence And Predictive Analytics Challenges Structure PDF
This template covers the problems while implementing BI and predictive analytics in the organization. The challenges are undefined KPIs and metrics, and unable to hire right data science talent. This is a Information Analytics And Ml Strategy Playbook Business Intelligence And Predictive Analytics Challenges Structure PDF template with various stages. Focus and dispense information on two stages using this creative set, that comes with editable features. It contains large content boxes to add your information on topics like Operationalizing Data Science, Unknown Security, Metrics. You can also showcase facts, figures, and other relevant content using this PPT layout. Grab it now.
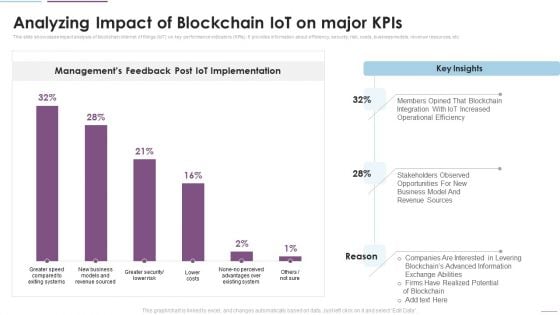
Supply Chain Management Analyzing Impact Of Blockchain Iot On Major Kpis Inspiration PDF
This slide showcases impact analysis of blockchain internet of things IoT on key performance indicators KPIs. It provides information about efficiency, security, risk, costs, business models, revenue resources, etc. Deliver an awe inspiring pitch with this creative Supply Chain Management Analyzing Impact Of Blockchain Iot On Major Kpis Inspiration PDF bundle. Topics like Managements Feedback, Post IoT Implementation, Opportunities For New can be discussed with this completely editable template. It is available for immediate download depending on the needs and requirements of the user.
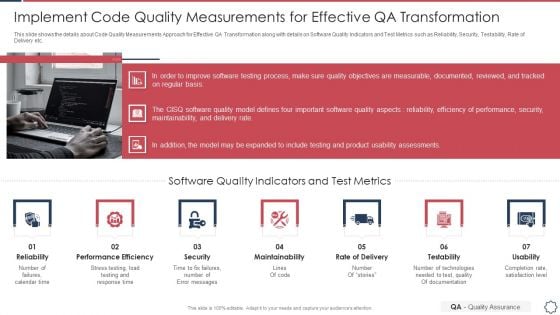
Quality Assurance Transformation Strategies To Improve Business Performance Efficiency Implement Code Quality Measurements Infographics PDF
This slide shows the details about Code Quality Measurements Approach for Effective QA Transformation along with details on Software Quality Indicators and Test Metrics such as Reliability, Security, Testability, Rate of Delivery etc. Presenting quality assurance transformation strategies to improve business performance efficiency implement code quality measurements infographics pdf to provide visual cues and insights. Share and navigate important information on seven stages that need your due attention. This template can be used to pitch topics like performance efficiency, maintainability, rate of delivery, testability, usability. In addtion, this PPT design contains high resolution images, graphics, etc, that are easily editable and available for immediate download.
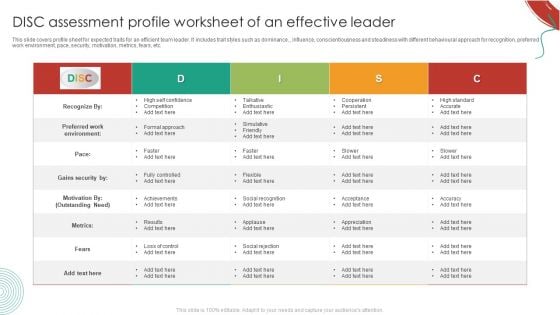
DISC Assessment Profile Worksheet Of An Effective Leader Rules PDF
This slide covers profile sheet for expected traits for an efficient team leader. It includes trait styles such as dominance, , influence, conscientiousness and steadiness with different behavioural approach for recognition, preferred work environment, pace, security, motivation, metrics, fears, etc. Showcasing this set of slides titled DISC Assessment Profile Worksheet Of An Effective Leader Rules PDF. The topics addressed in these templates are Metrics, Preferred Work Environment, High Self Confidence. All the content presented in this PPT design is completely editable. Download it and make adjustments in color, background, font etc. as per your unique business setting.
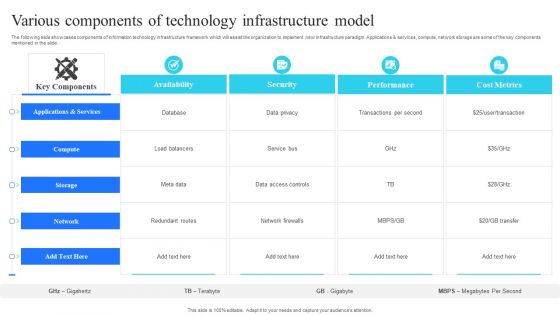
Various Components Of Technology Infrastructure Model Portrait PDF
The following slide showcases components of information technology infrastructure framework which will assist the organization to implement new infrastructure paradigm. Applications and services, compute, network storage are some of the key components mentioned in the slide. Showcasing this set of slides titled Various Components Of Technology Infrastructure Model Portrait PDF. The topics addressed in these templates are Availability, Security, Performance, Cost Metrics. All the content presented in this PPT design is completely editable. Download it and make adjustments in color, background, font etc. as per your unique business setting.
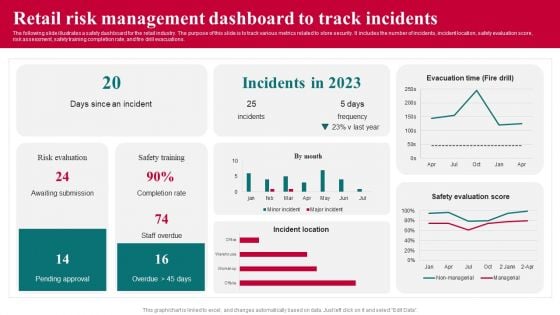
Retail Risk Management Dashboard To Track Incidents Professional PDF
The following slide illustrates a safety dashboard for the retail industry. The purpose of this slide is to track various metrics related to store security. It includes the number of incidents, incident location, safety evaluation score,risk assessment, safety training completion rate, and fire drill evacuations. Showcasing this set of slides titled Retail Risk Management Dashboard To Track Incidents Professional PDF. The topics addressed in these templates are Risk Evaluation, Retail Risk Management Dashboard, Track Incidents. All the content presented in this PPT design is completely editable. Download it and make adjustments in color, background, font etc. as per your unique business setting.
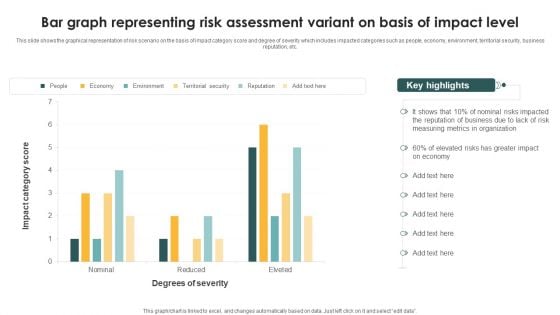
Bar Graph Representing Risk Assessment Variant On Basis Of Impact Level Topics PDF
This slide shows the graphical representation of risk scenario on the basis of impact category score and degree of severity which includes impacted categories such as people, economy, environment, territorial security, business reputation, etc. Showcasing this set of slides titled Bar Graph Representing Risk Assessment Variant On Basis Of Impact Level Topics PDF. The topics addressed in these templates are Measuring Metrics, Organization, Greater Impact. All the content presented in this PPT design is completely editable. Download it and make adjustments in color, background, font etc. as per your unique business setting.
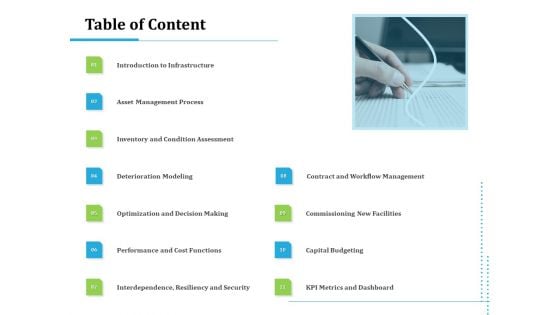
Information Technology Functions Management Table Of Content Ppt Model Files PDF
This is a information technology functions management table of content ppt model files pdf template with various stages. Focus and dispense information on eleven stages using this creative set, that comes with editable features. It contains large content boxes to add your information on topics like introduction to infrastructure, asset management process, inventory and condition assessment, deterioration modeling, optimization and decision making, performance and cost functions, interdependence, resiliency and security, contract and workflow management, commissioning new facilities, capital budgeting, metrics and dashboard. You can also showcase facts, figures, and other relevant content using this PPT layout. Grab it now.
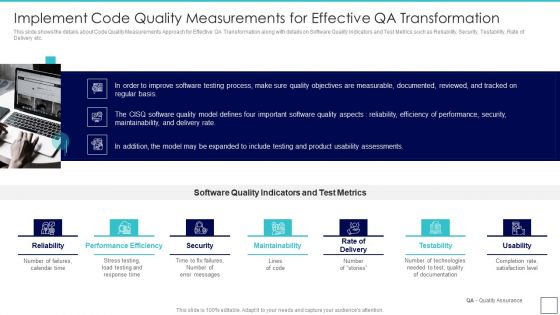
Deploying Quality Assurance QA Transformation Implement Code Quality Measurements Guidelines PDF
This slide shows the details about Code Quality Measurements Approach for Effective QA Transformation along with details on Software Quality Indicators and Test Metrics such as Reliability, Security, Testability, Rate of Delivery etc.This is a Deploying Quality Assurance QA Transformation Implement Code Quality Measurements Guidelines PDF template with various stages. Focus and dispense information on seven stages using this creative set, that comes with editable features. It contains large content boxes to add your information on topics like Performance Efficiency, Maintainability, Reliability You can also showcase facts, figures, and other relevant content using this PPT layout. Grab it now.
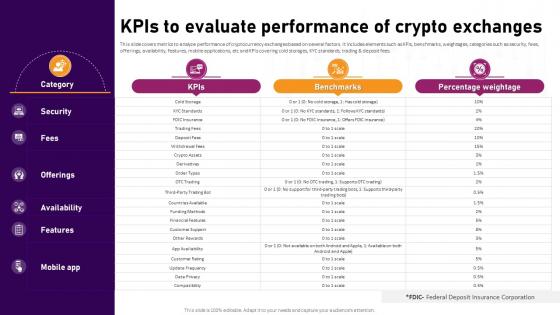
KPIs To Evaluate Performance Of Crypto Exchanges Complete Roadmap To Blockchain BCT SS V
This slide covers metrics to analyze performance of cryptocurrency exchanges based on several factors. It includes elements such as KPIs, benchmarks, weightages, categories such as security, fees, offerings, availability, features, mobile applications, etc and KPIs covering cold storages, KYC standards, trading and deposit fees. Do you know about Slidesgeeks KPIs To Evaluate Performance Of Crypto Exchanges Complete Roadmap To Blockchain BCT SS V These are perfect for delivering any kind od presentation. Using it, create PowerPoint presentations that communicate your ideas and engage audiences. Save time and effort by using our pre-designed presentation templates that are perfect for a wide range of topic. Our vast selection of designs covers a range of styles, from creative to business, and are all highly customizable and easy to edit. Download as a PowerPoint template or use them as Google Slides themes. This slide covers metrics to analyze performance of cryptocurrency exchanges based on several factors. It includes elements such as KPIs, benchmarks, weightages, categories such as security, fees, offerings, availability, features, mobile applications, etc and KPIs covering cold storages, KYC standards, trading and deposit fees.
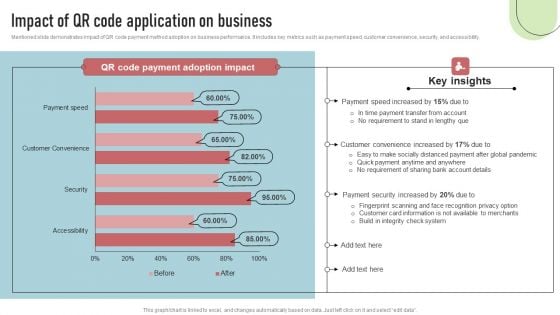
Cashless Payment Strategies To Enhance Business Performance Impact Of QR Code Application On Business Template PDF
Mentioned slide demonstrates impact of QR code payment method adoption on business performance. It includes key metrics such as payment speed, customer convenience, security, and accessibility. Welcome to our selection of the Cashless Payment Strategies To Enhance Business Performance Impact Of QR Code Application On Business Template PDF. These are designed to help you showcase your creativity and bring your sphere to life. Planning and Innovation are essential for any business that is just starting out. This collection contains the designs that you need for your everyday presentations. All of our PowerPoints are 100 percent editable, so you can customize them to suit your needs. This multi-purpose template can be used in various situations. Grab these presentation templates today
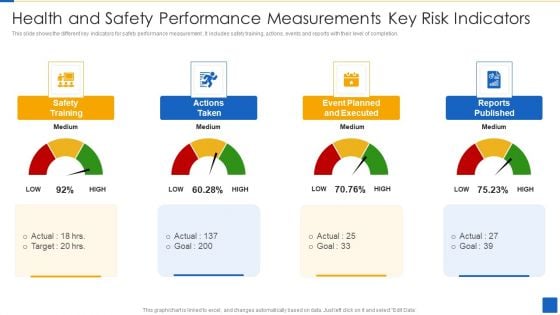
Health And Safety Performance Measurements Key Risk Indicators Download PDF
This slide shows the different key indicators for safety performance measurement . It includes safety training, actions, events and reports with their level of completion.Showcasing this set of slides titled Health And Safety Performance Measurements Key Risk Indicators Download PDF The topics addressed in these templates are Safety Training, Actions Taken, Event Planned Executed All the content presented in this PPT design is completely editable. Download it and make adjustments in color, background, font etc. as per your unique business setting.
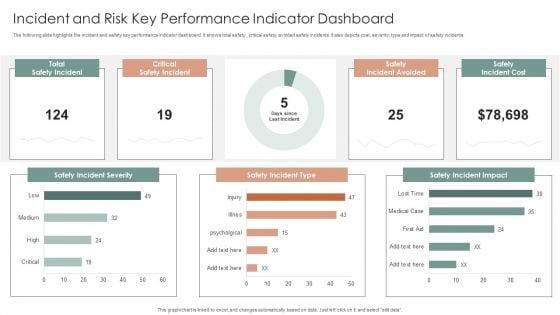
Incident And Risk Key Performance Indicator Dashboard Ppt Gallery Mockup PDF
The following slide highlights the incident and safety key performance indicator dashboard. It shows total safety, critical safety, avoided safety incidents. It also depicts cost, severity, type and impact of safety incidents. Showcasing this set of slides titled Incident And Risk Key Performance Indicator Dashboard Ppt Gallery Mockup PDF. The topics addressed in these templates are Safety Incident Severity, Safety Incident Type, Safety Incident Impact. All the content presented in this PPT design is completely editable. Download it and make adjustments in color, background, font etc. as per your unique business setting.
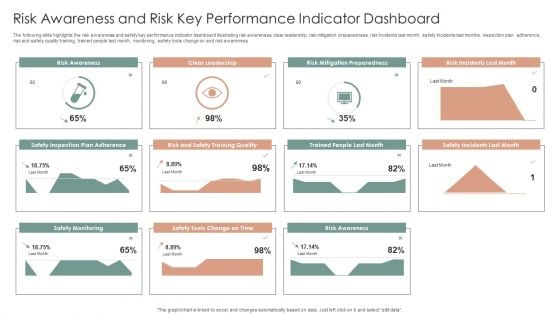
Risk Awareness And Risk Key Performance Indicator Dashboard Ppt Inspiration Ideas PDF
The following slide highlights the risk awareness and safety key performance indicator dashboard illustrating risk awareness, clear leadership, risk mitigation preparedness, risk incidents last month, safety incidents last months, inspection plan adherence, risk and safety quality training, trained people last month, monitoring, safety tools change on and risk awareness. Showcasing this set of slides titled Risk Awareness And Risk Key Performance Indicator Dashboard Ppt Inspiration Ideas PDF. The topics addressed in these templates are Safety Incident Avoided, Safety Incidents, Safety Incident, Accumulated Total. All the content presented in this PPT design is completely editable. Download it and make adjustments in color, background, font etc. as per your unique business setting.
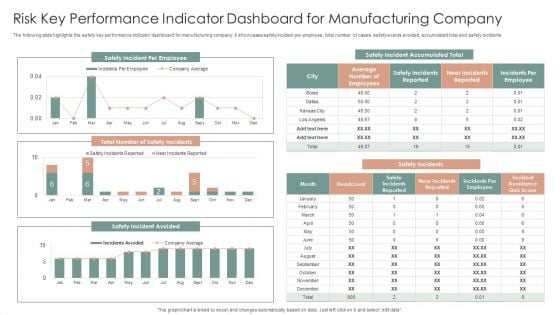
Risk Key Performance Indicator Dashboard For Manufacturing Company Ppt Gallery Graphics Design PDF
The following slide highlights the safety key performance indicator dashboard for manufacturing company. It showcases safety incident per employee, total number of cases, safety events avoided, accumulated total and safety incidents. Pitch your topic with ease and precision using this Risk Key Performance Indicator Dashboard For Manufacturing Company Ppt Gallery Graphics Design PDF. This layout presents information on Safety Incidents, Safety Incident Avoided, Safety Incident Accumulated. It is also available for immediate download and adjustment. So, changes can be made in the color, design, graphics or any other component to create a unique layout.
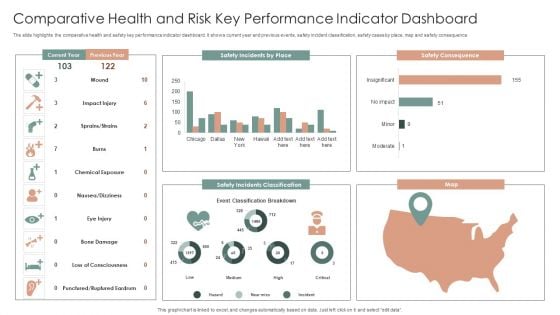
Comparative Health And Risk Key Performance Indicator Dashboard Ppt Portfolio Slide PDF
The slide highlights the comparative health and safety key performance indicator dashboard. It shows current year and previous events, safety incident classification, safety cases by place, map and safety consequence. Showcasing this set of slides titled Comparative Health And Risk Key Performance Indicator Dashboard Ppt Portfolio Slide PDF. The topics addressed in these templates are Safety Consequence, Safety Incidents Classification, Map. All the content presented in this PPT design is completely editable. Download it and make adjustments in color, background, font etc. as per your unique business setting.
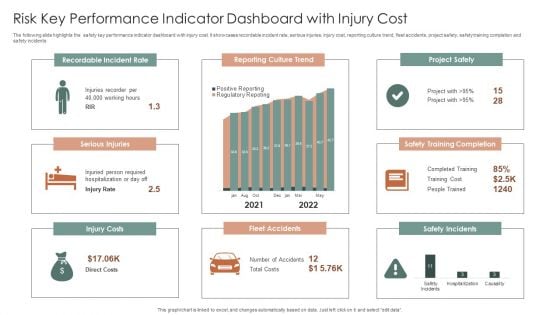
Risk Key Performance Indicator Dashboard With Injury Cost Ppt Summary Brochure PDF
The following slide highlights the safety key performance indicator dashboard with injury cost. It showcases recordable incident rate, serious injuries, injury cost, reporting culture trend, fleet accidents, project safety, safety training completion and safety incidents. Pitch your topic with ease and precision using this Risk Key Performance Indicator Dashboard With Injury Cost Ppt Summary Brochure PDF. This layout presents information on Recordable Incident Rate, Reporting Culture Trend, Project Safety. It is also available for immediate download and adjustment. So, changes can be made in the color, design, graphics or any other component to create a unique layout.

Employee Health And Risk Key Performance Indicator Dashboard Ppt Layouts Brochure PDF
The following slide highlights the employee health and safety key performance indicator dashboard illustrating narrow escapes, potential hazards, improvement opportunity, total incidents, health and safety learning, safety visit by management, ltir and trir, severe injuries and fatalities and safety goals. Showcasing this set of slides titled Employee Health And Risk Key Performance Indicator Dashboard Ppt Layouts Brochure PDF. The topics addressed in these templates are Narrow Escapes, Potential Hazards, Improvement Opportunity. All the content presented in this PPT design is completely editable. Download it and make adjustments in color, background, font etc. as per your unique business setting.
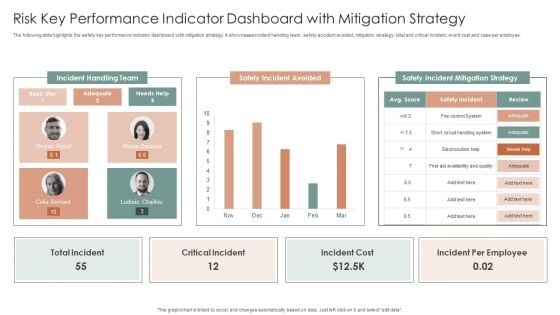
Risk Key Performance Indicator Dashboard With Mitigation Strategy Ppt Inspiration Design Templates PDF
The following slide highlights the safety key performance indicator dashboard with mitigation strategy. It showcases incident handling team, safety accident avoided, mitigation strategy, total and critical incident, event cost and case per employee. Showcasing this set of slides titled Risk Key Performance Indicator Dashboard With Mitigation Strategy Ppt Inspiration Design Templates PDF. The topics addressed in these templates are Incident Handling Team, Safety Incident Avoided, Safety Incident. All the content presented in this PPT design is completely editable. Download it and make adjustments in color, background, font etc. as per your unique business setting.
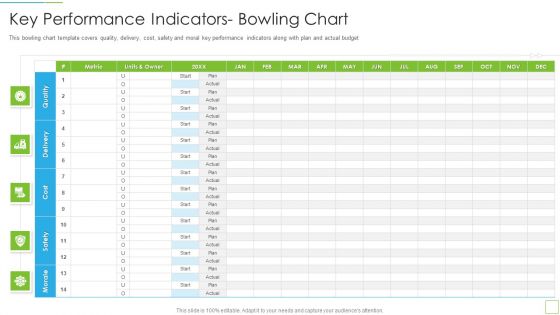
Hoshin Kanri Pitch Deck Key Performance Indicators Bowling Chart Introduction PDF
This bowling chart template covers quality, delivery, cost, safety and moral key performance indicators along with plan and actual budget Deliver an awe inspiring pitch with this creative hoshin kanri pitch deck key performance indicators bowling chart introduction pdf bundle. Topics like key performance indicators bowling chart can be discussed with this completely editable template. It is available for immediate download depending on the needs and requirements of the user.
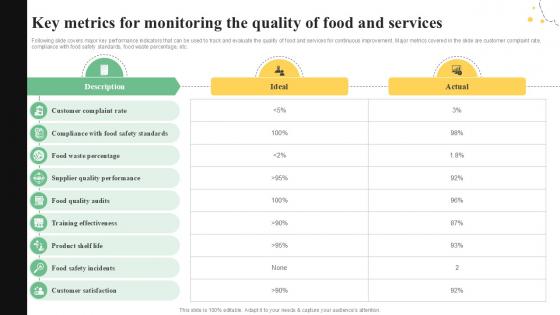
Key Metrics For Monitoring The Quality Control Guide For Food PPT Slide
Following slide covers major key performance indicators that can be used to track and evaluate the quality of food and services for continuous improvement. Major metrics covered in the slide are customer complaint rate, compliance with food safety standards, food waste percentage, etc. Explore a selection of the finest Key Metrics For Monitoring The Quality Control Guide For Food PPT Slide here. With a plethora of professionally designed and pre-made slide templates, you can quickly and easily find the right one for your upcoming presentation. You can use our Key Metrics For Monitoring The Quality Control Guide For Food PPT Slide to effectively convey your message to a wider audience. Slidegeeks has done a lot of research before preparing these presentation templates. The content can be personalized and the slides are highly editable. Grab templates today from Slidegeeks. Following slide covers major key performance indicators that can be used to track and evaluate the quality of food and services for continuous improvement. Major metrics covered in the slide are customer complaint rate, compliance with food safety standards, food waste percentage, etc.
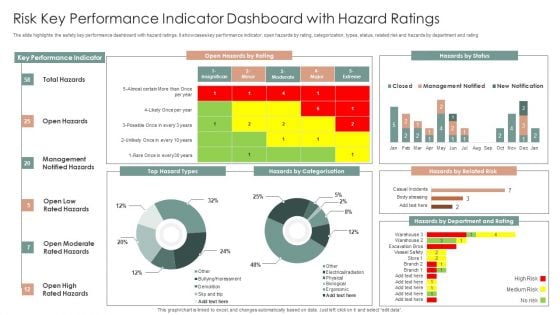
Risk Key Performance Indicator Dashboard With Hazard Ratings Ppt Layouts Slideshow PDF
The slide highlights the safety key performance dashboard with hazard ratings. It showcases key performance indicator, open hazards by rating, categorization, types, status, related risk and hazards by department and rating. Showcasing this set of slides titled Risk Key Performance Indicator Dashboard With Hazard Ratings Ppt Layouts Slideshow PDF. The topics addressed in these templates are Key Performance Indicator, Open Hazards, Hazards By Status. All the content presented in this PPT design is completely editable. Download it and make adjustments in color, background, font etc. as per your unique business setting.
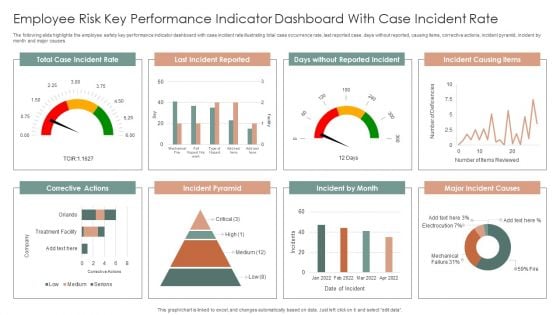
Employee Risk Key Performance Indicator Dashboard With Case Incident Rate Ppt Professional Information PDF
The following slide highlights the employee safety key performance indicator dashboard with case incident rate illustrating total case occurrence rate, last reported case, days without reported, causing items, corrective actions, incident pyramid, incident by month and major causes. Pitch your topic with ease and precision using this Employee Risk Key Performance Indicator Dashboard With Case Incident Rate Ppt Professional Information PDF. This layout presents information on Total Case, Incident Rate, Last Incident Reported, Incident Causing Items. It is also available for immediate download and adjustment. So, changes can be made in the color, design, graphics or any other component to create a unique layout.

Patient Health And Risk Key Performance Indicator Dashboard Ppt Infographic Template Summary PDF
The following slide highlights the patient health and safety key performance indicator dashboard illustrating admission by department, admission by cost, patient satisfaction, total patients, operations cost, patient density, total staff, waiting time, treatment satisfaction and treatment confidence. Pitch your topic with ease and precision using this Patient Health And Risk Key Performance Indicator Dashboard Ppt Infographic Template Summary PDF. This layout presents information on Admission By Department, Admission Vs Cost, Patient Satisfaction. It is also available for immediate download and adjustment. So, changes can be made in the color, design, graphics or any other component to create a unique layout.
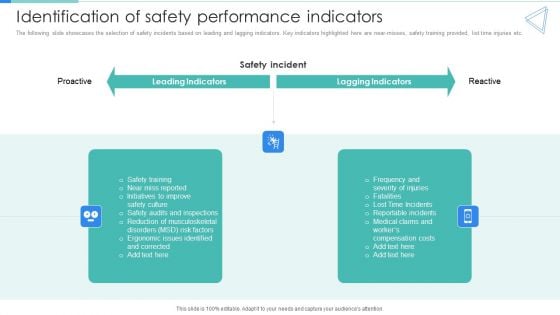
Deployment Of Workplace Safety Management Program Identification Of Safety Performance Indicators Summary PDF
The following slide showcases the selection of safety incidents based on leading and lagging indicators. Key indicators highlighted here are near misses, safety training provided, list time injuries etc. Do you have to make sure that everyone on your team knows about any specific topic I yes, then you should give Deployment Of Workplace Safety Management Program Identification Of Safety Performance Indicators Summary PDF a try. Our experts have put a lot of knowledge and effort into creating this impeccable Deployment Of Workplace Safety Management Program Identification Of Safety Performance Indicators Summary PDF. You can use this template for your upcoming presentations, as the slides are perfect to represent even the tiniest detail. You can download these templates from the Slidegeeks website and these are easy to edit. So grab these today.
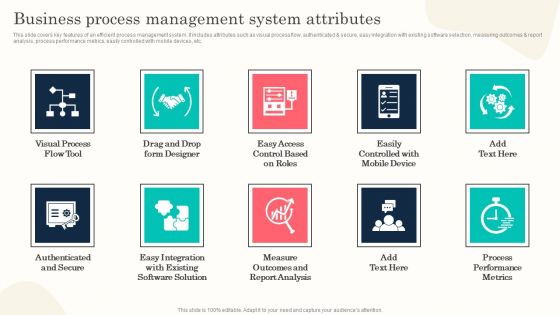
Business Process Management System Attributes Formats PDF
This slide covers key features of an efficient process management system. It includes attributes such as visual process flow, authenticated and secure, easy integration with existing software selection, measuring outcomes and report analysis, process performance metrics, easily controlled with mobile devices, etc. There are so many reasons you need a Business Process Management System Attributes Formats PDF. The first reason is you can not spend time making everything from scratch, Thus, Slidegeeks has made presentation templates for you too. You can easily download these templates from our website easily.
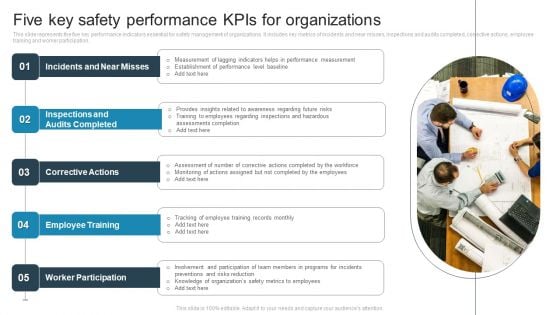
Five Key Safety Performance Kpis For Organizations Brochure PDF
This slide represents the five key performance indicators essential for safety management of organizations. It includes key metrics of incidents and near misses, inspections and audits completed, corrective actions, employee training and worker participation. Presenting Five Key Safety Performance Kpis For Organizations Brochure PDF to dispense important information. This template comprises Five stages. It also presents valuable insights into the topics including Incidents And Near Misses, Inspections And Audits Completed, Corrective Actions. This is a completely customizable PowerPoint theme that can be put to use immediately. So, download it and address the topic impactfully.
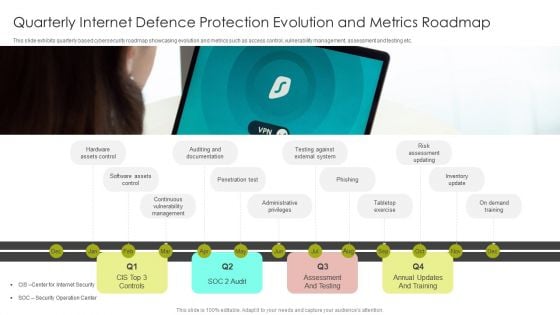
Quarterly Internet Defence Protection Evolution And Metrics Roadmap Sample PDF
This slide exhibits quarterly based cybersecurity roadmap showcasing evolution and metrics such as access control, vulnerability management, assessment and testing etc.Presenting Quarterly Internet Defence Protection Evolution And Metrics Roadmap Sample PDF to dispense important information. This template comprises one stage. It also presents valuable insights into the topics including Auditing Documentation, Penetration Test, Administrative Privileges. This is a completely customizable PowerPoint theme that can be put to use immediately. So, download it and address the topic impactfully.
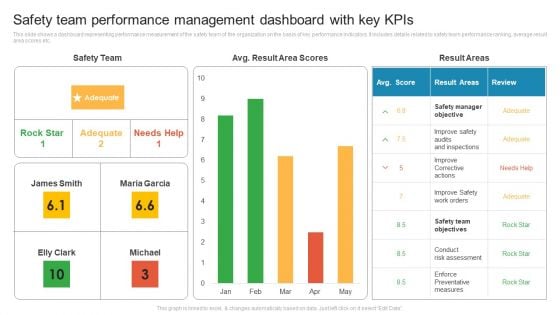
Safety Team Performance Management Dashboard With Key Kpis Rules PDF
This slide shows a dashboard representing performance measurement of the safety team of the organization on the basis of key performance indicators. It includes details related to safety team performance ranking, average result area scores etc. Pitch your topic with ease and precision using this Safety Team Performance Management Dashboard With Key Kpis Rules PDF. This layout presents information on Improve Corrective Actions, Safety Manager Objective, Conduct Risk Assessment. It is also available for immediate download and adjustment. So, changes can be made in the color, design, graphics or any other component to create a unique layout.
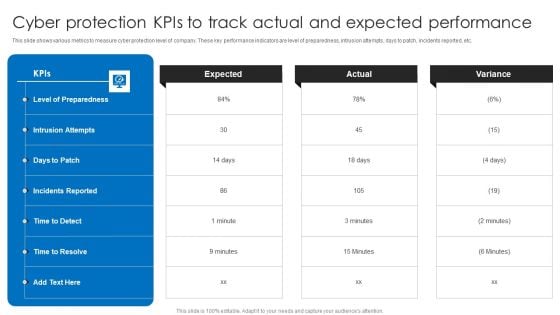
Cyber Protection Kpis To Track Actual And Expected Performance Structure PDF
This slide shows various metrics to measure cyber protection level of company. These key performance indicators are level of preparedness, intrusion attempts, days to patch, incidents reported, etc. Pitch your topic with ease and precision using this Cyber Protection Kpis To Track Actual And Expected Performance Structure PDF. This layout presents information on Cyber Protection Kpis, Track Actual Expected Performance. It is also available for immediate download and adjustment. So, changes can be made in the color, design, graphics or any other component to create a unique layout.
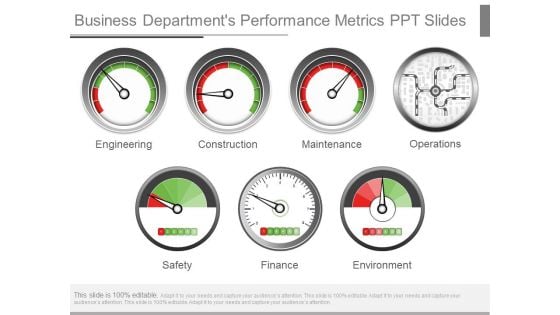
Business Departments Performance Metrics Ppt Slides
This is a business departments performance metrics ppt slides. This is a seven stage process. The stages in this process are engineering, construction, maintenance, operations, safety, finance, environment.
Safety And Health Kpis For Tracking Performance Graph Mockup PDF
This slide represents graph showing key performance indicators tracked by companies for assessment of safety and health performance of their workplace. It includes key metrics such as workforce awareness, safety meetings held, recordable injuries, lost work days, compliance, severity rates etc. Pitch your topic with ease and precision using this Safety And Health Kpis For Tracking Performance Graph Mockup PDF. This layout presents information on Safety And Health, Kpis For Tracking, Performance Graph. It is also available for immediate download and adjustment. So, changes can be made in the color, design, graphics or any other component to create a unique layout.

Company Performance Of Construction Company With Key Insights Portrait PDF
This slide showcases the construction companys performance on various areas. It include cost, time, quality and safety management, cash flow indicator etc. Pitch your topic with ease and precision using this company performance of construction company with key insights portrait pdf. This layout presents information on performance, management. It is also available for immediate download and adjustment. So, changes can be made in the color, design, graphics or any other component to create a unique layout.
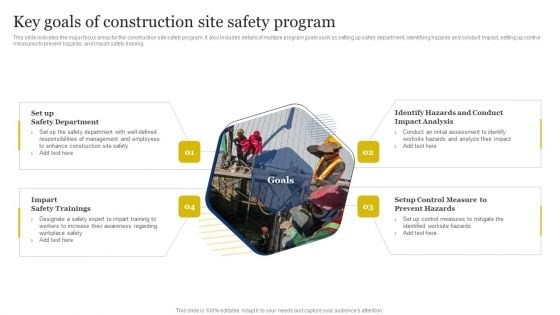
Improvement Of Safety Performance At Construction Site Key Goals Of Construction Site Safety Sample PDF
This slide indicates the major focus areas for the construction site safety program. It also includes details of multiple program goals such as setting up safety department, identifying hazards and conduct impact, setting up control measures to prevent hazards, and impart safety training. Crafting an eye-catching presentation has never been more straightforward. Let your presentation shine with this tasteful yet straightforward Improvement Of Safety Performance At Construction Site Key Goals Of Construction Site Safety Sample PDF template. It offers a minimalistic and classy look that is great for making a statement. The colors have been employed intelligently to add a bit of playfulness while still remaining professional. Construct the ideal Improvement Of Safety Performance At Construction Site Key Goals Of Construction Site Safety Sample PDF that effortlessly grabs the attention of your audience Begin now and be certain to wow your customers

Online Retail Brand Protection Metrics Ppt PowerPoint Presentation Model Information Cpb
Presenting this set of slides with name online retail brand protection metrics ppt powerpoint presentation model information cpb. This is an editable Powerpoint five stages graphic that deals with topics like online retail brand protection metrics to help convey your message better graphically. This product is a premium product available for immediate download and is 100 percent editable in Powerpoint. Download this now and use it in your presentations to impress your audience.
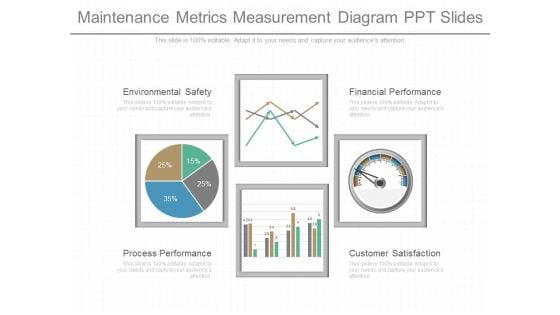
Maintenance Metrics Measurement Diagram Ppt Slides
This is a maintenance metrics measurement diagram ppt slides. This is a four stage process. The stages in this process are environmental safety, process performance, financial performance, customer satisfaction.
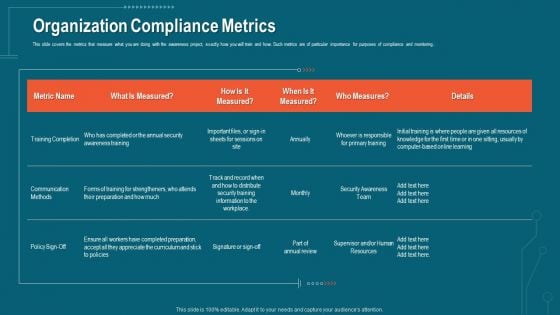
Companys Data Safety Recognition Organization Compliance Metrics Clipart PDF
This slide covers the metrics that measure what you are doing with the awareness project, exactly how you will train and how. Such metrics are of particular importance for purposes of compliance and monitoring. Deliver and pitch your topic in the best possible manner with this companys data safety recognition organization compliance metrics clipart pdf. Use them to share invaluable insights on organization compliance metrics and impress your audience. This template can be altered and modified as per your expectations. So, grab it now.
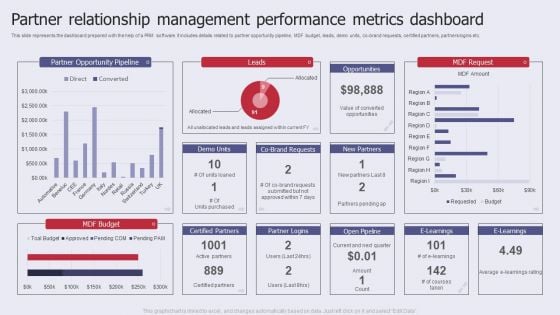
Partner Relationship Management Performance Metrics Dashboard Pictures PDF
This slide represents the dashboard prepared with the help of a PRM software. It includes details related to partner opportunity pipeline, MDF budget, leads, demo units, co brand requests, certified partners, partners logins etc. Showcasing this set of slides titled Partner Relationship Management Performance Metrics Dashboard Pictures PDF. The topics addressed in these templates are Partner Opportunity Pipeline, MDF Budget, Performance Metrics Dashboard. All the content presented in this PPT design is completely editable. Download it and make adjustments in color, background, font etc. as per your unique business setting.
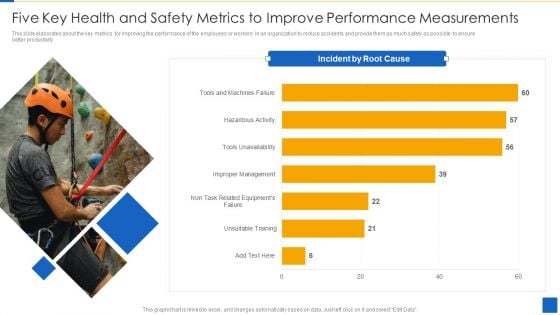
Five Key Health And Safety Metrics To Improve Performance Measurements Brochure PDF
This slide elaborates about the key metrics for improving the performance of the employees or workers in an organization to reduce accidents and provide them as much safety as possible to ensure better productivity.Showcasing this set of slides titled Five Key Health And Safety Metrics To Improve Performance Measurements Brochure PDF The topics addressed in these templates are Incidents Root Cause, Unsuitable Training, Improper Management All the content presented in this PPT design is completely editable. Download it and make adjustments in color, background, font etc. as per your unique business setting.
Metrics For Tracking Effectiveness Of Safety Measures In The Organization Ppt PowerPoint Presentation File Diagrams PDF
The following slide showcases five safety metrics to monitor the effectiveness of current safety measures. Key KPIs inluded here are reported incidents, accident free days, cases of near misses, audit acore, BBS score etc. Want to ace your presentation in front of a live audience Our Metrics For Tracking Effectiveness Of Safety Measures In The Organization Ppt PowerPoint Presentation File Diagrams PDF can help you do that by engaging all the users towards you. Slidegeeks experts have put their efforts and expertise into creating these impeccable powerpoint presentations so that you can communicate your ideas clearly. Moreover, all the templates are customizable, and easy to edit and downloadable. Use these for both personal and commercial use.
Enhancing Cyber Safety With Vulnerability Administration Log Management Services Metrics Icons PDF
Presenting enhancing cyber safety with vulnerability administration log management services metrics icons pdf to provide visual cues and insights. Share and navigate important information on eight stages that need your due attention. This template can be used to pitch topics like logfiles, configurations, messages, metrics, scripts. In addtion, this PPT design contains high resolution images, graphics, etc, that are easily editable and available for immediate download.
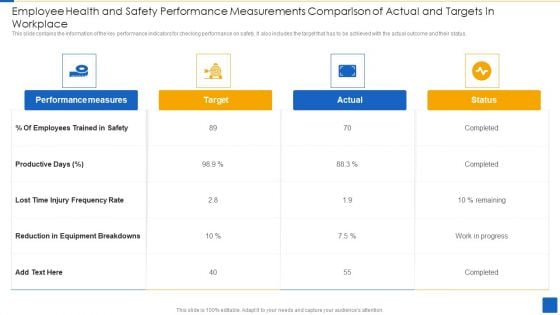
Employee Health And Safety Performance Measurements Comparison Of Actual And Targets In Workplace Mockup PDF
This slide contains the information of the key performance indicators for checking performance on safety. It also includes the target that has to be achieved with the actual outcome and their status. Persuade your audience using this Employee Health And Safety Performance Measurements Comparison Of Actual And Targets In Workplace Mockup PDF This PPT design covers five stages, thus making it a great tool to use. It also caters to a variety of topics including Performance Measures, Reduction Equipment Breakdowns, Employees Trained Download this PPT design now to present a convincing pitch that not only emphasizes the topic but also showcases your presentation skills.
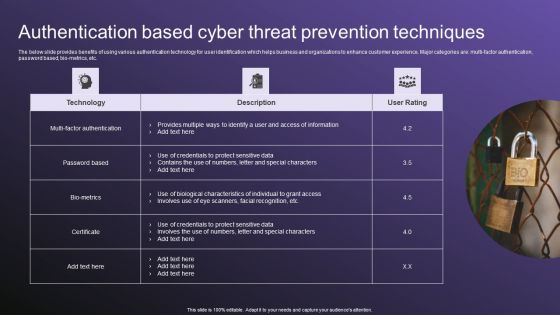
Authentication Based Cyber Threat Prevention Techniques Download PDF
The below slide provides benefits of using various authentication technology for user identification which helps business and organizations to enhance customer experience. Major categories are multi factor authentication, password based, bio-metrics, etc. Showcasing this set of slides titled Authentication Based Cyber Threat Prevention Techniques Download PDF. The topics addressed in these templates are Techniques, Authentication, Threat. All the content presented in this PPT design is completely editable. Download it and make adjustments in color, background, font etc. as per your unique business setting.
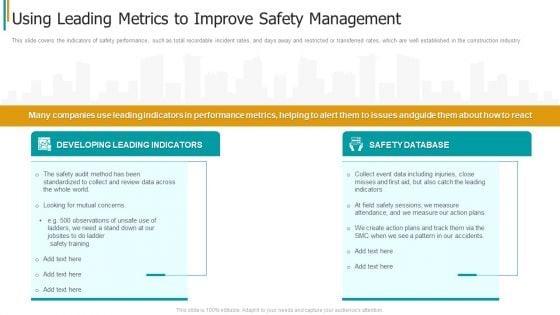
Construction Sector Project Risk Management Using Leading Metrics To Improve Safety Management Sample PDF
This slide covers the indicators of safety performance, such as total recordable incident rates, and days away and restricted or transferred rates, which are well established in the construction industry. This is a construction sector project risk management using leading metrics to improve safety management sample pdf template with various stages. Focus and dispense information on two stages using this creative set, that comes with editable features. It contains large content boxes to add your information on topics like developing leading indicators, safety database. You can also showcase facts, figures, and other relevant content using this PPT layout. Grab it now.
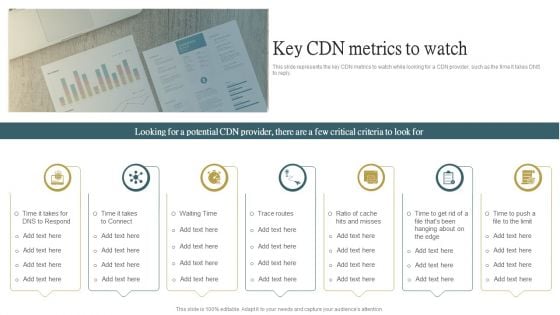
Cloud Content Delivery Network Key CDN Metrics To Watch Background PDF
This slide represents the key CDN metrics to watch while looking for a CDN provider, such as the time it takes DNS to reply. Explore a selection of the finest Cloud Content Delivery Network Key CDN Metrics To Watch Background PDF here. With a plethora of professionally designed and pre made slide templates, you can quickly and easily find the right one for your upcoming presentation. You can use our Cloud Content Delivery Network Key CDN Metrics To Watch Background PDF to effectively convey your message to a wider audience. Slidegeeks has done a lot of research before preparing these presentation templates. The content can be personalized and the slides are highly editable. Grab templates today from Slidegeeks.
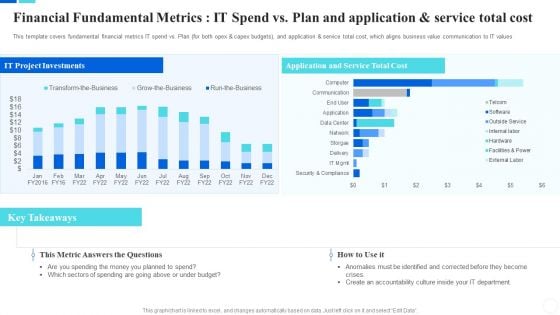
Communicate Company Value To Your Stakeholders Financial Fundamental Metrics Graphics PDF
These indicators assist IT leaders in stewarding technology expenditures and investments, and they are essential to managing the IT company. These measures aid in the management of the departments financial health and may indicate levers for cost reduction, improved resource allocation, and enhanced accountability. Deliver and pitch your topic in the best possible manner with this communicate company value to your stakeholders financial fundamental metrics graphics pdf. Use them to share invaluable insights on organizations, budget, protect and impress your audience. This template can be altered and modified as per your expectations. So, grab it now.
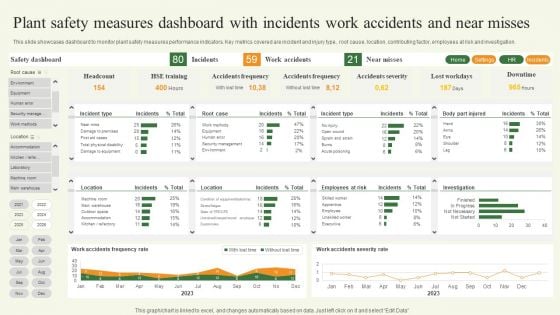
Plant Safety Measures Dashboard With Incidents Work Accidents And Near Misses Template PDF
This slide showcases dashboard to monitor plant safety measures performance indicators. Key metrics covered are incident and injury type, root cause, location, contributing factor, employees at risk and investigation. Pitch your topic with ease and precision using this Plant Safety Measures Dashboard With Incidents Work Accidents And Near Misses Template PDF. This layout presents information on Plant Safety Measures Dashboard, Incidents Work Accidents. It is also available for immediate download and adjustment. So, changes can be made in the color, design, graphics or any other component to create a unique layout.
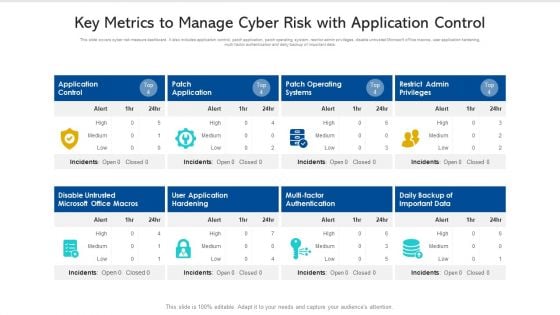
Key Metrics To Manage Cyber Risk With Application Control Ppt PowerPoint Presentation Pictures Slide PDF
This slide covers cyber risk measure dashboard. It also includes application control, patch application, patch operating system, restrict admin privileges, disable untrusted Microsoft office macros, user application hardening, multi factor authentication and daily backup of important data. Pitch your topic with ease and precision using this key metrics to manage cyber risk with application control ppt powerpoint presentation pictures slide pdf. This layout presents information on disable untrusted microsoft office macros, application control, patch operating systems. It is also available for immediate download and adjustment. So, changes can be made in the color, design, graphics or any other component to create a unique layout.
Marketing Success Metrics Tracking Social Media Engagement Rate For Information PDF
This slide covers an overview of the social media engagement rate to identify if the content is reaching the target audience. It also includes improvement strategies such as having a consistent, authentic voice, knowing your algorithms, and creating shareable content. There are so many reasons you need a Marketing Success Metrics Tracking Social Media Engagement Rate For Information PDF. The first reason is you cant spend time making everything from scratch, Thus, Slidegeeks has made presentation templates for you too. You can easily download these templates from our website easily.
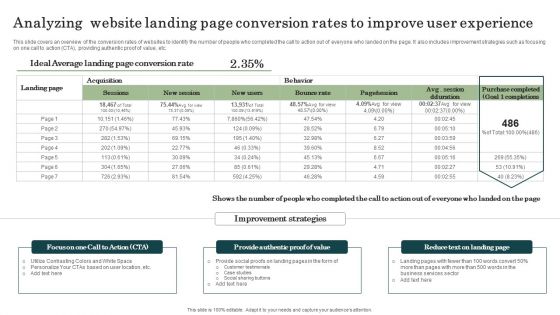
Marketing Success Metrics Analyzing Website Landing Page Conversion Rates Formats PDF
This slide covers an overview of the conversion rates of websites to identify the number of people who completed the call to action out of everyone who landed on the page. It also includes improvement strategies such as focusing on one call to action CTA, providing authentic proof of value, etc. The best PPT templates are a great way to save time, energy, and resources. Slidegeeks have 100 percent editable powerpoint slides making them incredibly versatile. With these quality presentation templates, you can create a captivating and memorable presentation by combining visually appealing slides and effectively communicating your message. Download Marketing Success Metrics Analyzing Website Landing Page Conversion Rates Formats PDF from Slidegeeks and deliver a wonderful presentation.
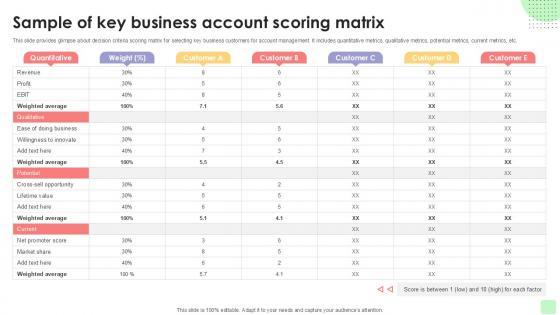
Sample Of Key Business Account Detailed Business Account PPT Presentation Strategy SS V
This slide provides glimpse about decision criteria scoring matrix for selecting key business customers for account management. It includes quantitative metrics, qualitative metrics, potential metrics, current metrics, etc. Step up your game with our enchanting Sample Of Key Business Account Detailed Business Account PPT Presentation Strategy SS V deck, guaranteed to leave a lasting impression on your audience. Crafted with a perfect balance of simplicity, and innovation, our deck empowers you to alter it to your specific needs. You can also change the color theme of the slide to mold it to your companys specific needs. Save time with our ready-made design, compatible with Microsoft versions and Google Slides. Additionally, its available for download in various formats including JPG, JPEG, and PNG. Outshine your competitors with our fully editable and customized deck. This slide provides glimpse about decision criteria scoring matrix for selecting key business customers for account management. It includes quantitative metrics, qualitative metrics, potential metrics, current metrics, etc.

Digital Marketing Strategy For Building Brand Extension Marketing Scheme Pictures PDF
This slide showcases metrics of social media to measure its performance. Key indicators includes its usage by people and salesperson, average time spent on social media, influence of social media on purchase decision an networking profile of people.Persuade your audience using this Digital Marketing Strategy For Building Brand Extension Marketing Scheme Pictures PDF. This PPT design covers five stages, thus making it a great tool to use. It also caters to a variety of topics including Purchase Decision, Consumers Refer, Networking Profile. Download this PPT design now to present a convincing pitch that not only emphasizes the topic but also showcases your presentation skills.
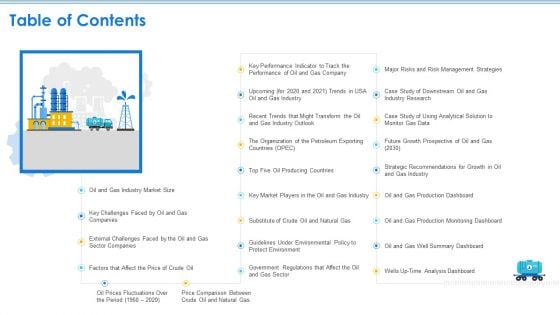
Case Competition Petroleum Sector Issues Table Of Contents Ppt Gallery Samples PDF
Deliver an awe inspiring pitch with this creative case competition petroleum sector issues table of contents ppt gallery samples pdf bundle. Topics like key performance indicator, management strategies, growth prospective, production dashboard, protect environment can be discussed with this completely editable template. It is available for immediate download depending on the needs and requirements of the user.
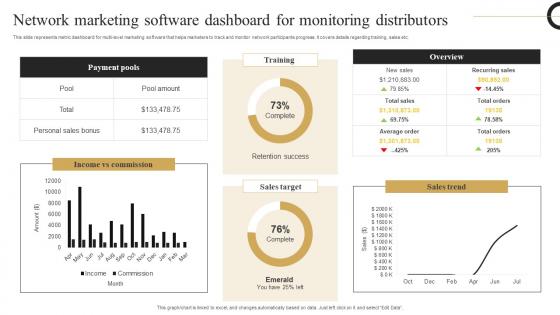
Network Marketing Software Strategic Plan Develop Multi Level Marketing Mockup Pdf
This slide represents metric dashboard for multi level marketing software that helps marketers to track and monitor network participants progress. It covers details regarding training, sales etc. Are you searching for a Network Marketing Software Strategic Plan Develop Multi Level Marketing Mockup Pdf that is uncluttered, straightforward, and original Its easy to edit, and you can change the colors to suit your personal or business branding. For a presentation that expresses how much effort you have put in, this template is ideal With all of its features, including tables, diagrams, statistics, and lists, its perfect for a business plan presentation. Make your ideas more appealing with these professional slides. Download Network Marketing Software Strategic Plan Develop Multi Level Marketing Mockup Pdf from Slidegeeks today. This slide represents metric dashboard for multi level marketing software that helps marketers to track and monitor network participants progress. It covers details regarding training, sales etc.
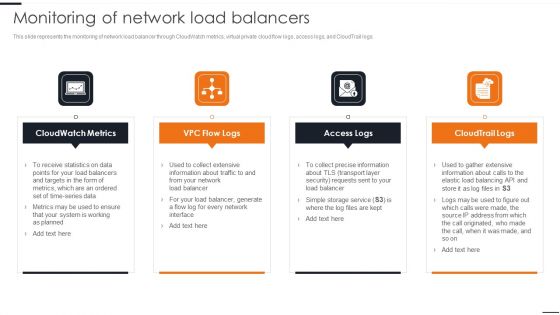
Elastic NLB Monitoring Of Network Load Balancers Introduction PDF
This slide represents the monitoring of network load balancer through CloudWatch metrics, virtual private cloud flow logs, access logs, and CloudTrail logs. If you are looking for a format to display your unique thoughts, then the professionally designed Elastic NLB Monitoring Of Network Load Balancers Introduction PDF is the one for you. You can use it as a Google Slides template or a PowerPoint template. Incorporate impressive visuals, symbols, images, and other charts. Modify or reorganize the text boxes as you desire. Experiment with shade schemes and font pairings. Alter, share or cooperate with other people on your work. Download Elastic NLB Monitoring Of Network Load Balancers Introduction PDF and find out how to give a successful presentation. Present a perfect display to your team and make your presentation unforgettable.
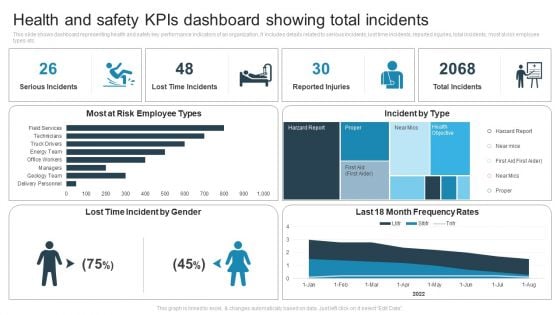
Health And Safety Kpis Dashboard Showing Total Incidents Pictures PDF
This slide shows dashboard representing health and safety key performance indicators of an organization. It includes details related to serious incidents, lost time incidents, reported injuries, total incidents, most at risk employee types etc. Showcasing this set of slides titled Health And Safety Kpis Dashboard Showing Total Incidents Pictures PDF. The topics addressed in these templates are Lost Time Incident, Most At Risk Employee, Incident By Type. All the content presented in this PPT design is completely editable. Download it and make adjustments in color, background, font etc. as per your unique business setting.
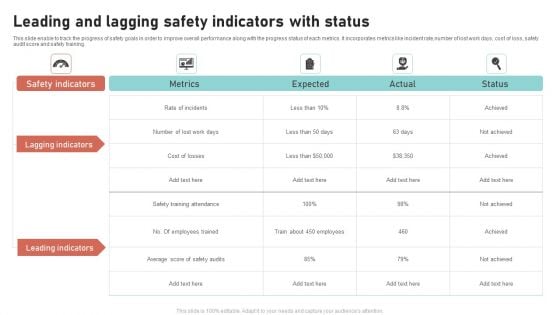
Leading And Lagging Safety Indicators With Status Slides PDF
This slide enable to track the progress of safety goals in order to improve overall performance along with the progress status of each metrics. It incorporates metrics like incident rate,number of lost work days, cost of loss, safety audit score and safety training. Pitch your topic with ease and precision using this Leading And Lagging Safety Indicators With Status Slides PDF. This layout presents information on Safety Indicators, Metrics, Expected, Lagging Indicators. It is also available for immediate download and adjustment. So, changes can be made in the color, design, graphics or any other component to create a unique layout.


 Continue with Email

 Home
Home


