Kpi Summary
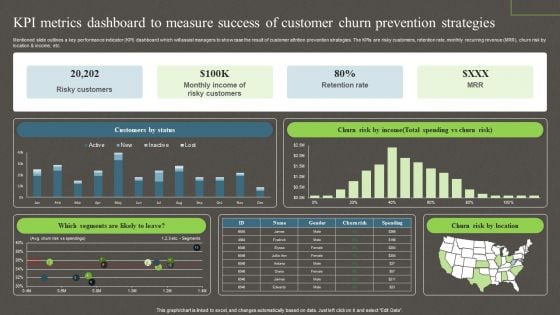
Kpi Metrics Dashboard To Measure Success Of Customer Churn Prevention Strategies Ppt PowerPoint Presentation File Model PDF
Mentioned slide outlines a key performance indicator KPI dashboard which will assist managers to showcase the result of customer attrition prevention strategies. The KPIs are risky customers, retention rate, monthly recurring revenue MRR, churn risk by location and income, etc. This Kpi Metrics Dashboard To Measure Success Of Customer Churn Prevention Strategies Ppt PowerPoint Presentation File Model PDF from Slidegeeks makes it easy to present information on your topic with precision. It provides customization options, so you can make changes to the colors, design, graphics, or any other component to create a unique layout. It is also available for immediate download, so you can begin using it right away. Slidegeeks has done good research to ensure that you have everything you need to make your presentation stand out. Make a name out there for a brilliant performance.
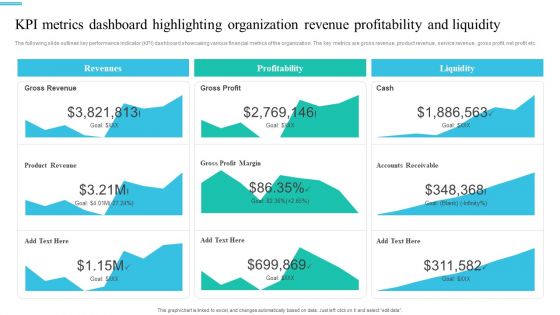
Monetary Planning And Evaluation Guide KPI Metrics Dashboard Highlighting Organization Revenue Profitability And Liquidity Ppt Diagram Images PDF
The following slide outlines key performance indicator KPI dashboard showcasing various financial metrics of the organization. The key metrics are gross revenue, product revenue, service revenue, gross profit, net profit etc. Coming up with a presentation necessitates that the majority of the effort goes into the content and the message you intend to convey. The visuals of a PowerPoint presentation can only be effective if it supplements and supports the story that is being told. Keeping this in mind our experts created Monetary Planning And Evaluation Guide KPI Metrics Dashboard Highlighting Organization Revenue Profitability And Liquidity Ppt Diagram Images PDF to reduce the time that goes into designing the presentation. This way, you can concentrate on the message while our designers take care of providing you with the right template for the situation.
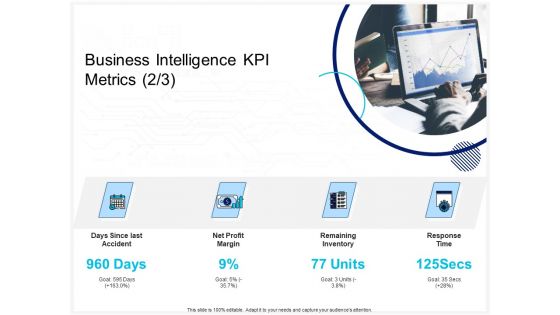
Enterprise Problem Solving And Intellect Business Intelligence KPI Metrics Profit Ppt PowerPoint Presentation Infographic Template Portrait PDF
Presenting this set of slides with name enterprise problem solving and intellect business intelligence kpi metrics profit ppt powerpoint presentation infographic template portrait pdf. This is a four stage process. The stages in this process are days since last accident, net profit margin, remaining inventory, response time. This is a completely editable PowerPoint presentation and is available for immediate download. Download now and impress your audience.
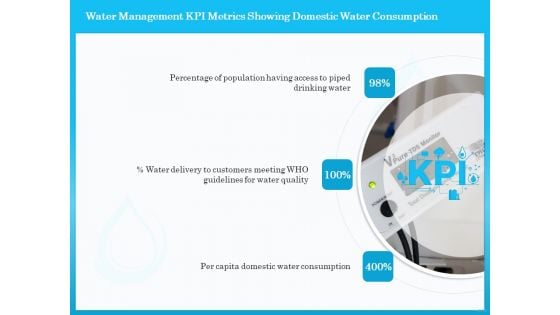
Monitoring And Evaluating Water Quality Water Management KPI Metrics Showing Domestic Water Consumption Ppt Layouts Tips PDF
Presenting this set of slides with name monitoring and evaluating water quality water management kpi metrics showing domestic water consumption ppt layouts tips pdf. This is a three stage process. The stages in this process are drinking water, customers meeting, who guidelines, water quality, per capita domestic water consumption. This is a completely editable PowerPoint presentation and is available for immediate download. Download now and impress your audience.
Sustainability Calculation With KPI Effective Rate Metrics By Customer And Offering Ppt PowerPoint Presentation Icon Files PDF
This slide covers effective rate metrics. It shows over year over comparison of effective rate per customer as well as effective rate per offering. Deliver an awe inspiring pitch with this creative sustainability calculation with kpi effective rate metrics by customer and offering ppt powerpoint presentation icon files pdf bundle. Topics like effective rate metrics by customer and offering can be discussed with this completely editable template. It is available for immediate download depending on the needs and requirements of the user.
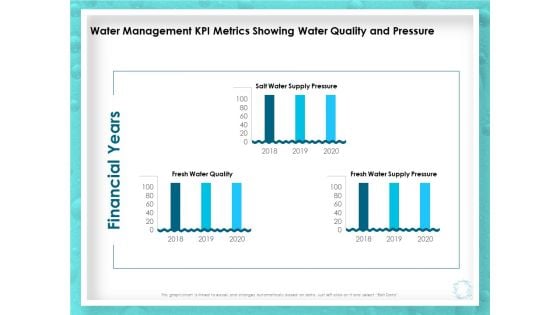
WQM System Water Management KPI Metrics Showing Water Quality And Pressure Ppt PowerPoint Presentation Model Example File PDF
Presenting this set of slides with name wqm system water management kpi metrics showing water quality and pressure ppt powerpoint presentation model example file pdf. The topics discussed in these slides are financial years, fresh water quality, fresh water supply pressure, salt water supply pressure, 2018 to 2020. This is a completely editable PowerPoint presentation and is available for immediate download. Download now and impress your audience.
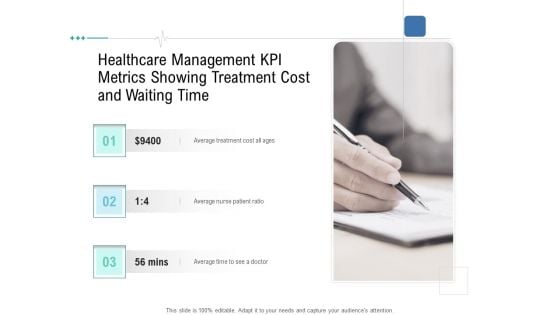
Health Centre Management Business Plan Healthcare Management KPI Metrics Showing Treatment Cost And Waiting Time Portrait PDF
Presenting health centre management business plan healthcare management kpi metrics showing treatment cost and waiting time portrait pdf to provide visual cues and insights. Share and navigate important information on three stages that need your due attention. This template can be used to pitch topics like average treatment cost all ages, average nurse patient ratio, average time to see a doctor. In addtion, this PPT design contains high resolution images, graphics, etc, that are easily editable and available for immediate download.
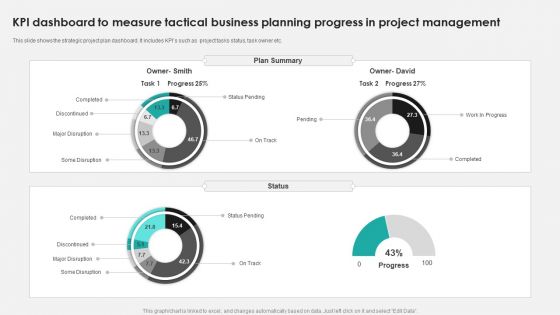
KPI Dashboard To Measure Tactical Business Planning Progress In Project Management Ppt PowerPoint Presentation File Example File PDF
This slide shows the strategic project plan dashboard. It includes KPIs such as project tasks status, task owner etc. Showcasing this set of slides titled KPI Dashboard To Measure Tactical Business Planning Progress In Project Management Ppt PowerPoint Presentation File Example File PDF. The topics addressed in these templates are Discontinued, Some Disruption, Completed. All the content presented in this PPT design is completely editable. Download it and make adjustments in color, background, font etc. as per your unique business setting.
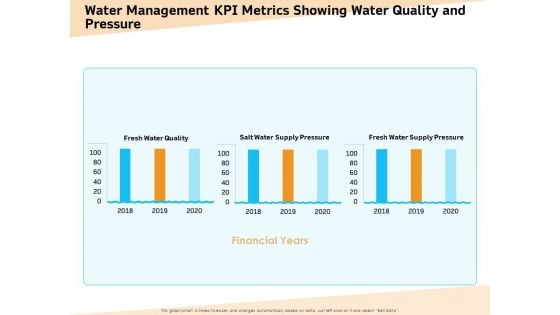
Optimization Of Water Usage Water Management KPI Metrics Showing Water Quality And Pressure Ppt Gallery Graphics PDF
Presenting this set of slides with name optimization of water usage water management kpi metrics showing water quality and pressure ppt gallery graphics pdf. The topics discussed in these slides are financial years, fresh water quality, fresh water supply pressure, salt water supply pressure, 2018 to 2020. This is a completely editable PowerPoint presentation and is available for immediate download. Download now and impress your audience.
Monitoring And Evaluating Water Quality Water Management KPI Metrics Showing Water Quality And Pressure Ppt Icon Maker PDF
Presenting this set of slides with name monitoring and evaluating water quality water management kpi metrics showing water quality and pressure ppt icon maker pdf. The topics discussed in these slides are financial years, fresh water quality, fresh water supply pressure, salt water supply pressure, 2018 to 2020. This is a completely editable PowerPoint presentation and is available for immediate download. Download now and impress your audience.
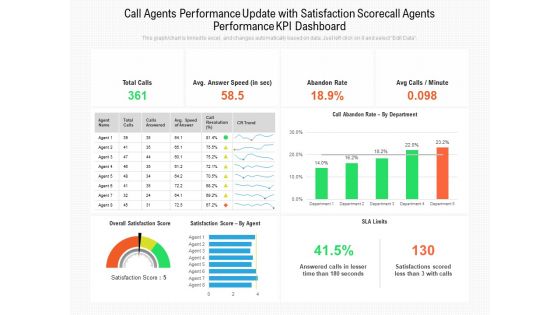
Call Agents Performance Update With Satisfaction Scorecall Agents Performance Kpi Dashboard Ppt PowerPoint Presentation Gallery Background PDF
Presenting this set of slides with name call agents performance update with satisfaction scorecall agents performance kpi dashboard ppt powerpoint presentation gallery background pdf. The topics discussed in these slides are total calls, avg answer speed, abandon rate, avg calls, minute, satisfaction score by agent, sla limits. This is a completely editable PowerPoint presentation and is available for immediate download. Download now and impress your audience.
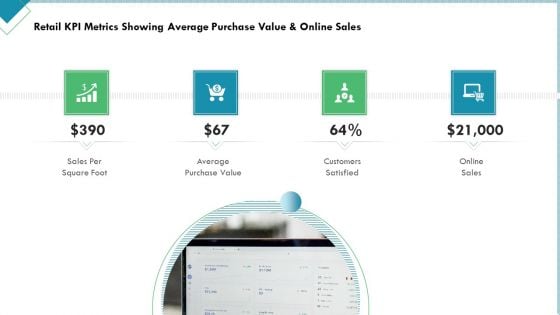
Market Analysis Of Retail Sector Retail KPI Metrics Showing Average Purchase Value And Online Sales Information PDF
Presenting market analysis of retail sector retail kpi metrics showing average purchase value and online sales information pdf to provide visual cues and insights. Share and navigate important information on four stages that need your due attention. This template can be used to pitch topics like sales per square foot, average purchase value, customers satisfied, online sales. In addtion, this PPT design contains high resolution images, graphics, etc, that are easily editable and available for immediate download.

Viral Marketing Techniques To Increase Annual Business Sales Viral Marketing Campaign Plan With KPI Assessment Demonstration PDF
The following slide shows viral marketing campaign plan with KPI analysis. It provides details about buzz, online, offline, word of mouth, team, goals, budget, call-to-action, key performance indicators, fear of missing out FOMO, etc. Slidegeeks is here to make your presentations a breeze with Viral Marketing Techniques To Increase Annual Business Sales Viral Marketing Campaign Plan With KPI Assessment Demonstration PDF With our easy-to-use and customizable templates, you can focus on delivering your ideas rather than worrying about formatting. With a variety of designs to choose from, you are sure to find one that suits your needs. And with animations and unique photos, illustrations, and fonts, you can make your presentation pop. So whether you are giving a sales pitch or presenting to the board, make sure to check out Slidegeeks first

Supply Chain Kpi Dashboard For Effective Financial Analysis Stand Out Digital Supply Chain Tactics Enhancing Graphics PDF
Mentioned slide illustrates KPI dashboard that can be used by managers to assess financial health of supply chain business. KPIs covered are supply chain costs versus sales, cash to order cycle, warehouse operating cost distribution etc.Coming up with a presentation necessitates that the majority of the effort goes into the content and the message you intend to convey. The visuals of a PowerPoint presentation can only be effective if it supplements and supports the story that is being told. Keeping this in mind our experts created Supply Chain Kpi Dashboard For Effective Financial Analysis Stand Out Digital Supply Chain Tactics Enhancing Graphics PDF to reduce the time that goes into designing the presentation. This way, you can concentrate on the message while our designers take care of providing you with the right template for the situation.
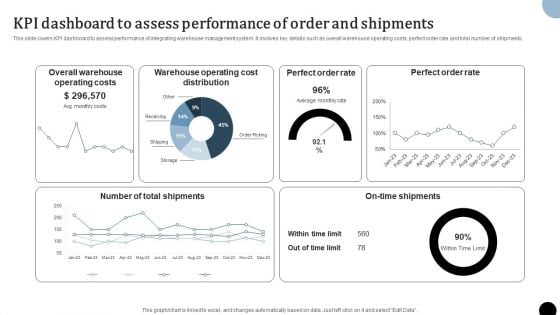
Strategy To Enhance Supply Chain Operations KPI Dashboard To Assess Performance Of Order And Shipments Professional PDF
This slide covers KPI dashboard to assess performance of integrating warehouse management system. It involves key details such as overall warehouse operating costs, perfect order rate and total number of shipments. Slidegeeks has constructed Strategy To Enhance Supply Chain Operations KPI Dashboard To Assess Performance Of Order And Shipments Professional PDF after conducting extensive research and examination. These presentation templates are constantly being generated and modified based on user preferences and critiques from editors. Here, you will find the most attractive templates for a range of purposes while taking into account ratings and remarks from users regarding the content. This is an excellent jumping off point to explore our content and will give new users an insight into our top notch PowerPoint Templates.
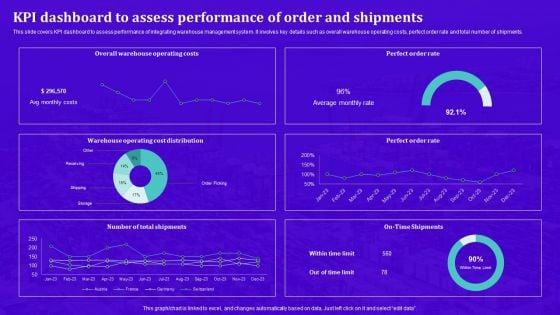
Techniques For Effective Supply Chain Management KPI Dashboard To Assess Performance Of Order And Shipments Structure PDF
This slide covers KPI dashboard to assess performance of integrating warehouse management system. It involves key details such as overall warehouse operating costs, perfect order rate and total number of shipments. Boost your pitch with our creative Techniques For Effective Supply Chain Management KPI Dashboard To Assess Performance Of Order And Shipments Structure PDF. Deliver an awe-inspiring pitch that will mesmerize everyone. Using these presentation templates you will surely catch everyones attention. You can browse the ppts collection on our website. We have researchers who are experts at creating the right content for the templates. So you do not have to invest time in any additional work. Just grab the template now and use them.
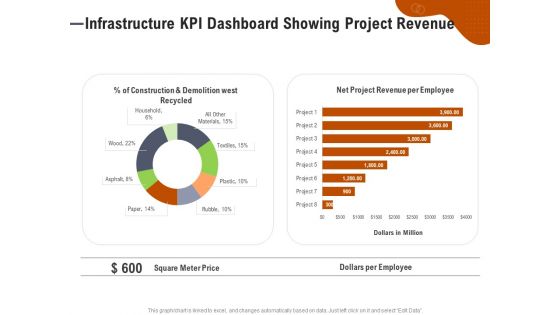
Key Features For Effective Business Management Infrastructure KPI Dashboard Showing Project Revenue Ppt Ideas File Formats PDF
Presenting this set of slides with name key features for effective business management infrastructure kpi dashboard showing project revenue ppt ideas file formats pdf. The topics discussed in these slides are construction and demolition west recycled, net project revenue per employee, square meter price, dollars per employee. This is a completely editable PowerPoint presentation and is available for immediate download. Download now and impress your audience.
Optimization Of Water Usage Water Management KPI Dashboard Showing Water Quality Test Results Ppt Icon Themes PDF
Presenting this set of slides with name optimization of water usage water management kpi dashboard showing water quality test results ppt icon themes pdf. The topics discussed in these slides are contaminants causing epa non compliance, water quality, water quality test results, samples exceeding health guidelines. This is a completely editable PowerPoint presentation and is available for immediate download. Download now and impress your audience.
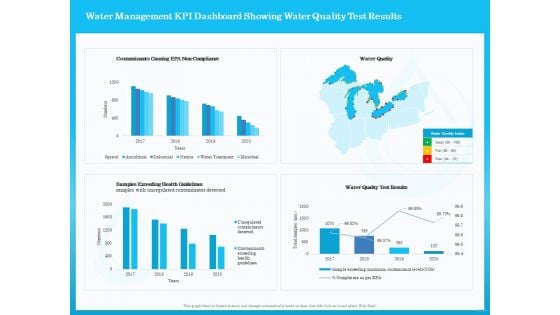
Monitoring And Evaluating Water Quality Water Management KPI Dashboard Showing Water Quality Test Results Ppt Professional Vector PDF
Presenting this set of slides with name monitoring and evaluating water quality water management kpi dashboard showing water quality test results ppt professional vector pdf. The topics discussed in these slides are contaminants causing epa non compliance, water quality, water quality test results, samples exceeding health guidelines. This is a completely editable PowerPoint presentation and is available for immediate download. Download now and impress your audience.
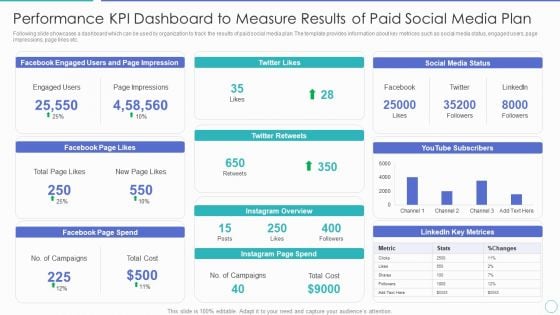
Performance KPI Dashboard To Measure Results Of Paid Social Media Plan Ppt PowerPoint Presentation Gallery Format Ideas PDF
Following slide showcases a dashboard which can be used by organization to track the results of paid social media plan. The template provides information about key metrices such as social media status, engaged users, page impressions, page likes etc. Pitch your topic with ease and precision using this performance kpi dashboard to measure results of paid social media plan ppt powerpoint presentation gallery format ideas pdf. This layout presents information on social media status, instagram page spend, facebook page spend, facebook page likes. It is also available for immediate download and adjustment. So, changes can be made in the color, design, graphics or any other component to create a unique layout.
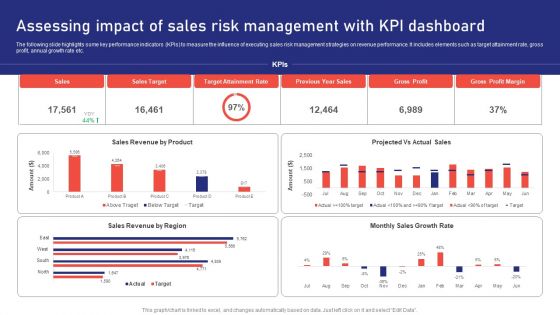
Sales Risk Assessment For Profit Maximization Assessing Impact Of Sales Risk Management With Kpi Dashboard Inspiration PDF
The following slide highlights some key performance indicators KPIs to measure the influence of executing sales risk management strategies on revenue performance. It includes elements such as target attainment rate, gross profit, annual growth rate etc. Find a pre designed and impeccable Sales Risk Assessment For Profit Maximization Assessing Impact Of Sales Risk Management With Kpi Dashboard Inspiration PDF. The templates can ace your presentation without additional effort. You can download these easy to edit presentation templates to make your presentation stand out from others. So, what are you waiting for Download the template from Slidegeeks today and give a unique touch to your presentation.
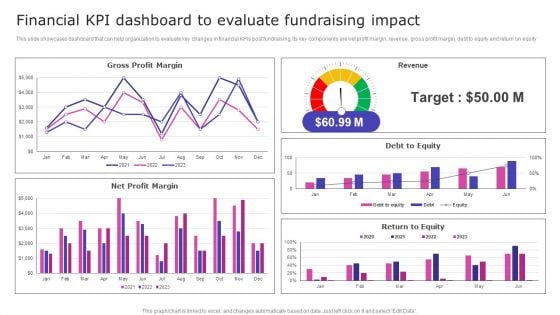
Strategic Fund Acquisition Plan For Business Opertions Expansion Financial KPI Dashboard To Evaluate Fundraising Impact Guidelines PDF
This slide showcases dashboard that can help organization to evaluate key changes in financial KPIs post fundraising. Its key components are net profit margin, revenue, gross profit margin, debt to equity and return on equity. There are so many reasons you need a Strategic Fund Acquisition Plan For Business Opertions Expansion Financial KPI Dashboard To Evaluate Fundraising Impact Guidelines PDF. The first reason is you can not spend time making everything from scratch, Thus, Slidegeeks has made presentation templates for you too. You can easily download these templates from our website easily.
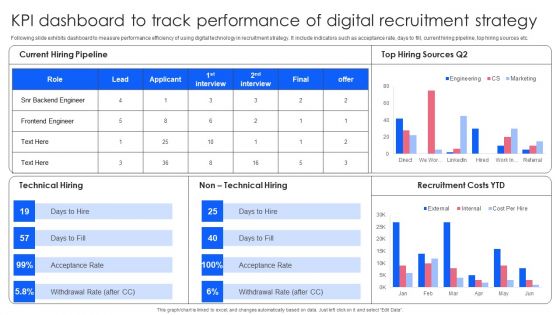
Effective Guide To Build Strong Online Hiring Strategy KPI Dashboard To Track Performance Of Digital Slides PDF
Following slide exhibits dashboard to measure performance efficiency of using digital technology in recruitment strategy. It include indicators such as acceptance rate, days to fill, current hiring pipeline, top hiring sources etc. There are so many reasons you need a Effective Guide To Build Strong Online Hiring Strategy KPI Dashboard To Track Performance Of Digital Slides PDF. The first reason is you cannot spend time making everything from scratch, Thus, Slidegeeks has made presentation templates for you too. You can easily download these templates from our website easily.
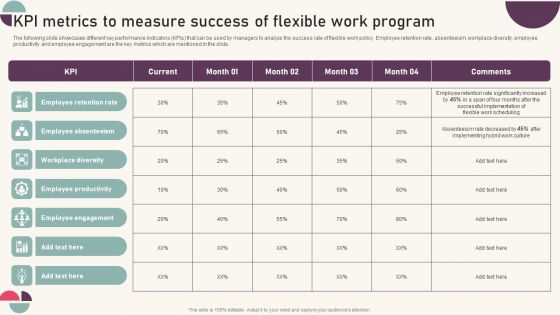
Tactics For Establishing Sustainable Hybrid Work Environment Kpi Metrics To Measure Success Of Flexible Work Mockup PDF
The following slide showcases different key performance indicators KPIs that can be used by managers to analyze the success rate of flexible work policy. Employee retention rate, absenteeism, workplace diversity, employee productivity and employee engagement are the key metrics which are mentioned in the slide. The best PPT templates are a great way to save time, energy, and resources. Slidegeeks have 100 percent editable powerpoint slides making them incredibly versatile. With these quality presentation templates, you can create a captivating and memorable presentation by combining visually appealing slides and effectively communicating your message. Download Tactics For Establishing Sustainable Hybrid Work Environment Kpi Metrics To Measure Success Of Flexible Work Mockup PDF from Slidegeeks and deliver a wonderful presentation.
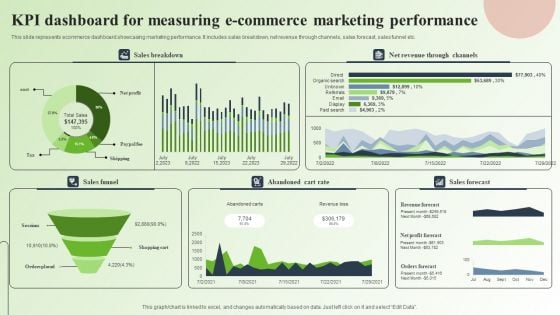
Strategic Guide For Mastering E Commerce Marketing Kpi Dashboard For Measuring E Commerce Marketing Performance Infographics PDF
This slide represents ecommerce dashboard showcasing marketing performance. It includes sales breakdown, net revenue through channels, sales forecast, sales funnel etc. Slidegeeks is here to make your presentations a breeze with Strategic Guide For Mastering E Commerce Marketing Kpi Dashboard For Measuring E Commerce Marketing Performance Infographics PDF With our easy to use and customizable templates, you can focus on delivering your ideas rather than worrying about formatting. With a variety of designs to choose from, you are sure to find one that suits your needs. And with animations and unique photos, illustrations, and fonts, you can make your presentation pop. So whether you are giving a sales pitch or presenting to the board, make sure to check out Slidegeeks first.

Cybersecurity Key Performance Indicators With Applications Summary Pdf
Pitch your topic with ease and precision using this Cybersecurity Key Performance Indicators With Applications Summary Pdf This layout presents information on Identify Weaknesses, Review Improvement, Security Policies It is also available for immediate download and adjustment. So, changes can be made in the color, design, graphics or any other component to create a unique layout. This slide showcases the cyber security key performance indicators with applications which helps an organization to determine readiness. It include details such as security policies, identify weaknesses, obligation to compliance framework, etc.
Cryptocurrency Portfolio Tracking Dashboard Summary Cryptocurrency Management With Blockchain
This slide represents the cryptocurrency performance indicators for the individual. The key components include invested money, profit and loss, rate of investment ROI, current valuation of money, etc.Formulating a presentation can take up a lot of effort and time, so the content and message should always be the primary focus. The visuals of the PowerPoint can enhance the presenters message, so our Cryptocurrency Portfolio Tracking Dashboard Summary Cryptocurrency Management With Blockchain was created to help save time. Instead of worrying about the design, the presenter can concentrate on the message while our designers work on creating the ideal templates for whatever situation is needed. Slidegeeks has experts for everything from amazing designs to valuable content, we have put everything into Cryptocurrency Portfolio Tracking Dashboard Summary Cryptocurrency Management With Blockchain. This slide represents the cryptocurrency performance indicators for the individual. The key components include invested money, profit and loss, rate of investment ROI, current valuation of money, etc.
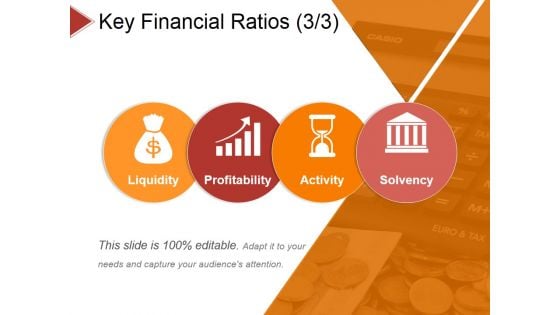
Key Financial Ratios Template 3 Ppt PowerPoint Presentation Summary Sample
This is a key financial ratios template 3 ppt powerpoint presentation summary sample. This is a four stage process. The stages in this process are liquidity, profitability, activity, solvency.
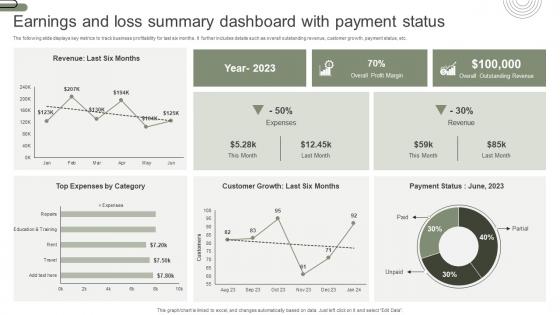
Earnings And Loss Summary Dashboard With Payment Status Elements Pdf
The following slide displays key metrics to track business profitability for last six months. It further includes details such as overall outstanding revenue, customer growth, payment status, etc. Pitch your topic with ease and precision using this Earnings And Loss Summary Dashboard With Payment Status Elements Pdf. This layout presents information on Earnings And Loss, Summary Dashboard, Payment Status. It is also available for immediate download and adjustment. So, changes can be made in the color, design, graphics or any other component to create a unique layout. The following slide displays key metrics to track business profitability for last six months. It further includes details such as overall outstanding revenue, customer growth, payment status, etc.

HR Analytics Metrics For Data Driven Decision Summary Pdf
This slide illustrates human resource key performance indicators that help organization to analyze actionable insights for taking effective and date driven decision. It includes KPIs such as recruitment, employee engagement, retention and diversity and inclusion.Pitch your topic with ease and precision using this HR Analytics Metrics For Data Driven Decision Summary Pdf This layout presents information on Estimate Accumulated, Involved Recruitment, Provide Actionable Insight It is also available for immediate download and adjustment. So, changes can be made in the color, design, graphics or any other component to create a unique layout. This slide illustrates human resource key performance indicators that help organization to analyze actionable insights for taking effective and date driven decision. It includes KPIs such as recruitment, employee engagement, retention and diversity and inclusion.
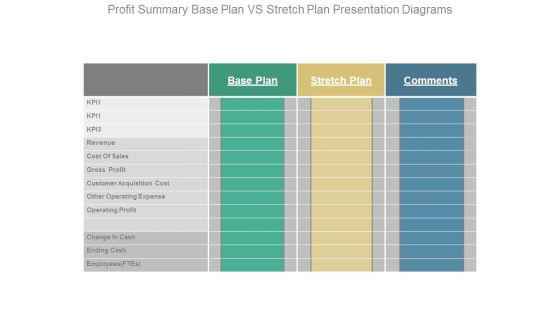
Profit Summary Base Plan Vs Stretch Plan Presentation Diagrams
This is a profit summary base plan vs stretch plan presentation diagrams. This is a three stage process. The stages in this process are base plan, stretch plan, comments, kpi, cost of sales, revenue, gross profit, customer acquisition cost, other operating expense, operating profit, change in cash, ending cash, employees ftes.
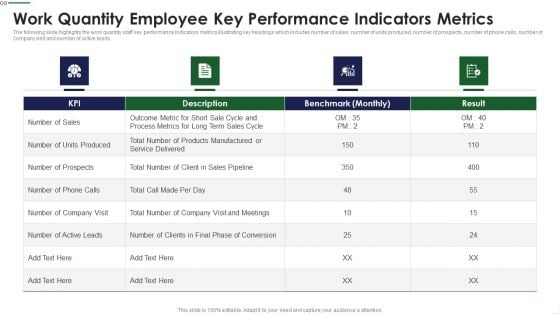
Work Quantity Employee Key Performance Indicators Metrics Summary PDF
The following slide highlights the work quantity staff key performance Indicators metrics illustrating key headings which includes number of sales, number of units produced, number of prospects, number of phone calls, number of company visit and number of active leads Deliver and pitch your topic in the best possible manner with this Work Quantity Employee Key Performance Indicators Metrics Summary PDF Use them to share invaluable insights on Outcome Metric, Process Metrics, Benchmark and impress your audience. This template can be altered and modified as per your expectations. So, grab it now.
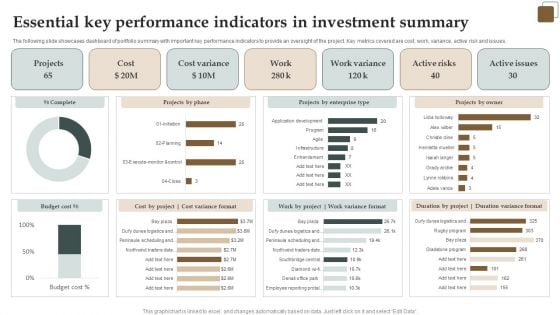
Essential Key Performance Indicators In Investment Summary Demonstration PDF
The following slide showcases dashboard of portfolio summary with important key performance indicators to provide an oversight of the project. Key metrics covered are cost, work, variance, active risk and issues. Showcasing this set of slides titled Essential Key Performance Indicators In Investment Summary Demonstration PDF. The topics addressed in these templates are Cost, Active Risks, Projects. All the content presented in this PPT design is completely editable. Download it and make adjustments in color, background, font etc. as per your unique business setting.
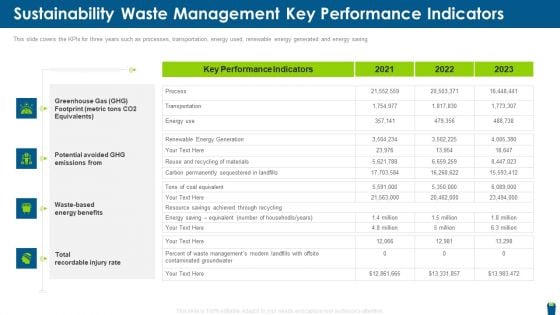
Sustainability Waste Management Key Performance Indicators Summary PDF
This slide covers the KPIs for three years such as processes, transportation, energy used, renewable energy generated and energy saving. Deliver an awe inspiring pitch with this creative sustainability waste management key performance indicators summary pdf bundle. Topics like metric, equivalent, rate, management, performance can be discussed with this completely editable template. It is available for immediate download depending on the needs and requirements of the user.
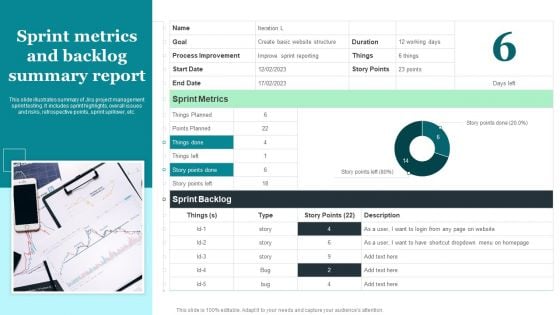
Sprint Metrics And Backlog Summary Report Brochure PDF
This slide illustrates summary of Jira project management sprint testing. It includes sprint highlights, overall issues and risks, retrospective points, sprint spillover, etc. Pitch your topic with ease and precision using this Sprint Metrics And Backlog Summary Report Brochure PDF. This layout presents information on Sprint Metrics And Backlog, Summary Report. It is also available for immediate download and adjustment. So, changes can be made in the color, design, graphics or any other component to create a unique layout.
Service Performance Metrics Ppt PowerPoint Presentation Summary Tips
This is a service performance metrics ppt powerpoint presentation summary tips. This is a three stage process. The stages in this process are service performance metrics.
Retailer Promotions Metrics Ppt Powerpoint Presentation Summary Master Slide Cpb
This is a retailer promotions metrics ppt powerpoint presentation summary master slide cpb. This is a three stage process. The stages in this process are retailer promotions metrics.

Loyalty Program Metrics Ppt PowerPoint Presentation Summary Grid Cpb
This is a loyalty program metrics ppt powerpoint presentation summary grid cpb. This is a four stage process. The stages in this process are loyalty program metrics.
Sales Management Metrics Ppt PowerPoint Presentation Summary Icon Cpb
This is a sales management metrics ppt powerpoint presentation summary icon cpb. This is a three stage process. The stages in this process are sales management metrics.
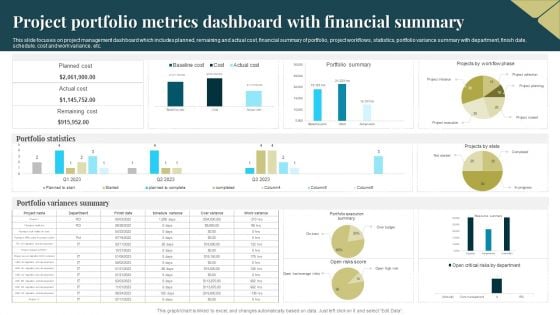
Project Portfolio Metrics Dashboard With Financial Summary Demonstration PDF
This slide focuses on project management dashboard which includes planned, remaining and actual cost, financial summary of portfolio, project workflows, statistics, portfolio variance summary with department, finish date, schedule, cost and work variance, etc. Showcasing this set of slides titled Project Portfolio Metrics Dashboard With Financial Summary Demonstration PDF. The topics addressed in these templates are Planned Cost, Portfolio Statistics, Portfolio Variances Summary. All the content presented in this PPT design is completely editable. Download it and make adjustments in color, background, font etc. as per your unique business setting.
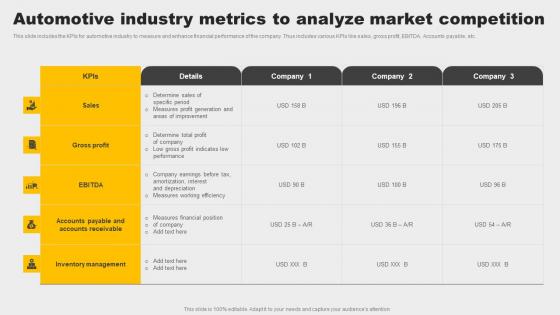
Automotive Industry Metrics To Analyze Market Competition Summary Pdf
This slide includes the KPIs for automotive industry to measure and enhance financial performance of the company. Thus includes various KPIs like sales, gross profit, EBITDA, Accounts payable, etc. Showcasing this set of slides titled Automotive Industry Metrics To Analyze Market Competition Summary Pdf. The topics addressed in these templates are Gross Profit, Inventory Management, Sales. All the content presented in this PPT design is completely editable. Download it and make adjustments in color, background, font etc. as per your unique business setting. This slide includes the KPIs for automotive industry to measure and enhance financial performance of the company. Thus includes various KPIs like sales, gross profit, EBITDA, Accounts payable, etc.

Track Client Health Score Using Key Performance Indicators Summary PDF
This slide illustrates various key performance indicators used to analyze the performance of products and helps in measuring customer health scores. It includes metrics such as customer sentiment, customer engagement, customer ROI and customer feedback. Persuade your audience using this Track Client Health Score Using Key Performance Indicators Summary PDF. This PPT design covers four stages, thus making it a great tool to use. It also caters to a variety of topics including Customer Sentiment, Customer Engagement, Customer ROI. Download this PPT design now to present a convincing pitch that not only emphasizes the topic but also showcases your presentation skills.
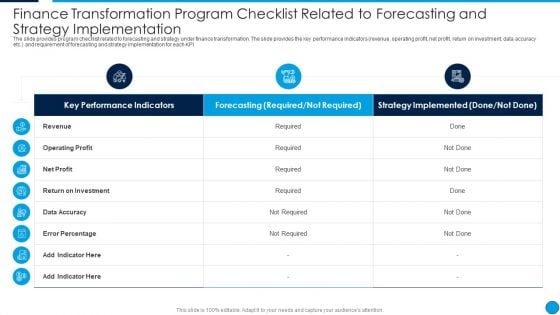
Summary Finance Transformation Program Checklist Related To Forecasting Clipart PDF
The slide provides program checklist related to forecasting and strategy under finance transformation. The slide provides the key performance indicators revenue, operating profit, net profit, return on investment, data accuracy etc. and requirement of forecasting and strategy implementation for each KPI. Deliver and pitch your topic in the best possible manner with this Summary Finance Transformation Program Checklist Related To Forecasting Clipart PDF. Use them to share invaluable insights on Key Performance Indicators, Forecasting Required, Not Required, Strategy Implemented, Return On Investment and impress your audience. This template can be altered and modified as per your expectations. So, grab it now.
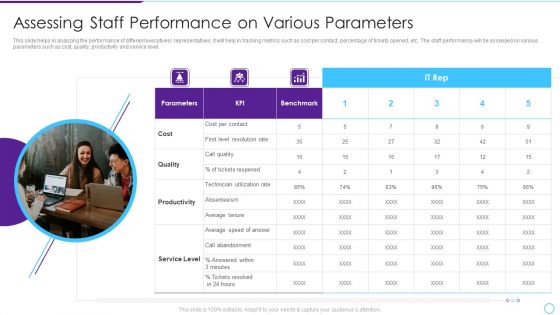
Intelligent Infrastructure Assessing Staff Performance On Various Parameters Summary PDF
This slide helps in analyzing the performance of different executives or representatives. It will help in tracking metrics such as cost per contact, percentage of tickets opened, etc. The staff performance will be assessed on various parameters such as cost, quality, productivity and service level. This is a Intelligent Infrastructure Assessing Staff Performance On Various Parameters Summary PDF template with various stages. Focus and dispense information on three stages using this creative set, that comes with editable features. It contains large content boxes to add your information on topics like Parameters, Cost, KPI, Productivity, Service Level. You can also showcase facts, figures, and other relevant content using this PPT layout. Grab it now.
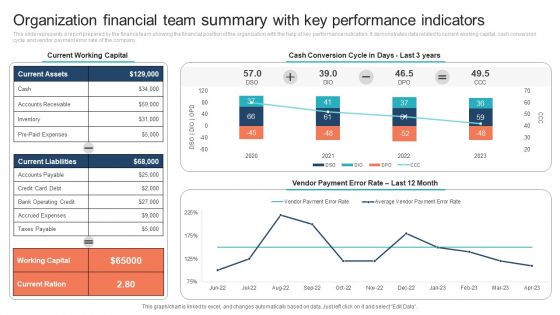
Organization Financial Team Summary With Key Performance Indicators Clipart PDF
This slide represents a report prepared by the finance team showing the financial position of the organization with the help of key performance indicators. It demonstrates data related to current working capital, cash conversion cycle and vendor payment error rate of the company. Pitch your topic with ease and precision using this Organization Financial Team Summary With Key Performance Indicators Clipart PDF. This layout presents information on Current Working Capital, Cash Conversion Cycle. It is also available for immediate download and adjustment. So, changes can be made in the color, design, graphics or any other component to create a unique layout.
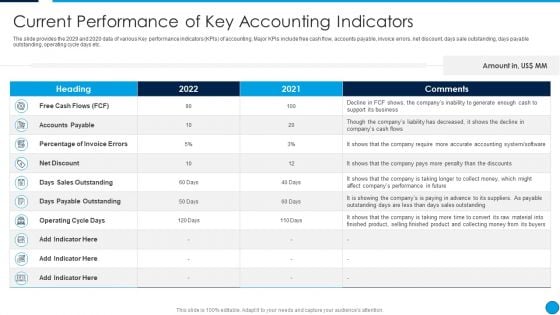
Summary Financial Current Performance Of Key Accounting Indicators Template PDF
The slide provides the 2029 and 2020 data of various Key performance indicators KPIs of accounting. Major KPIs include free cash flow, accounts payable, invoice errors, net discount, days sale outstanding, days payable outstanding, operating cycle days etc. Deliver an awe inspiring pitch with this creative Summary Financial Current Performance Of Key Accounting Indicators Template PDF bundle. Topics like Free Cash Flows, Accounts Payable, Percentage Of Invoice Errors, Net Discount can be discussed with this completely editable template. It is available for immediate download depending on the needs and requirements of the user.
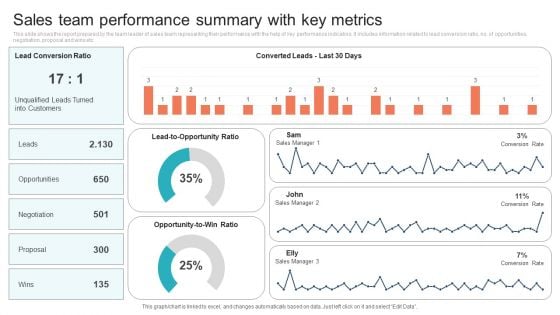
Sales Team Performance Summary With Key Metrics Background PDF
This slide shows the report prepared by the team leader of sales team representing their performance with the help of key performance indicators. It includes information related to lead conversion ratio, no. of opportunities, negotiation, proposal and wins etc. Showcasing this set of slides titled Sales Team Performance Summary With Key Metrics Background PDF. The topics addressed in these templates are Opportunities, Negotiation, Proposal. All the content presented in this PPT design is completely editable. Download it and make adjustments in color, background, font etc. as per your unique business setting.
Project Metrics Dashboard With Task Summary Icons PDF
This slide shows the project management dashboard which covers the summary of different projects with time, cost, workload, tasks and progress with workload, created verses completed tasks, time spent on managing projects, etc. Showcasing this set of slides titled Project Metrics Dashboard With Task Summary Icons PDF. The topics addressed in these templates are Project Metrics Dashboard, Task Summary. All the content presented in this PPT design is completely editable. Download it and make adjustments in color, background, font etc. as per your unique business setting.
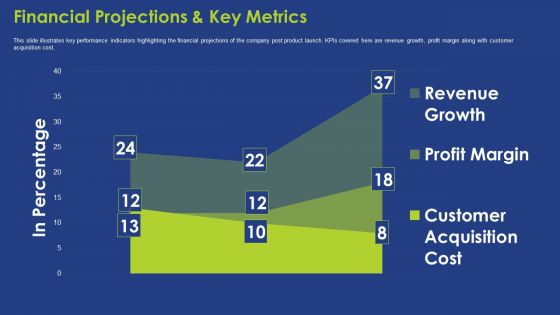
Financial Projections And Key Metrics Ppt Summary Background PDF
This slide illustrates key performance indicators highlighting the financial projections of the company post product launch. KPIs covered here are revenue growth, profit margin along with customer acquisition cost. Deliver an awe inspiring pitch with this creative financial projections and key metrics ppt summary background pdf bundle. Topics like financial projections and key metrics can be discussed with this completely editable template. It is available for immediate download depending on the needs and requirements of the user.

Customer Satisfaction Metrics Inventory Management Ppt PowerPoint Presentation Summary Outfit
This is a customer satisfaction metrics inventory management ppt powerpoint presentation summary outfit. This is a five stage process. The stages in this process are customer satisfaction metrics, inventory management.
Performance Measurement Metrics Examples Ppt PowerPoint Presentation Summary Slides Cpb
This is a performance measurement metrics examples ppt powerpoint presentation summary slides cpb. This is a two stage process. The stages in this process are performance measurement metrics examples.
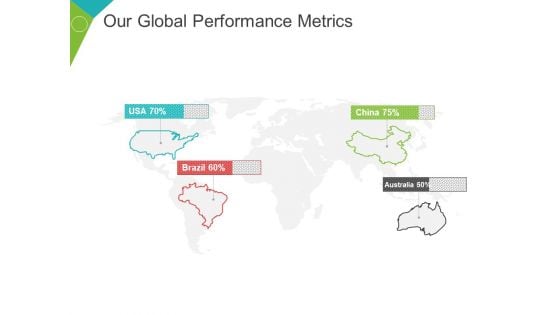
Our Global Performance Metrics Ppt PowerPoint Presentation Summary Grid
This is a our global performance metrics ppt powerpoint presentation summary grid. This is a four stage process. The stages in this process are usa, brazil, china, australia, percentage.
Market Summary Icon With Key Indicators And Metrics Icons PDF
Persuade your audience using this Market Summary Icon With Key Indicators And Metrics Icons PDF. This PPT design covers three stages, thus making it a great tool to use. It also caters to a variety of topics including Market Summary Icon With Key Indicators And Metrics. Download this PPT design now to present a convincing pitch that not only emphasizes the topic but also showcases your presentation skills.
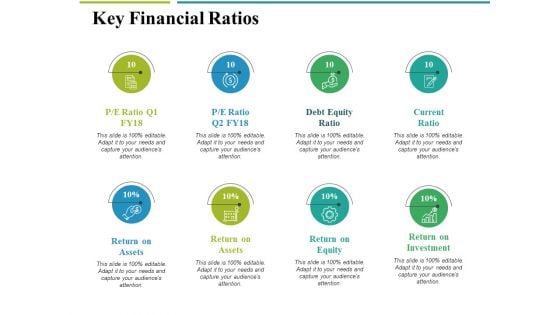
Key Financial Ratios Ppt PowerPoint Presentation Portfolio Summary
This is a key financial ratios ppt powerpoint presentation portfolio summary. This is a eight stage process. The stages in this process are return on assets, return on equity, return on investment, debt equity ratio, current ratio.
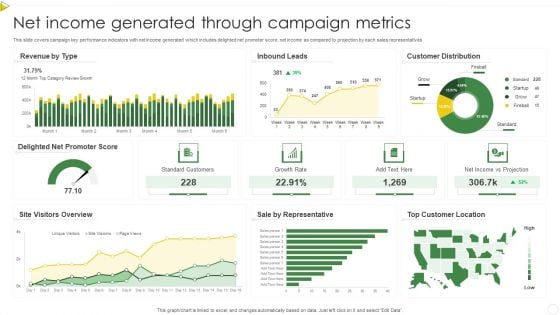
Net Income Generated Through Campaign Metrics Summary PDF
This slide covers campaign key performance indicators with net income generated which includes delighted net promoter score, net income as compared to projection by each sales representatives. Pitch your topic with ease and precision using this Net Income Generated Through Campaign Metrics Summary PDF. This layout presents information on Standard Customers, Growth Rate, Net Income. It is also available for immediate download and adjustment. So, changes can be made in the color, design, graphics or any other component to create a unique layout.
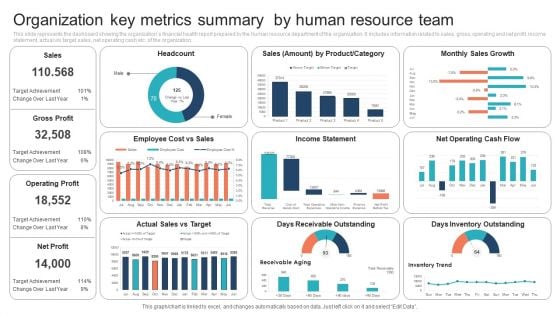
Organization Key Metrics Summary By Human Resource Team Information PDF
This slide represents the dashboard showing the organizations financial health report prepared by the human resource department of the organization. It includes information related to sales, gross, operating and net profit, income statement, actual vs target sales, net operating cash etc. of the organization.Showcasing this set of slides titled Organization Key Metrics Summary By Human Resource Team Information PDF. The topics addressed in these templates are Organization Key Metrics Summary, Human Resource Team. All the content presented in this PPT design is completely editable. Download it and make adjustments in color, background, font etc. as per your unique business setting.
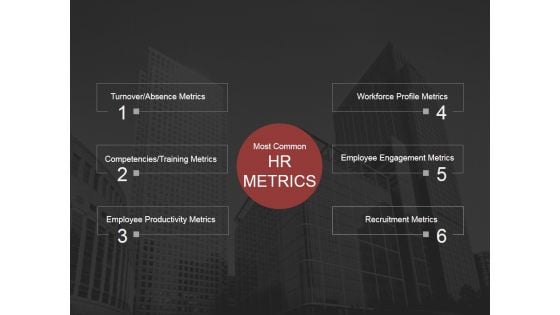
Most Common Hr Metrics Ppt PowerPoint Presentation Summary Example
This is a most common hr metrics ppt powerpoint presentation summary example. This is a six stage process. The stages in this process are turnover absence metrics, competencies training metrics, employee productivity metrics, workforce profile metrics, employee engagement metrics, recruitment metrics.
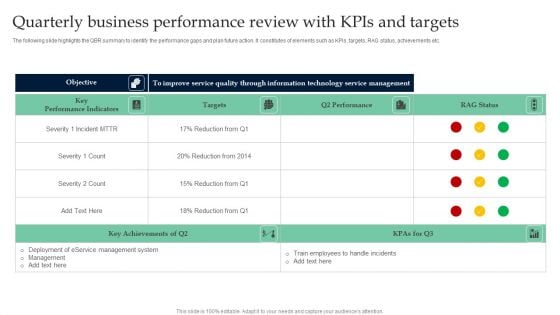
Quarterly Business Performance Review With Kpis And Targets Summary PDF
The following slide highlights the QBR summary to identify the performance gaps and plan future action. It constitutes of elements such as KPIs, targets, RAG status, achievements etc. Pitch your topic with ease and precision using this Quarterly Business Performance Review With Kpis And Targets Summary PDF. This layout presents information on Key Performance Indicators, Targets, Technology Service Management. It is also available for immediate download and adjustment. So, changes can be made in the color, design, graphics or any other component to create a unique layout.

Sales Playbook Outline Ppt PowerPoint Presentation Summary Gallery
This is a sales playbook outline ppt powerpoint presentation summary gallery. This is a seven stage process. The stages in this process arekey insights, our sales process, marketing campaigns, our customers, expected metrics.
Shipping Tracking Metrics Dashboard For Tracking Shipment Delays Summary PDF
Pitch your topic with ease and precision using this Shipping Tracking Metrics Dashboard For Tracking Shipment Delays Summary PDF. This layout presents information on Metrics Dashboard, Tracking Shipment. It is also available for immediate download and adjustment. So, changes can be made in the color, design, graphics or any other component to create a unique layout.


 Continue with Email

 Home
Home


