Kpi Summary
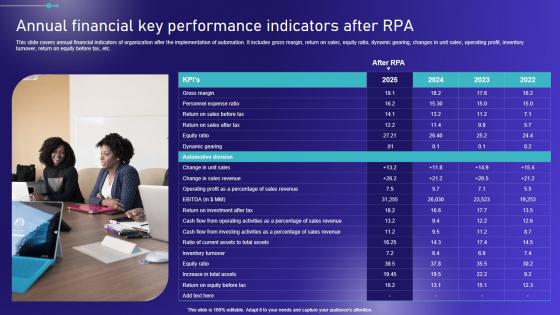
Annual Financial Key Performance Indicators After Embracing Robotic Process Elements PDF
This slide covers annual financial indicators of organization after the implementation of automation. It includes gross margin, return on sales, equity ratio, dynamic gearing, changes in unit sales, operating profit, inventory turnover, return on equity before tax, etc. Slidegeeks is one of the best resources for PowerPoint templates. You can download easily and regulate Annual Financial Key Performance Indicators After Embracing Robotic Process Elements PDF for your personal presentations from our wonderful collection. A few clicks is all it takes to discover and get the most relevant and appropriate templates. Use our Templates to add a unique zing and appeal to your presentation and meetings. All the slides are easy to edit and you can use them even for advertisement purposes. This slide covers annual financial indicators of organization after the implementation of automation. It includes gross margin, return on sales, equity ratio, dynamic gearing, changes in unit sales, operating profit, inventory turnover, return on equity before tax, etc.
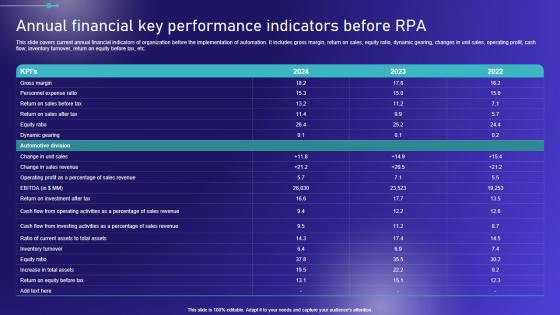
Annual Financial Key Performance Indicators Before Embracing Robotic Process Graphics PDF
This slide covers current annual financial indicators of organization before the implementation of automation. It includes gross margin, return on sales, equity ratio, dynamic gearing, changes in unit sales, operating profit, cash flow, inventory turnover, return on equity before tax, etc. Want to ace your presentation in front of a live audience Our Annual Financial Key Performance Indicators Before Embracing Robotic Process Graphics PDF can help you do that by engaging all the users towards you. Slidegeeks experts have put their efforts and expertise into creating these impeccable powerpoint presentations so that you can communicate your ideas clearly. Moreover, all the templates are customizable, and easy-to-edit and downloadable. Use these for both personal and commercial use. This slide covers current annual financial indicators of organization before the implementation of automation. It includes gross margin, return on sales, equity ratio, dynamic gearing, changes in unit sales, operating profit, cash flow, inventory turnover, return on equity before tax, etc.
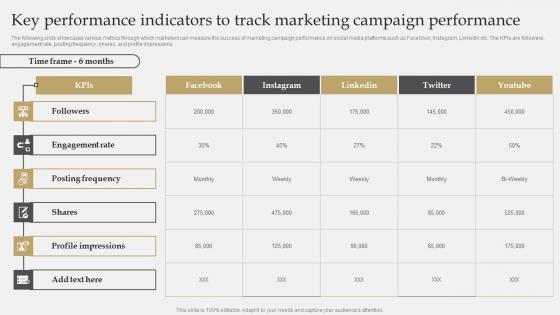
IT Industry Market Research Key Performance Indicators To Track Marketing Campaign Rules Pdf
The following slide showcases various metrics through which marketers can measure the success of marketing campaign performance on social media platforms such as Facebook, Instagram, LinkedIn etc. The KPIs are followers, engagement rate, posting frequency, shares, and profile impressions. Whether you have daily or monthly meetings, a brilliant presentation is necessary. IT Industry Market Research Key Performance Indicators To Track Marketing Campaign Rules Pdf can be your best option for delivering a presentation. Represent everything in detail using IT Industry Market Research Key Performance Indicators To Track Marketing Campaign Rules Pdf and make yourself stand out in meetings. The template is versatile and follows a structure that will cater to your requirements. All the templates prepared by Slidegeeks are easy to download and edit. Our research experts have taken care of the corporate themes as well. So, give it a try and see the results. The following slide showcases various metrics through which marketers can measure the success of marketing campaign performance on social media platforms such as Facebook, Instagram, LinkedIn etc. The KPIs are followers, engagement rate, posting frequency, shares, and profile impressions.

Digital Security Metrics Ppt Powerpoint Presentation Complete Deck With Slides
This Digital Security Metrics Ppt Powerpoint Presentation Complete Deck With Slides acts as backup support for your ideas, vision, thoughts, etc. Use it to present a thorough understanding of the topic. This PPT slideshow can be utilized for both in-house and outside presentations depending upon your needs and business demands. Entailing seventeen slides with a consistent design and theme, this template will make a solid use case. As it is intuitively designed, it suits every business vertical and industry. All you have to do is make a few tweaks in the content or any other component to design unique presentations. The biggest advantage of this complete deck is that it can be personalized multiple times once downloaded. The color, design, shapes, and other elements are free to modify to add personal touches. You can also insert your logo design in this PPT layout. Therefore a well-thought and crafted presentation can be delivered with ease and precision by downloading this Digital Security Metrics Ppt Powerpoint Presentation Complete Deck With Slides PPT slideshow. Our Digital Security Metrics Ppt Powerpoint Presentation Complete Deck With Slides are topically designed to provide an attractive backdrop to any subject. Use them to look like a presentation pro.

Lead Metrics Ppt PowerPoint Presentation Complete Deck With Slides
This Lead Metrics Ppt PowerPoint Presentation Complete Deck With Slides acts as backup support for your ideas, vision, thoughts, etc. Use it to present a thorough understanding of the topic. This PPT slideshow can be utilized for both in-house and outside presentations depending upon your needs and business demands. Entailing fifteen slides with a consistent design and theme, this template will make a solid use case. As it is intuitively designed, it suits every business vertical and industry. All you have to do is make a few tweaks in the content or any other component to design unique presentations. The biggest advantage of this complete deck is that it can be personalized multiple times once downloaded. The color, design, shapes, and other elements are free to modify to add personal touches. You can also insert your logo design in this PPT layout. Therefore a well-thought and crafted presentation can be delivered with ease and precision by downloading this Lead Metrics Ppt PowerPoint Presentation Complete Deck With Slides PPT slideshow. Our Lead Metrics Ppt PowerPoint Presentation Complete Deck With Slides are topically designed to provide an attractive backdrop to any subject. Use them to look like a presentation pro.

Automotive Industry Metrics Ppt PowerPoint Presentation Complete Deck With Slides
Improve your presentation delivery using this Automotive Industry Metrics Ppt PowerPoint Presentation Complete Deck With Slides. Support your business vision and objectives using this well structured PPT deck. This template offers a great starting point for delivering beautifully designed presentations on the topic of your choice. Comprising eighteen this professionally designed template is all you need to host discussion and meetings with collaborators. Each slide is self explanatory and equipped with high quality graphics that can be adjusted to your needs. Therefore, you will face no difficulty in portraying your desired content using this PPT slideshow. This PowerPoint slideshow contains every important element that you need for a great pitch. It is not only editable but also available for immediate download and utilization. The color, font size, background, shapes everything can be modified to create your unique presentation layout. Therefore, download it now. Our Automotive Industry Metrics Ppt PowerPoint Presentation Complete Deck With Slides are topically designed to provide an attractive backdrop to any subject. Use them to look like a presentation pro.

HR Analytics Metrics Ppt Powerpoint Presentation Complete Deck With Slides
Improve your presentation delivery using this HR Analytics Metrics Ppt Powerpoint Presentation Complete Deck With Slides Support your business vision and objectives using this well-structured PPT deck. This template offers a great starting point for delivering beautifully designed presentations on the topic of your choice. Comprising twelve this professionally designed template is all you need to host discussion and meetings with collaborators. Each slide is self-explanatory and equipped with high-quality graphics that can be adjusted to your needs. Therefore, you will face no difficulty in portraying your desired content using this PPT slideshow. This PowerPoint slideshow contains every important element that you need for a great pitch. It is not only editable but also available for immediate download and utilization. The color, font size, background, shapes everything can be modified to create your unique presentation layout. Therefore, download it now. Our HR Analytics Metrics Ppt Powerpoint Presentation Complete Deck With Slides are topically designed to provide an attractive backdrop to any subject. Use them to look like a presentation pro.

Key Performance Indicators Of IBN Outsourcing Company PPT Presentation SS
The slide shows the key Performance Indicator KPIs which will help the company to track the success rate of implemented strategies. Some of the KPIs are Customer Attrition Rate, Product, Service Adoption Rate, Average Customer Queue Time , Customer Satisfaction Rate etc. Are you in need of a template that can accommodate all of your creative concepts This one is crafted professionally and can be altered to fit any style. Use it with Google Slides or PowerPoint. Include striking photographs, symbols, depictions, and other visuals. Fill, move around, or remove text boxes as desired. Test out color palettes and font mixtures. Edit and save your work, or work with colleagues. Download Key Performance Indicators Of IBN Outsourcing Company PPT Presentation SS and observe how to make your presentation outstanding. Give an impeccable presentation to your group and make your presentation unforgettable. The slide shows the key Performance Indicator KPIs which will help the company to track the success rate of implemented strategies. Some of the KPIs are Customer Attrition Rate, Product, Service Adoption Rate, Average Customer Queue Time , Customer Satisfaction Rate etc.
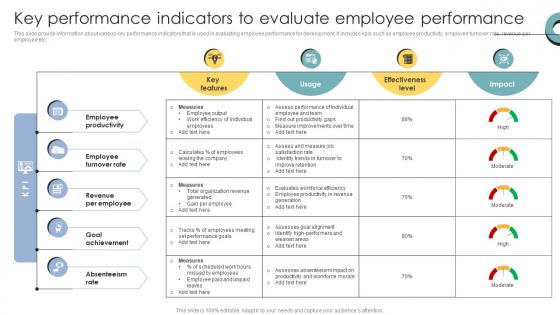
Skill Enhancement Performance Key Performance Indicators To Evaluate Employee Performance
This slide provide information about various key performance indicators that is used in evaluating employee performance for development. It includes kpis such as employee productivity, employee turnover rate, revenue per employee etc. Get a simple yet stunning designed Skill Enhancement Performance Key Performance Indicators To Evaluate Employee Performance. It is the best one to establish the tone in your meetings. It is an excellent way to make your presentations highly effective. So, download this PPT today from Slidegeeks and see the positive impacts. Our easy-to-edit Skill Enhancement Performance Key Performance Indicators To Evaluate Employee Performance can be your go-to option for all upcoming conferences and meetings. So, what are you waiting for Grab this template today. This slide provide information about various key performance indicators that is used in evaluating employee performance for development. It includes kpis such as employee productivity, employee turnover rate, revenue per employee etc.
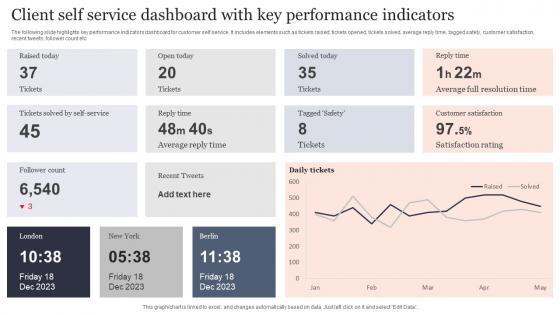
Client Self Service Dashboard With Key Performance Indicators Pictures Pdf
The following slide highlights key performance indicators dashboard for customer self service. It includes elements such as tickets raised, tickets opened, tickets solved, average reply time, tagged safety, customer satisfaction, recent tweets, follower count etc. Showcasing this set of slides titled Client Self Service Dashboard With Key Performance Indicators Pictures Pdf. The topics addressed in these templates are Open Today, Reply Time. All the content presented in this PPT design is completely editable. Download it and make adjustments in color, background, font etc. as per your unique business setting. The following slide highlights key performance indicators dashboard for customer self service. It includes elements such as tickets raised, tickets opened, tickets solved, average reply time, tagged safety, customer satisfaction, recent tweets, follower count etc.
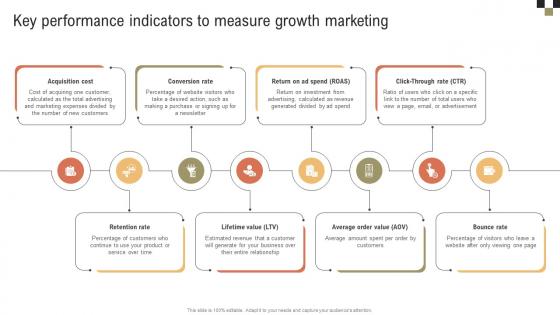
A Comprehensive Guide On Growth Key Performance Indicators To Measure Growth MKT SS V
Get a simple yet stunning designed A Comprehensive Guide On Growth Key Performance Indicators To Measure Growth MKT SS V. It is the best one to establish the tone in your meetings. It is an excellent way to make your presentations highly effective. So, download this PPT today from Slidegeeks and see the positive impacts. Our easy-to-edit A Comprehensive Guide On Growth Key Performance Indicators To Measure Growth MKT SS V can be your go-to option for all upcoming conferences and meetings. So, what are you waiting for Grab this template today. Our A Comprehensive Guide On Growth Key Performance Indicators To Measure Growth MKT SS V are topically designed to provide an attractive backdrop to any subject. Use them to look like a presentation pro.
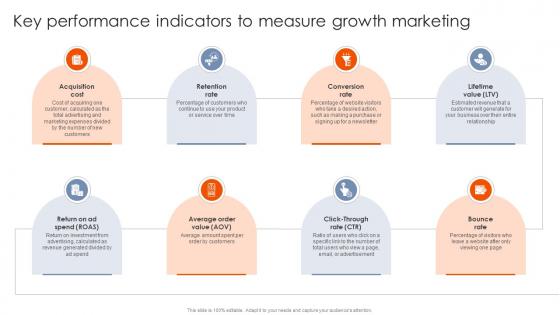
Best Practices For Using Growth Key Performance Indicators To Measure Growth MKT SS V
From laying roadmaps to briefing everything in detail, our templates are perfect for you. You can set the stage with your presentation slides. All you have to do is download these easy-to-edit and customizable templates. Best Practices For Using Growth Key Performance Indicators To Measure Growth MKT SS V will help you deliver an outstanding performance that everyone would remember and praise you for. Do download this presentation today. Our Best Practices For Using Growth Key Performance Indicators To Measure Growth MKT SS V are topically designed to provide an attractive backdrop to any subject. Use them to look like a presentation pro.
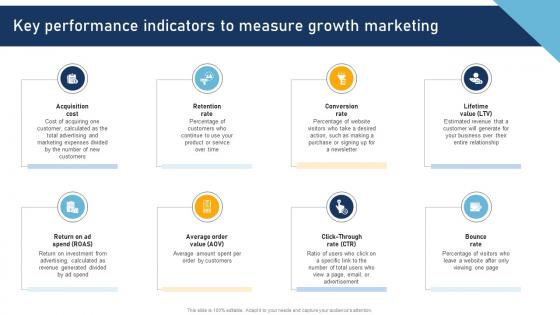
A Comprehensive Approach To Key Performance Indicators To Measure Growth MKT SS V
Whether you have daily or monthly meetings, a brilliant presentation is necessary. A Comprehensive Approach To Key Performance Indicators To Measure Growth MKT SS V can be your best option for delivering a presentation. Represent everything in detail using A Comprehensive Approach To Key Performance Indicators To Measure Growth MKT SS V and make yourself stand out in meetings. The template is versatile and follows a structure that will cater to your requirements. All the templates prepared by Slidegeeks are easy to download and edit. Our research experts have taken care of the corporate themes as well. So, give it a try and see the results. Our A Comprehensive Approach To Key Performance Indicators To Measure Growth MKT SS V are topically designed to provide an attractive backdrop to any subject. Use them to look like a presentation pro.

Key Performance Indicators For Power Strategy Template Pdf
This slide shows key performance indicators for energy plan. The purpose of this slide is to highlight main key performance indicators that should be considered for performance measurement. It include indicators such as facility wide units and process unit levels, etc.Pitch your topic with ease and precision using this Key Performance Indicators For Power Strategy Template Pdf This layout presents information on Electricity Consumption, Process Measuring, Temperature Steam Systems It is also available for immediate download and adjustment. So, changes can be made in the color, design, graphics or any other component to create a unique layout. This slide shows key performance indicators for energy plan. The purpose of this slide is to highlight main key performance indicators that should be considered for performance measurement. It include indicators such as facility wide units and process unit levels, etc.
Kpis And Dashboards Vector Icons Ppt Powerpoint Presentation Infographics Outline
This is a kpis and dashboards vector icons ppt powerpoint presentation infographics outline. This is a eight stage process. The stages in this process are dashboard, kpi, metrics.
Cybersecurity Key Performance Indicator And Padlock Icon Clipart Pdf
Showcasing this set of slides titled Cybersecurity Key Performance Indicator And Padlock Icon Clipart Pdf The topics addressed in these templates are Cybersecurity Key, Performance Indicator, Padlock Icon All the content presented in this PPT design is completely editable. Download it and make adjustments in color, background, font etc. as per your unique business setting. Our Cybersecurity Key Performance Indicator And Padlock Icon Clipart Pdf are topically designed to provide an attractive backdrop to any subject. Use them to look like a presentation pro.
Human Resource Analytics Key Performance Indicator Icon Elements Pdf
Showcasing this set of slides titled Human Resource Analytics Key Performance Indicator Icon Elements Pdf The topics addressed in these templates are Human Resource, Analytics Key Performance, Indicator Icon All the content presented in this PPT design is completely editable. Download it and make adjustments in color, background, font etc. as per your unique business setting. Our Human Resource Analytics Key Performance Indicator Icon Elements Pdf are topically designed to provide an attractive backdrop to any subject. Use them to look like a presentation pro.

Key Findings Ppt PowerPoint Presentation Complete Deck With Slides
This is a key findings ppt powerpoint presentation complete deck with slides. This is a one stage process. The stages in this process are key findings, management, planning, business, analysis.
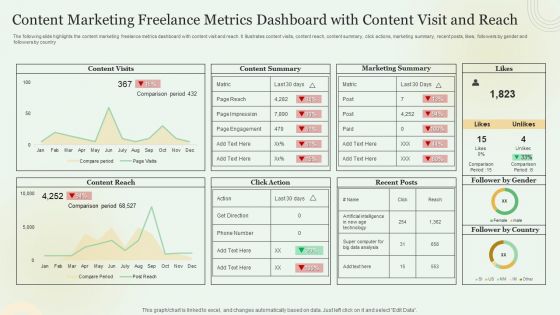
Content Marketing Freelance Metrics Dashboard With Content Visit And Reach Mockup PDF
Showcasing this set of slides titled Content Marketing Freelance Metrics Dashboard With Content Visit And Reach Mockup PDF. The topics addressed in these templates are Content Visits, Content Summary, Marketing Summary. All the content presented in this PPT design is completely editable. Download it and make adjustments in color, background, font etc. as per your unique business setting.
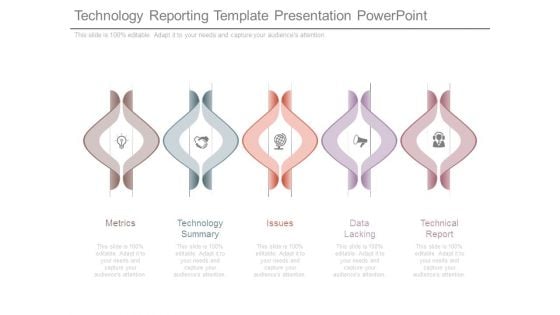
Technology Reporting Template Presentation Powerpoint
This is a technology reporting template presentation powerpoint. This is a five stage process. The stages in this process are metrics, technology summary, issues, data lacking, technical report.

Lead Metrics For Software Performance Testing Ppt Show Visual Aids Pdf
This slide highlights various key performance indicators to track and calculate product success in market. It includes key metrics such as net promoter score, client retention rate, active user percentage, customer lifetime value and churn rate. Showcasing this set of slides titled Lead Metrics For Software Performance Testing Ppt Show Visual Aids Pdf. The topics addressed in these templates are Client Retention Rate, Active User Percentage, Customer Lifetime. All the content presented in this PPT design is completely editable. Download it and make adjustments in color, background, font etc. as per your unique business setting. This slide highlights various key performance indicators to track and calculate product success in market. It includes key metrics such as net promoter score, client retention rate, active user percentage, customer lifetime value and churn rate.
Program Metrics Powerpoint Ppt Template Bundles
Increase your chances of writing a winning business proposal and grabbing your prospects attention with this well-crafted, innovative Program Metrics Powerpoint Ppt Template Bundles. This Business Program Continuity, Program Management, Supplier Performance Evaluation-slide presentation template comes with in-built content to help you outline a presentation that can serve as an industry benchmark. The complete deck also makes use of an impressive color scheme to create a visual impact and hook the audience. Use this PPT to plan how your business can be the Numero uno in its segment within no time at all. Download now to showcase your brand USP and offerings to engage your client. Our Program Metrics PowerPoint Template Bundles are thoughtfully crafted to offer a visually appealing background for any topic, helping you deliver a professional presentation.
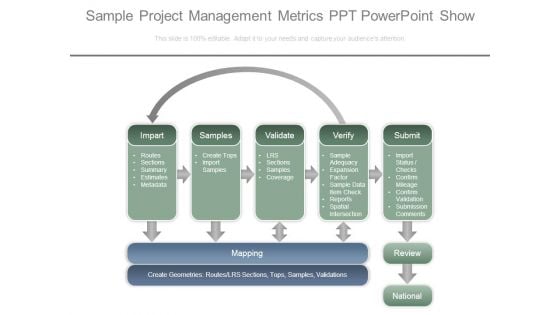
Sample Project Management Metrics Ppt Powerpoint Show
This is a sample project management metrics ppt powerpoint show. This is a seven stage process. The stages in this process are impart, routes, sections, summary, estimates, metadata, samples, create tops, import samples, validate, lrs, sections, samples, coverage, verify, sample, adequacy, expansion factor, sample data item check, reports, spatial intersection, impart, routes, sections, summary, estimates, metadata, samples, create tops, import samples, validate, lrs, sections, samples, coverage, verify, sample, adequacy, expansion factor, sample data item check, reports, spatial intersection.
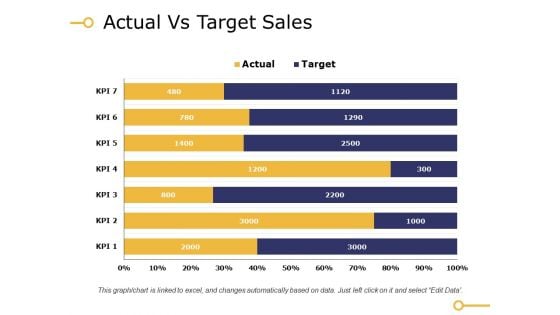
Actual Vs Target Sales Ppt PowerPoint Presentation Gallery Images
This is a actual vs target sales ppt powerpoint presentation ideas brochure. This is a seven stage process. The stages in this process are actual target, kpi.
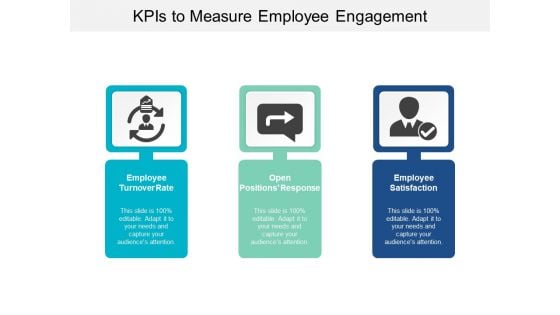
Kpis To Measure Employee Engagement Ppt Powerpoint Presentation Pictures Gridlines
This is a kpis to measure employee engagement ppt powerpoint presentation pictures gridlines. This is a three stage process. The stages in this process are dashboard, kpi, metrics.
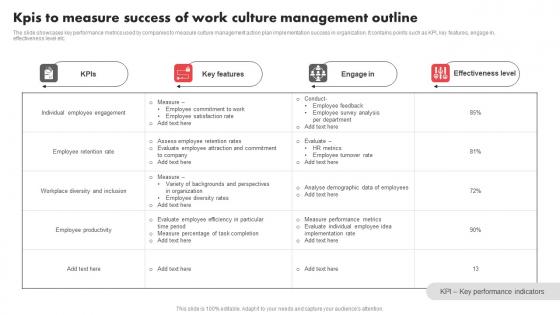
Kpis To Measure Success Of Work Culture Management Outline Diagrams Pdf
The slide showcases key performance metrics used by companies to measure culture management action plan implementation success in organization. It contains points such as KPI, key features, engage in, effectiveness level etc. Pitch your topic with ease and precision using this Kpis To Measure Success Of Work Culture Management Outline Diagrams Pdf. This layout presents information on Individual Employee Engagement, Employee Retention Rate, Workplace Diversity And Inclusion. It is also available for immediate download and adjustment. So, changes can be made in the color, design, graphics or any other component to create a unique layout. The slide showcases key performance metrics used by companies to measure culture management action plan implementation success in organization. It contains points such as KPI, key features, engage in, effectiveness level etc.
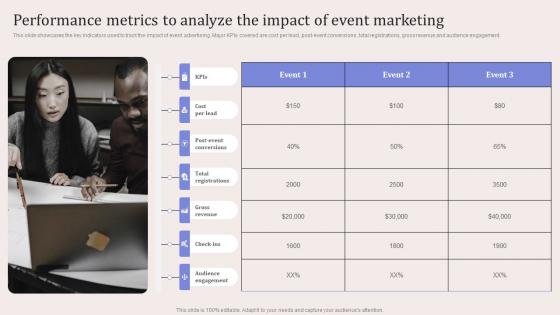
Performance Metrics To Analyze The Impact Virtual Event Promotion To Capture Inspiration Pdf
This slide showcases the key indicators used to track the impact of event advertising. Major KPIs covered are cost per lead, post-event conversions, total registrations, gross revenue and audience engagement. Welcome to our selection of the Performance Metrics To Analyze The Impact Virtual Event Promotion To Capture Inspiration Pdf. These are designed to help you showcase your creativity and bring your sphere to life. Planning and Innovation are essential for any business that is just starting out. This collection contains the designs that you need for your everyday presentations. All of our PowerPoints are 100 percent editable, so you can customize them to suit your needs. This multi-purpose template can be used in various situations. Grab these presentation templates today. This slide showcases the key indicators used to track the impact of event advertising. Major KPIs covered are cost per lead, post-event conversions, total registrations, gross revenue and audience engagement.

Business Improvement Metrics Example Ppt Presentation
This is a business improvement metrics example ppt presentation. This is a four stage process. The stages in this process are focus, area of focus, metrics, targets, objectives.
Our Key Metrics Ppt PowerPoint Presentation Examples
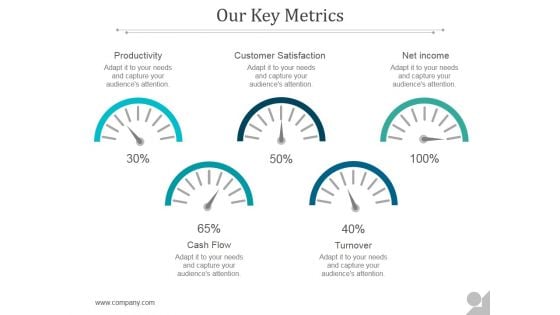
This is a our key metrics ppt powerpoint presentation examples. This is a five stage process. The stages in this process are productivity, customer satisfaction, net income, cash flow, turnover.
Our Key Metrics Ppt PowerPoint Presentation Portfolio
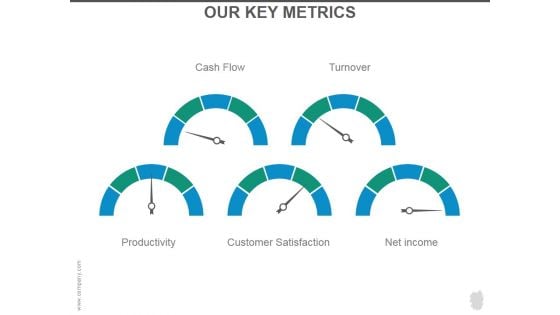
This is a our key metrics ppt powerpoint presentation portfolio. This is a five stage process. The stages in this process are cash flow, turnover, productivity, customer satisfaction, net income.
Key Metrics Ppt PowerPoint Presentation Model Portrait
Key Metrics To Measure Success Innovative Business Promotion Ideas Pictures Pdf
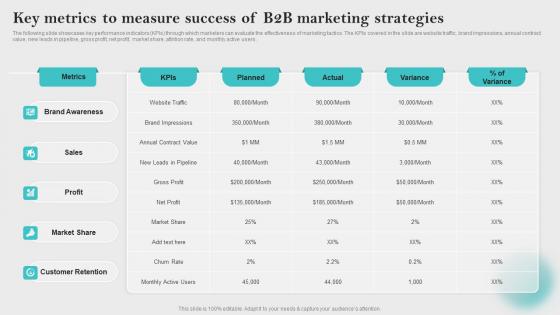
The following slide showcases key performance indicators KPIs through which marketers can evaluate the effectiveness of marketing tactics. The KPIs covered in the slide are website traffic, brand impressions, annual contract value, new leads in pipeline, gross profit, net profit, market share, attrition rate, and monthly active users. Slidegeeks has constructed Key Metrics To Measure Success Innovative Business Promotion Ideas Pictures Pdf after conducting extensive research and examination. These presentation templates are constantly being generated and modified based on user preferences and critiques from editors. Here, you will find the most attractive templates for a range of purposes while taking into account ratings and remarks from users regarding the content. This is an excellent jumping off point to explore our content and will give new users an insight into our top notch PowerPoint Templates. The following slide showcases key performance indicators KPIs through which marketers can evaluate the effectiveness of marketing tactics. The KPIs covered in the slide are website traffic, brand impressions, annual contract value, new leads in pipeline, gross profit, net profit, market share, attrition rate, and monthly active users.
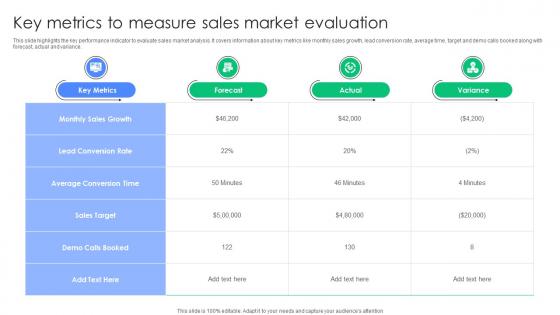
Key Metrics To Measure Sales Market Evaluation Portrait Pdf
This slide highlights the key performance indicator to evaluate sales market analysis. It covers information about key metrics like monthly sales growth, lead conversion rate, average time, target and demo calls booked along with forecast, actual and variance. Showcasing this set of slides titled Key Metrics To Measure Sales Market Evaluation Portrait Pdf. The topics addressed in these templates are Monthly Sales Growth, Lead Conversion Rate, Sales Target. All the content presented in this PPT design is completely editable. Download it and make adjustments in color, background, font etc. as per your unique business setting. This slide highlights the key performance indicator to evaluate sales market analysis. It covers information about key metrics like monthly sales growth, lead conversion rate, average time, target and demo calls booked along with forecast, actual and variance.
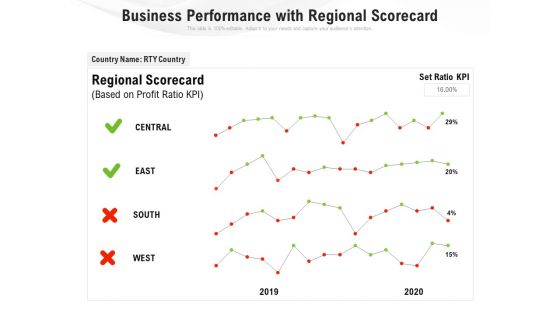
Business Performance With Regional Scorecard Ppt PowerPoint Presentation Slides Tips PDF
Presenting this set of slides with name business performance with regional scorecard ppt powerpoint presentation slides tips pdf. The topics discussed in these slides are regional scorecard, set ratio kpi, based on profit ratio kpi, 2019, 2020. This is a completely editable PowerPoint presentation and is available for immediate download. Download now and impress your audience.
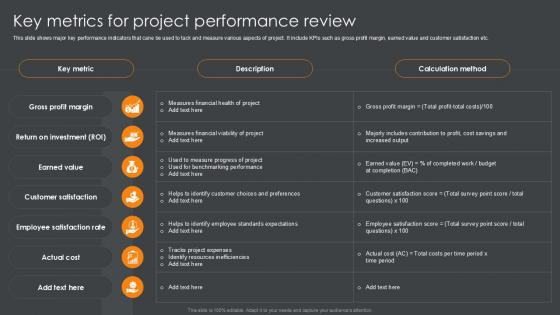
Key Metrics For Project Performance Review PPT Template SS
This slide shows major key performance indicators that cane be used to tack and measure various aspects of project. It include KPIs such as gross profit margin, earned value and customer satisfaction etc. There are so many reasons you need a Key Metrics For Project Performance Review PPT Template SS. The first reason is you can not spend time making everything from scratch, Thus, Slidegeeks has made presentation templates for you too. You can easily download these templates from our website easily. This slide shows major key performance indicators that cane be used to tack and measure various aspects of project. It include KPIs such as gross profit margin, earned value and customer satisfaction etc.
Key Metrics To Measure Success Digital Marketing Strategies Improve Enterprise Sales Icons Pdf
The following slide showcases key performance indicators KPIs through which marketers can evaluate the effectiveness of marketing tactics. The KPIs covered in the slide are website traffic, brand impressions, annual contract value, new leads in pipeline, gross profit, net profit, market share, attrition rate, and monthly active users. Do you know about Slidesgeeks Key Metrics To Measure Success Digital Marketing Strategies Improve Enterprise Sales Icons Pdf These are perfect for delivering any kind od presentation. Using it, create PowerPoint presentations that communicate your ideas and engage audiences. Save time and effort by using our pre designed presentation templates that are perfect for a wide range of topic. Our vast selection of designs covers a range of styles, from creative to business, and are all highly customizable and easy to edit. Download as a PowerPoint template or use them as Google Slides themes. The following slide showcases key performance indicators KPIs through which marketers can evaluate the effectiveness of marketing tactics. The KPIs covered in the slide are website traffic, brand impressions, annual contract value, new leads in pipeline, gross profit, net profit, market share, attrition rate, and monthly active users.
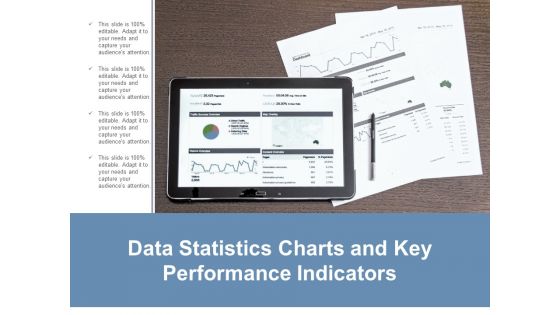
Data Statistics Charts And Key Performance Indicators Ppt Powerpoint Presentation Layouts Guide
This is a data statistics charts and key performance indicators ppt powerpoint presentation layouts guide. This is a four stage process. The stages in this process are business metrics, business kpi, business dashboard.
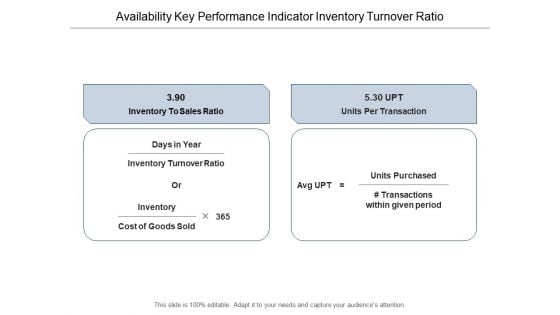
Availability Key Performance Indicator Inventory Turnover Ratio Ppt Powerpoint Presentation Layouts Graphics Download
This is a availability key performance indicator inventory turnover ratio ppt powerpoint presentation layouts graphics download. This is a two stage process. The stages in this process are availability kpi, availability dashboard, availability metrics.
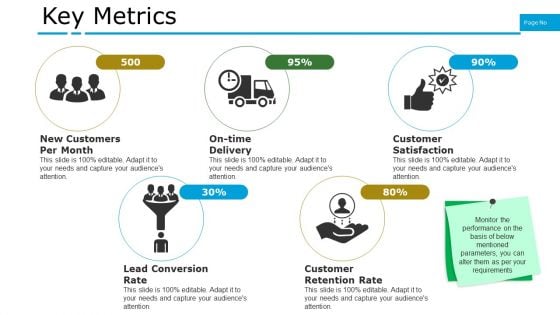
Key Metrics Ppt PowerPoint Presentation Infographics Example Topics
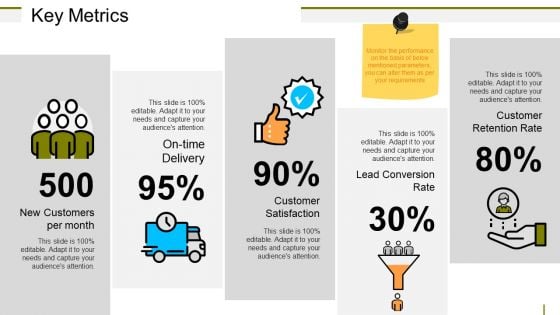
This is a key metrics ppt powerpoint presentation infographics example topics. This is a five stage process. The stages in this process are new customers per month, on time delivery, customer satisfaction, lead conversion rate, customer retention rate.
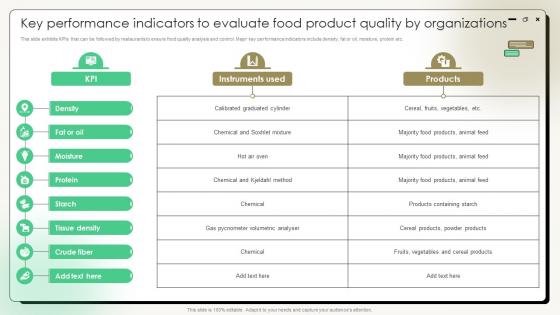
Comprehensive Guide On Current Strategies Key Performance Indicators To Evaluate Food Product Quality
This slide exhibits KPIs that can be followed by restaurants to ensure food quality analysis and control. Major key performance indicators include density, fat or oil, moisture, protein etc. Formulating a presentation can take up a lot of effort and time, so the content and message should always be the primary focus. The visuals of the PowerPoint can enhance the presenters message, so our Comprehensive Guide On Current Strategies Key Performance Indicators To Evaluate Food Product Quality was created to help save time. Instead of worrying about the design, the presenter can concentrate on the message while our designers work on creating the ideal templates for whatever situation is needed. Slidegeeks has experts for everything from amazing designs to valuable content, we have put everything into Comprehensive Guide On Current Strategies Key Performance Indicators To Evaluate Food Product Quality. This slide exhibits KPIs that can be followed by restaurants to ensure food quality analysis and control. Major key performance indicators include density, fat or oil, moisture, protein etc.
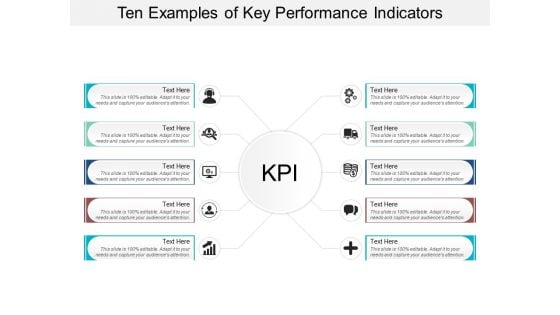
Ten Examples Of Key Performance Indicators Ppt Powerpoint Presentation Layouts Professional
This is a ten examples of key performance indicators ppt powerpoint presentation layouts professional. This is a ten stage process. The stages in this process are dashboard, kpi, metrics.
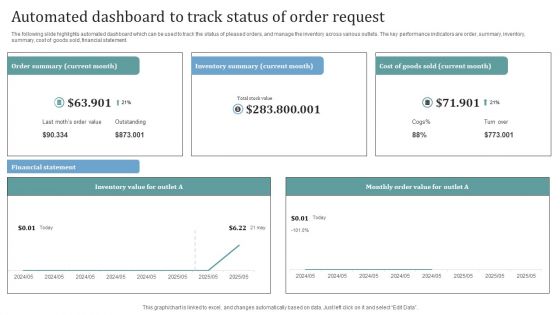
Automated Dashboard To Track Status Of Order Request Themes PDF
The following slide highlights automated dashboard which can be used to track the status of pleased orders, and manage the inventory across various outlets. The key performance indicators are order, summary, inventory, summary, cost of goods sold, financial statement. Showcasing this set of slides titled Automated Dashboard To Track Status Of Order Request Themes PDF. The topics addressed in these templates are Inventory Value, Inventory Summary, Cost. All the content presented in this PPT design is completely editable. Download it and make adjustments in color, background, font etc. as per your unique business setting.

Smart Grid Working Ppt Powerpoint Presentation Complete Deck With Slides
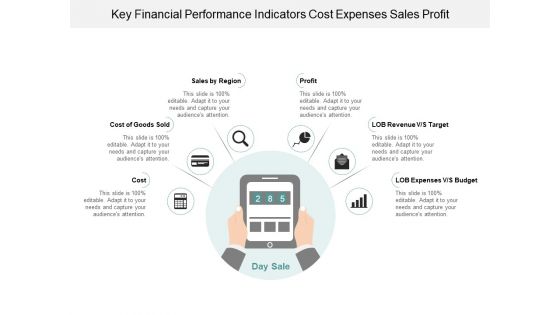
Key Financial Performance Indicators Cost Expenses Sales Profit Ppt Powerpoint Presentation Infographic Template Graphic Images
This is a key financial performance indicators cost expenses sales profit ppt powerpoint presentation infographic template graphic images. This is a six stage process. The stages in this process are dashboard, kpi, metrics.
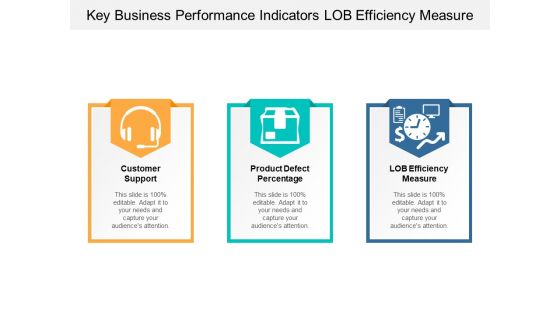
Key Business Performance Indicators Lob Efficiency Measure Ppt Powerpoint Presentation Infographics File Formats
This is a key business performance indicators lob efficiency measure ppt powerpoint presentation infographics file formats. This is a three stage process. The stages in this process are dashboard, kpi, metrics.
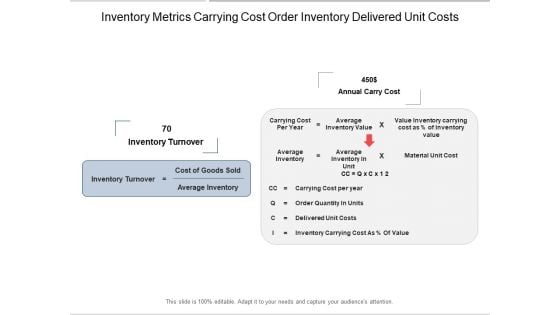
Inventory Metrics Carrying Cost Order Inventory Delivered Unit Costs Ppt Powerpoint Presentation Layouts Guidelines
This is a inventory metrics carrying cost order inventory delivered unit costs ppt powerpoint presentation layouts guidelines. This is a two stage process. The stages in this process are availability kpi, availability dashboard, availability metrics.
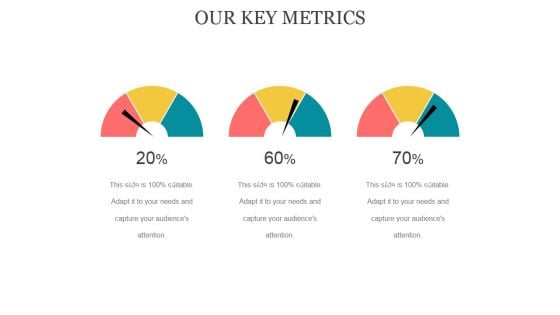
Our Key Metrics Ppt PowerPoint Presentation Styles
This is a our key metrics ppt powerpoint presentation styles. This is a three stage process. The stages in this process are business, marketing, dashboard, planning, analysis.

Quarterly Report Powerpoint Presentation Slides PPT Example
This Quarterly Report Powerpoint Presentation Slides PPT Example is a primer on how to capitalize on business opportunities through planning, innovation, and market intelligence. The content-ready format of the complete deck will make your job as a decision-maker a lot easier. Use this ready-made PowerPoint Template to help you outline an extensive and legible plan to capture markets and grow your company on the right path, at an exponential pace. What is even more amazing is that this presentation is completely editable and 100 percent customizable. This twenty six slide complete deck helps you impress a roomful of people with your expertise in business and even presentation. Craft such a professional and appealing presentation for that amazing recall value. Download now. Our comprehensive Quarterly Report Template is a professionally created presentation that can help organizations in representing key data, performance metrics and progress updates. This ppt streamlines the reporting process by providing structured sections for financial results, project updates, strategic insights, etc. It is ideal for internal reviews, stakeholder presentations, and executive summaries, ensuring your quarterly updates are communicated effectively and positively.
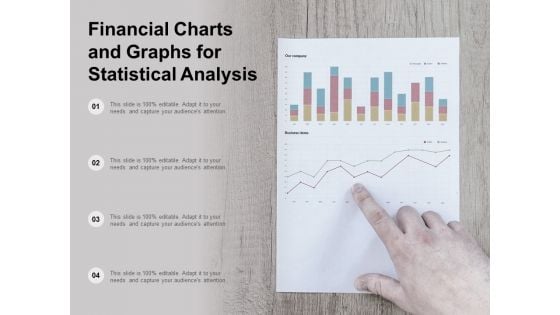
Financial Charts And Graphs For Statistical Analysis Ppt Powerpoint Presentation Show Layout
This is a financial charts and graphs for statistical analysis ppt powerpoint presentation show layout. This is a four stage process. The stages in this process are business metrics, business kpi, business dashboard.
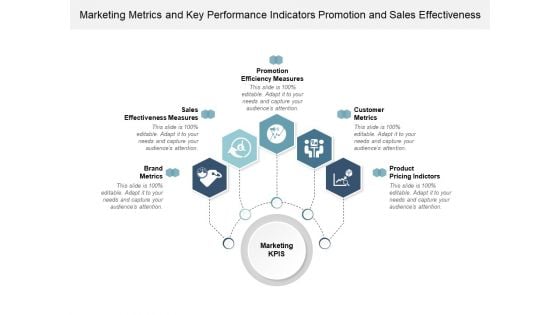
Marketing Metrics And Key Performance Indicators Promotion And Sales Effectiveness Ppt Powerpoint Presentation Infographics Graphics Example
This is a marketing metrics and key performance indicators promotion and sales effectiveness ppt powerpoint presentation infographics graphics example. This is a five stage process. The stages in this process are dashboard, kpi, metrics.
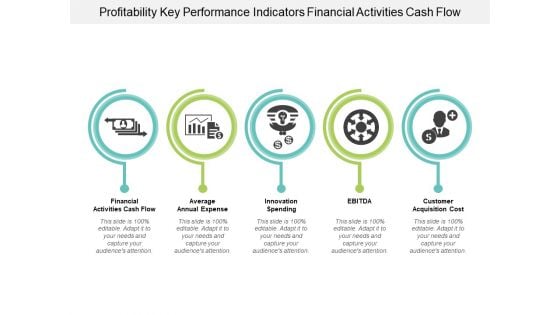
Profitability Key Performance Indicators Financial Activities Cash Flow Ppt Powerpoint Presentation Portfolio Clipart Images
This is a profitability key performance indicators financial activities cash flow ppt powerpoint presentation portfolio clipart images. This is a five stage process. The stages in this process are dashboard, kpi, metrics.
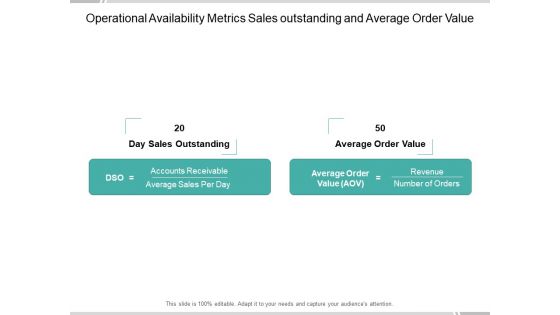
Operational Availability Metrics Sales Outstanding And Average Order Value Ppt Powerpoint Presentation Infographic Template Introduction
This is a operational availability metrics sales outstanding and average order value ppt powerpoint presentation infographic template introduction. This is a two stage process. The stages in this process are availability kpi, availability dashboard, availability metrics.
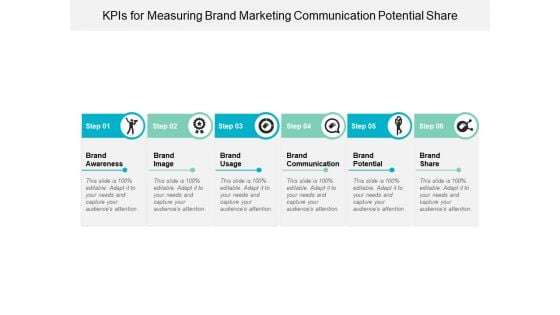
Kpis For Measuring Brand Marketing Communication Potential Share Ppt Powerpoint Presentation Layouts Infographics
This is a kpis for measuring brand marketing communication potential share ppt powerpoint presentation layouts infographics. This is a six stage process. The stages in this process are dashboard, kpi, metrics.
Economic Forecasting Powerpoint Presentation Slides
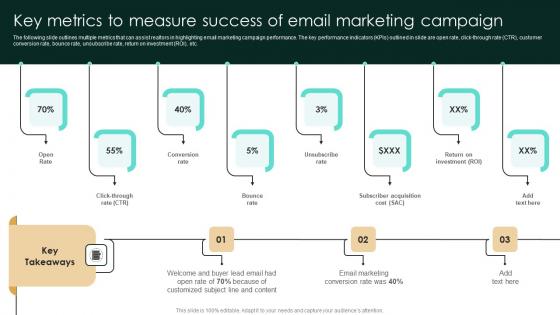
Key Metrics To Measure Success Of Email Marketing Campaign Diagrams Pdf
The following slide outlines multiple metrics that can assist realtors in highlighting email marketing campaign performance. The key performance indicators KPIs outlined in slide are open rate, click-through rate CTR, customer conversion rate, bounce rate, unsubscribe rate, return on investment ROI, etc. Retrieve professionally designed Key Metrics To Measure Success Of Email Marketing Campaign Diagrams Pdf to effectively convey your message and captivate your listeners. Save time by selecting pre-made slideshows that are appropriate for various topics, from business to educational purposes. These themes come in many different styles, from creative to corporate, and all of them are easily adjustable and can be edited quickly. Access them as PowerPoint templates or as Google Slides themes. You do not have to go on a hunt for the perfect presentation because Slidegeeks got you covered from everywhere. The following slide outlines multiple metrics that can assist realtors in highlighting email marketing campaign performance. The key performance indicators KPIs outlined in slide are open rate, click-through rate CTR, customer conversion rate, bounce rate, unsubscribe rate, return on investment ROI, etc.
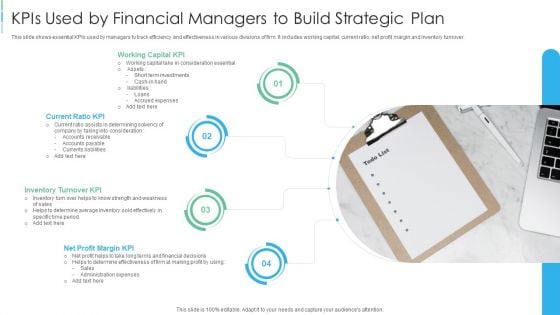
Kpis Used By Financial Managers To Build Strategic Plan Diagrams PDF
This slide shows essential KPIs used by managers to track efficiency and effectiveness in various divisions of firm. It includes working capital, current ratio, net profit margin and inventory turnover.Presenting Kpis Used By Financial Managers To Build Strategic Plan Diagrams PDF to dispense important information. This template comprises four stages. It also presents valuable insights into the topics including Working Capital KPI, Current Ratio KPI, Inventory Turnover KPI. This is a completely customizable PowerPoint theme that can be put to use immediately. So, download it and address the topic impactfully.
Calculator With Business Reports For Operational Efficiency Ppt Powerpoint Presentation Ideas Infographic Template
This is a calculator with business reports for operational efficiency ppt powerpoint presentation ideas infographic template. This is a four stage process. The stages in this process are business metrics, business kpi, business dashboard.
Performance Indicators Of Business Icons Ppt Powerpoint Presentation Infographics Graphics Template
This is a performance indicators of business icons ppt powerpoint presentation infographics graphics template. This is a four stage process. The stages in this process are dashboard, kpi, metrics.
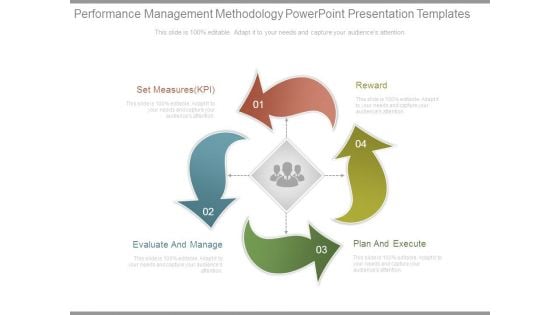
Performance Management Methodology Powerpoint Presentation Templates
This is a performance management methodology powerpoint presentation templates. This is a four stage process. The stages in this process are set measures kpi, evaluate and manage, reward, plan and execute.
Business Strategic Performance Report Ppt Powerpoint Presentation Show Background Image
This is a business strategic performance report ppt powerpoint presentation show background image. This is a four stage process. The stages in this process are business metrics, business kpi, business dashboard.


 Continue with Email

 Home
Home


