Kpi
Vendor Performance KPI Evaluation Dashboard Icon Portrait PDF
Presenting Vendor Performance KPI Evaluation Dashboard Icon Portrait PDF to dispense important information. This template comprises three stages. It also presents valuable insights into the topics including Vendor Performance, KPI Evaluation Dashboard Icon. This is a completely customizable PowerPoint theme that can be put to use immediately. So, download it and address the topic impactfully.
Vendor Performance KPI Management Dashboard Icon Download PDF
Presenting Vendor Performance KPI Management Dashboard Icon Download PDF to dispense important information. This template comprises three stages. It also presents valuable insights into the topics including Vendor Performance KPI, Management Dashboard Icon. This is a completely customizable PowerPoint theme that can be put to use immediately. So, download it and address the topic impactfully.
Insurance Scam Documentation Analysis KPI Dashboard Themes PDF
Persuade your audience using this Insurance Scam Documentation Analysis KPI Dashboard Themes PDF. This PPT design covers three stages, thus making it a great tool to use. It also caters to a variety of topics including Insurance Scam Documentation, Analysis Kpi Dashboard. Download this PPT design now to present a convincing pitch that not only emphasizes the topic but also showcases your presentation skills.
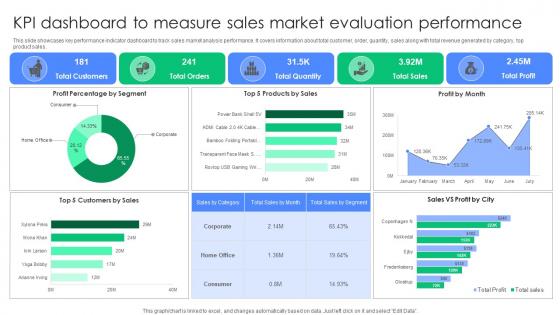
KPI Dashboard To Measure Sales Market Evaluation Performance Summary Pdf
This slide showcases key performance indicator dashboard to track sales market analysis performance. It covers information about total customer, order, quantity, sales along with total revenue generated by category, top product sales. Pitch your topic with ease and precision using this KPI Dashboard To Measure Sales Market Evaluation Performance Summary Pdf. This layout presents information on Profit Percentage Segment, Products Sales, Profit Month. It is also available for immediate download and adjustment. So, changes can be made in the color, design, graphics or any other component to create a unique layout. This slide showcases key performance indicator dashboard to track sales market analysis performance. It covers information about total customer, order, quantity, sales along with total revenue generated by category, top product sales.
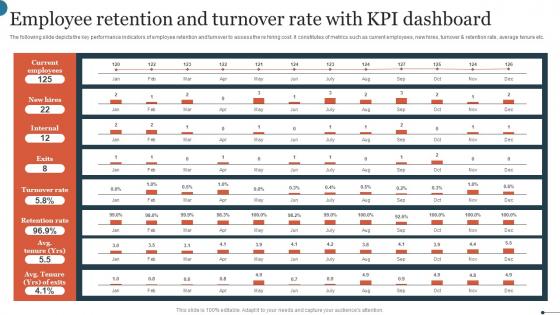
Employee Retention And Turnover Rate With KPI Dashboard Graphics Pdf
The following slide depicts the key performance indicators of employee retention and turnover to assess the re hiring cost. It constitutes of metrics such as current employees, new hires, turnover and retention rate, average tenure etc. Showcasing this set of slides titled Employee Retention And Turnover Rate With KPI Dashboard Graphics Pdf. The topics addressed in these templates are Current Employees, Turnover Rate, Retention Rate. All the content presented in this PPT design is completely editable. Download it and make adjustments in color, background, font etc. as per your unique business setting. The following slide depicts the key performance indicators of employee retention and turnover to assess the re hiring cost. It constitutes of metrics such as current employees, new hires, turnover and retention rate, average tenure etc.
KPI Dashboard Tracking Major Promotional Analytics Future Trends Rules Pdf
This slide covers the dashboard for analysing paid search metrics such as ad cost, clicks, impressions, click through rate, cost per conversion, conversion rate, cost per click, etc. The KPI Dashboard Tracking Major Promotional Analytics Future Trends Rules Pdf is a compilation of the most recent design trends as a series of slides. It is suitable for any subject or industry presentation, containing attractive visuals and photo spots for businesses to clearly express their messages. This template contains a variety of slides for the user to input data, such as structures to contrast two elements, bullet points, and slides for written information. Slidegeeks is prepared to create an impression. This slide covers the dashboard for analysing paid search metrics such as ad cost, clicks, impressions, click through rate, cost per conversion, conversion rate, cost per click, etc.
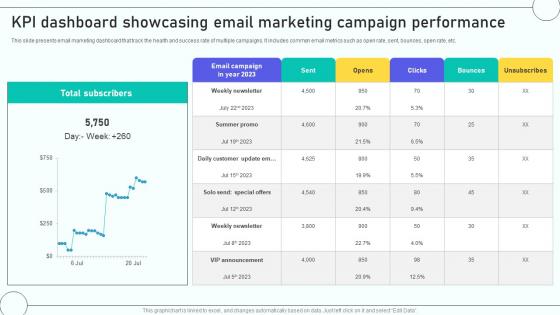
Email Marketing Automation Process KPI Dashboard Showcasing Email Marketing
This slide presents email marketing dashboard that track the health and success rate of multiple campaigns. It includes common email metrics such as open rate, sent, bounces, open rate, etc. Welcome to our selection of the Email Marketing Automation Process KPI Dashboard Showcasing Email Marketing. These are designed to help you showcase your creativity and bring your sphere to life. Planning and Innovation are essential for any business that is just starting out. This collection contains the designs that you need for your everyday presentations. All of our PowerPoints are 100 percent editable, so you can customize them to suit your needs. This multi-purpose template can be used in various situations. Grab these presentation templates today. This slide presents email marketing dashboard that track the health and success rate of multiple campaigns. It includes common email metrics such as open rate, sent, bounces, open rate, etc.
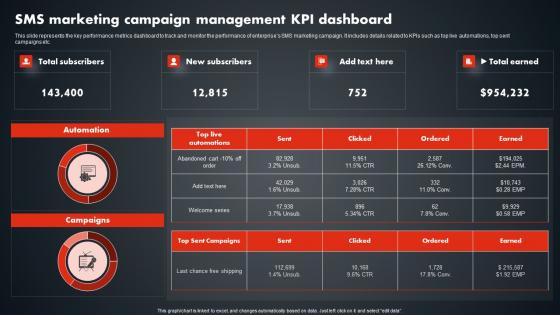
SMS Marketing Campaign Management Kpi SMS Promotional Tactics Graphics PDF
This slide represents the key performance metrics dashboard to track and monitor the performance of enterprises SMS marketing campaign. It includes details related to KPIs such as top live automations, top sent campaigns etc. There are so many reasons you need a SMS Marketing Campaign Management Kpi SMS Promotional Tactics Graphics PDF. The first reason is you can not spend time making everything from scratch, Thus, Slidegeeks has made presentation templates for you too. You can easily download these templates from our website easily. This slide represents the key performance metrics dashboard to track and monitor the performance of enterprises SMS marketing campaign. It includes details related to KPIs such as top live automations, top sent campaigns etc.
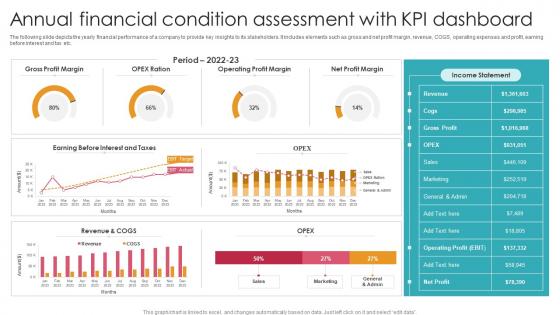
Annual Financial Condition Assessment With KPI Dashboard Ideas Pdf
The following slide depicts the yearly financial performance of a company to provide key insights to its stakeholders. It includes elements such as gross and net profit margin, revenue, COGS, operating expenses and profit, earning before interest and tax etc. Showcasing this set of slides titled Annual Financial Condition Assessment With KPI Dashboard Ideas Pdf. The topics addressed in these templates are Gross Profit Margin, Operating Profit Margin, Net Profit Margin. All the content presented in this PPT design is completely editable. Download it and make adjustments in color, background, font etc. as per your unique business setting. The following slide depicts the yearly financial performance of a company to provide key insights to its stakeholders. It includes elements such as gross and net profit margin, revenue, COGS, operating expenses and profit, earning before interest and tax etc.
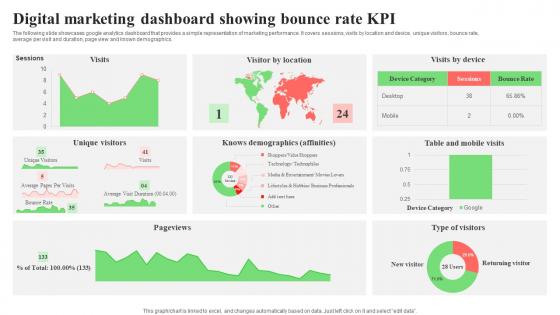
Digital Marketing Dashboard Showing Bounce Rate KPI Microsoft Pdf
The following slide showcases google analytics dashboard that provides a simple representation of marketing performance. It covers sessions, visits by location and device, unique visitors, bounce rate, average per visit and duration, page view and known demographics. Showcasing this set of slides titled Digital Marketing Dashboard Showing Bounce Rate KPI Microsoft Pdf. The topics addressed in these templates are Unique Visitors, Bounce Rate, Average Per Visit. All the content presented in this PPT design is completely editable. Download it and make adjustments in color, background, font etc. as per your unique business setting. The following slide showcases google analytics dashboard that provides a simple representation of marketing performance. It covers sessions, visits by location and device, unique visitors, bounce rate, average per visit and duration, page view and known demographics.
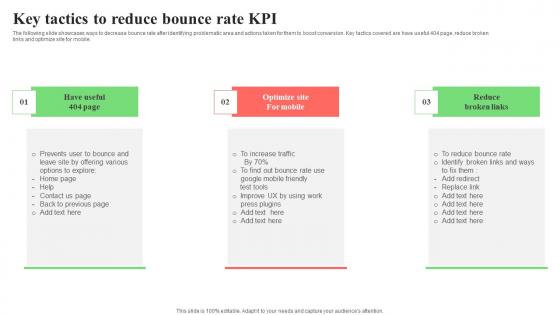
Key Tactics To Reduce Bounce Rate KPI Summary Pdf
The following slide showcases ways to decrease bounce rate after identifying problematic area and actions taken for them to boost conversion. Key tactics covered are have useful 404 page, reduce broken links and optimize site for mobile. Pitch your topic with ease and precision using this Key Tactics To Reduce Bounce Rate KPI Summary Pdf. This layout presents information on Reduce Broken, Optimize Site, Mobile. It is also available for immediate download and adjustment. So, changes can be made in the color, design, graphics or any other component to create a unique layout. The following slide showcases ways to decrease bounce rate after identifying problematic area and actions taken for them to boost conversion. Key tactics covered are have useful 404 page, reduce broken links and optimize site for mobile.
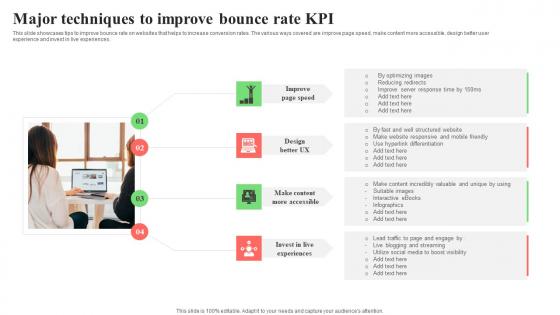
Major Techniques To Improve Bounce Rate KPI Sample Pdf
This slide showcases tips to improve bounce rate on websites that helps to increase conversion rates. The various ways covered are improve page speed, make content more accessible, design better user experience and invest in live experiences. Showcasing this set of slides titled Major Techniques To Improve Bounce Rate KPI Sample Pdf. The topics addressed in these templates are Make Content, More Accessible, Invest Live Experiences. All the content presented in this PPT design is completely editable. Download it and make adjustments in color, background, font etc. as per your unique business setting. This slide showcases tips to improve bounce rate on websites that helps to increase conversion rates. The various ways covered are improve page speed, make content more accessible, design better user experience and invest in live experiences.
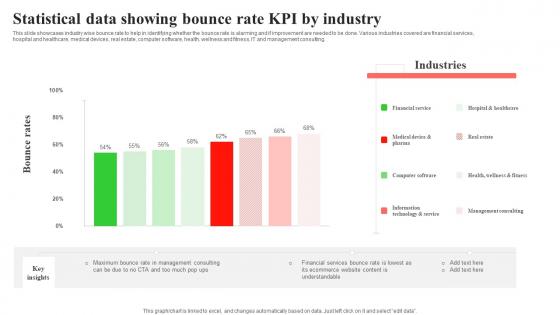
Statistical Data Showing Bounce Rate KPI By Industry Ideas Pdf
This slide showcases industry wise bounce rate to help in identifying whether the bounce rate is alarming and if improvement are needed to be done. Various industries covered are financial services, hospital and healthcare, medical devices, real estate, computer software, health, wellness and fitness, IT and management consulting. Showcasing this set of slides titled Statistical Data Showing Bounce Rate KPI By Industry Ideas Pdf. The topics addressed in these templates are Financial Services, Hospital And Healthcare, Medical Devices. All the content presented in this PPT design is completely editable. Download it and make adjustments in color, background, font etc. as per your unique business setting. This slide showcases industry wise bounce rate to help in identifying whether the bounce rate is alarming and if improvement are needed to be done. Various industries covered are financial services, hospital and healthcare, medical devices, real estate, computer software, health, wellness and fitness, IT and management consulting.
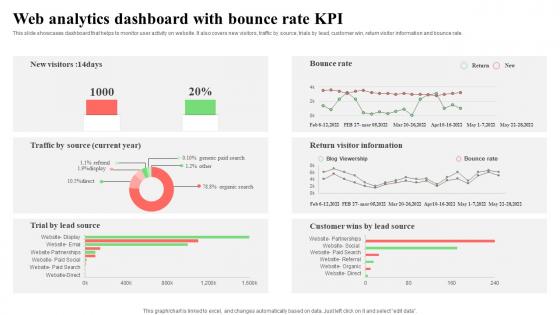
Web Analytics Dashboard With Bounce Rate KPI Elements Pdf
This slide showcases dashboard that helps to monitor user activity on website. It also covers new visitors, traffic by source, trials by lead, customer win, return visitor information and bounce rate. Showcasing this set of slides titled Web Analytics Dashboard With Bounce Rate KPI Elements Pdf. The topics addressed in these templates are Lead, Customer Win, Return Visitor Information. All the content presented in this PPT design is completely editable. Download it and make adjustments in color, background, font etc. as per your unique business setting. This slide showcases dashboard that helps to monitor user activity on website. It also covers new visitors, traffic by source, trials by lead, customer win, return visitor information and bounce rate.
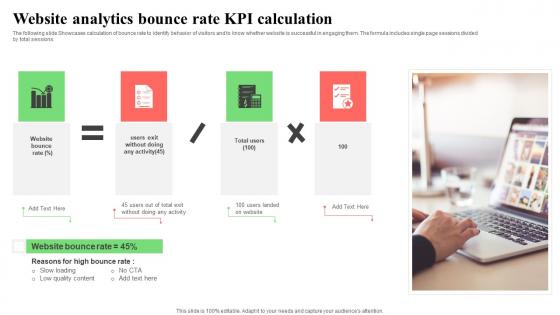
Website Analytics Bounce Rate KPI Calculation Topics Pdf
The following slide Showcases calculation of bounce rate to identify behavior of visitors and to know whether website is successful in engaging them. The formula includes single page sessions divided by total sessions. Pitch your topic with ease and precision using this Website Analytics Bounce Rate KPI Calculation Topics Pdf. This layout presents information on Website Bounce Rate, Slow Loading, Low Quality Content. It is also available for immediate download and adjustment. So, changes can be made in the color, design, graphics or any other component to create a unique layout. The following slide Showcases calculation of bounce rate to identify behavior of visitors and to know whether website is successful in engaging them. The formula includes single page sessions divided by total sessions.
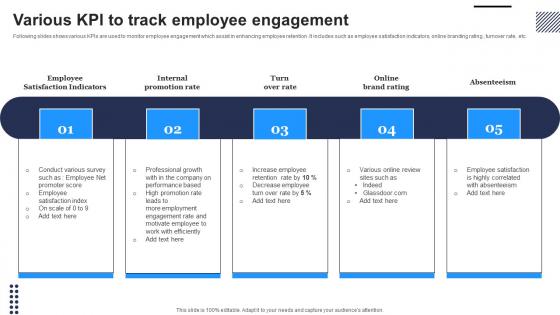
Various KPI To Track Employee Engagement Portrait Pdf
Following slides shows various KPIs are used to monitor employee engagement which assist in enhancing employee retention .It includes such as employee satisfaction indicators, online branding rating , turnover rate, etc. Showcasing this set of slides titled Various KPI To Track Employee Engagement Portrait Pdf The topics addressed in these templates are Employee Satisfaction Indicators, Internal Promotion Rate All the content presented in this PPT design is completely editable. Download it and make adjustments in color, background, font etc. as per your unique business setting. Following slides shows various KPIs are used to monitor employee engagement which assist in enhancing employee retention .It includes such as employee satisfaction indicators, online branding rating , turnover rate, etc.
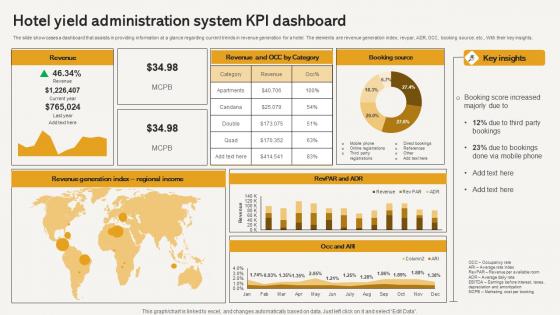
Hotel Yield Administration System Kpi Dashboard Elements Pdf
The slide showcases a dashboard that assists in providing information at a glance regarding current trends in revenue generation for a hotel. The elements are revenue generation index, revpar, ADR, OCC, booking source, etc., With their key insights. Pitch your topic with ease and precision using this Hotel Yield Administration System Kpi Dashboard Elements Pdf This layout presents information on Revenue, Booking Source, Regional Income, Key Insights It is also available for immediate download and adjustment. So, changes can be made in the color, design, graphics or any other component to create a unique layout. The slide showcases a dashboard that assists in providing information at a glance regarding current trends in revenue generation for a hotel. The elements are revenue generation index, revpar, ADR, OCC, booking source, etc., With their key insights.
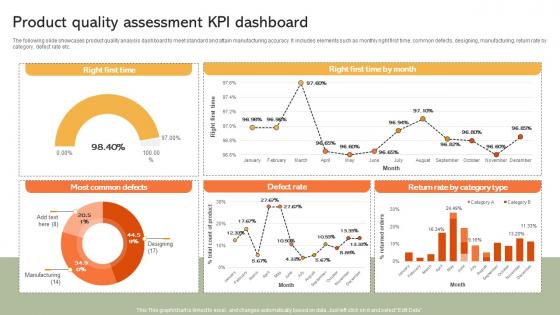
Product Quality Assessment KPI Dashboard Implementing Manufacturing Strategy SS V
The following slide showcases product quality analysis dashboard to meet standard and attain manufacturing accuracy. It includes elements such as monthly right first time, common defects, designing, manufacturing, return rate by category, defect rate etc. Take your projects to the next level with our ultimate collection of Product Quality Assessment KPI Dashboard Implementing Manufacturing Strategy SS V. Slidegeeks has designed a range of layouts that are perfect for representing task or activity duration, keeping track of all your deadlines at a glance. Tailor these designs to your exact needs and give them a truly corporate look with your own brand colors they will make your projects stand out from the rest The following slide showcases product quality analysis dashboard to meet standard and attain manufacturing accuracy. It includes elements such as monthly right first time, common defects, designing, manufacturing, return rate by category, defect rate etc.
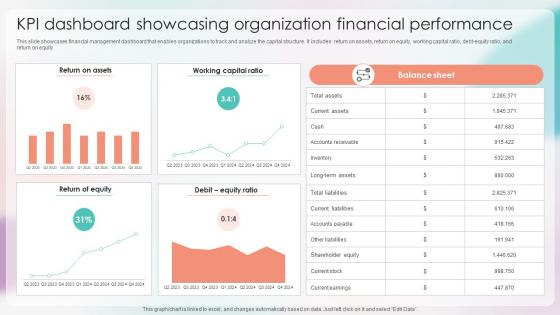
Strategies For Stabilizing Corporate KPI Dashboard Showcasing Organization Financial
This slide showcases financial management dashboard that enables organizations to track and analyze the capital structure. It includes return on assets, return on equity, working capital ratio, debt-equity ratio, and return on equity. Coming up with a presentation necessitates that the majority of the effort goes into the content and the message you intend to convey. The visuals of a PowerPoint presentation can only be effective if it supplements and supports the story that is being told. Keeping this in mind our experts created Strategies For Stabilizing Corporate KPI Dashboard Showcasing Organization Financial to reduce the time that goes into designing the presentation. This way, you can concentrate on the message while our designers take care of providing you with the right template for the situation. This slide showcases financial management dashboard that enables organizations to track and analyze the capital structure. It includes return on assets, return on equity, working capital ratio, debt-equity ratio, and return on equity.
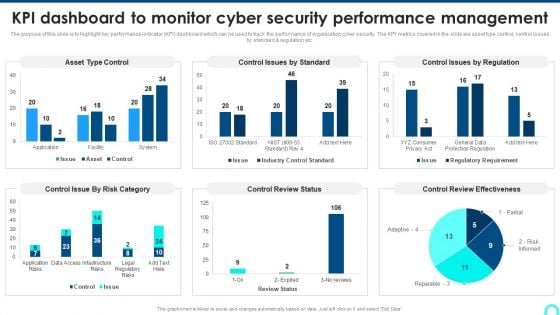
KPI Dashboard To Monitor Cyber Security Performance Management Background PDF
The purpose of this slide is to highlight key performance indicator KPI dashboard which can be used to track the performance of organization cyber security. The KPI metrics covered in the slide are asset type control, control issues by standard and regulation etc.Deliver and pitch your topic in the best possible manner with this KPI Dashboard To Monitor Cyber Security Performance Management Background PDF. Use them to share invaluable insights on Control Issue, Control Review, Review Effectiveness and impress your audience. This template can be altered and modified as per your expectations. So, grab it now.
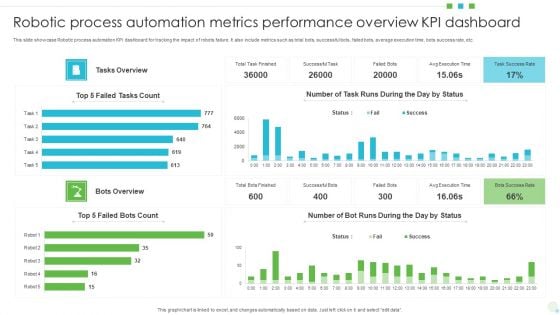
Robotic Process Automation Metrics Performance Overview KPI Dashboard Download PDF
This slide showcase Robotic process automation KPI dashboard for tracking the impact of robots failure. It also include metrics such as total bots, successful bots, failed bots, average execution time, bots success rate, etc. Showcasing this set of slides titled Robotic Process Automation Metrics Performance Overview KPI Dashboard Download PDF. The topics addressed in these templates are Robotic Process Automation, Metrics Performance Overview, Kpi Dashboard. All the content presented in this PPT design is completely editable. Download it and make adjustments in color, background, font etc. as per your unique business setting.
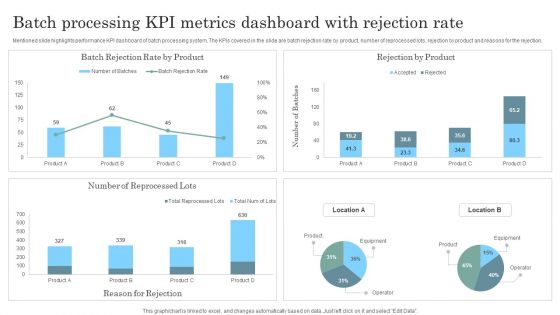
Batch Processing KPI Metrics Dashboard With Rejection Rate Topics PDF
Mentioned slide highlights performance KPI dashboard of batch processing system. The KPIs covered in the slide are batch rejection rate by product, number of reprocessed lots, rejection by product and reasons for the rejection. Pitch your topic with ease and precision using this Batch Processing KPI Metrics Dashboard With Rejection Rate Topics PDF. This layout presents information on Batch Processing KPI Metrics, Dashboard Rejection Rate. It is also available for immediate download and adjustment. So, changes can be made in the color, design, graphics or any other component to create a unique layout.
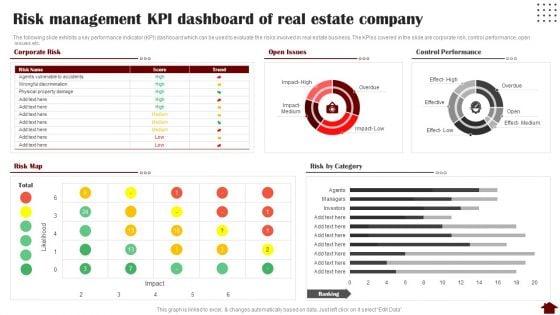
Risk Management KPI Dashboard Of Real Estate Company Rules PDF
The following slide exhibits a key performance indicator KPI dashboard which can be used to evaluate the risks involved in real estate business. The KPIss covered in the slide are corporate risk, control performance, open issues etc. Deliver and pitch your topic in the best possible manner with this Risk Management KPI Dashboard Of Real Estate Company Rules PDF. Use them to share invaluable insights on Risk Management KPI Dashboard, Real Estate Company and impress your audience. This template can be altered and modified as per your expectations. So, grab it now.
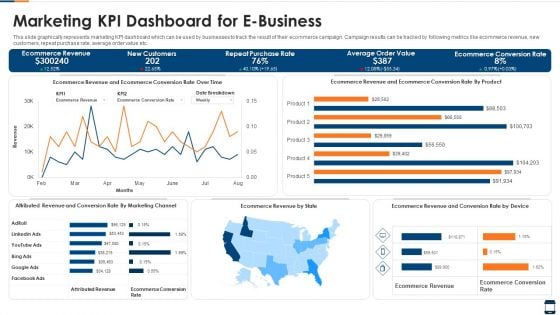
Marketing KPI Dashboard For E Business Brochure PDF
This slide graphically represents marketing KPI dashboard which can be used by businesses to track the result of their ecommerce campaign. Campaign results can be tracked by following metrics like ecommerce revenue, new customers, repeat purchase rate, average order value etc. Showcasing this set of slides titled marketing kpi dashboard for e business brochure pdf. The topics addressed in these templates are marketing kpi dashboard for e business. All the content presented in this PPT design is completely editable. Download it and make adjustments in color, background, font etc. as per your unique business setting.
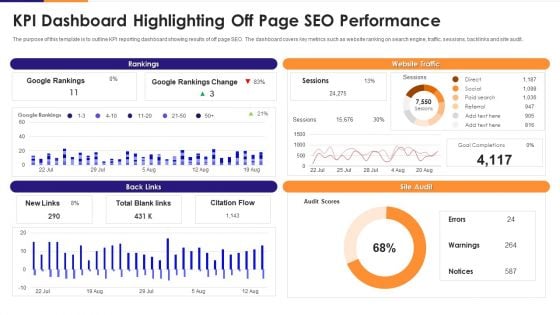
KPI Dashboard Highlighting Off Page Seo Performance Rules PDF
The purpose of this template is to outline KPI reporting dashboard showing results of off page SEO. The dashboard covers key metrics such as website ranking on search engine, traffic, sessions, backlinks and site audit. Showcasing this set of slides titled kpi dashboard highlighting off page seo performance rules pdf. The topics addressed in these templates are kpi dashboard highlighting off page seo performance. All the content presented in this PPT design is completely editable. Download it and make adjustments in color, background, font etc. as per your unique business setting.
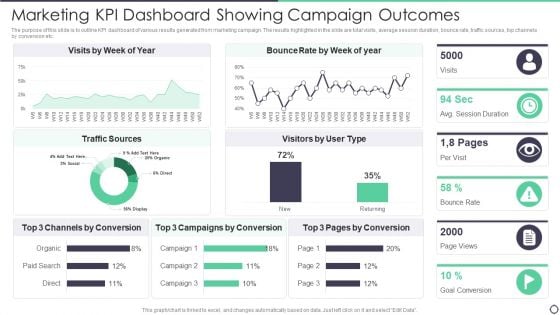
Marketing Kpi Dashboard Showing Campaign Outcomes Pictures PDF
The purpose of this slide is to outline KPI dashboard of various results generated from marketing campaign. The results highlighted in the slide are total visits, average session duration, bounce rate, traffic sources, top channels by conversion etc. Pitch your topic with ease and precision using this Marketing Kpi Dashboard Showing Campaign Outcomes Pictures PDF. This layout presents information on Marketing Kpi Dashboard Showing Campaign Outcomes. It is also available for immediate download and adjustment. So, changes can be made in the color, design, graphics or any other component to create a unique layout.
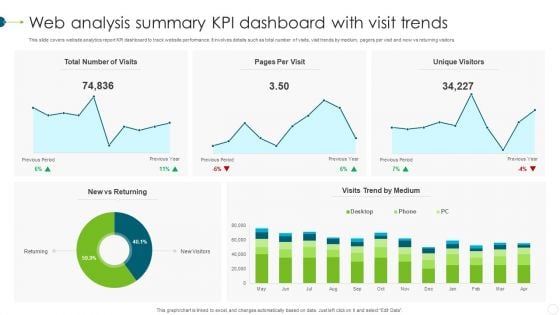
Web Analysis Summary KPI Dashboard With Visit Trends Professional PDF
This slide covers website analytics report KPI dashboard to track website performance. It involves details such as total number of visits, visit trends by medium, pagers per visit and new vs returning visitors. Pitch your topic with ease and precision using this Web Analysis Summary KPI Dashboard With Visit Trends Professional PDF. This layout presents information on Web Analysis Summary, KPI Dashboard, Visit Trends. It is also available for immediate download and adjustment. So, changes can be made in the color, design, graphics or any other component to create a unique layout.
New Staff Onboarding Process KPI Tracking Dashboard Inspiration PDF
This slide showcase the KPI dashboard for tracking new hire onboarding completion progress. It includes KPIs such as onboarding completion status, employees per office, progress chart, hires starting in current and next week. Showcasing this set of slides titled New Staff Onboarding Process KPI Tracking Dashboard Inspiration PDF. The topics addressed in these templates are New Staff Onboarding Process, KPI Tracking Dashboard. All the content presented in this PPT design is completely editable. Download it and make adjustments in color, background, font etc. as per your unique business setting.

Data Center Infrastructure Management KPI Dashboard Designs PDF
This slide covers data center infrastructure management KPI dashboard. It involves details such as cabinets with free data and power ports, data ports usage per user and items per connected power supplies. Showcasing this set of slides titled Data Center Infrastructure Management KPI Dashboard Designs PDF. The topics addressed in these templates are Data Center Infrastructure, Management KPI Dashboard. All the content presented in this PPT design is completely editable. Download it and make adjustments in color, background, font etc. as per your unique business setting.
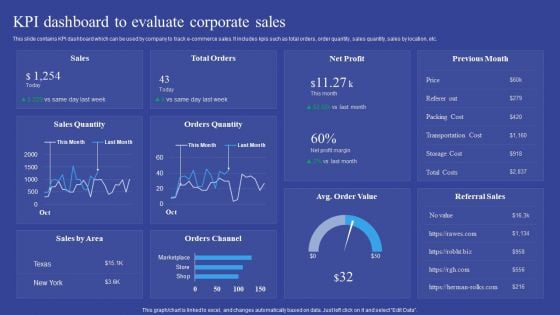
KPI Dashboard To Evaluate Corporate Sales Introduction PDF
This slide contains KPI dashboard which can be used by company to track e-commerce sales. It includes kpis such as total orders, order quantity, sales quantity, sales by location, etc. Pitch your topic with ease and precision using this KPI Dashboard To Evaluate Corporate Sales Introduction PDF. This layout presents information on KPI Dashboard, Evaluate Corporate Sales. It is also available for immediate download and adjustment. So, changes can be made in the color, design, graphics or any other component to create a unique layout.
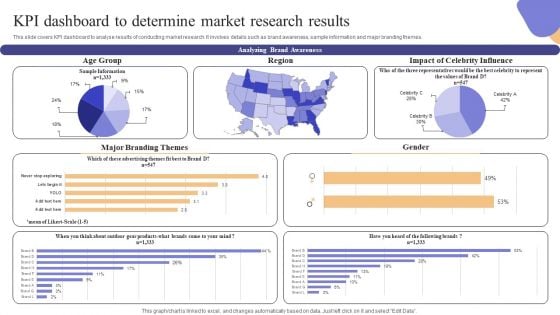
KPI Dashboard To Determine Market Research Results Information PDF
This slide covers KPI dashboard to analyse results of conducting market research. It involves details such as brand awareness, sample information and major branding themes. Crafting an eye-catching presentation has never been more straightforward. Let your presentation shine with this tasteful yet straightforward KPI Dashboard To Determine Market Research Results Information PDF template. It offers a minimalistic and classy look that is great for making a statement. The colors have been employed intelligently to add a bit of playfulness while still remaining professional. Construct the ideal KPI Dashboard To Determine Market Research Results Information PDF that effortlessly grabs the attention of your audience Begin now and be certain to wow your customers
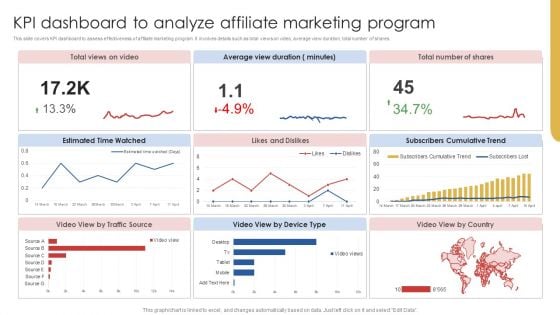
KPI Dashboard To Analyze Affiliate Marketing Program Rules PDF
This slide covers KPI dashboard to assess effectiveness of affiliate marketing program. It involves details such as total views on video, average view duration, total number of shares. Create an editable KPI Dashboard To Analyze Affiliate Marketing Program Rules PDF that communicates your idea and engages your audience. Whether you are presenting a business or an educational presentation, pre-designed presentation templates help save time. KPI Dashboard To Analyze Affiliate Marketing Program Rules PDF is highly customizable and very easy to edit, covering many different styles from creative to business presentations. Slidegeeks has creative team members who have crafted amazing templates. So, go and get them without any delay.
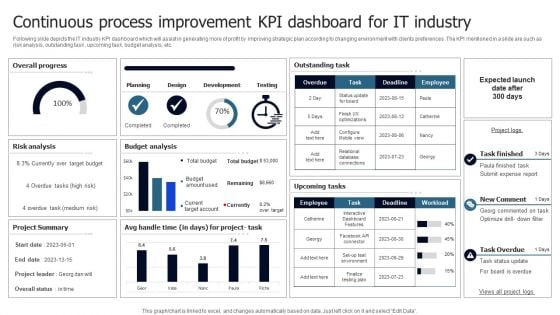
Continuous Process Improvement KPI Dashboard For IT Industry Clipart PDF
Following slide depicts the IT industry KPI dashboard which will assist in generating more of profit by improving strategic plan according to changing environment with clients preferences .The KPI mentioned in a slide are such as risk analysis, outstanding task , upcoming task, budget analysis, etc. Pitch your topic with ease and precision using this Continuous Process Improvement KPI Dashboard For IT Industry Clipart PDF. This layout presents information on Overall Progress, Risk Analysis, Budget Analysis. It is also available for immediate download and adjustment. So, changes can be made in the color, design, graphics or any other component to create a unique layout.
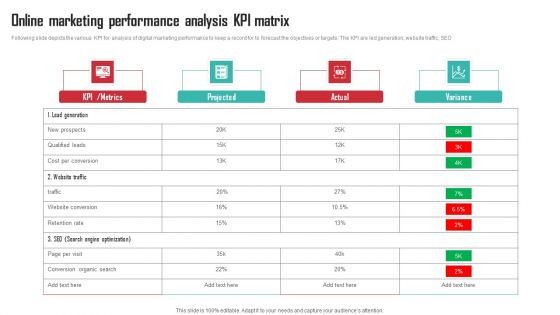
Online Marketing Performance Analysis KPI Matrix Summary PDF
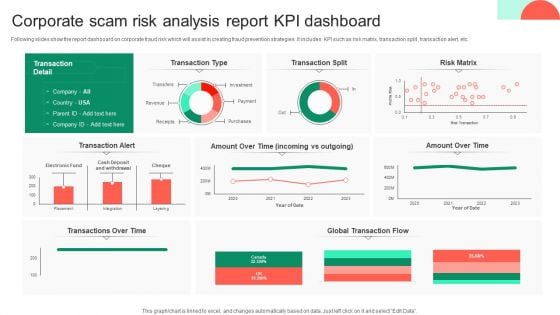
Corporate Scam Risk Analysis Report KPI Dashboard Themes PDF
Following slides show the report dashboard on corporate fraud risk which will assist in creating fraud prevention strategies .It includes KPI such as risk matrix, transaction split , transaction alert, etc. Pitch your topic with ease and precision using this Corporate Scam Risk Analysis Report KPI Dashboard Themes PDF. This layout presents information on Global Transaction Flow, Risk Matrix, Transaction Split, Analysis Report Kpi Dashboard. It is also available for immediate download and adjustment. So, changes can be made in the color, design, graphics or any other component to create a unique layout.
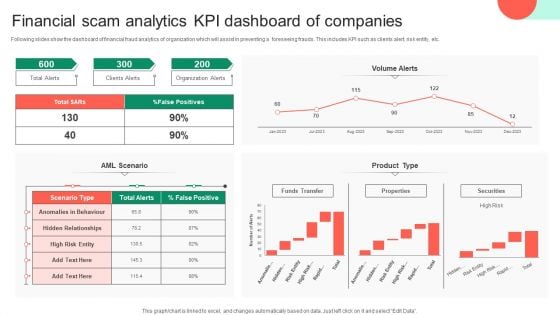
Financial Scam Analytics KPI Dashboard Of Companies Clipart PDF
Following slides show the dashboard of financial fraud analytics of organization which will assist in preventing a foreseeing frauds. This includes KPI such as clients alert, risk entity, etc. Pitch your topic with ease and precision using this Financial Scam Analytics KPI Dashboard Of Companies Clipart PDF. This layout presents information on Financial Scam Analytics, Kpi Dashboard Of Companies. It is also available for immediate download and adjustment. So, changes can be made in the color, design, graphics or any other component to create a unique layout.
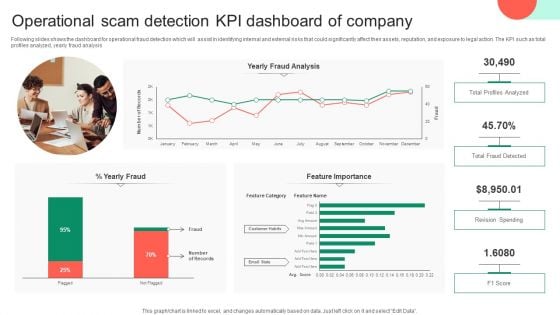
Operational Scam Detection KPI Dashboard Of Company Topics PDF
Following slides shows the dashboard for operational fraud detection which will assist in identifying internal and external risks that could significantly affect their assets, reputation, and exposure to legal action. The KPI such as total profiles analyzed, yearly fraud analysis. Pitch your topic with ease and precision using this Operational Scam Detection KPI Dashboard Of Company Topics PDF. This layout presents information on Profiles Analyzed, Operational Scam Detection, Kpi Dashboard Of Company. It is also available for immediate download and adjustment. So, changes can be made in the color, design, graphics or any other component to create a unique layout.
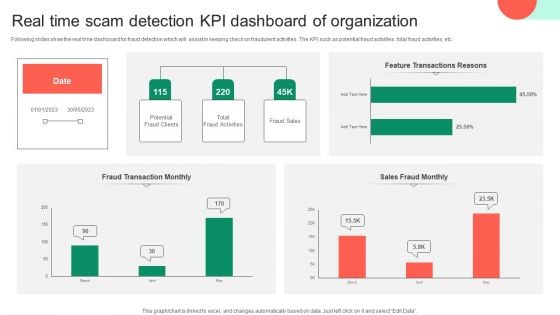
Real Time Scam Detection KPI Dashboard Of Organization Information PDF
Following slides show the real time dashboard for fraud detection which will assist in keeping check on fraudulent activities. The KPI such as potential fraud activities, total fraud activities, etc. Pitch your topic with ease and precision using this Real Time Scam Detection KPI Dashboard Of Organization Information PDF. This layout presents information on Real Time Scam Detection, Kpi Dashboard Of Organization. It is also available for immediate download and adjustment. So, changes can be made in the color, design, graphics or any other component to create a unique layout.
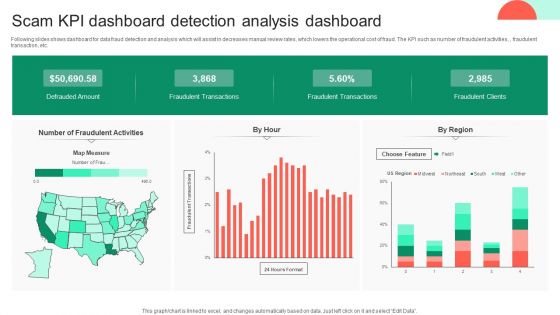
Scam KPI Dashboard Detection Analysis Dashboard Background PDF
Following slides shows dashboard for data fraud detection and analysis which will assist in decreases manual review rates, which lowers the operational cost of fraud. The KPI such as number of fraudulent activities, , fraudulent transaction, etc. Showcasing this set of slides titled Scam KPI Dashboard Detection Analysis Dashboard Background PDF. The topics addressed in these templates are Scam Kpi Dashboard, Detection Analysis Dashboard. All the content presented in this PPT design is completely editable. Download it and make adjustments in color, background, font etc. as per your unique business setting.
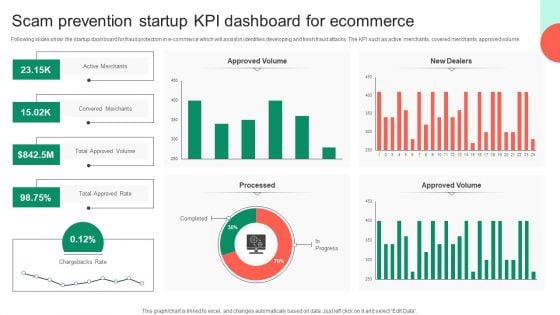
Scam Prevention Startup KPI Dashboard For Ecommerce Themes PDF
Following slides show the startup dashboard for fraud protection in e-commerce which will assist in identifies developing and fresh fraud attacks. The KPI such as active merchants, covered merchants, approved volume. Pitch your topic with ease and precision using this Scam Prevention Startup KPI Dashboard For Ecommerce Themes PDF. This layout presents information on Approved Volume, Chargebacks Rate, Kpi Dashboard For Ecommerce. It is also available for immediate download and adjustment. So, changes can be made in the color, design, graphics or any other component to create a unique layout.
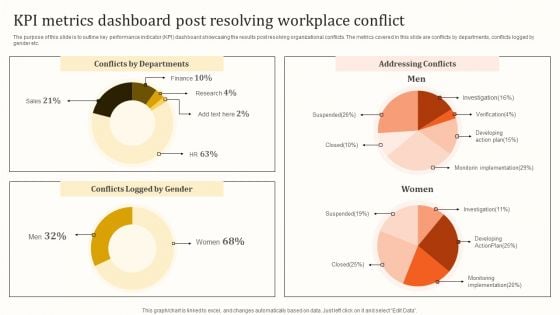
KPI Metrics Dashboard Post Resolving Workplace Conflict Template PDF
The purpose of this slide is to outline key performance indicator KPI dashboard showcasing the results post resolving organizational conflicts. The metrics covered in this slide are conflicts by departments, conflicts logged by gender etc. Presenting this PowerPoint presentation, titled KPI Metrics Dashboard Post Resolving Workplace Conflict Template PDF, with topics curated by our researchers after extensive research. This editable presentation is available for immediate download and provides attractive features when used. Download now and captivate your audience. Presenting this KPI Metrics Dashboard Post Resolving Workplace Conflict Template PDF. Our researchers have carefully researched and created these slides with all aspects taken into consideration. This is a completely customizable KPI Metrics Dashboard Post Resolving Workplace Conflict Template PDF that is available for immediate downloading. Download now and make an impact on your audience. Highlight the attractive features available with our PPTs.
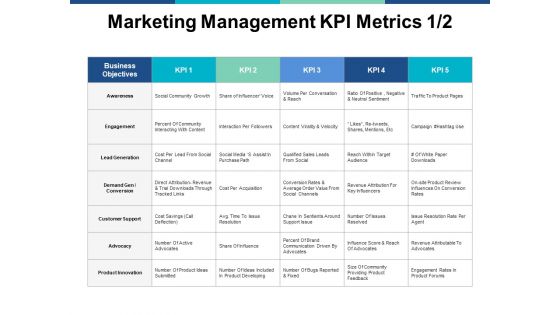
Marketing Management Kpi Metrics Business Ppt PowerPoint Presentation Show Shapes
This is a marketing management kpi metrics business ppt powerpoint presentation show shapes. This is a four stage process. The stages in this process are compare, marketing, business, management, planning.
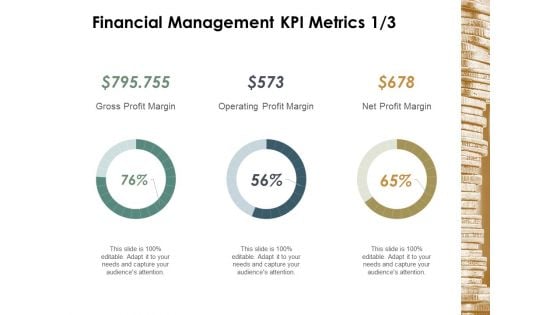
Financial Management Kpi Metrics Business Ppt Powerpoint Presentation Model Example
This is a financial management kpi metrics business ppt powerpoint presentation model example. This is a three stage process. The stages in this process are finance, marketing, management, investment, analysis.
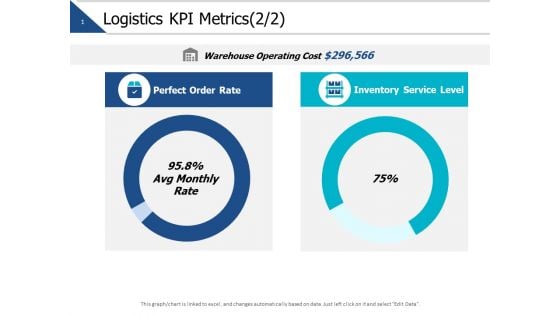
Logistics Kpi Metrics Business Ppt PowerPoint Presentation Layouts Microsoft
This is a logistics kpi metrics business ppt powerpoint presentation layouts microsoft. This is a two stage process. The stages in this process are finance, marketing, management, investment, analysis.
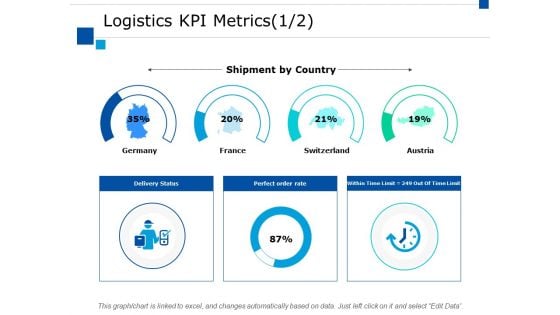
Logistics Kpi Metrics Business Ppt PowerPoint Presentation Ideas Infographics
This is a logistics kpi metrics business ppt powerpoint presentation ideas infographics. This is a four stage process. The stages in this process are finance, marketing, management, investment, analysis.
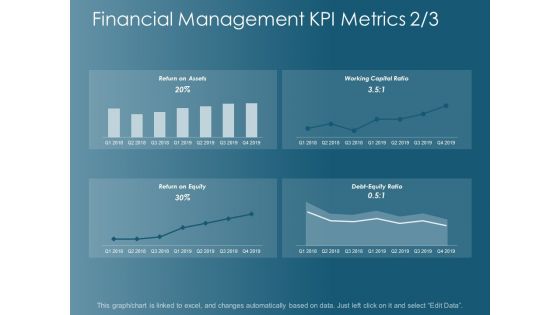
Financial Management Kpi Metrics Business Ppt Powerpoint Presentation Styles Diagrams
This is a financial management kpi metrics business ppt powerpoint presentation styles diagrams. This is a four stage process. The stages in this process are finance, marketing, management, investment, analysis.
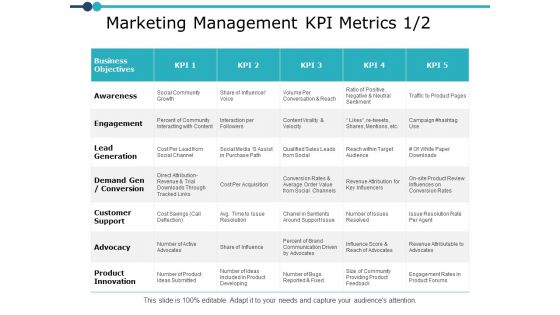
Marketing Management Kpi Metrics Planning Ppt PowerPoint Presentation Model Graphics
This is a marketing management kpi metrics planning ppt powerpoint presentation model graphics. The topics discussed in this diagram are marketing, business, management, planning, strategy This is a completely editable PowerPoint presentation, and is available for immediate download.
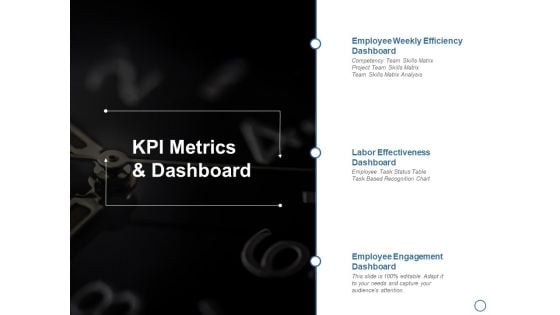
KPI Metrics And Dashboard Ppt PowerPoint Presentation Inspiration Format Ideas
This is a kpi metrics and dashboard ppt powerpoint presentation inspiration format ideas. This is a three stage process. The stages in this process are business, planning, strategy, marketing, management.
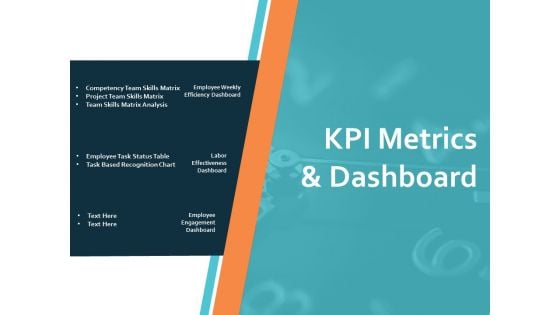
KPI Metrics And Dashboard Ppt PowerPoint Presentation Infographics Model
This is a kpi metrics and dashboard ppt powerpoint presentation infographics model. This is a three stage process. The stages in this process are business, planning, strategy, marketing, management.
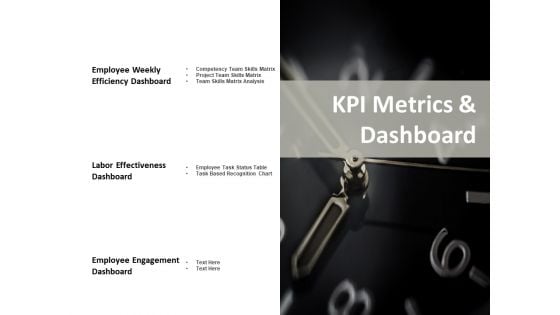
Kpi Metrics And Dashboard Ppt PowerPoint Presentation Show Skills
This is a kpi metrics and dashboard ppt powerpoint presentation show skills. This is a three stage process. The stages in this process are measure, business, management, planning, strategy.
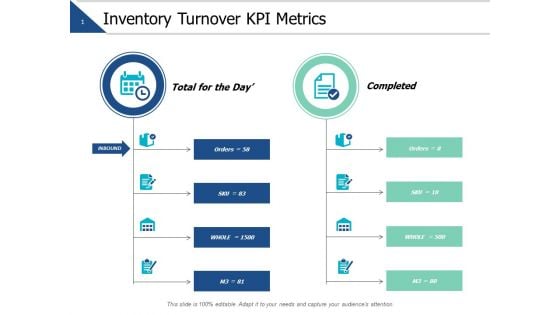
Inventory Turnover Kpi Metrics Ppt PowerPoint Presentation Summary File Formats
This is a inventory turnover kpi metrics ppt powerpoint presentation summary file formats. This is a five stage process. The stages in this process are marketing, business, management, planning, strategy.
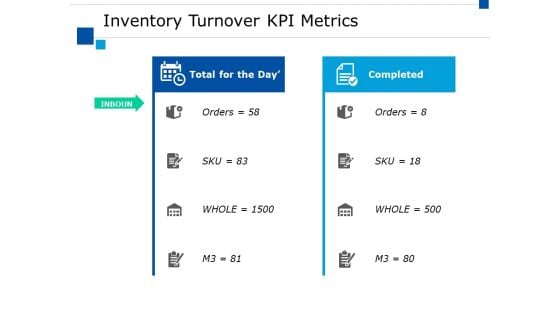
Inventory Turnover Kpi Metrics Ppt PowerPoint Presentation Summary Master Slide
This is a inventory turnover kpi metrics ppt powerpoint presentation summary master slide. This is a two stage process. The stages in this process are marketing, business, management, compare.
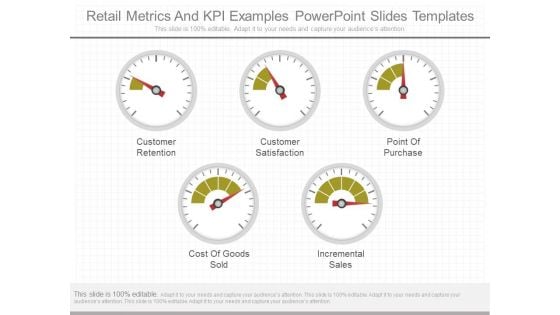
Retail Metrics And Kpi Examples Powerpoint Slides Templates
This is a retail metrics and kpi examples powerpoint slides templates. This is a five stage process. The stages in this process are customer retention, customer satisfaction, point of purchase, cost of goods sold, incremental sales.
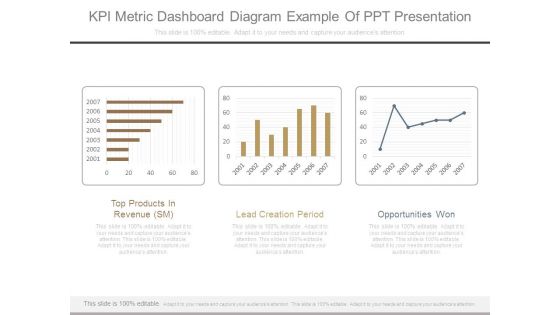
Kpi Metric Dashboard Diagram Example Of Ppt Presentation
This is a kpi metric dashboard diagram example of ppt presentation. This is a three stage process. The stages in this process are top products in revenue sm, lead creation period, opportunities won.
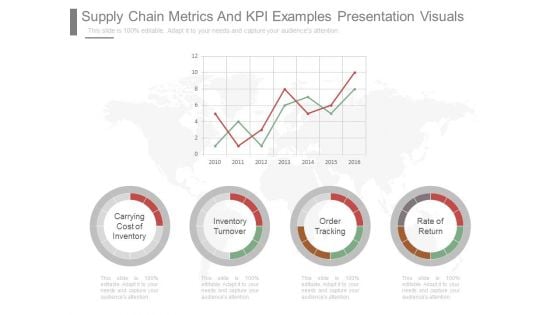
Supply Chain Metrics And Kpi Examples Presentation Visuals
This is a supply chain metrics and kpi examples presentation visuals. This is a four stage process. The stages in this process are carrying cost of inventory, inventory turnover, order tracking, rate of return.
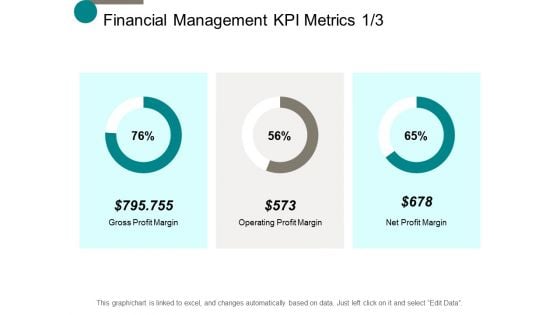
Financial Management Kpi Metrics Management Ppt Powerpoint Presentation Outline Themes
This is a financial management kpi metrics management ppt powerpoint presentation outline themes. This is a three stage process. The stages in this process are finance, marketing, management, investment, analysis.
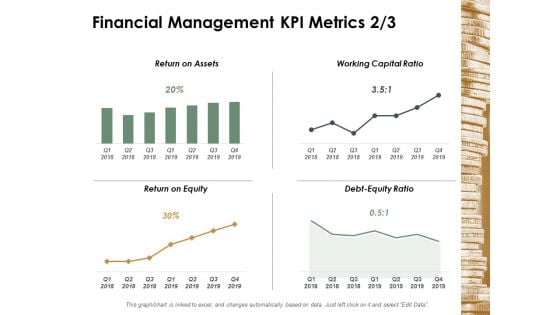
Financial Management Kpi Metrics Management Ppt Powerpoint Presentation File Template
This is a financial management kpi metrics management ppt powerpoint presentation file template. This is a four stage process. The stages in this process are finance, marketing, management, investment, analysis.
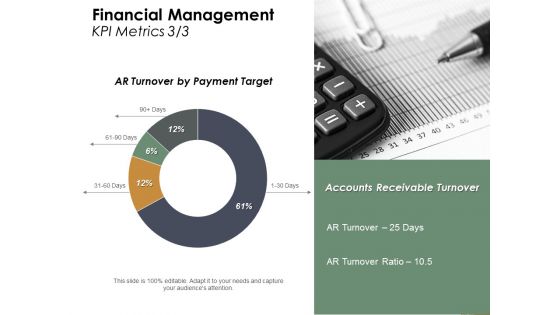
Financial Management Kpi Metrics Strategy Ppt Powerpoint Presentation Professional Show
This is a financial management kpi metrics strategy ppt powerpoint presentation professional show. This is a four stage process. The stages in this process are finance, marketing, management, investment, analysis.
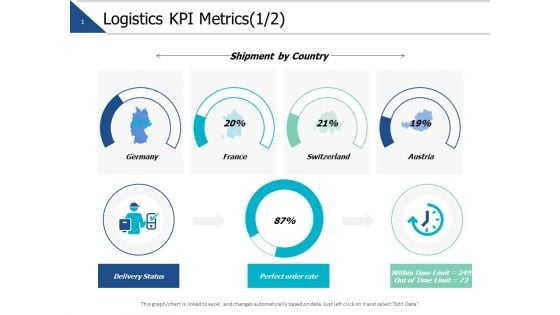
Logistics Kpi Metrics Finance Ppt PowerPoint Presentation Slides Styles
This is a logistics kpi metrics finance ppt powerpoint presentation slides styles. This is a four stage process. The stages in this process are finance, marketing, management, investment, analysis.
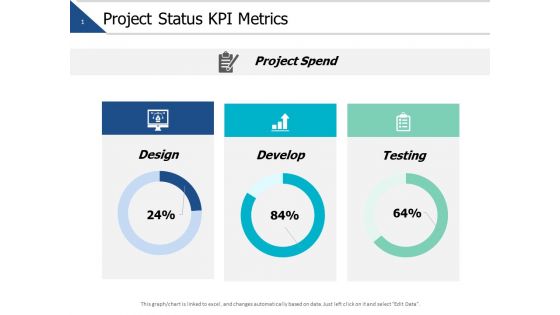
Project Status Kpi Metrics Marketing Ppt PowerPoint Presentation Layouts Skills
This is a project status kpi metrics marketing ppt powerpoint presentation layouts skills. This is a three stage process. The stages in this process are finance, marketing, management, investment, analysis.


 Continue with Email

 Home
Home


