Kpi
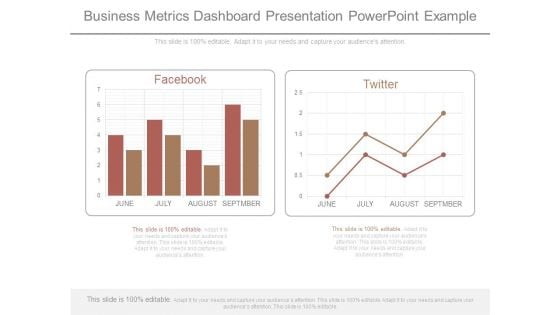
Business Metrics Dashboard Presentation Powerpoint Example
This is a business metrics dashboard presentation powerpoint example. This is a two stage process. The stages in this process are facebook, twitter.
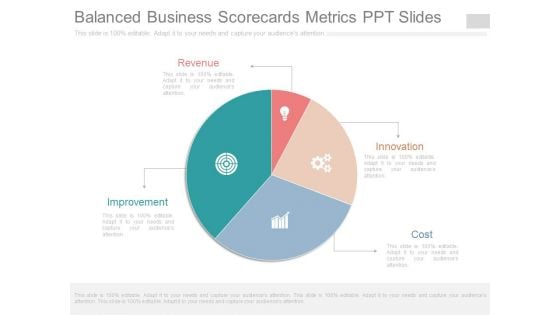
Balanced Business Scorecards Metrics Ppt Slides
This is a balanced business scorecards metrics ppt slides. This is a four stage process. The stages in this process are revenue, improvement, innovation, cost.

Business Development Metrics Sample Diagram Powerpoint Slides
This is a business development metrics sample diagram powerpoint slides. This is a four stage process. The stages in this process are place, price, target market, product, promotion.
Business Software Performance Metric Icon Demonstration PDF
Presenting Business Software Performance Metric Icon Demonstration PDF to dispense important information. This template comprises Three stages. It also presents valuable insights into the topics including Business Software, Performance, Metric Icon. This is a completely customizable PowerPoint theme that can be put to use immediately. So, download it and address the topic impactfully.
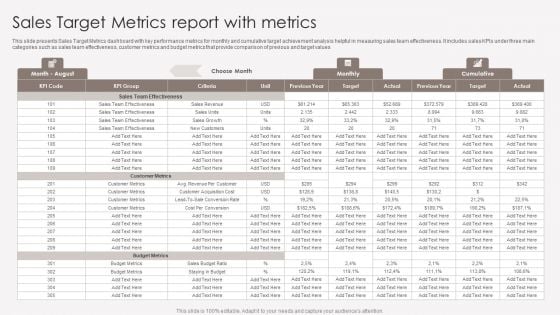
Sales Target Metrics Report With Metrics Introduction PDF
This slide presents Sales Target Metrics dashboard with key performance metrics for monthly and cumulative target achievement analysis helpful in measuring sales team effectiveness. It includes sales KPIs under three main categories such as sales team effectiveness, customer metrics and budget metrics that provide comparison of previous and target values. Pitch your topic with ease and precision using this Sales Target Metrics Report With Metrics Introduction PDF. This layout presents information on Sales Team Effectiveness, Customer Metrics, Budget Metrics. It is also available for immediate download and adjustment. So, changes can be made in the color, design, graphics or any other component to create a unique layout.
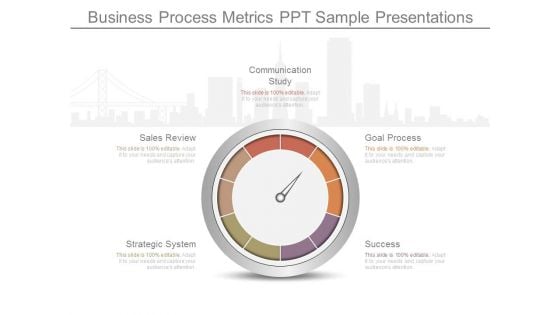
Business Process Metrics Ppt Sample Presentations
This is a business process metrics ppt sample presentations. This is a five stage process. The stages in this process are communication study, goal process, success, strategic system, sales review.
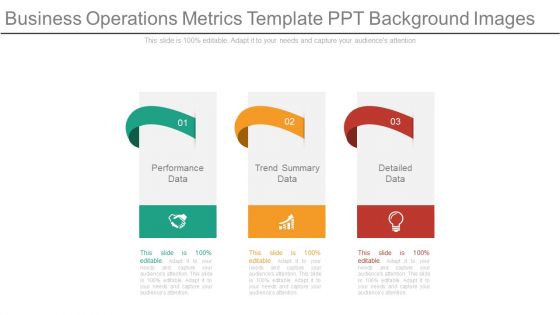
Business Operations Metrics Template Ppt Background Images
This is a business operations metrics template ppt background images. This is a three stage process. The stages in this process are performance data, trend summary data, detailed data.
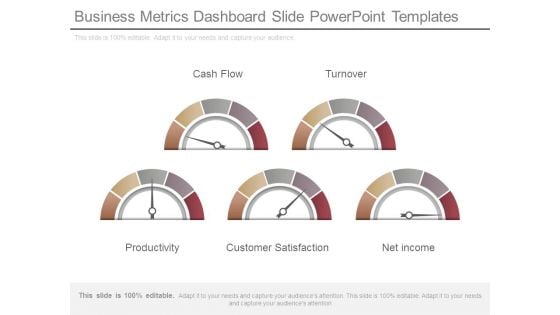
Business Metrics Dashboard Slide Powerpoint Templates
This is a business metrics dashboard slide powerpoint templates. This is a five stage process. The stages in this process are cash flow, turnover, productivity, customer satisfaction, net income.
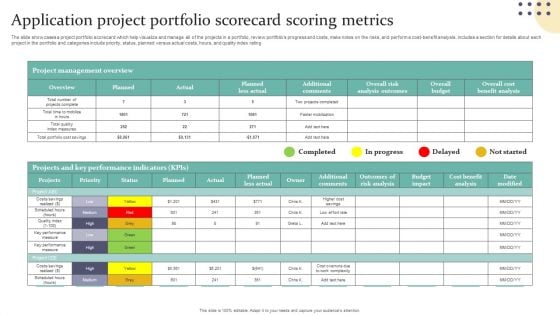
Application Project Portfolio Scorecard Scoring Metrics Information PDF
The slide showcases a project portfolio scorecard which help visualize and manage all of the projects in a portfolio, review portfolios progress and costs, make notes on the risks, and perform a cost-benefit analysis. includes a section for details about each project in the portfolio and categories include priority, status, planned versus actual costs, hours, and quality index rating. Showcasing this set of slides titled Application Project Portfolio Scorecard Scoring Metrics Information PDF. The topics addressed in these templates are Project Management Overview, Projects Key Performance Indicators, Additional Comments. All the content presented in this PPT design is completely editable. Download it and make adjustments in color, background, font etc. as per your unique business setting.
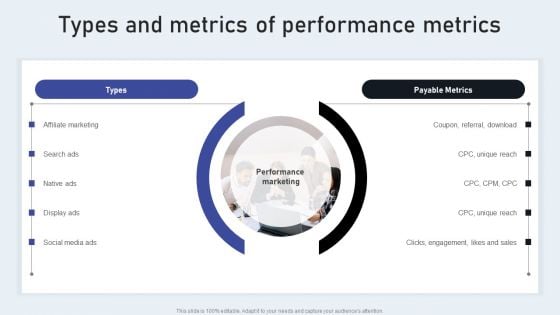
Types And Metrics Of Performance Metrics Portrait PDF
Are you searching for a Types And Metrics Of Performance Metrics Portrait PDF that is uncluttered, straightforward, and original Its easy to edit, and you can change the colors to suit your personal or business branding. For a presentation that expresses how much effort you have put in, this template is ideal With all of its features, including tables, diagrams, statistics, and lists, its perfect for a business plan presentation. Make your ideas more appealing with these professional slides. Download Types And Metrics Of Performance Metrics Portrait PDF from Slidegeeks today.
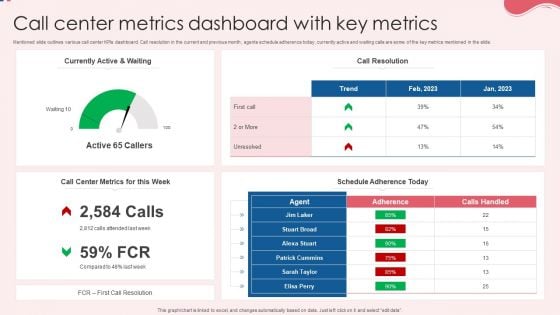
Call Center Metrics Dashboard With Key Metrics Information PDF
Mentioned slide outlines various call center KPIs dashboard. Call resolution in the current and previous month, agents schedule adherence today, currently active and waiting calls are some of the key metrics mentioned in the slide. Showcasing this set of slides titled Call Center Metrics Dashboard With Key Metrics Information PDF. The topics addressed in these templates are Currently Active, Call Resolution, Key Metrics. All the content presented in this PPT design is completely editable. Download it and make adjustments in color, background, font etc. as per your unique business setting.
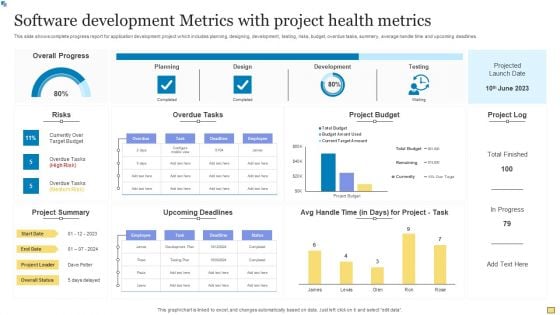
Software Development Metrics With Project Health Metrics Graphics PDF
This slide shows complete progress report for application development project which includes planning, designing, development, testing, risks, budget, overdue tasks, summery, average handle time and upcoming deadlines. Pitch your topic with ease and precision using this Software Development Metrics With Project Health Metrics Graphics PDF. This layout presents information on Overall Progress, Overdue Tasks, Project Budget. It is also available for immediate download and adjustment. So, changes can be made in the color, design, graphics or any other component to create a unique layout.
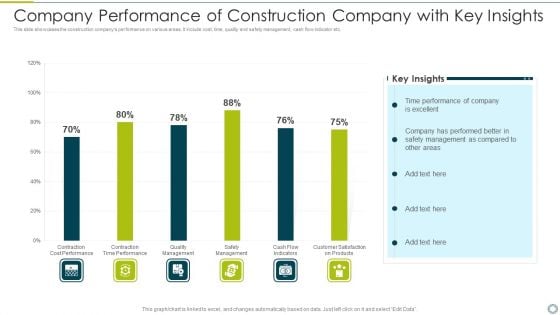
Company Performance Of Construction Company With Key Insights Portrait PDF
This slide showcases the construction companys performance on various areas. It include cost, time, quality and safety management, cash flow indicator etc. Pitch your topic with ease and precision using this company performance of construction company with key insights portrait pdf. This layout presents information on performance, management. It is also available for immediate download and adjustment. So, changes can be made in the color, design, graphics or any other component to create a unique layout.
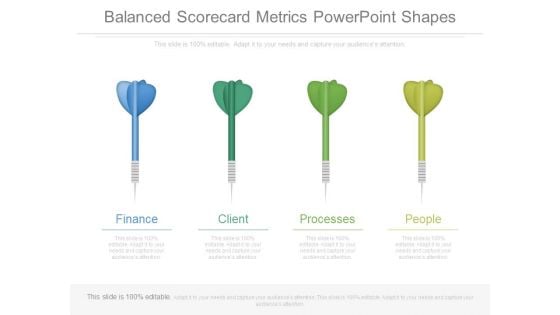
Balanced Scorecard Metrics Powerpoint Shapes
This is a balanced scorecard metrics powerpoint shapes. This is a four stage process. The stages in this process are finance, client, processes, people.
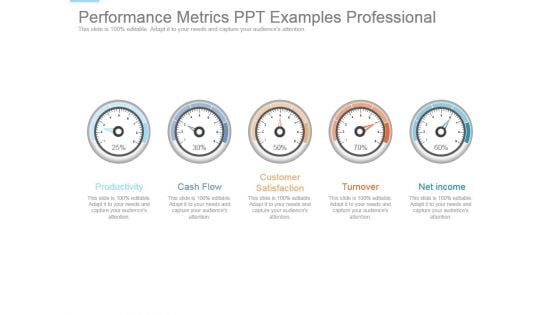
Performance Metrics Ppt Examples Professional
This is a performance metrics ppt examples professional. This is a five stage process. The stages in this process are productivity, cash flow, customer satisfaction, turnover, net income.
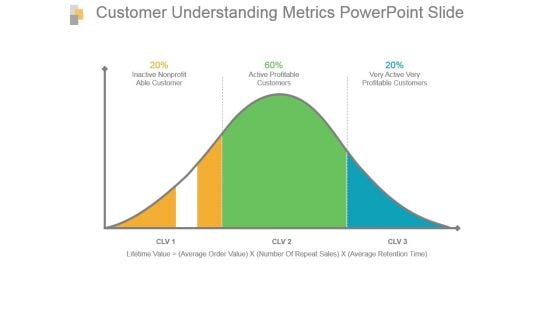
Customer Understanding Metrics Powerpoint Slide
This is a customer understanding metrics powerpoint slide. This is a three stage process. The stages in this process are inactive nonprofit able customer, active profitable customers, very active very profitable customers.
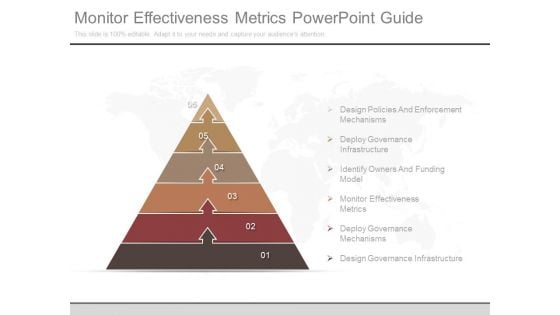
Monitor Effectiveness Metrics Powerpoint Guide
This is a monitor effectiveness metrics powerpoint guide. This is a six stage process. The stages in this process are design policies and enforcement mechanisms, deploy governance infrastructure, identify owners and funding model, monitor effectiveness metrics, deploy governance mechanisms, design governance infrastructure.
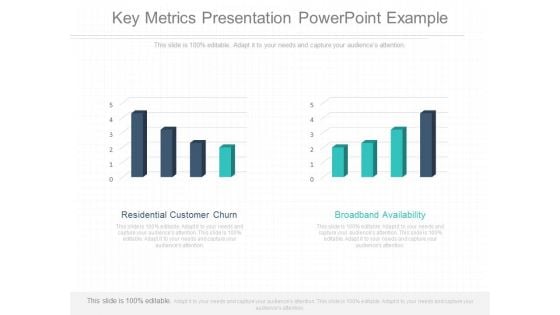
Key Metrics Presentation Powerpoint Example
This is a key metrics presentation powerpoint example. This is a two stage process. The stages in this process are residential customer churn, broadband availability.

Comprehensive Guide To Build Marketing Success Metrics To Measure Influencer Marketing Sample PDF
The following slide showcases different key performance indicators KPIs through which digital marketers can evaluate influencer marketing campaign performance. The key performance indicators outlined in slide are audience reach, impressions, followers growth, click-through rate CTR, revenue, and conversion rate. This modern and well-arranged Comprehensive Guide To Build Marketing Success Metrics To Measure Influencer Marketing Sample PDF provides lots of creative possibilities. It is very simple to customize and edit with the Powerpoint Software. Just drag and drop your pictures into the shapes. All facets of this template can be edited with Powerpoint, no extra software is necessary. Add your own material, put your images in the places assigned for them, adjust the colors, and then you can show your slides to the world, with an animated slide included.
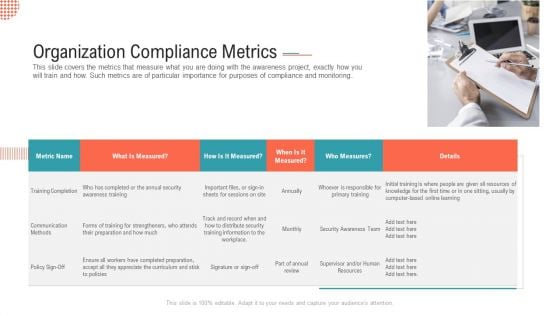
Organization Compliance Metrics Pictures PDF
This slide covers the metrics that measure what you are doing with the awareness project, exactly how you will train and how. Such metrics are of particular importance for purposes of compliance and monitoring.Presenting organization compliance metrics pictures pdf. to provide visual cues and insights. Share and navigate important information on one stage that need your due attention. This template can be used to pitch topics like training completion, communication methods. In addtion, this PPT design contains high resolution images, graphics, etc, that are easily editable and available for immediate download.
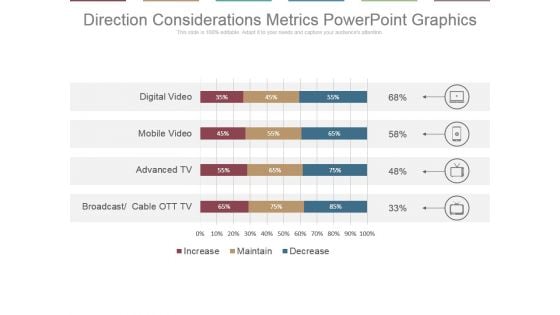
Direction Considerations Metrics Powerpoint Graphics
This is a direction considerations metrics powerpoint graphics. This is a four stage process. The stages in this process are digital video, mobile video, advanced tv, broadcast, cable ott tv.
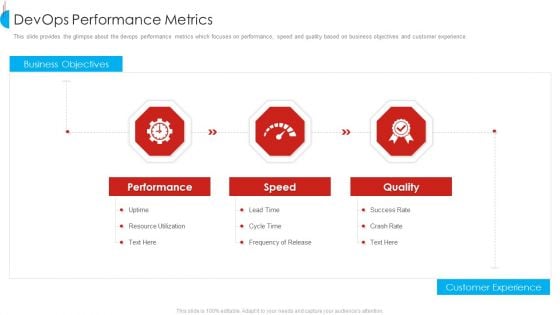
Devops Performance Metrics Themes PDF
This slide provides the glimpse about the devops performance metrics which focuses on performance, speed and quality based on business objectives and customer experience.This is a devops performance metrics themes pdf template with various stages. Focus and dispense information on three stages using this creative set, that comes with editable features. It contains large content boxes to add your information on topics like resource utilization, frequency of release, success rate . You can also showcase facts, figures, and other relevant content using this PPT layout. Grab it now.
Kaizen Process Report With Improvement Metrics Ppt PowerPoint Presentation File Icons PDF
This slide focuses on the kaizen event report which covers process owner, key performance indicators, summary, problem description, improvement metrics, goals, daily milestones, team members and other considerations, etc. Pitch your topic with ease and precision using this Kaizen Process Report With Improvement Metrics Ppt PowerPoint Presentation File Icons PDF. This layout presents information on Key Performance Indoctrinator, Improvement Goal, Improvement Metric. It is also available for immediate download and adjustment. So, changes can be made in the color, design, graphics or any other component to create a unique layout.
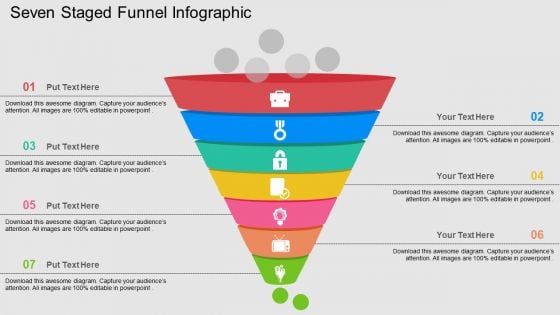
Seven Staged Funnel Infographic Powerpoint Templates
Funnel diagram with icons have been displayed in this business slide. This business diagram slide helps to exhibit sales process. Use this diagram to build an exclusive presentation.
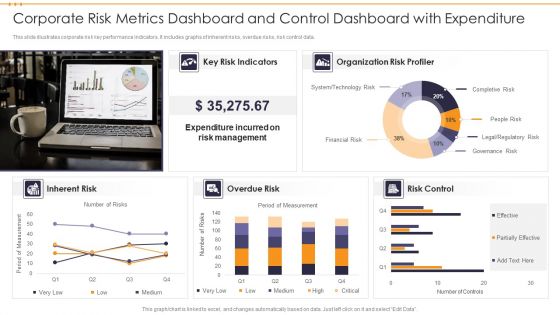
Corporate Risk Metrics Dashboard And Control Dashboard With Expenditure Inspiration PDF
This slide illustrates corporate risk key performance indicators. It includes graphs of inherent risks, overdue risks, risk control data. Showcasing this set of slides titled Corporate Risk Metrics Dashboard And Control Dashboard With Expenditure Inspiration PDF. The topics addressed in these templates are Expenditure, Risk Management, Organization Risk. All the content presented in this PPT design is completely editable. Download it and make adjustments in color, background, font etc. as per your unique business setting.
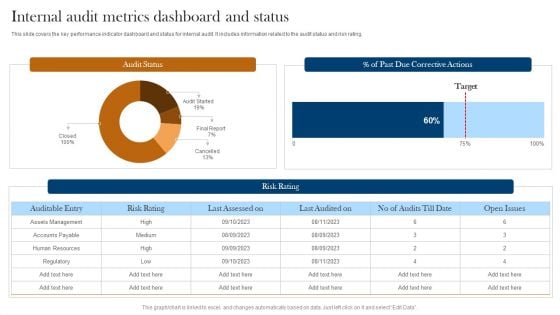
Internal Audit Metrics Dashboard And Status Ppt Layouts Graphic Images PDF
This slide covers the key performance indicator dashboard and status for internal audit. It includes information related to the audit status and risk rating. Pitch your topic with ease and precision using this Internal Audit Metrics Dashboard And Status Ppt Layouts Graphic Images PDF. This layout presents information on Audit Status, Risk Rating, Auditable Entry. It is also available for immediate download and adjustment. So, changes can be made in the color, design, graphics or any other component to create a unique layout.
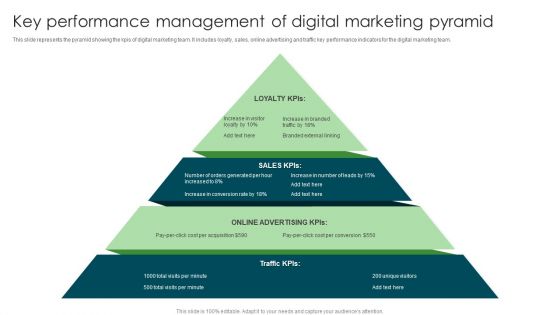
Key Performance Management Of Digital Marketing Pyramid Designs PDF
This slide represents the pyramid showing the kpis of digital marketing team. It includes loyalty, sales, online advertising and traffic key performance indicators for the digital marketing team. Presenting Key Performance Management Of Digital Marketing Pyramid Designs PDF to dispense important information. This template comprises three stages. It also presents valuable insights into the topics including Key Performance Management, Digital Marketing Pyramid. This is a completely customizable PowerPoint theme that can be put to use immediately. So, download it and address the topic impactfully.
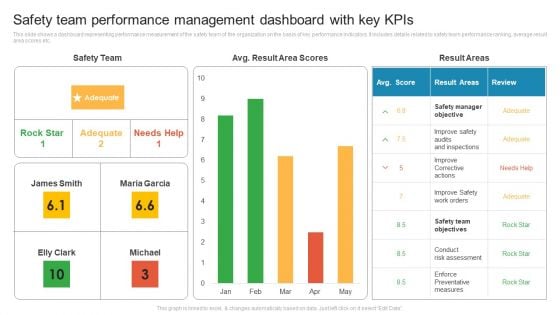
Safety Team Performance Management Dashboard With Key Kpis Rules PDF
This slide shows a dashboard representing performance measurement of the safety team of the organization on the basis of key performance indicators. It includes details related to safety team performance ranking, average result area scores etc. Pitch your topic with ease and precision using this Safety Team Performance Management Dashboard With Key Kpis Rules PDF. This layout presents information on Improve Corrective Actions, Safety Manager Objective, Conduct Risk Assessment. It is also available for immediate download and adjustment. So, changes can be made in the color, design, graphics or any other component to create a unique layout.
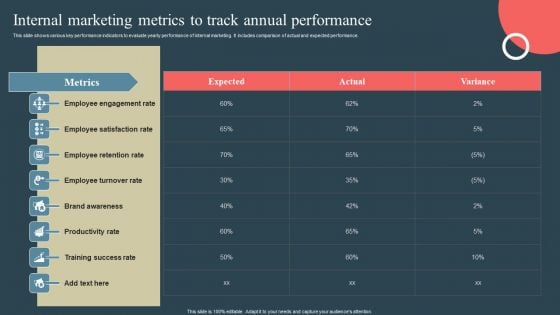
Internal Promotion Strategy To Enhance Brand Awareness Internal Marketing Metrics To Track Annual Brochure PDF
This slide shows various key performance indicators to evaluate yearly performance of internal marketing. It includes comparison of actual and expected performance. If your project calls for a presentation, then Slidegeeks is your go to partner because we have professionally designed, easy to edit templates that are perfect for any presentation. After downloading, you can easily edit Internal Promotion Strategy To Enhance Brand Awareness Internal Marketing Metrics To Track Annual Brochure PDF and make the changes accordingly. You can rearrange slides or fill them with different images. Check out all the handy templates
Executive Dashboards For Tracking Key Performance Icons PDF
This slide represents the dashboard for the CEO to track the companys performance. It includes key performance indicators such as no. of deals, open deals, revenue, expected revenue and win percentage. Showcasing this set of slides titled Executive Dashboards For Tracking Key Performance Icons PDF. The topics addressed in these templates are Pen Deals, Revenue, Expected Revenue. All the content presented in this PPT design is completely editable. Download it and make adjustments in color, background, font etc. as per your unique business setting.
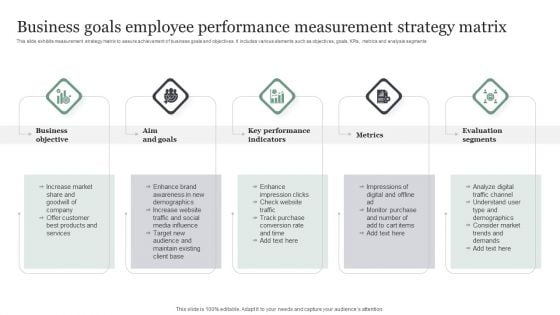
Business Goals Employee Performance Measurement Strategy Matrix Summary PDF
This slide exhibits measurement strategy matrix to assure achievement of business goals and objectives. It includes various elements such as objectives, goals, KPIs, metrics and analysis segments. Presenting Business Goals Employee Performance Measurement Strategy Matrix Summary PDF to dispense important information. This template comprises five stages. It also presents valuable insights into the topics including Key Performance Indicators, Aim And Goals, Business Objective. This is a completely customizable PowerPoint theme that can be put to use immediately. So, download it and address the topic impactfully.
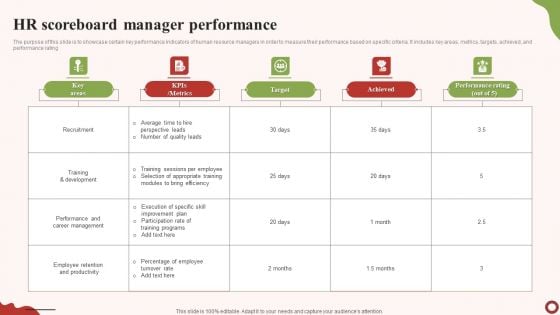
HR Scoreboard Manager Performance Inspiration PDF
The purpose of this slide is to showcase certain key performance indicators of human resource managers in order to measure their performance based on specific criteria. It includes key areas, metrics, targets, achieved, and performance rating. Showcasing this set of slides titled HR Scoreboard Manager Performance Inspiration PDF. The topics addressed in these templates are Target, Achieved, Performance Rating. All the content presented in this PPT design is completely editable. Download it and make adjustments in color, background, font etc. as per your unique business setting.
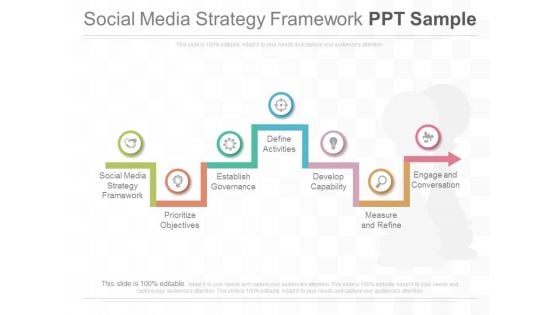
Social Media Strategy Framework Ppt Sample
This is a social media strategy framework ppt sample. This is a seven stage process. The stages in this process are arrows, business, marketing.
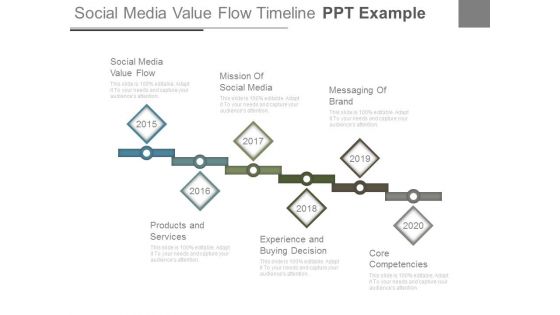
Social Media Value Flow Timeline Ppt Example
This is a social media value flow timeline ppt example. This is a six stage process. The stages in this process are marketing, business, time Planning. \n
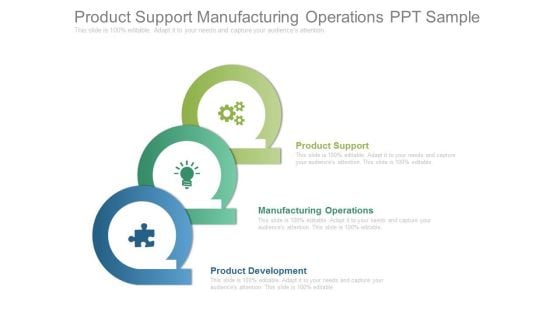
Product Support Manufacturing Operations Ppt Sample
This is a product support manufacturing operations ppt sample. This is a three stage process. The stages in this process are marketing, success, business.
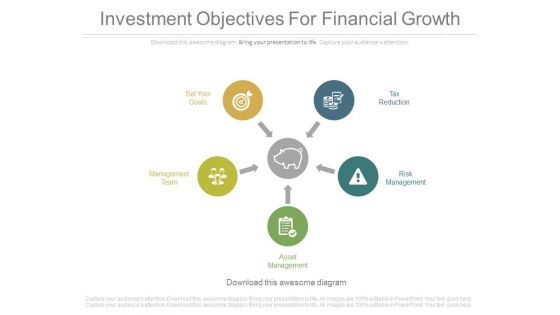
Investment Objectives For Financial Growth Ppt Slides
This is an investment objectives for financial growth ppt slides. This is a five stage process. The stages in this process are marketing, business, success, arrows.
KPIs And Metrics To Measure Pharmaceutical Drug Of Pharmaceutical Company Icons PDF
Mentioned slide showcases various key performance indicators KPIs which can be used to measure the development of pharmaceutical companies in different years. The key metrics are productivity, competency, quality of care and financial. Showcasing this set of slides titled KPIs And Metrics To Measure Pharmaceutical Drug Of Pharmaceutical Company Icons PDF. The topics addressed in these templates are Productivity, Competency, Quality Of Care. All the content presented in this PPT design is completely editable. Download it and make adjustments in color, background, font etc. as per your unique business setting.
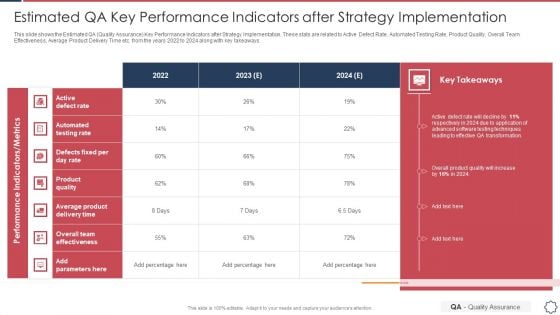
Quality Assurance Transformation Strategies To Improve Business Performance Efficiency Estimated QA Key Performance Topics PDF
This slide shows the Estimated QA Quality Assurance Key Performance Indicators after Strategy Implementation. These stats are related to Active Defect Rate, Automated Testing Rate, Product Quality, Overall Team Effectiveness, Average Product Delivery Time etc. from the years 2022 to 2024 along with key takeaways. Deliver and pitch your topic in the best possible manner with this quality assurance transformation strategies to improve business performance efficiency estimated qa key performance topics pdf. Use them to share invaluable insights on automated testing rate, average product delivery time, active defect rate and impress your audience. This template can be altered and modified as per your expectations. So, grab it now.
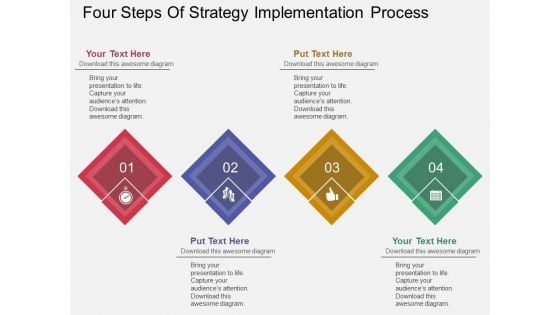
Four Steps Of Strategy Implementation Process Powerpoint Template
Our above business slide contains colorful infographic diagram. Download this template to display four steps of strategy implementation. This diagram provides an effective way of displaying information you can edit text, color, shade and style as per you need.
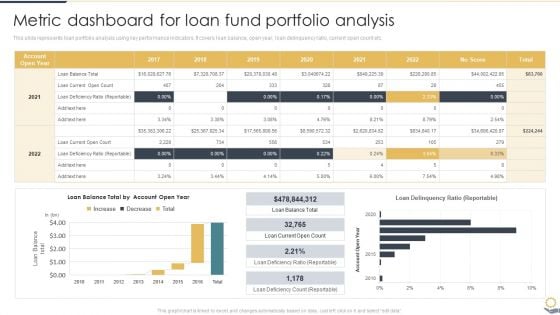
Metric Dashboard For Loan Fund Portfolio Analysis Portfolio Investment Analysis Formats PDF
This slide represents loan portfolio analysis using key performance indicators. It covers loan balance, open year, loan delinquency ratio, current open count etc.From laying roadmaps to briefing everything in detail, our templates are perfect for you. You can set the stage with your presentation slides. All you have to do is download these easy-to-edit and customizable templates. Metric Dashboard For Loan Fund Portfolio Analysis Portfolio Investment Analysis Formats PDF will help you deliver an outstanding performance that everyone would remember and praise you for. Do download this presentation today.
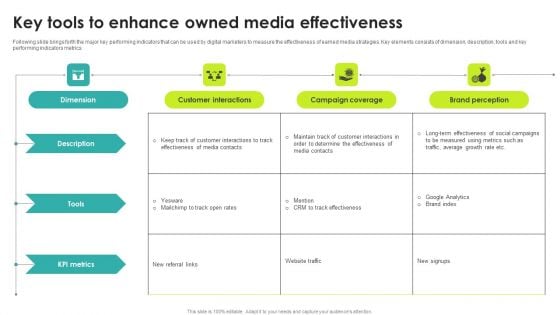
Key Tools To Enhance Owned Media Effectiveness Summary PDF
Following slide brings forth the major key performing indicators that can be used by digital marketers to measure the effectiveness of earned media strategies. Key elements consists of dimension, description, tools and key performing indicators metrics Showcasing this set of slides titled Key Tools To Enhance Owned Media Effectiveness Summary PDF. The topics addressed in these templates are Dimension, Description, Tools . All the content presented in this PPT design is completely editable. Download it and make adjustments in color, background, font etc. as per your unique business setting.
Comparison Metrics Of Digital And Offline Marketing Ppt Icon Format PDF
This slide showcases essential key performance indicators of online and offline marketing. Key metrics covered are spend, lead generated, revenue and customer retention. Persuade your audience using this Comparison Metrics Of Digital And Offline Marketing Ppt Icon Format PDF. This PPT design covers four stages, thus making it a great tool to use. It also caters to a variety of topics including Lead Generated, Revenue, Customer Retention, Spend. Download this PPT design now to present a convincing pitch that not only emphasizes the topic but also showcases your presentation skills.
Types Of Corporate Communication Techniques Evaluation For Stakeholders Communication Success Indicators Icons PDF
This template covers the stakeholders engagement success measurement key performance indicators including stakeholders type , evaluation areas, methods, sources of information and long term or short term success. Deliver and pitch your topic in the best possible manner with this Types Of Corporate Communication Techniques Evaluation For Stakeholders Communication Success Indicators Icons PDF. Use them to share invaluable insights on Evaluation Area, Method, Sources and impress your audience. This template can be altered and modified as per your expectations. So, grab it now.
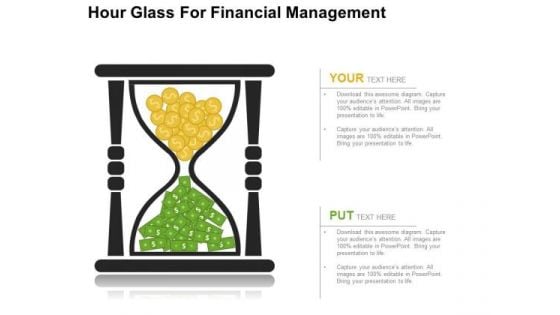
Hour Glass For Financial Management PowerPoint Templates
Create dynamic presentations with this professional slide containing a graphic of hour glass with dollar currency notes and coins. This template is designed to portray the concepts of financial management. Add this slide in your presentations to visually support your content
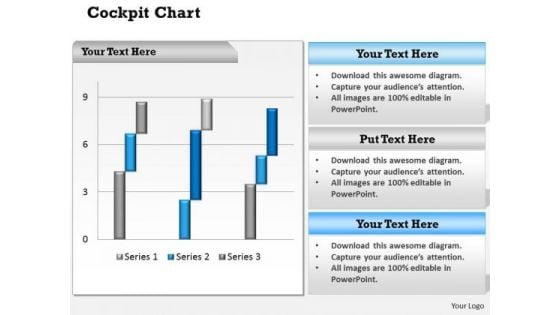
Business Cycle Diagram Dashboard Design Business Metrics Marketing Diagram
Analyze Ailments On Our Business Cycle Diagram Dashboard Design Business Metrics Marketing Diagram Powerpoint Templates. Bring Out The Thinking Doctor In You. Dock Your Thoughts With Our Business Cycle Diagram Dashboard Design Business Metrics Marketing Diagram Powerpoint Templates. They Will Launch Them Into Orbit.
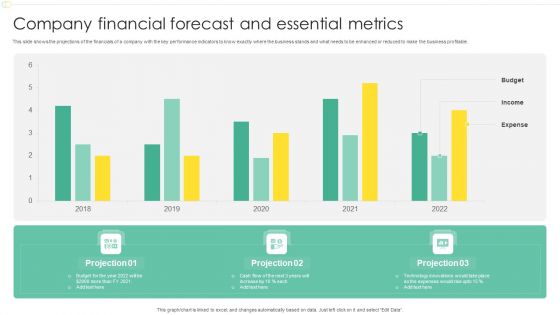
Company Financial Forecast And Essential Metrics Ppt Model Design Templates PDF
This slide shows the projections of the financials of a company with the key performance indicators to know exactly where the business stands and what needs to be enhanced or reduced to make the business profitable. Showcasing this set of slides titled Company Financial Forecast And Essential Metrics Ppt Model Design Templates PDF. The topics addressed in these templates are Budget, Income, Expense, 2018 To 2022. All the content presented in this PPT design is completely editable. Download it and make adjustments in color, background, font etc. as per your unique business setting.
Education Metrics Dashboard For Tracking Student Ethnicity And Specially Abled Characteristics Brochure PDF
This slide covers the education key performance indicator tracker. It include metrics such as total applications, conversion rate, offers year to date, applications by ethnicity and disabilities, etc. Showcasing this set of slides titled Education Metrics Dashboard For Tracking Student Ethnicity And Specially Abled Characteristics Brochure PDF. The topics addressed in these templates are Total Applications, Conversion Rate 2022, Ethnicity. All the content presented in this PPT design is completely editable. Download it and make adjustments in color, background, font etc. as per your unique business setting.
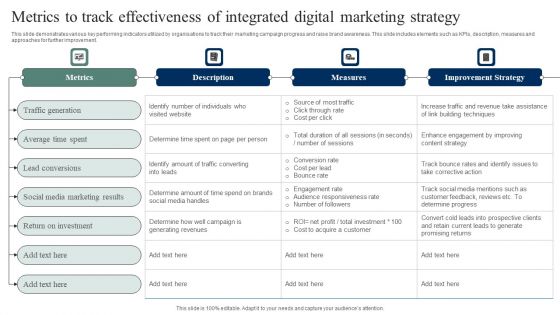
Metrics To Track Effectiveness Of Integrated Digital Marketing Strategy Inspiration PDF
This slide demonstrates various key performing indicators utilized by organisations to track their marketing campaign progress and raise brand awareness. This slide includes elements such as KPIs, description, measures and approaches for further improvement. Showcasing this set of slides titled Metrics To Track Effectiveness Of Integrated Digital Marketing Strategy Inspiration PDF. The topics addressed in these templates are Metrics, Description, Measures. All the content presented in this PPT design is completely editable. Download it and make adjustments in color, background, font etc. as per your unique business setting.
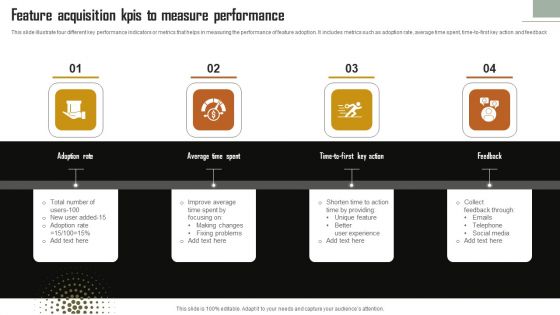
Feature Acquisition Kpis To Measure Performance Themes PDF
This slide illustrate four different key performance indicators or metrics that helps in measuring the performance of feature adoption. It includes metrics such as adoption rate, average time spent, time-to-first key action and feedback. Persuade your audience using this Feature Acquisition Kpis To Measure Performance Themes PDF. This PPT design covers four stages, thus making it a great tool to use. It also caters to a variety of topics including Adoption Rate, Average Time Spent, Feedback. Download this PPT design now to present a convincing pitch that not only emphasizes the topic but also showcases your presentation skills.
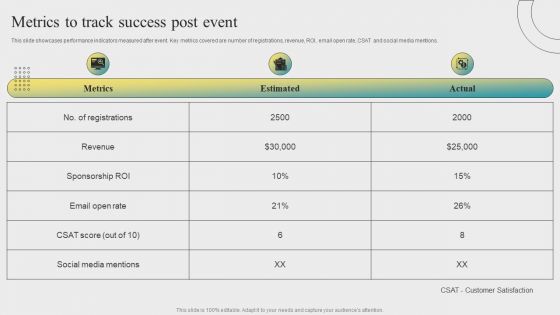
Post Event Activities Metrics To Track Success Post Event Mockup PDF
This slide showcases performance indicators measured after event. Key metrics covered are number of registrations, revenue, ROI, email open rate, CSAT and social media mentions. Slidegeeks is one of the best resources for PowerPoint templates. You can download easily and regulate Post Event Activities Metrics To Track Success Post Event Mockup PDF for your personal presentations from our wonderful collection. A few clicks is all it takes to discover and get the most relevant and appropriate templates. Use our Templates to add a unique zing and appeal to your presentation and meetings. All the slides are easy to edit and you can use them even for advertisement purposes.
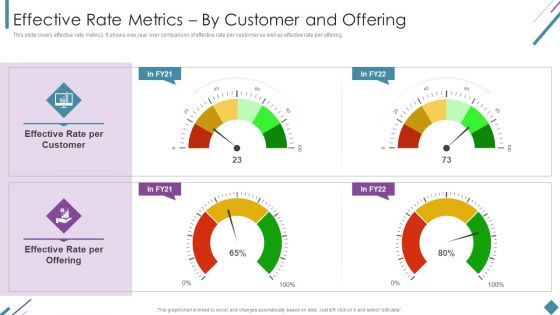
Metrics To Measure Business Performance Effective Rate Metrics By Customer And Offering Diagrams PDF
This slide covers effective rate metrics. It shows over year over comparison of effective rate per customer as well as effective rate per offering. Deliver and pitch your topic in the best possible manner with this Metrics To Measure Business Performance Effective Rate Metrics By Customer And Offering Diagrams PDF. Use them to share invaluable insights on Effective Rate, Per Customer, Per Offering and impress your audience. This template can be altered and modified as per your expectations. So, grab it now.
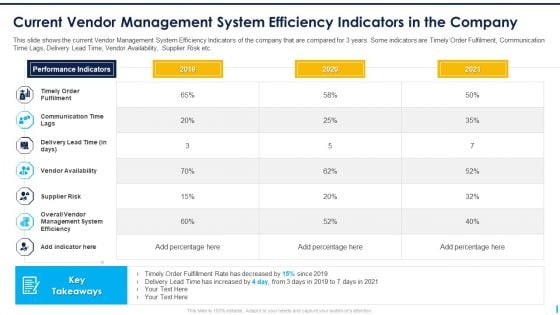
Current Vendor Management System Efficiency Indicators In The Company Microsoft PDF
This slide shows the current Vendor Management System Efficiency Indicators of the company that are compared for 3 years. Some indicators are Timely Order Fulfilment, Communication Time Lags, Delivery Lead Time, Vendor Availability, Supplier Risk etc. Deliver an awe-inspiring pitch with this creative current vendor management system efficiency indicators in the company microsoft pdf bundle. Topics like performance indicators, key takeaways can be discussed with this completely editable template. It is available for immediate download depending on the needs and requirements of the user.
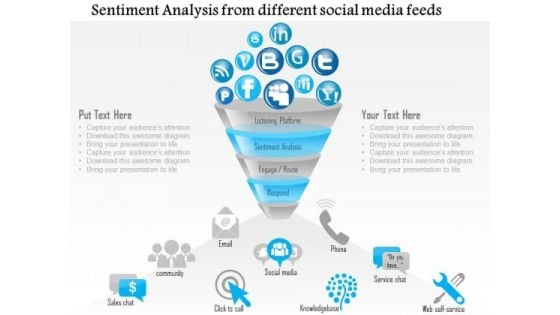
Business Diagram Sentiment Analysis From Different Social Media Feeds Ppt Slide
This diagram has been designed with graphic of funnel diagram displaying multiple icons of social media. These icons may be used to display social media sentiment analysis. Use this diagram slide for social media related presentations.
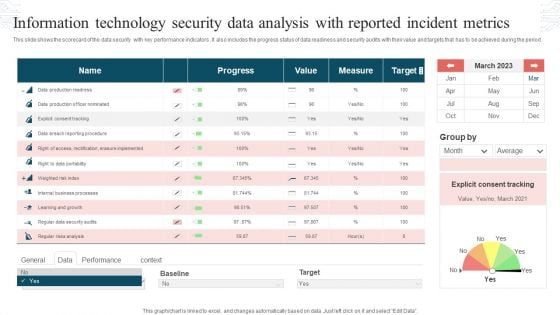
Information Technology Security Data Analysis With Reported Incident Metrics Rules PDF
This slide shows the scorecard of the data security with key performance indicators. It also includes the progress status of data readiness and security audits with their value and targets that has to be achieved during the period. Pitch your topic with ease and precision using this Information Technology Security Data Analysis With Reported Incident Metrics Rules PDF. This layout presents information on Progress, Value, Measure, Target. It is also available for immediate download and adjustment. So, changes can be made in the color, design, graphics or any other component to create a unique layout.
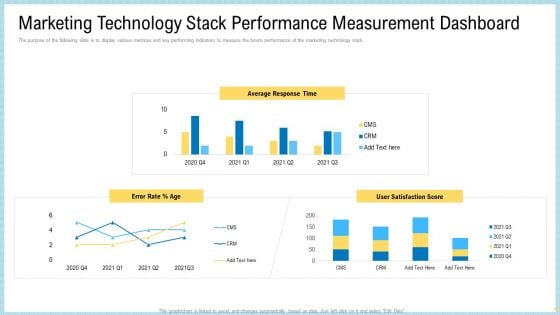
Marketing Technology Stack Performance Measurement Dashboard Demonstration PDF
The purpose of the following slide is to display various metrices and key performing indicators to measure the future performance of the marketing technology stack. Deliver and pitch your topic in the best possible manner with this marketing technology stack performance measurement dashboard demonstration pdf. Use them to share invaluable insights on average response time, user satisfaction score, error rate and impress your audience. This template can be altered and modified as per your expectations. So, grab it now.
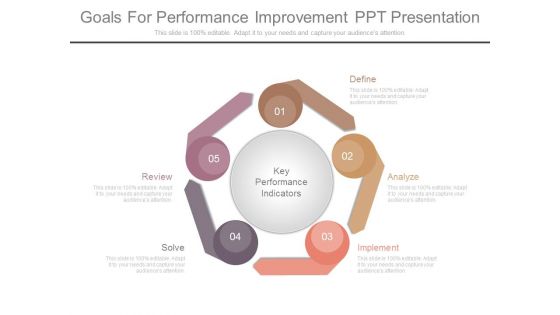
Goals For Performance Improvement Ppt Presentation
This is a goals for performance improvement ppt presentation. This is a five stage process. The stages in this process are key performance indicators, define, analyze, implement, solve, review.
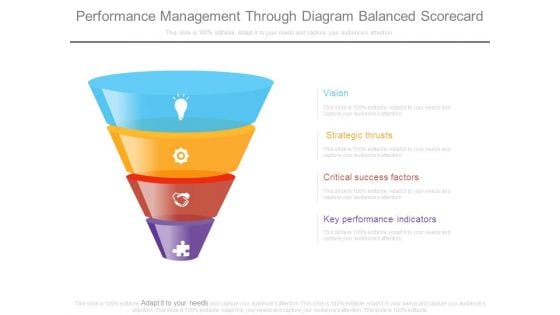
Performance Management Through Diagram Balanced Scorecard
This is a performance management through diagram balanced scorecard. This is a four stage process. The stages in this process are vision, strategic thrusts, critical success factors, key performance indicators.
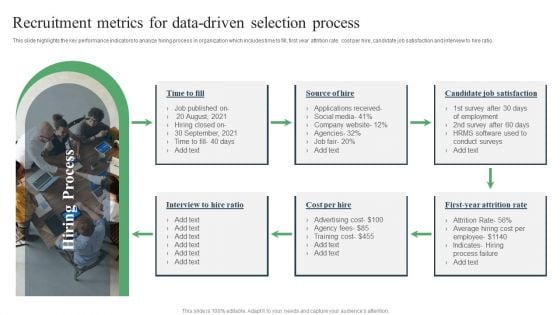
Recruitment Metrics For Data Driven Selection Process Ppt PowerPoint Presentation Inspiration Graphics Download PDF
This slide highlights the key performance indicators to analyze hiring process in organization which includes time to fill, first year attrition rate, cost per hire, candidate job satisfaction and interview to hire ratio. Persuade your audience using this Recruitment Metrics For Data-Driven Selection Process Ppt PowerPoint Presentation Inspiration Graphics Download PDF. This PPT design covers one stage, thus making it a great tool to use. It also caters to a variety of topics including Candidate Job, Satisfaction, Attrition Rate. Download this PPT design now to present a convincing pitch that not only emphasizes the topic but also showcases your presentation skills.
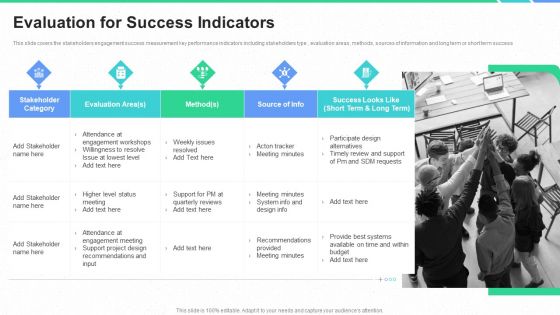
Stakeholders Participation Project Development Process Evaluation For Success Indicators Diagrams PDF
This slide covers the stakeholders engagement success measurement key performance indicators including stakeholders type , evaluation areas, methods, sources of information and long term or short term success. This is a stakeholders participation project development process evaluation for success indicators diagrams pdf template with various stages. Focus and dispense information on one stage using this creative set, that comes with editable features. It contains large content boxes to add your information on topics like stakeholder category, provide best systems available on time and within budget, support project design recommendations and input, meeting minutes. You can also showcase facts, figures, and other relevant content using this PPT layout. Grab it now.
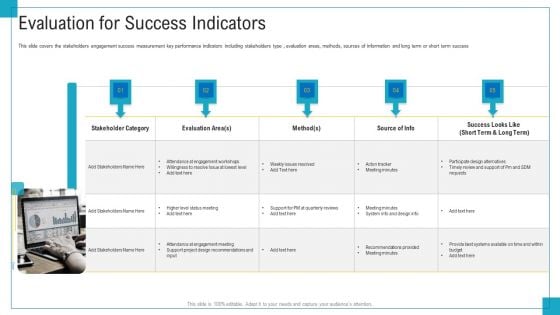
Program And PME Evaluation For Success Indicators Ppt Infographics Slide Download PDF
This slide covers the stakeholders engagement success measurement key performance indicators including stakeholders type , evaluation areas, methods, sources of information and long term or short term success. This is a program and PME evaluation for success indicators ppt infographics slide download pdf template with various stages. Focus and dispense information on five stages using this creative set, that comes with editable features. It contains large content boxes to add your information on topics like stakeholder category, provide best systems available on time and within budget, attendance at engagement workshops. You can also showcase facts, figures, and other relevant content using this PPT layout. Grab it now.


 Continue with Email

 Home
Home


