Kpi
Data Record Quality Enhancement Metrics Icon Rules PDF
Presenting Data Record Quality Enhancement Metrics Icon Rules PDF to dispense important information. This template comprises Four stages. It also presents valuable insights into the topics including Data Record Quality, Enhancement Metrics. This is a completely customizable PowerPoint theme that can be put to use immediately. So, download it and address the topic impactfully.
Sales Target Metrics Tracking Board Icon Professional PDF
Presenting Sales Target Metrics Tracking Board Icon Professional PDF to dispense important information. This template comprises four stages. It also presents valuable insights into the topics including Sales Target Metrics, Tracking Board Icon. This is a completely customizable PowerPoint theme that can be put to use immediately. So, download it and address the topic impactfully.
Lead Tracking Dashboard Icon With Key Metrics Clipart PDF
Persuade your audience using this Lead Tracking Dashboard Icon With Key Metrics Clipart PDF. This PPT design covers three stages, thus making it a great tool to use. It also caters to a variety of topics including Lead Tracking, Dashboard, Key Metrics. Download this PPT design now to present a convincing pitch that not only emphasizes the topic but also showcases your presentation skills.
Monthly Budget And Financial Metrics Report Icon Brochure PDF
Persuade your audience using this Monthly Budget And Financial Metrics Report Icon Brochure PDF. This PPT design covers three stages, thus making it a great tool to use. It also caters to a variety of topics including Monthly Budget, Financial Metrics, Report. Download this PPT design now to present a convincing pitch that not only emphasizes the topic but also showcases your presentation skills.
Human Resource Metrics Icon With Bar Chart Elements PDF
Presenting Human Resource Metrics Icon With Bar Chart Elements PDF to dispense important information. This template comprises three stages. It also presents valuable insights into the topics including Human Resource Metrics Icon, Bar Chart. This is a completely customizable PowerPoint theme that can be put to use immediately. So, download it and address the topic impactfully.
Human Resource Performance Icon With Metrics Formats PDF
Presenting Human Resource Performance Icon With Metrics Formats PDF to dispense important information. This template comprises three stages. It also presents valuable insights into the topics including Human Resource, Performance Icon Metrics. This is a completely customizable PowerPoint theme that can be put to use immediately. So, download it and address the topic impactfully.
Metrics Icon To Track Boosting Brand Image Summary PDF
Presenting Metrics Icon To Track Boosting Brand Image Summary PDF to dispense important information. This template comprises four stages. It also presents valuable insights into the topics including Metrics Icon Track, Boosting Brand Image. This is a completely customizable PowerPoint theme that can be put to use immediately. So, download it and address the topic impactfully.
Icon Showcasing Metric To Measure Workforce Diversity Elements PDF

Sales Target Metrics Ppt PowerPoint Presentation Complete Deck With Slides
Share a great deal of information on the topic by deploying this Sales Target Metrics Ppt PowerPoint Presentation Complete Deck With Slides. Support your ideas and thought process with this prefabricated set. It includes a set of sixteen slides, all fully modifiable and editable. Each slide can be restructured and induced with the information and content of your choice. You can add or remove large content boxes as well, to make this PPT slideshow more personalized. Its high-quality graphics and visuals help in presenting a well-coordinated pitch. This PPT template is also a resourceful tool to take visual cues from and implement the best ideas to help your business grow and expand. The main attraction of this well-formulated deck is that everything is editable, giving you the freedom to adjust it to your liking and choice. Changes can be made in the background and theme as well to deliver an outstanding pitch. Therefore, click on the download button now to gain full access to this multifunctional set.
Customer Service Metrics Ppt PowerPoint Presentation Complete With Slides
This Customer Service Metrics Ppt PowerPoint Presentation Complete With Slides acts as backup support for your ideas, vision, thoughts, etc. Use it to present a thorough understanding of the topic. This PPT slideshow can be utilized for both in-house and outside presentations depending upon your needs and business demands. Entailing eighteen slides with a consistent design and theme, this template will make a solid use case. As it is intuitively designed, it suits every business vertical and industry. All you have to do is make a few tweaks in the content or any other component to design unique presentations. The biggest advantage of this complete deck is that it can be personalized multiple times once downloaded. The color, design, shapes, and other elements are free to modify to add personal touches. You can also insert your logo design in this PPT layout. Therefore a well-thought and crafted presentation can be delivered with ease and precision by downloading this Customer Service Metrics Ppt PowerPoint Presentation Complete With Slides PPT slideshow.

Software Performance Metrics Ppt PowerPoint Presentation Complete Deck With Slides
This Software Performance Metrics Ppt PowerPoint Presentation Complete Deck With Slidesacts as backup support for your ideas, vision, thoughts, etc. Use it to present a thorough understanding of the topic. This PPT slideshow can be utilized for both in house and outside presentations depending upon your needs and business demands. Entailing Twelve slides with a consistent design and theme, this template will make a solid use case. As it is intuitively designed, it suits every business vertical and industry. All you have to do is make a few tweaks in the content or any other component to design unique presentations. The biggest advantage of this complete deck is that it can be personalized multiple times once downloaded. The color, design, shapes, and other elements are free to modify to add personal touches. You can also insert your logo design in this PPT layout. Therefore a well thought and crafted presentation can be delivered with ease and precision by downloading this Software Performance Metrics Ppt PowerPoint Presentation Complete Deck With Slides PPT slideshow.
Software Development Metrics Ppt PowerPoint Presentation Complete Deck With Slides
This Software Development Metrics Ppt PowerPoint Presentation Complete Deck With Slides acts as backup support for your ideas, vision, thoughts, etc. Use it to present a thorough understanding of the topic. This PPT slideshow can be utilized for both in-house and outside presentations depending upon your needs and business demands. Entailing twelve slides with a consistent design and theme, this template will make a solid use case. As it is intuitively designed, it suits every business vertical and industry. All you have to do is make a few tweaks in the content or any other component to design unique presentations. The biggest advantage of this complete deck is that it can be personalized multiple times once downloaded. The color, design, shapes, and other elements are free to modify to add personal touches. You can also insert your logo design in this PPT layout. Therefore a well-thought and crafted presentation can be delivered with ease and precision by downloading this Software Development Metrics Ppt PowerPoint Presentation Complete Deck With Slides PPT slideshow.

Systems Metrics Ppt PowerPoint Presentation Complete Deck With Slides
This Systems Metrics Ppt PowerPoint Presentation Complete Deck With Slides acts as backup support for your ideas, vision, thoughts, etc. Use it to present a thorough understanding of the topic. This PPT slideshow can be utilized for both in-house and outside presentations depending upon your needs and business demands. Entailing seventeen slides with a consistent design and theme, this template will make a solid use case. As it is intuitively designed, it suits every business vertical and industry. All you have to do is make a few tweaks in the content or any other component to design unique presentations. The biggest advantage of this complete deck is that it can be personalized multiple times once downloaded. The color, design, shapes, and other elements are free to modify to add personal touches. You can also insert your logo design in this PPT layout. Therefore a well-thought and crafted presentation can be delivered with ease and precision by downloading this Systems Metrics Ppt PowerPoint Presentation Complete Deck With Slides PPT slideshow.
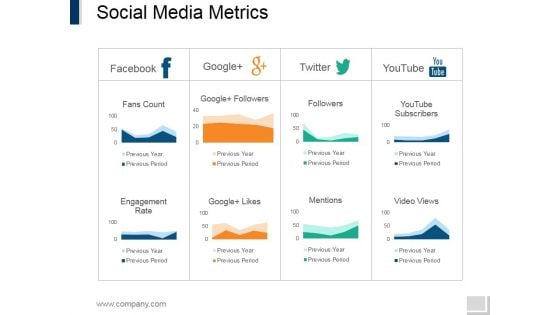
Social Media Metrics Ppt PowerPoint Presentation File Design Inspiration
This is a social media metrics ppt powerpoint presentation file design inspiration. This is a four stage process. The stages in this process are facebook, google, twitter, youtube.
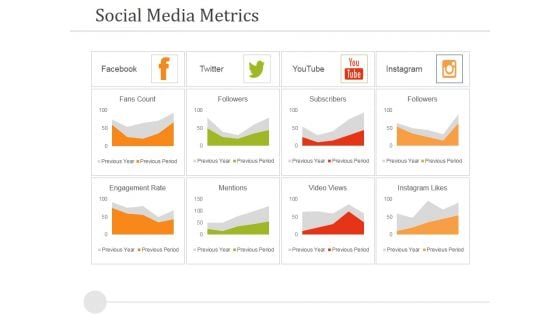
Social Media Metrics Ppt PowerPoint Presentation Layouts Designs Download
This is a social media metrics ppt powerpoint presentation layouts designs download. This is a eight stage process. The stages in this process are facebook, twitter, youtube, instagram.
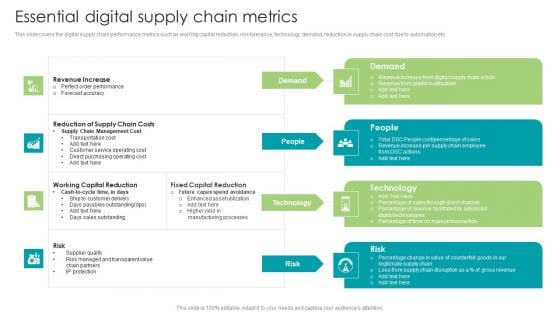
Robotic Process Automation Essential Digital Supply Chain Metrics Diagrams PDF
This slide covers the digital supply chain performance metrics such as working capital reduction, risk tolerance, technology, demand, reduction in supply chain cost due to automation etc. Explore a selection of the finest Robotic Process Automation Essential Digital Supply Chain Metrics Diagrams PDF here. With a plethora of professionally designed and pre-made slide templates, you can quickly and easily find the right one for your upcoming presentation. You can use our Robotic Process Automation Essential Digital Supply Chain Metrics Diagrams PDF to effectively convey your message to a wider audience. Slidegeeks has done a lot of research before preparing these presentation templates. The content can be personalized and the slides are highly editable. Grab templates today from Slidegeeks.
Key Kpis To Measure Sustainability At Organization Icons PDF
This slide highlights various performance indicators to measure sustainability performance at workplace to monitor and track practices. It includes key components such as environmental KPIs, social KPIs and economic KPIs. Presenting Key Kpis To Measure Sustainability At Organization Icons PDF to dispense important information. This template comprises three stages. It also presents valuable insights into the topics including Environmental, Social, Economic. This is a completely customizable PowerPoint theme that can be put to use immediately. So, download it and address the topic impactfully.
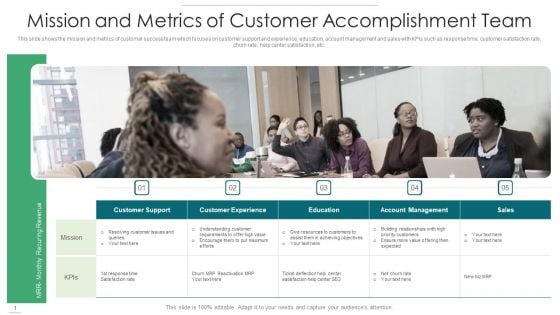
Mission And Metrics Of Customer Accomplishment Team Demonstration PDF
This slide shows the mission and metrics of customer success team which focuses on customer support and experience, education, account management and sales with KPIs such as response time, customer satisfaction rate, churn rate, help center satisfaction, etc. Presenting mission and metrics of customer accomplishment team demonstration pdf to dispense important information. This template comprises five stages. It also presents valuable insights into the topics including customer support, customer experience, education, account management, sales. This is a completely customizable PowerPoint theme that can be put to use immediately. So, download it and address the topic impactfully.
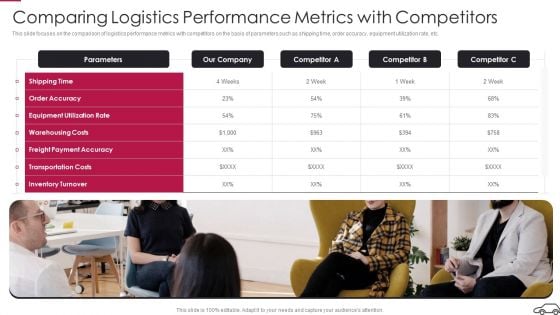
Comparing Logistics Performance Metrics With Competitors Topics PDF
This slide focuses on the comparison of logistics performance metrics with competitors on the basis of parameters such as shipping time, order accuracy, equipment utilization rate, etc.Presenting Comparing Logistics Performance Metrics With Competitors Topics PDF to provide visual cues and insights. Share and navigate important information on one stage that need your due attention. This template can be used to pitch topics like Equipment Utilization, Warehousing Costs, Transportation Costs In addtion, this PPT design contains high resolution images, graphics, etc, that are easily editable and available for immediate download.
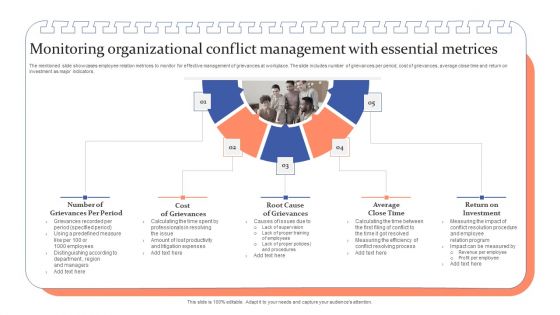
Monitoring Organizational Conflict Management With Essential Metrices Ppt Designs PDF
The mentioned slide showcases employee relation metrices to monitor for effective management of grievances at workplace. The slide includes number of grievances per period, cost of grievances, average close time and return on investment as major indicators. Persuade your audience using this Monitoring Organizational Conflict Management With Essential Metrices Ppt Designs PDF. This PPT design covers five stages, thus making it a great tool to use. It also caters to a variety of topics including Average Close Time, Return Investment, Cost Grievances. Download this PPT design now to present a convincing pitch that not only emphasizes the topic but also showcases your presentation skills.
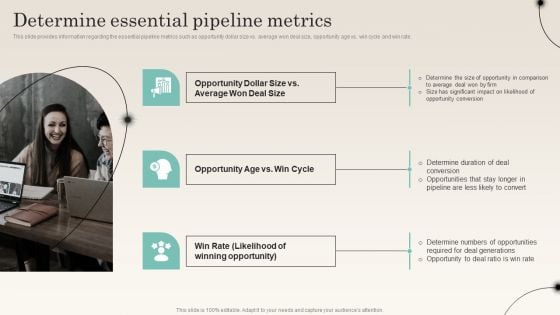
Determine Essential Pipeline Metrics Improving Distribution Channel Introduction PDF
This slide provides information regarding the essential pipeline metrics such as opportunity dollar size vs. average won deal size, opportunity age vs. win cycle and win rate. This is a Determine Essential Pipeline Metrics Improving Distribution Channel Introduction PDF template with various stages. Focus and dispense information on two stages using this creative set, that comes with editable features. It contains large content boxes to add your information on topics like Determine Duration, Winning Opportunity, Determine Duration. You can also showcase facts, figures, and other relevant content using this PPT layout. Grab it now.
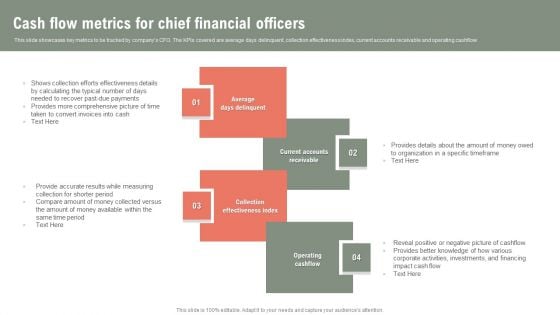
Cash Flow Metrics For Chief Financial Officers Ppt Sample PDF
This slide showcases key metrics to be tracked by companys CFO. The KPIs covered are average days delinquent, collection effectiveness index, current accounts receivable and operating cashflow. Presenting Cash Flow Metrics For Chief Financial Officers Ppt Sample PDF to dispense important information. This template comprises four stages. It also presents valuable insights into the topics including Average Days Delinquent, Current Accounts Receivable, Collection Effectiveness Index. This is a completely customizable PowerPoint theme that can be put to use immediately. So, download it and address the topic impactfully.
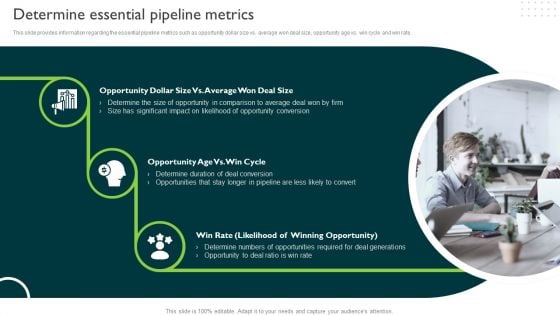
Determine Essential Pipeline Metrics Managing Sales Pipeline Health Themes PDF
This slide provides information regarding the essential pipeline metrics such as opportunity dollar size vs average won deal size, opportunity age vs. win cycle and win rate. Slidegeeks is one of the best resources for PowerPoint templates. You can download easily and regulate Determine Essential Pipeline Metrics Managing Sales Pipeline Health Themes PDF for your personal presentations from our wonderful collection. A few clicks is all it takes to discover and get the most relevant and appropriate templates. Use our Templates to add a unique zing and appeal to your presentation and meetings. All the slides are easy to edit and you can use them even for advertisement purposes.

Weekly Sales Performance Metrics To Help Measure Success Ideas PDF
The following slide exhibits sales metrics to help measure success and translate data into action. It presents information related to deals won, activities completed, etc. Persuade your audience using this Weekly Sales Performance Metrics To Help Measure Success Ideas PDF. This PPT design covers four stages, thus making it a great tool to use. It also caters to a variety of topics including Completed Activities, Per User, New Deals Added, Deals Won, Deals Lost. Download this PPT design now to present a convincing pitch that not only emphasizes the topic but also showcases your presentation skills.
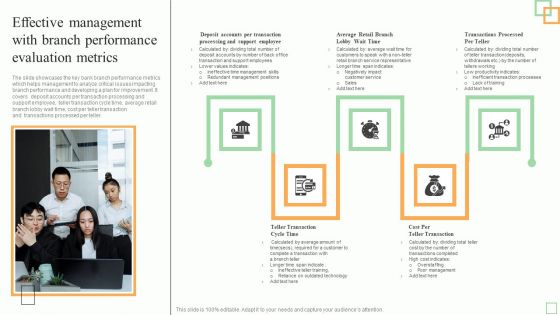
Effective Management With Branch Performance Evaluation Metrics Information PDF
The slide showcases the key bank branch performance metrics which helps management to analyze critical issues impacting branch performance and developing a plan for improvement. It covers deposit accounts per transaction processing and support employee, teller transaction cycle time, average retail branch lobby wait time, cost per teller transaction and transactions processed per teller.Presenting Effective Management With Branch Performance Evaluation Metrics Information PDF to dispense important information. This template comprises five stages. It also presents valuable insights into the topics including Support Employee, Complete Transaction, Outdated Technology. This is a completely customizable PowerPoint theme that can be put to use immediately. So, download it and address the topic impactfully.
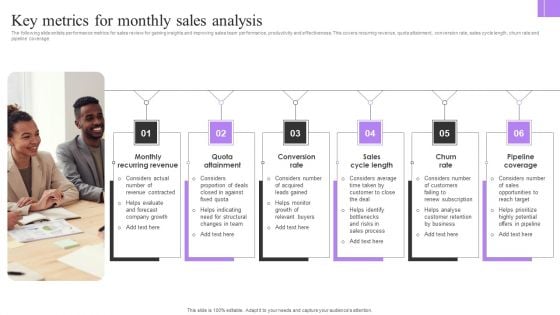
Key Metrics For Monthly Sales Analysis Mockup PDF
The following slide enlists performance metrics for sales review for gaining insights and improving sales team performance, productivity and effectiveness. This covers recurring revenue, quota attainment, conversion rate, sales cycle length, churn rate and pipeline coverage. Presenting Key Metrics For Monthly Sales Analysis Mockup PDF to dispense important information. This template comprises six stages. It also presents valuable insights into the topics including Monthly Recurring Revenue, Quota Attainment, Conversion Rate . This is a completely customizable PowerPoint theme that can be put to use immediately. So, download it and address the topic impactfully.
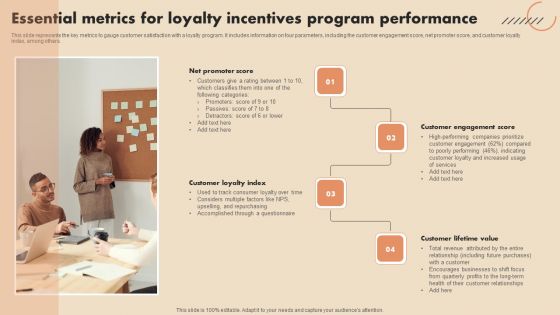
Essential Metrics For Loyalty Incentives Program Performance Microsoft PDF
This slide represents the key metrics to gauge customer satisfaction with a loyalty program. It includes information on four parameters, including the customer engagement score, net promoter score, and customer loyalty index, among others.Persuade your audience using this Essential Metrics For Loyalty Incentives Program Performance Microsoft PDF. This PPT design covers four stages, thus making it a great tool to use. It also caters to a variety of topics including Net Promoter Score, Customer Engagement Score. Download this PPT design now to present a convincing pitch that not only emphasizes the topic but also showcases your presentation skills.
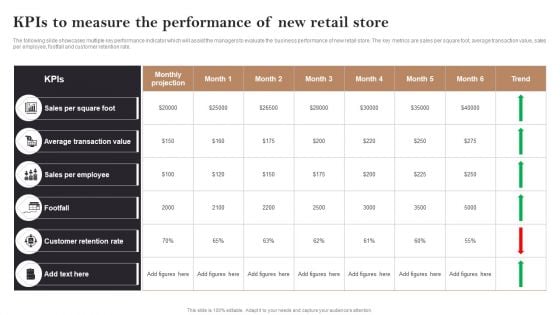
Kpis To Measure The Performance Of New Retail Store Opening Retail Store In Untapped Ideas PDF
The following slide showcases multiple key performance indicator which will assist the managers to evaluate the business performance of new retail store. The key metrics are sales per square foot, average transaction value, sales per employee, footfall and customer retention rate. Want to ace your presentation in front of a live audience Our Kpis To Measure The Performance Of New Retail Store Opening Retail Store In Untapped Ideas PDF can help you do that by engaging all the users towards you.. Slidegeeks experts have put their efforts and expertise into creating these impeccable powerpoint presentations so that you can communicate your ideas clearly. Moreover, all the templates are customizable, and easy-to-edit and downloadable. Use these for both personal and commercial use.

Retail Outlet Opening To Enhance Product Sale Kpis To Measure The Performance Infographics PDF
The following slide showcases multiple key performance indicator which will assist the managers to evaluate the business performance of new retail store. The key metrics are sales per square foot, average transaction value, sales per employee, footfall and customer retention rate. Slidegeeks is here to make your presentations a breeze with Retail Outlet Opening To Enhance Product Sale Kpis To Measure The Performance Infographics PDF With our easy to use and customizable templates, you can focus on delivering your ideas rather than worrying about formatting. With a variety of designs to choose from, you are sure to find one that suits your needs. And with animations and unique photos, illustrations, and fonts, you can make your presentation pop. So whether you are giving a sales pitch or presenting to the board, make sure to check out Slidegeeks first.
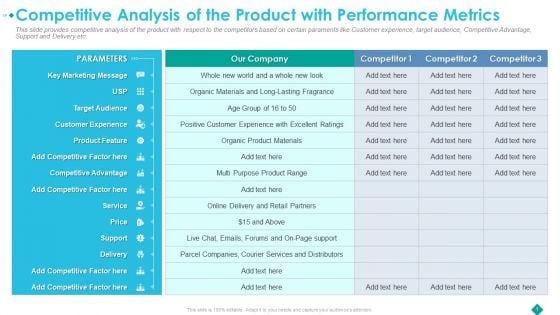
Competitive Analysis Of The Product With Performance Metrics Designs PDF
This slide provides competitive analysis of the product with respect to the competitors based on certain paraments like Customer experience, target audience, Competitive Advantage, Support and Delivery etc.Deliver and pitch your topic in the best possible manner with this competitive analysis of the product with performance metrics designs pdf. Use them to share invaluable insights on organic product materials, competitive advantage, online delivery and retail partners and impress your audience. This template can be altered and modified as per your expectations. So, grab it now.
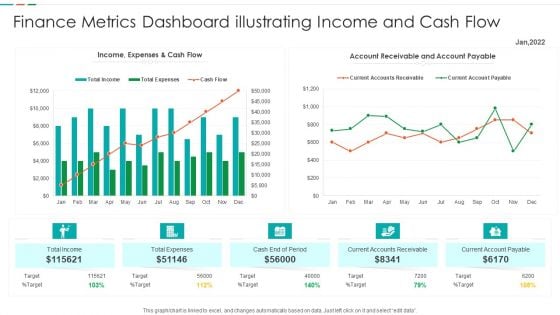
Finance Metrics Dashboard Illustrating Income And Cash Flow Template PDF
This graph or chart is linked to excel, and changes automatically based on data. Just left click on it and select edit data. Pitch your topic with ease and precision using this Finance Metrics Dashboard Illustrating Income And Cash Flow Template PDF. This layout presents information on Current Accounts Receivable, Current Account Payable, Cash End Period, Account Receivable Account. It is also available for immediate download and adjustment. So, changes can be made in the color, design, graphics or any other component to create a unique layout.

Setting Up Metrics For Measuring Critical Applicating Performance Information PDF
This slide provides a matrix to compare the performance of individual applications that are running on new cloud environment. This matrix contains multiple parameters and score are mention against each parameter to evaluate overall performance.Deliver and pitch your topic in the best possible manner with this Setting Up Metrics For Measuring Critical Applicating Performance Information PDF. Use them to share invaluable insights on Service And Support, Performance, Score Legends and impress your audience. This template can be altered and modified as per your expectations. So, grab it now.
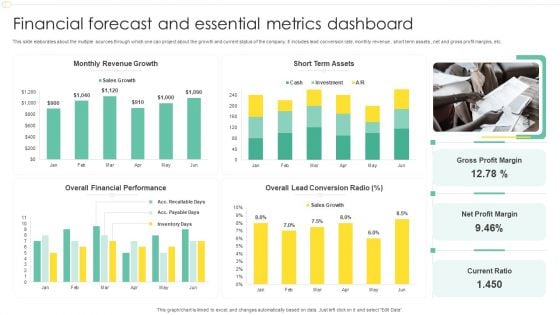
Financial Forecast And Essential Metrics Dashboard Ppt File Show PDF
This slide elaborates about the multiple sources through which one can project about the growth and current status of the company. It includes lead conversion rate, monthly revenue , short term assets , net and gross profit margins, etc. Pitch your topic with ease and precision using this Financial Forecast And Essential Metrics Dashboard Ppt File Show PDF. This layout presents information on Monthly Revenue Growth, Short Term Assets, Overall Financial Performance, Net Profit Margin. It is also available for immediate download and adjustment. So, changes can be made in the color, design, graphics or any other component to create a unique layout.
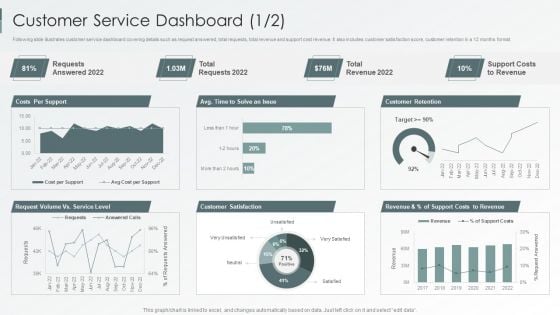
Enterprise Sustainability Performance Metrics Customer Service Dashboard Professional PDF
Following slide illustrates customer service dashboard covering details such as request answered, total requests, total revenue and support cost revenue. It also includes customer satisfaction score, customer retention in a 12 months format.Deliver and pitch your topic in the best possible manner with this Enterprise Sustainability Performance Metrics Customer Service Dashboard Professional PDF. Use them to share invaluable insights on Customer Satisfaction, Customer Retention, Support Revenue and impress your audience. This template can be altered and modified as per your expectations. So, grab it now.
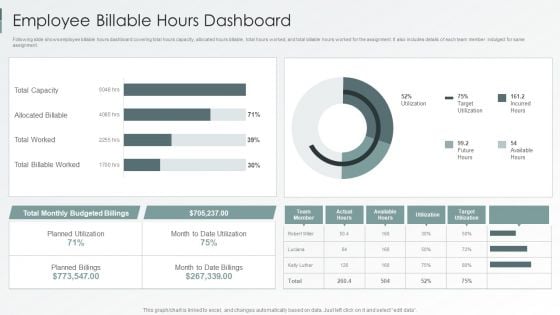
Enterprise Sustainability Performance Metrics Employee Billable Hours Dashboard Information PDF
Following slide shows employee billable hours dashboard covering total hours capacity, allocated hours billable, total hours worked, and total billable hours worked for the assignment. It also includes details of each team member indulged for same assignment.Deliver an awe inspiring pitch with this creative Enterprise Sustainability Performance Metrics Employee Billable Hours Dashboard Information PDF bundle. Topics like Billable Worked, Allocated Billable, Total Capacity can be discussed with this completely editable template. It is available for immediate download depending on the needs and requirements of the user.
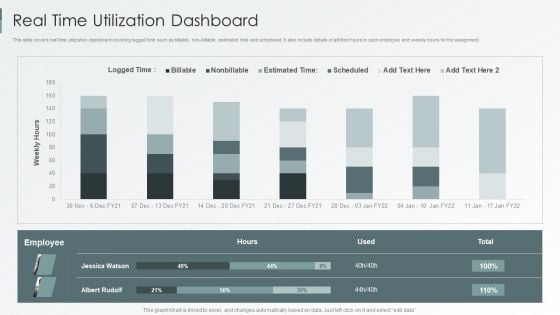
Enterprise Sustainability Performance Metrics Real Time Utilization Dashboard Portrait PDF
This slide covers real time utilization dashboard covering logged time such as billable, non-billable, estimated time and scheduled. It also include details of allotted hours to each employee and weekly hours for the assignment.Deliver and pitch your topic in the best possible manner with this Enterprise Sustainability Performance Metrics Real Time Utilization Dashboard Portrait PDF. Use them to share invaluable insights on Real Time, Utilization Dashboard and impress your audience. This template can be altered and modified as per your expectations. So, grab it now.
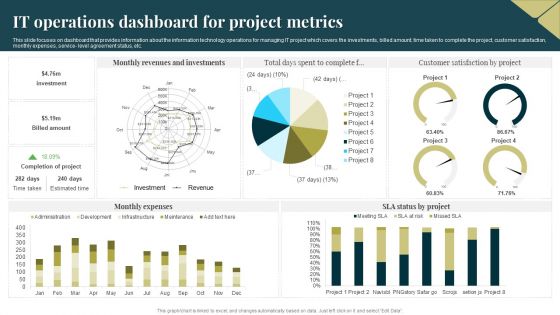
IT Operations Dashboard For Project Metrics Portrait PDF
This slide focuses on dashboard that provides information about the information technology operations for managing IT project which covers the investments, billed amount, time taken to complete the project, customer satisfaction, monthly expenses, service level agreement status, etc. Pitch your topic with ease and precision using this IT Operations Dashboard For Project Metrics Portrait PDF. This layout presents information on Revenues, Investments, Monthly Expenses. It is also available for immediate download and adjustment. So, changes can be made in the color, design, graphics or any other component to create a unique layout.
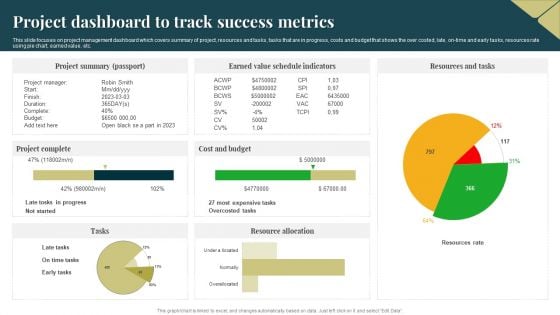
Project Dashboard To Track Success Metrics Background PDF
This slide focuses on project management dashboard which covers summary of project, resources and tasks, tasks that are in progress, costs and budget that shows the over costed, late, on time and early tasks, resources rate using pie chart, earned value, etc. Pitch your topic with ease and precision using this Project Dashboard To Track Success Metrics Background PDF. This layout presents information on Cost And Budget, Project Summary, Resource Allocation. It is also available for immediate download and adjustment. So, changes can be made in the color, design, graphics or any other component to create a unique layout.
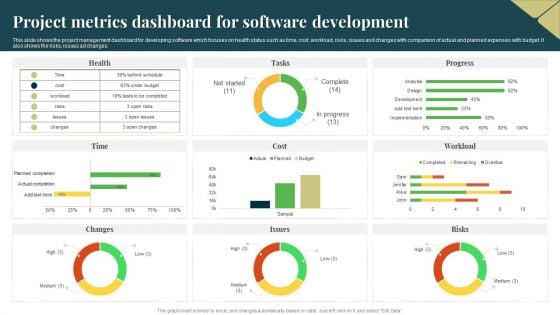
Project Metrics Dashboard For Software Development Designs PDF
This slide shows the project management dashboard for developing software which focuses on health status such as time, cost, workload, risks, issues and changes with comparison of actual and planned expenses with budget. It also shows the risks, issues ad changes. Pitch your topic with ease and precision using this Project Metrics Dashboard For Software Development Designs PDF. This layout presents information on Risks, Budget, Cost. It is also available for immediate download and adjustment. So, changes can be made in the color, design, graphics or any other component to create a unique layout.
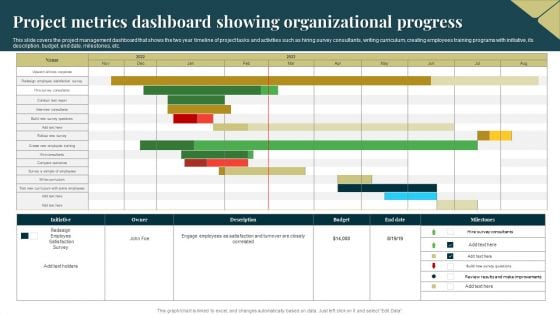
Project Metrics Dashboard Showing Organizational Progress Demonstration PDF
This slide covers the project management dashboard that shows the two year timeline of project tasks and activities such as hiring survey consultants, writing curriculum, creating employees training programs with initiative, its description, budget, end date, milestones, etc. Pitch your topic with ease and precision using this Project Metrics Dashboard Showing Organizational Progress Demonstration PDF. This layout presents information on Budget, Survey, Employees. It is also available for immediate download and adjustment. So, changes can be made in the color, design, graphics or any other component to create a unique layout.

Project Metrics Dashboard With Average Margin Sample PDF
This slide focuses on project management dashboard which covers number of active projects, average margin, revenues, costs, tasks status, resources with planned and actual efforts, available hours, tasks assignments with project deadlines, client, etc. Pitch your topic with ease and precision using this Project Metrics Dashboard With Average Margin Sample PDF. This layout presents information on Average Margin, Revenue, Cost. It is also available for immediate download and adjustment. So, changes can be made in the color, design, graphics or any other component to create a unique layout.
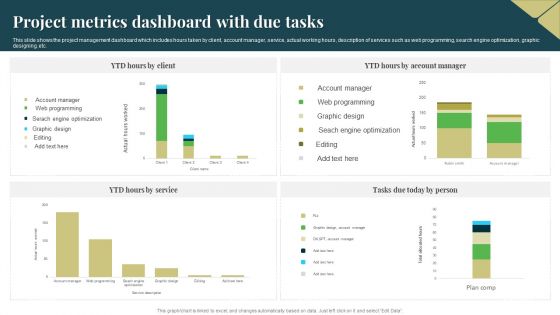
Project Metrics Dashboard With Due Tasks Microsoft PDF
This slide shows the project management dashboard which includes hours taken by client, account manager, service, actual working hours, description of services such as web programming, search engine optimization, graphic designing, etc. Pitch your topic with ease and precision using this Project Metrics Dashboard With Due Tasks Microsoft PDF. This layout presents information on Service, Optimization, Graphic Design. It is also available for immediate download and adjustment. So, changes can be made in the color, design, graphics or any other component to create a unique layout.
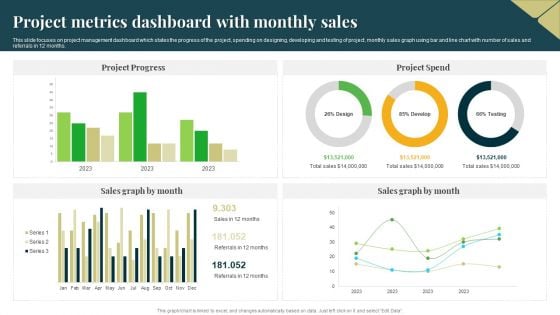
Project Metrics Dashboard With Monthly Sales Professional PDF
This slide focuses on project management dashboard which states the progress of the project, spending on designing, developing and testing of project, monthly sales graph using bar and line chart with number of sales and referrals in 12 months. Pitch your topic with ease and precision using this Project Metrics Dashboard With Monthly Sales Professional PDF. This layout presents information on Project Progress, Project Spend, Sales Graph. It is also available for immediate download and adjustment. So, changes can be made in the color, design, graphics or any other component to create a unique layout.
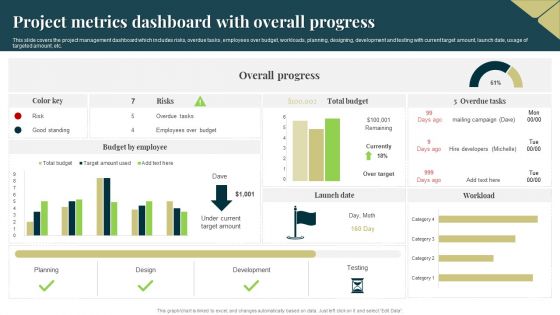
Project Metrics Dashboard With Overall Progress Brochure PDF
This slide covers the project management dashboard which includes risks, overdue tasks, employees over budget, workloads, planning, designing, development and testing with current target amount, launch date, usage of targeted amount, etc. Pitch your topic with ease and precision using this Project Metrics Dashboard With Overall Progress Brochure PDF. This layout presents information on Design, Planning, Development. It is also available for immediate download and adjustment. So, changes can be made in the color, design, graphics or any other component to create a unique layout.

Project Metrics Dashboard With Task Status Rules PDF
This slide shows the project management dashboard which shows the number of team members of managing project activities, estimated and actual time to complete the project task, hours taken by employees with achieved and open milestones and progress status. Pitch your topic with ease and precision using this Project Metrics Dashboard With Task Status Rules PDF. This layout presents information on Team Members, Employee. It is also available for immediate download and adjustment. So, changes can be made in the color, design, graphics or any other component to create a unique layout.
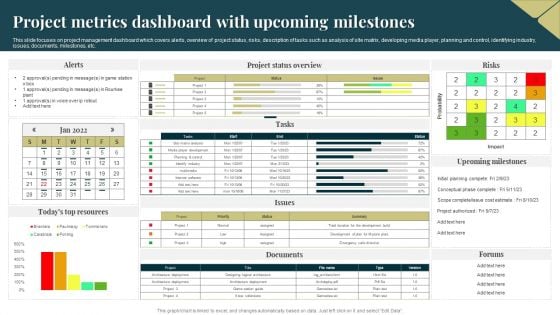
Project Metrics Dashboard With Upcoming Milestones Demonstration PDF
This slide focuses on project management dashboard which covers alerts, overview of project status, risks, description of tasks such as analysis of site matrix, developing media player, planning and control, identifying industry, issues, documents, milestones, etc. Pitch your topic with ease and precision using this Project Metrics Dashboard With Upcoming Milestones Demonstration PDF. This layout presents information on Probability, Project, Risks. It is also available for immediate download and adjustment. So, changes can be made in the color, design, graphics or any other component to create a unique layout.
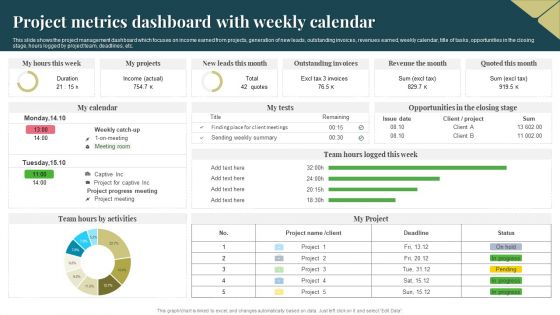
Project Metrics Dashboard With Weekly Calendar Download PDF
This slide shows the project management dashboard which focuses on income earned from projects, generation of new leads, outstanding invoices, revenues earned, weekly calendar, title of tasks, opportunities in the closing stage, hours logged by project team, deadlines, etc. Pitch your topic with ease and precision using this Project Metrics Dashboard With Weekly Calendar Download PDF. This layout presents information on Income, Revenue, Project. It is also available for immediate download and adjustment. So, changes can be made in the color, design, graphics or any other component to create a unique layout.
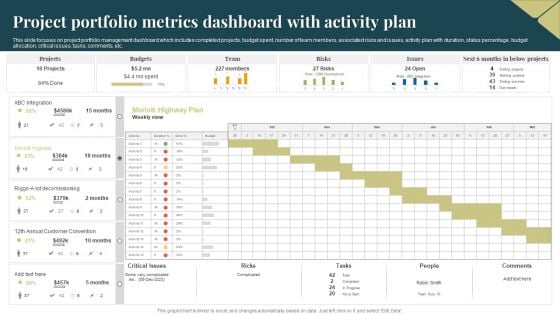
Project Portfolio Metrics Dashboard With Activity Plan Clipart PDF
This slide focuses on project portfolio management dashboard which includes completed projects, budget spent, number of team members, associated risks and issues, activity plan with duration, status percentage, budget allocation, critical issues, tasks, comments, etc. Pitch your topic with ease and precision using this Project Portfolio Metrics Dashboard With Activity Plan Clipart PDF. This layout presents information on Budgets, Team, Risks. It is also available for immediate download and adjustment. So, changes can be made in the color, design, graphics or any other component to create a unique layout.
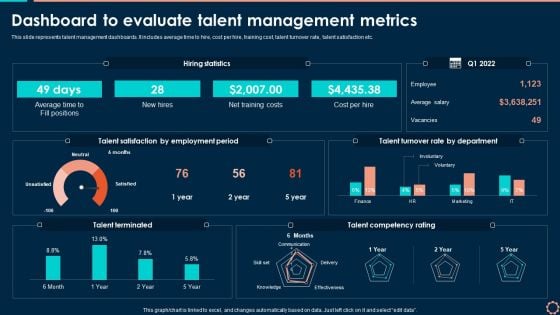
Dashboard To Evaluate Talent Management Metrics Topics PDF
This slide represents talent management dashboards. It includes average time to hire, cost per hire, training cost, talent turnover rate, talent satisfaction etc. Boost your pitch with our creative Dashboard To Evaluate Talent Management Metrics Topics PDF. Deliver an awe inspiring pitch that will mesmerize everyone. Using these presentation templates you will surely catch everyones attention. You can browse the ppts collection on our website. We have researchers who are experts at creating the right content for the templates. So you do not have to invest time in any additional work. Just grab the template now and use them.
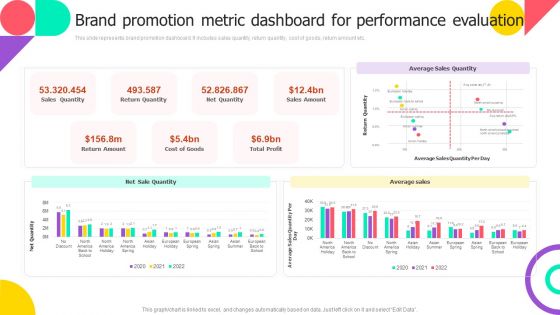
Brand Promotion Metric Dashboard For Performance Evaluation Sample PDF
This slide represents brand promotion dashboard. It includes sales quantity, return quantity, cost of goods, return amount etc. Slidegeeks is one of the best resources for PowerPoint templates. You can download easily and regulate Brand Promotion Metric Dashboard For Performance Evaluation Sample PDF for your personal presentations from our wonderful collection. A few clicks is all it takes to discover and get the most relevant and appropriate templates. Use our Templates to add a unique zing and appeal to your presentation and meetings. All the slides are easy to edit and you can use them even for advertisement purposes.
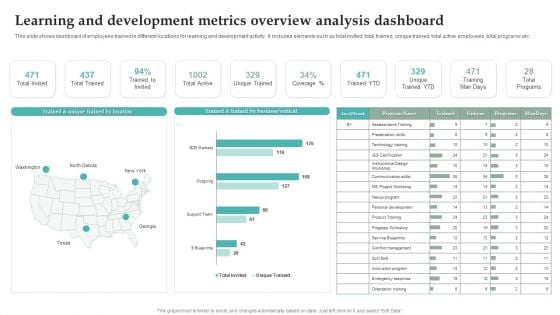
Learning And Development Metrics Overview Analysis Dashboard Graphics PDF
This slide shows dashboard of employees trained in different locations for learning and development activity. It includes elements such as total invited, total trained, unique trained, total active employees, total programs etc. Pitch your topic with ease and precision using this Learning And Development Metrics Overview Analysis Dashboard Graphics PDF. This layout presents information on Unique Trained YTD, Training Man Days, Total Programs. It is also available for immediate download and adjustment. So, changes can be made in the color, design, graphics or any other component to create a unique layout.
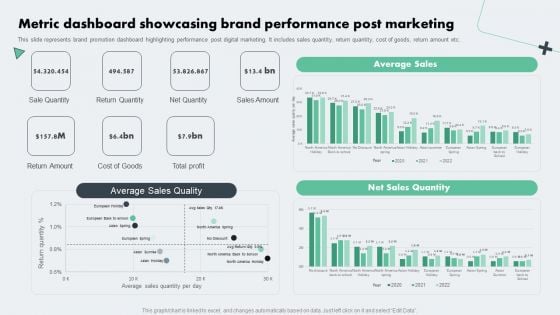
Deploying Online Marketing Metric Dashboard Showcasing Brand Performance Microsoft PDF
This slide represents brand promotion dashboard highlighting performance post digital marketing. It includes sales quantity, return quantity, cost of goods, return amount etc. From laying roadmaps to briefing everything in detail, our templates are perfect for you. You can set the stage with your presentation slides. All you have to do is download these easy-to-edit and customizable templates. Deploying Online Marketing Metric Dashboard Showcasing Brand Performance Microsoft PDF will help you deliver an outstanding performance that everyone would remember and praise you for. Do download this presentation today.
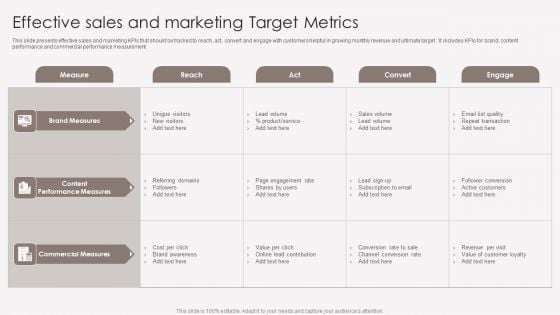
Effective Sales And Marketing Target Metrics Mockup PDF
This slide presents effective sales and marketing KPIs that should be tracked to reach, act, convert and engage with customers helpful in growing monthly revenue and ultimate target . It includes KPIs for brand, content performance and commercial performance measurement. Pitch your topic with ease and precision using this Effective Sales And Marketing Target Metrics Mockup PDF. This layout presents information on Brand Measures, Content Performance Measures, Commercial Measures. It is also available for immediate download and adjustment. So, changes can be made in the color, design, graphics or any other component to create a unique layout.
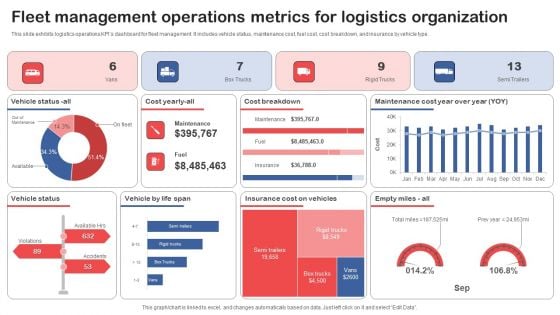
Fleet Management Operations Metrics For Logistics Organization Graphics PDF
This slide exhibits logistics operations KPIs dashboard for fleet management. It includes vehicle status, maintenance cost, fuel cost, cost breakdown, and insurance by vehicle type. Pitch your topic with ease and precision using this Fleet Management Operations Metrics For Logistics Organization Graphics PDF. This layout presents information on Cost Breakdown, Vehicle Status, Vehicle By Life Span. It is also available for immediate download and adjustment. So, changes can be made in the color, design, graphics or any other component to create a unique layout.
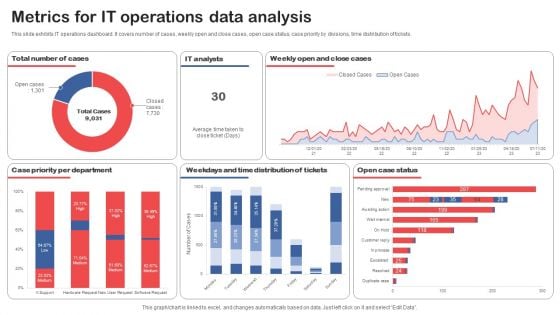
Metrics For IT Operations Data Analysis Topics PDF
This slide exhibits IT operations dashboard. It covers number of cases, weekly open and close cases, open case status, case priority by divisions, time distribution of tickets. Pitch your topic with ease and precision using this Metrics For IT Operations Data Analysis Topics PDF. This layout presents information on Case Priority Per Department, Distribution Of Tickets, Open Case Status. It is also available for immediate download and adjustment. So, changes can be made in the color, design, graphics or any other component to create a unique layout.
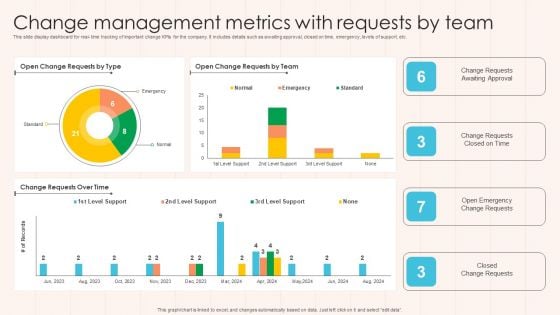
Change Management Metrics With Requests By Team Designs PDF
This slide display dashboard for real- time tracking of important change KPIs for the company. It includes details such as awaiting approval, closed on time, emergency, levels of support, etc. Pitch your topic with ease and precision using this Change Management Metrics With Requests By Team Designs PDF This layout presents information on Change Requests, Approval, Team. It is also available for immediate download and adjustment. So, changes can be made in the color, design, graphics or any other component to create a unique layout.
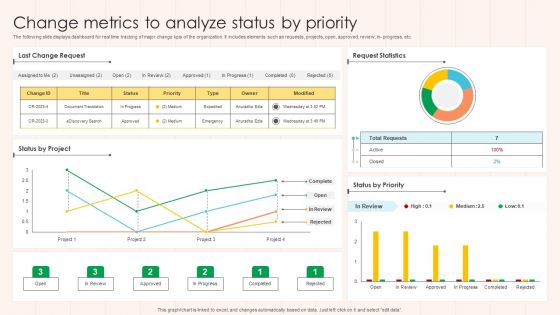
Change Metrics To Analyze Status By Priority Formats PDF
The following slide displays dashboard for real time tracking of major change kpis of the organization. It includes elements such as requests, projects, open, approved, review, in- progress, etc. Pitch your topic with ease and precision using this Change Metrics To Analyze Status By Priority Formats PDF This layout presents information on Project, Request Statistics, Priority. It is also available for immediate download and adjustment. So, changes can be made in the color, design, graphics or any other component to create a unique layout.
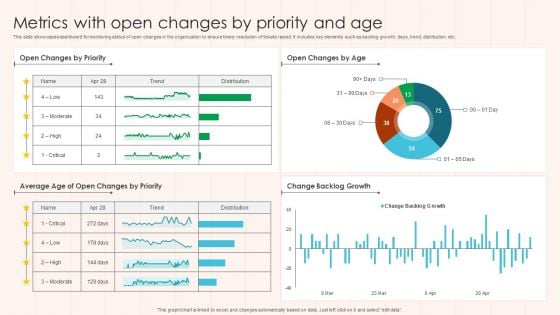
Metrics With Open Changes By Priority And Age Guidelines PDF
This slide showcases dashboard for monitoring status of open changes in the organization to ensure timely resolution of tickets raised. It includes key elements such as backlog growth, days, trend, distribution, etc. Pitch your topic with ease and precision using this Metrics With Open Changes By Priority And Age Guidelines PDF This layout presents information on Change Backlog Growth, Priority, Age. It is also available for immediate download and adjustment. So, changes can be made in the color, design, graphics or any other component to create a unique layout.

Monthly Analysis For Actual And Budget Financials Metrics Professional PDF
The following slide shows review report to compare difference in actually spend and planned budget for cost planning in future. It further includes details about maintenance and repairs, supplies, rent, mortgage, etc. Pitch your topic with ease and precision using this Monthly Analysis For Actual And Budget Financials Metrics Professional PDF. This layout presents information on Budget Totals, Expenses, Budget Overview. It is also available for immediate download and adjustment. So, changes can be made in the color, design, graphics or any other component to create a unique layout.
Open Risks And Issues Metrics For Software Development Icons PDF
This slide displays analytics to offer real-time data and insights on application programming project to keep it on schedule. It further includes details about change requests and bugs. Pitch your topic with ease and precision using this Open Risks And Issues Metrics For Software Development Icons PDF. This layout presents information on Priority, Risks, Change Requests. It is also available for immediate download and adjustment. So, changes can be made in the color, design, graphics or any other component to create a unique layout.


 Continue with Email

 Home
Home


