Layer Diagram
Warehouse Automation Deployment Dashboard For Tracking Impact Of Warehouse House Infographics PDF
This slide covers the dashboard with after automation warehouse overview. It include KPIs such as autonomous robots status, robotic arms status, battery level, performance, time to return, etc. Deliver and pitch your topic in the best possible manner with this Warehouse Automation Deployment Dashboard For Tracking Impact Of Warehouse House Infographics PDF. Use them to share invaluable insights on Autonomous Robot, Systems Engineer, Warehouse Manager and impress your audience. This template can be altered and modified as per your expectations. So, grab it now.
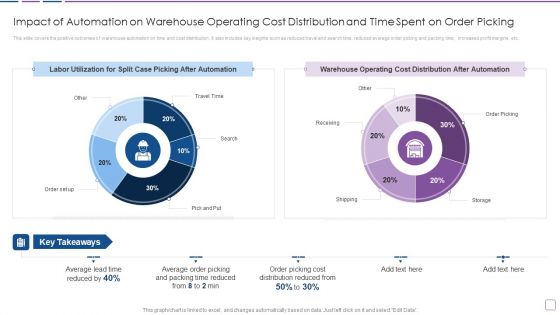
Warehouse Automation Deployment Impact Of Automation On Warehouse Operating Cost Topics PDF
This slide covers the positive outcomes of warehouse automation on time and cost distribution. It also includes key insights such as reduced travel and search time, reduced average order picking and packing time, increased profit margins, etc. Deliver an awe inspiring pitch with this creative Warehouse Automation Deployment Impact Of Automation On Warehouse Operating Cost Topics PDF bundle. Topics like Average Lead Time, Average Order Picking, Time Reduced can be discussed with this completely editable template. It is available for immediate download depending on the needs and requirements of the user.
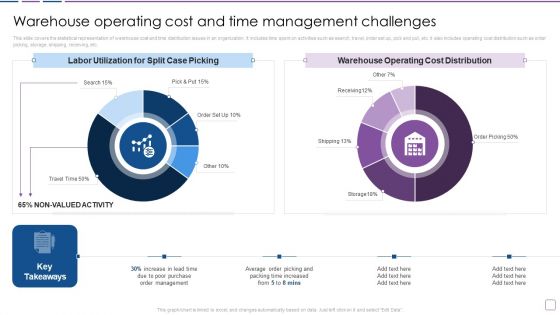
Warehouse Automation Deployment Warehouse Operating Cost And Time Management Topics PDF
This slide covers the statistical representation of warehouse cost and time distribution issues in an organization. It includes time spent on activities such as search, travel, order set up, pick and put, etc. it also includes operating cost distribution such as order picking, storage, shipping, receiving, etc. Deliver an awe inspiring pitch with this creative Warehouse Automation Deployment Warehouse Operating Cost And Time Management Topics PDF bundle. Topics like Labor Utilization, Split Case Picking, Warehouse Operating, Cost Distribution can be discussed with this completely editable template. It is available for immediate download depending on the needs and requirements of the user.
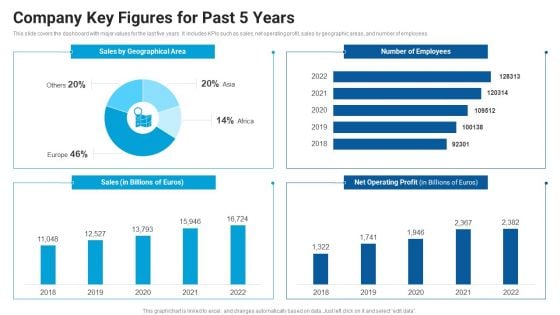
Company Key Figures For Past 5 Years Market Entry Approach For Apparel Sector Clipart PDF
This slide covers the dashboard with major values for the last five years. It includes KPIs such as sales, net operating profit, sales by geographic areas, and number of employees. Deliver an awe inspiring pitch with this creative Company Key Figures For Past 5 Years Market Entry Approach For Apparel Sector Clipart PDF bundle. Topics like Sales Geographical, Number Employees, Operating Profit can be discussed with this completely editable template. It is available for immediate download depending on the needs and requirements of the user.
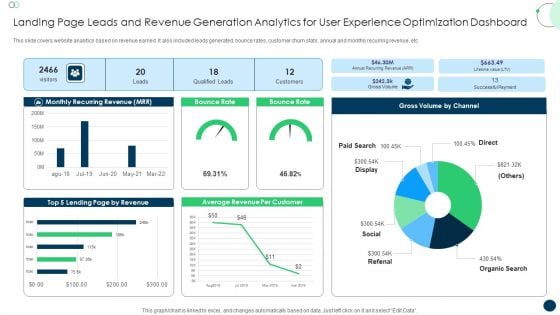
Landing Page Leads And Revenue Generation Analytics For User Experience Optimization Dashboard Formats PDF
This slide covers website analytics based on revenue earned. It also included leads generated, bounce rates, customer churn stats, annual and monthly recurring revenue, etc. Pitch your topic with ease and precision using this Landing Page Leads And Revenue Generation Analytics For User Experience Optimization Dashboard Formats PDF. This layout presents information on Monthly Recurring Revenue, Bounce Rate, Gross Volume. It is also available for immediate download and adjustment. So, changes can be made in the color, design, graphics or any other component to create a unique layout.
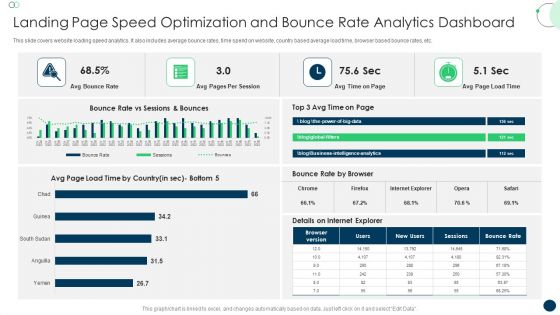
Landing Page Speed Optimization And Bounce Rate Analytics Dashboard Topics PDF
This slide covers website loading speed analytics. It also includes average bounce rates, time spend on website, country based average load time, browser based bounce rates, etc. Pitch your topic with ease and precision using this Landing Page Speed Optimization And Bounce Rate Analytics Dashboard Topics PDF. This layout presents information on Avg Bounce Rate, Avg Pages, Per Session. It is also available for immediate download and adjustment. So, changes can be made in the color, design, graphics or any other component to create a unique layout.
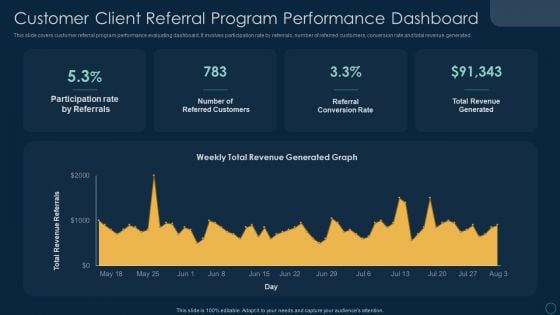
Customer Client Referral Program Performance Dashboard Ppt File Visual Aids PDF
This slide covers customer referral program performance evaluating dashboard. It involves participation rate by referrals, number of referred customers, conversion rate and total revenue generated. Pitch your topic with ease and precision using this Customer Client Referral Program Performance Dashboard Ppt File Visual Aids PDF. This layout presents information on Participation Rate Referrals, Number Referred Customers, Referral Conversion Rate. It is also available for immediate download and adjustment. So, changes can be made in the color, design, graphics or any other component to create a unique layout.
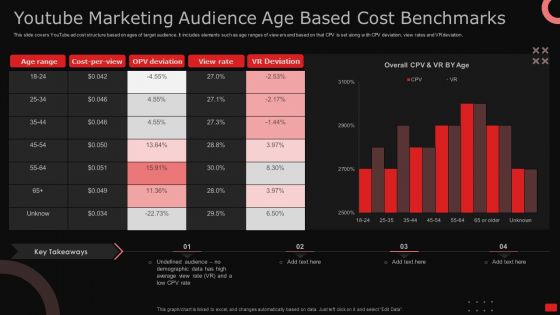
Youtube Marketing Audience Age Based Cost Benchmarks Ppt Model Show PDF
This slide covers YouTube ad cost structure based on ages of target audience. It includes elements such as age ranges of viewers and based on that CPV is set along with CPV deviation, view rates and VR deviation. Pitch your topic with ease and precision using this Youtube Marketing Audience Age Based Cost Benchmarks Ppt Model Show PDF. This layout presents information on Age Range, Cost Per View, OPV Deviation. It is also available for immediate download and adjustment. So, changes can be made in the color, design, graphics or any other component to create a unique layout.
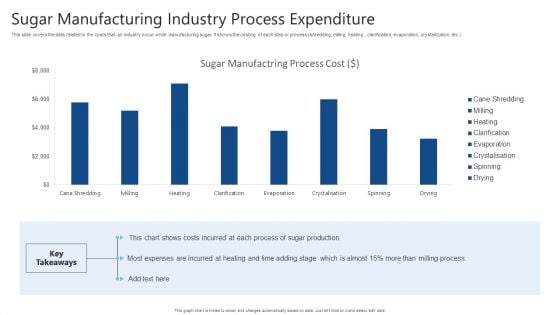
Sugar Manufacturing Industry Process Expenditure Ppt Infographic Template Information PDF
This slide covers the data related to the costs that an industry occur while manufacturing sugar. It shows the costing of each step or process shredding, milling, heating, clarification, evaporation, crystallization, etc. Pitch your topic with ease and precision using this Sugar Manufacturing Industry Process Expenditure Ppt Infographic Template Information PDF. This layout presents information on Sugar Manufactring Process, Cost, Sugar Production. It is also available for immediate download and adjustment. So, changes can be made in the color, design, graphics or any other component to create a unique layout.

Key Benefits To Organization Post Implementing Social Media Automation Achieving Operational Efficiency Introduction PDF
The following slide outlines the major benefits of social media automation. Information covered in this slide is related to improved engagement levels, boost online presence, reduction in overall marketing cost and improved customer relationship. Deliver and pitch your topic in the best possible manner with this Key Benefits To Organization Post Implementing Social Media Automation Achieving Operational Efficiency Introduction PDF. Use them to share invaluable insights on Customer Engagement, Level Increased, Automated Replies and impress your audience. This template can be altered and modified as per your expectations. So, grab it now.

KPI Dashboard Highlighting Automation Results In Supply Achieving Operational Efficiency Graphics PDF
The following slide outlines a comprehensive dashboard depicting the business process automation BPA results in the supply chain. Information covered in the slide is related to average order processing days, average shipping days, etc.Deliver and pitch your topic in the best possible manner with this KPI Dashboard Highlighting Automation Results In Supply Achieving Operational Efficiency Graphics PDF. Use them to share invaluable insights on Orders Progress, Late Deliveries, Deliveries Warehouse and impress your audience. This template can be altered and modified as per your expectations. So, grab it now.
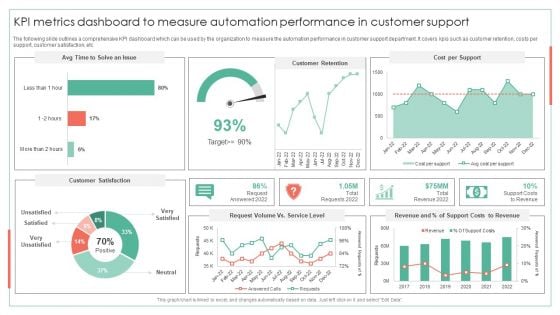
KPI Metrics Dashboard To Measure Automation Performance Achieving Operational Efficiency Guidelines PDF
The following slide outlines a comprehensive KPI dashboard which can be used by the organization to measure the automation performance in customer support department. It covers kpis such as customer retention, costs per support, customer satisfaction, etcDeliver and pitch your topic in the best possible manner with this KPI Metrics Dashboard To Measure Automation Performance Achieving Operational Efficiency Guidelines PDF. Use them to share invaluable insights on Customer Retention, Cost Per Support, Request Volume and impress your audience. This template can be altered and modified as per your expectations. So, grab it now.
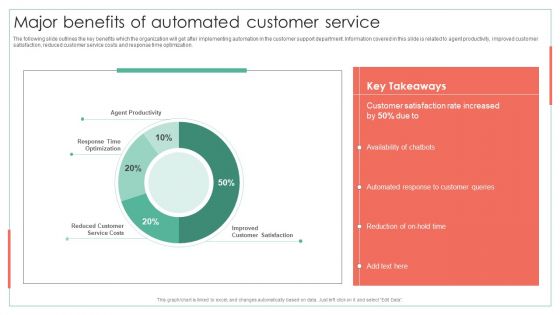
Major Benefits Of Automated Customer Service Achieving Operational Efficiency Graphics PDF
The following slide outlines the key benefits which the organization will get after implementing automation in the customer support department. Information covered in this slide is related to agent productivity, improved customer satisfaction, reduced customer service costs and response time optimization. Deliver an awe inspiring pitch with this creative Major Benefits Of Automated Customer Service Achieving Operational Efficiency Graphics PDF bundle. Topics like Customer Satisfaction, Automated Response, Customer Queries can be discussed with this completely editable template. It is available for immediate download depending on the needs and requirements of the user.
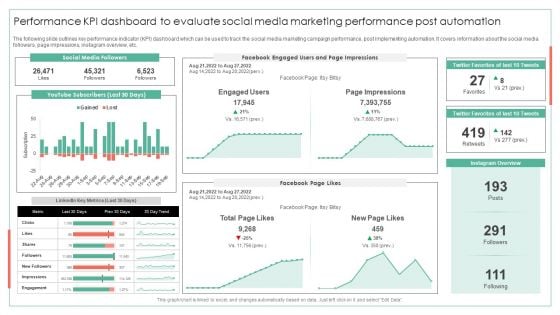
Performance KPI Dashboard To Evaluate Social Media Marketing Performance Post Automation Ideas PDF
The following slide outlines key performance indicator KPI dashboard which can be used to track the social media marketing campaign performance, post implementing automation. It covers information about the social media followers, page impressions, instagram overview, etc.Deliver an awe inspiring pitch with this creative Performance KPI Dashboard To Evaluate Social Media Marketing Performance Post Automation Ideas PDF bundle. Topics like Page Impressions, Twitter Favorites, Instagram Overview can be discussed with this completely editable template. It is available for immediate download depending on the needs and requirements of the user.
Strategies To Attract Customers And Lead Generation Dashboard For Tracking Facebook Retargeting Campaign Graphics PDF
This slide covers metrics for analysing the results of Facebook retargeting campaign. It includes KPIs such as ad spend, cost per click, click through rate, ad reach, post engagement, ad clicks, ad impressions, link clicks, etc. Deliver and pitch your topic in the best possible manner with this Strategies To Attract Customers And Lead Generation Dashboard For Tracking Facebook Retargeting Campaign Graphics PDF. Use them to share invaluable insights on Cost Per Click, Dashboard, Tracking Facebook Retargeting Campaign and impress your audience. This template can be altered and modified as per your expectations. So, grab it now.
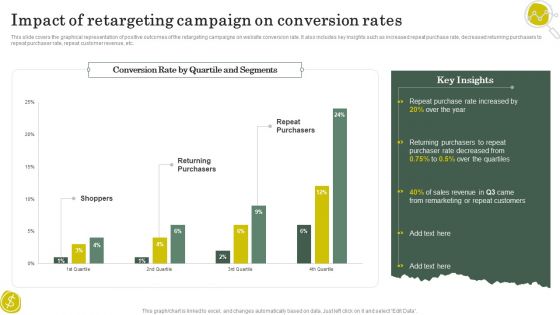
Strategies To Attract Customers And Lead Generation Impact Of Retargeting Campaign On Conversion Rates Pictures PDF
This slide covers the graphical representation of positive outcomes of the retargeting campaigns on website conversion rate. It also includes key insights such as increased repeat purchase rate, decreased returning purchasers to repeat purchaser rate, repeat customer revenue, etc. Deliver and pitch your topic in the best possible manner with this Strategies To Attract Customers And Lead Generation Impact Of Retargeting Campaign On Conversion Rates Pictures PDF. Use them to share invaluable insights on Purchase Rate, Remarketing, Sales Revenue and impress your audience. This template can be altered and modified as per your expectations. So, grab it now.
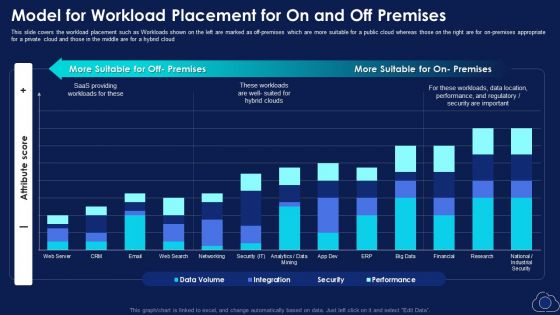
Model For Workload Placement For On And Off Premise Topics PDF
This slide covers the workload placement such as Workloads shown on the left are marked as off premises which are more suitable for a public cloud whereas those on the right are for on premises appropriate for a private cloud and those in the middle are for a hybrid cloud. Deliver an awe inspiring pitch with this creative Model For Workload Placement For On And Off Premise Topics PDF bundle. Topics like Model For Workload Placement, On And Off Premises can be discussed with this completely editable template. It is available for immediate download depending on the needs and requirements of the user.
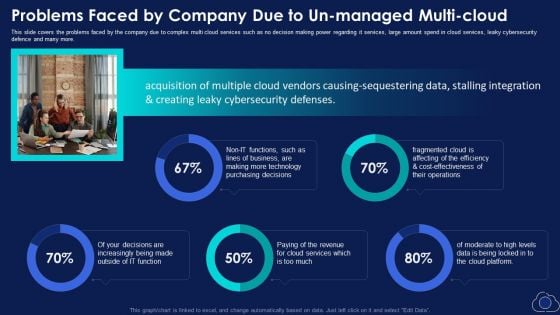
Problems Faced By Company Due To Un Managed Multi Cloud Demonstration PDF
This slide covers the problems faced by the company due to complex multi cloud services such as no decision making power regarding it services, large amount spend in cloud services, leaky cybersecurity defence and many more. Deliver and pitch your topic in the best possible manner with this Problems Faced By Company Due To Un Managed Multi Cloud Demonstration PDF. Use them to share invaluable insights on Revenue, Cloud Services, Technology and impress your audience. This template can be altered and modified as per your expectations. So, grab it now.
Altcoins Portfolio Tracking Metrics Dashboard Ppt Inspiration Background Images PDF
This slide covers dashboard for tracking different cryptocurrencies value and growth. It includes metrics such as incomes and expenses, market values, cryptocurrency transactions history, overall growth percentages, exchange rates, etc. Showcasing this set of slides titled Altcoins Portfolio Tracking Metrics Dashboard Ppt Inspiration Background Images PDF. The topics addressed in these templates are Balance, 3 Currencies, Transactions. All the content presented in this PPT design is completely editable. Download it and make adjustments in color, background, font etc. as per your unique business setting.
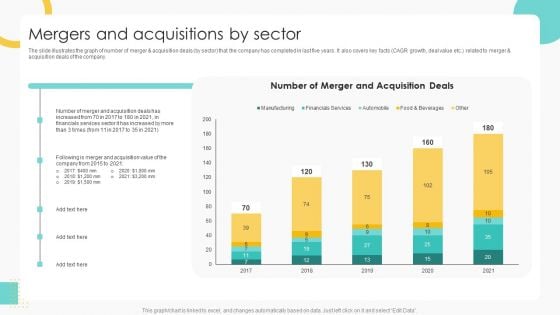
Buy Side Merger And Acquisition Pitch Book Mergers And Acquisitions By Sector Summary PDF
The slide illustrates the graph of number of merger and acquisition deals by sector that the company has completed in last five years. It also covers key facts CAGR growth, deal value etc. related to merger and acquisition deals of the company. Deliver an awe inspiring pitch with this creative Buy Side Merger And Acquisition Pitch Book Mergers And Acquisitions By Sector Summary PDF bundle. Topics like Financials Services, Acquisition Value can be discussed with this completely editable template. It is available for immediate download depending on the needs and requirements of the user.
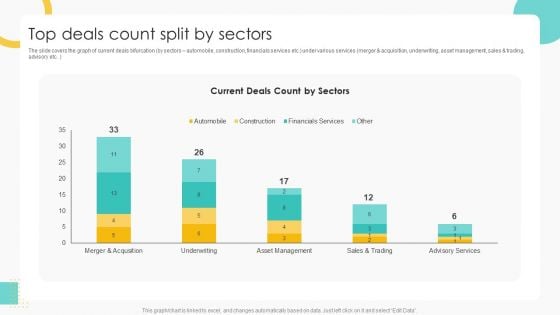
Buy Side Merger And Acquisition Pitch Book Top Deals Count Split By Sectors Guidelines PDF
The slide covers the graph of current deals bifurcation by sectors automobile, construction, financials services etc. under various services merger and acquisition, underwriting, asset management, sales and trading, advisory etc. Deliver an awe inspiring pitch with this creative Buy Side Merger And Acquisition Pitch Book Top Deals Count Split By Sectors Guidelines PDF bundle. Topics like Asset Management, Advisory Services, Sales can be discussed with this completely editable template. It is available for immediate download depending on the needs and requirements of the user.
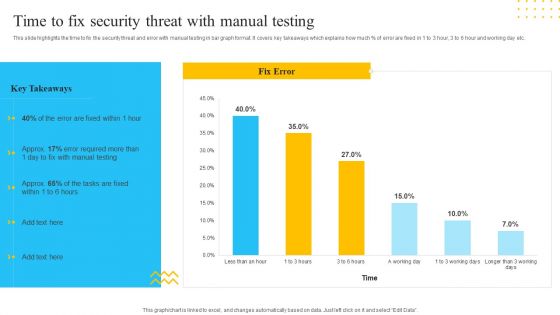
IT Security Automation Tools Integration Time To Fix Security Threat With Manual Testing Template PDF
This slide highlights the time to fix the security threat and error with manual testing in bar graph format. It covers key takeaways which explains how much percent of error are fixed in 1 to 3 hour, 3 to 6 hour and working day etc. Deliver and pitch your topic in the best possible manner with this IT Security Automation Tools Integration Time To Fix Security Threat With Manual Testing Template PDF. Use them to share invaluable insights on Manual Testing, Fix Error, 3 Working Days and impress your audience. This template can be altered and modified as per your expectations. So, grab it now.
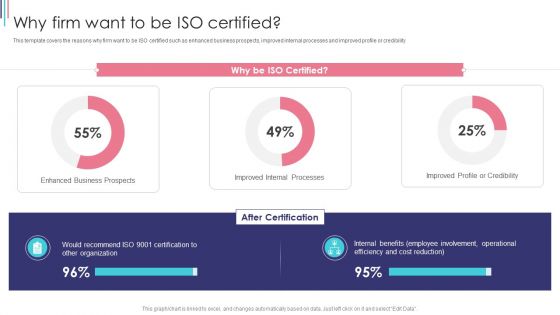
ISO 9001 Standard For Quality Control Why Firm Want To Be ISO Certified Mockup PDF
This template covers the reasons why firm want to be ISO certified such as enhanced business prospects, improved internal processes and improved profile or credibility Deliver an awe inspiring pitch with this creative ISO 9001 Standard For Quality Control Why Firm Want To Be ISO Certified Mockup PDF bundle. Topics like Improved Internal Processes, Improved Profile Or Credibility, Enhanced Business Prospects can be discussed with this completely editable template. It is available for immediate download depending on the needs and requirements of the user.
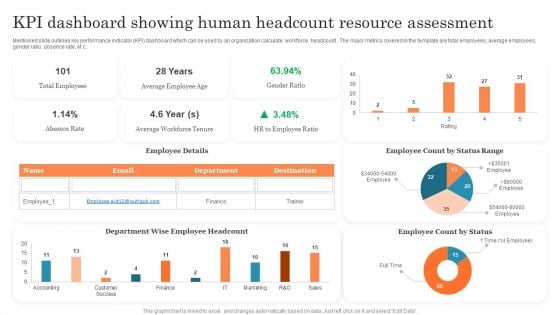
KPI Dashboard Showing Human Headcount Resource Assessment Ppt PowerPoint Presentation Outline PDF
Mentioned slide outlines key performance indicator KPI dashboard which can be used by an organization calculate workforce headcount . The major metrics covered in the template are total employees, average employees, gender ratio, absence rate, etc. Pitch your topic with ease and precision using this KPI Dashboard Showing Human Headcount Resource Assessment Ppt PowerPoint Presentation Outline PDF. This layout presents information on Total Employees, Average Employee, Employee Count. It is also available for immediate download and adjustment. So, changes can be made in the color, design, graphics or any other component to create a unique layout.
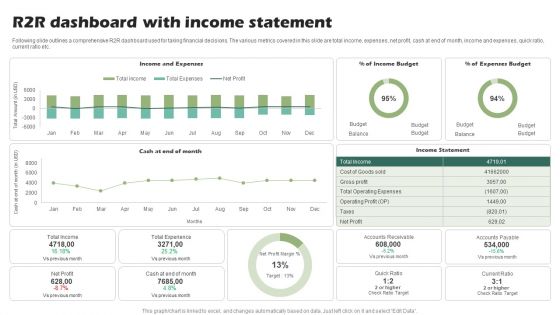
R2R Dashboard With Income Statement Ppt PowerPoint Presentation Show Slide Download PDF
Following slide outlines a comprehensive R2R dashboard used for taking financial decisions. The various metrics covered in this slide are total income, expenses, net profit, cash at end of month, income and expenses, quick ratio, current ratio etc.Showcasing this set of slides titled R2R Dashboard With Income Statement Ppt PowerPoint Presentation Show Slide Download PDF. The topics addressed in these templates are Operating Expenses, Total Experience, Accounts Receivable. All the content presented in this PPT design is completely editable. Download it and make adjustments in color, background, font etc. as per your unique business setting.
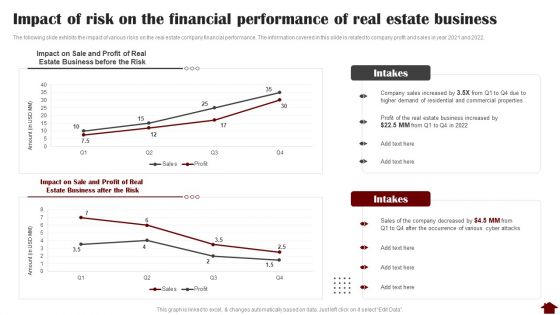
Impact Of Risk On The Financial Performance Of Real Estate Business Graphics PDF
The following slide exhibits the impact of various risks on the real estate company financial performance. The information covered in this slide is related to company profit and sales in year 2021 and 2022. Deliver an awe inspiring pitch with this creative Impact Of Risk On The Financial Performance Of Real Estate Business Graphics PDF bundle. Topics like Sale And Profit, Estate Business, Risk can be discussed with this completely editable template. It is available for immediate download depending on the needs and requirements of the user.
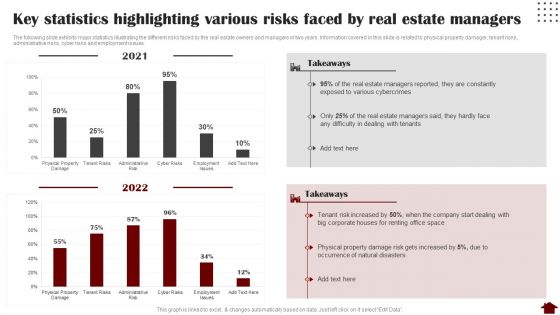
Key Statistics Highlighting Various Risks Faced By Real Estate Managers Mockup PDF
The following slide exhibits major statistics illustrating the different risks faced by the real estate owners and managers in two years. Information covered in this slide is related to physical property damager, tenant risks, administrative risks, cyber risks and employment issues. Deliver and pitch your topic in the best possible manner with this Key Statistics Highlighting Various Risks Faced By Real Estate Managers Mockup PDF. Use them to share invaluable insights on Key Statistics Highlighting, Various Risks, Real Estate Managers and impress your audience. This template can be altered and modified as per your expectations. So, grab it now.
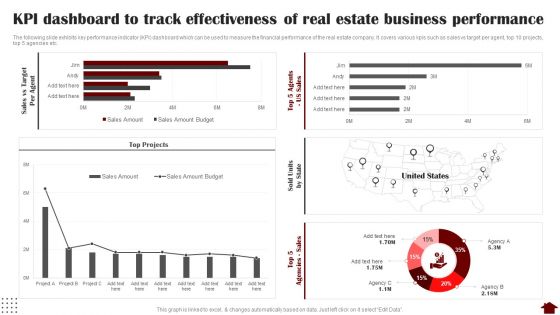
KPI Dashboard To Track Effectiveness Of Real Estate Business Performance Slides PDF
The following slide exhibits key performance indicator KPI dashboard which can be used to measure the financial performance of the real estate company. It covers various kpis such as sales vs target per agent, top 10 projects, top 5 agencies etc. Deliver an awe inspiring pitch with this creative KPI Dashboard To Track Effectiveness Of Real Estate Business Performance Slides PDF bundle. Topics like KPI Dashboard, Track Effectiveness, Real Estate Business Performance can be discussed with this completely editable template. It is available for immediate download depending on the needs and requirements of the user.
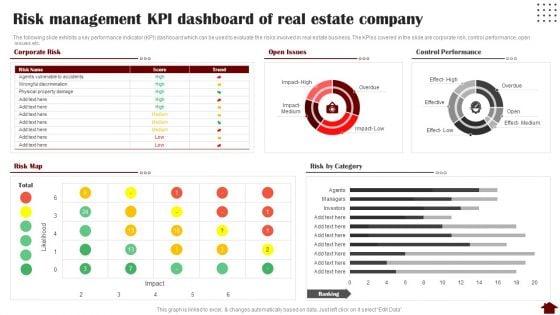
Risk Management KPI Dashboard Of Real Estate Company Rules PDF
The following slide exhibits a key performance indicator KPI dashboard which can be used to evaluate the risks involved in real estate business. The KPIss covered in the slide are corporate risk, control performance, open issues etc. Deliver and pitch your topic in the best possible manner with this Risk Management KPI Dashboard Of Real Estate Company Rules PDF. Use them to share invaluable insights on Risk Management KPI Dashboard, Real Estate Company and impress your audience. This template can be altered and modified as per your expectations. So, grab it now.

Infrastructure Expansion KPI Dashboard For Investment Project Management Inspiration PDF
This slide covers management dashboard for analyzing the project performance and progress. It include KPIs such as total claims to date, total costs to date, project status, profits, number of days left, etc. Showcasing this set of slides titled Infrastructure Expansion KPI Dashboard For Investment Project Management Inspiration PDF. The topics addressed in these templates are Claims And Costs, Project Status, Profits. All the content presented in this PPT design is completely editable. Download it and make adjustments in color, background, font etc. as per your unique business setting.
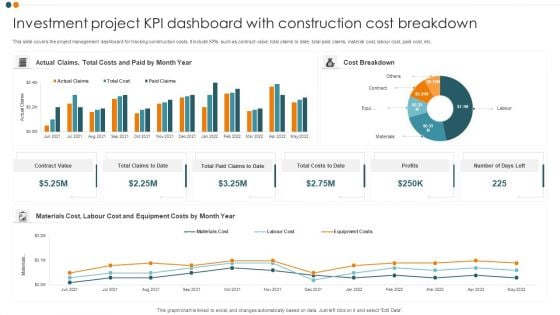
Investment Project KPI Dashboard With Construction Cost Breakdown Professional PDF
This slide covers the project management dashboard for tracking construction costs. It include KPIs such as contract value, total claims to date, total paid claims, material cost, labour cost, paid cost, etc. Showcasing this set of slides titled Investment Project KPI Dashboard With Construction Cost Breakdown Professional PDF. The topics addressed in these templates are Actual Claims, Cost Breakdown, Contract Value. All the content presented in this PPT design is completely editable. Download it and make adjustments in color, background, font etc. as per your unique business setting.
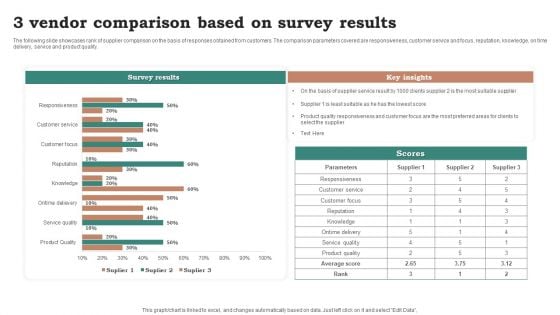
3 Vendor Comparison Based On Survey Results Ppt Ideas Graphic Tips PDF
The following slide showcases rank of supplier comparison on the basis of responses obtained from customers. The comparison parameters covered are responsiveness, customer service and focus, reputation, knowledge, on time delivery, service and product quality. Pitch your topic with ease and precision using this 3 Vendor Comparison Based On Survey Results Ppt Ideas Graphic Tips PDF. This layout presents information on Survey Results, Key Insights, Parameters. It is also available for immediate download and adjustment. So, changes can be made in the color, design, graphics or any other component to create a unique layout.
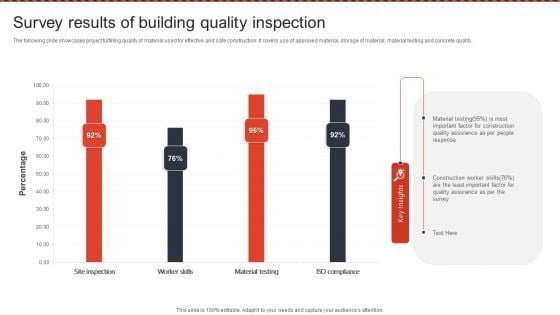
Survey Results Of Building Quality Inspection Ppt PowerPoint Presentation File Show PDF
The following slide showcases project fulfilling quality of material used for effective and safe construction. It covers use of approved material, storage of material, material testing and concrete quality. Pitch your topic with ease and precision using this Survey Results Of Building Quality Inspection Ppt PowerPoint Presentation File Show PDF. This layout presents information on Material Testing, Quality Assurance, Construction Worker Skills. It is also available for immediate download and adjustment. So, changes can be made in the color, design, graphics or any other component to create a unique layout.
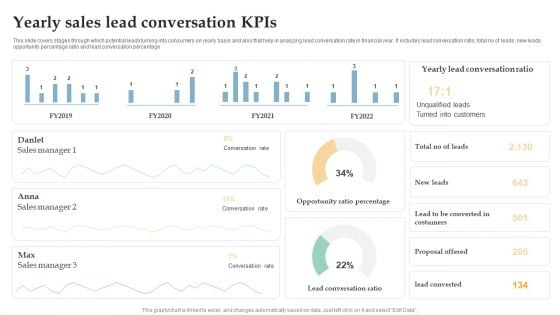
Yearly Sales Lead Conversation Kpis Ppt Inspiration Brochure PDF
This slide covers stages through which potential leads turning into consumers on yearly basis and also that help in analyzing lead conversation rate in financial year. It includes lead conversation ratio, total no of leads, new leads opportunity percentage ratio and lead conversation percentage. Pitch your topic with ease and precision using this Yearly Sales Lead Conversation Kpis Ppt Inspiration Brochure PDF. This layout presents information on Sales Manager, Conversation Rate, Opportunity Ratio Percentage. It is also available for immediate download and adjustment. So, changes can be made in the color, design, graphics or any other component to create a unique layout.
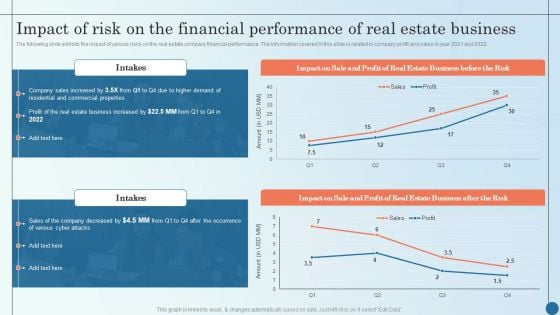
Impact Of Risk On The Financial Performance Of Real Managing Commercial Property Risks Sample PDF
The following slide exhibits the impact of various risks on the real estate company financial performance. The information covered in this slide is related to company profit and sales in year 2021 and 2022. Deliver and pitch your topic in the best possible manner with this Impact Of Risk On The Financial Performance Of Real Managing Commercial Property Risks Sample PDF. Use them to share invaluable insights on Estate Business, Business Increased, Company Decreased and impress your audience. This template can be altered and modified as per your expectations. So, grab it now.
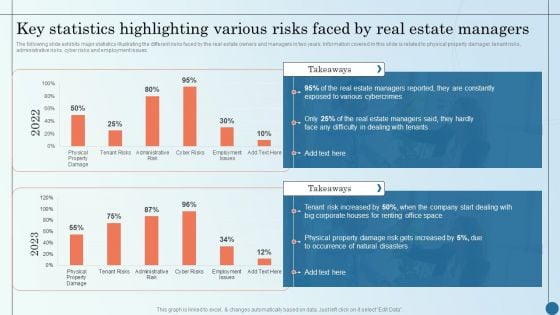
Key Statistics Highlighting Various Risks Faced By Real Managing Commercial Property Risks Elements PDF
The following slide exhibits major statistics illustrating the different risks faced by the real estate owners and managers in two years. Information covered in this slide is related to physical property damager, tenant risks, administrative risks, cyber risks and employment issues. Deliver and pitch your topic in the best possible manner with this Key Statistics Highlighting Various Risks Faced By Real Managing Commercial Property Risks Elements PDF. Use them to share invaluable insights on Various Cybercrimes, Estate Managers, Natural Disasters and impress your audience. This template can be altered and modified as per your expectations. So, grab it now.
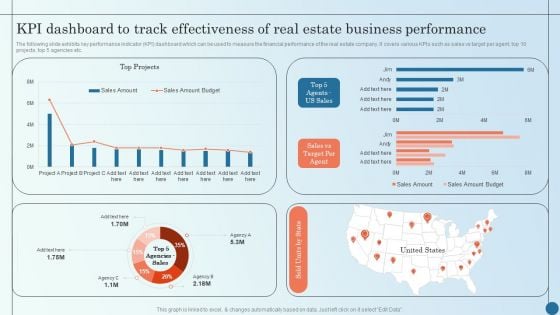
KPI Dashboard To Track Effectiveness Of Real Estate Business Managing Commercial Property Risks Demonstration PDF
The following slide exhibits key performance indicator KPI dashboard which can be used to measure the financial performance of the real estate company. It covers various KPIs such as sales vs target per agent, top 10 projects, top 5 agencies etc.Deliver an awe inspiring pitch with this creative KPI Dashboard To Track Effectiveness Of Real Estate Business Managing Commercial Property Risks Demonstration PDF bundle. Topics like Kpi Dashboard, Track Effectiveness, Estate Business can be discussed with this completely editable template. It is available for immediate download depending on the needs and requirements of the user.
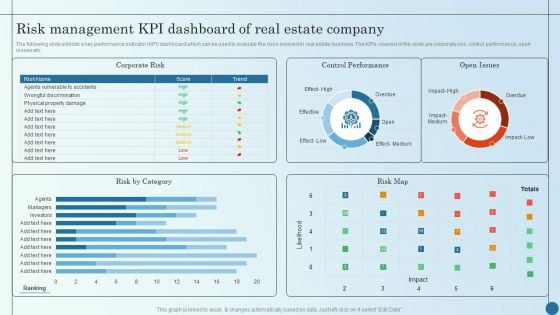
Risk Management KPI Dashboard Of Real Estate Company Managing Commercial Property Risks Elements PDF
The following slide exhibits a key performance indicator KPI dashboard which can be used to evaluate the risks involved in real estate business. The KPIs covered in the slide are corporate risk, control performance, open issues etc.Deliver an awe inspiring pitch with this creative Risk Management KPI Dashboard Of Real Estate Company Managing Commercial Property Risks Elements PDF bundle. Topics like Control Performance, Corporate Risk, Effect Medium can be discussed with this completely editable template. It is available for immediate download depending on the needs and requirements of the user.
Consumer Journey Mapping Techniques Dashboard For Tracking Customer Service Team Performance Summary PDF
This slide covers the KPI dashboard for analyzing the performance of client support department. It includes metrics such as first call resolution, unresolved calls, average response rate, the best day to call, average time to solve issues, etc. Pitch your topic with ease and precision using this Consumer Journey Mapping Techniques Dashboard For Tracking Customer Service Team Performance Summary PDF. This layout presents information on Dashboard For Tracking Customer, Service Team Performance. It is also available for immediate download and adjustment. So, changes can be made in the color, design, graphics or any other component to create a unique layout.
Consumer Journey Mapping Techniques Dashboard For Tracking Digital Content Performance Clipart PDF
This slide covers the KPI dashboard for analyzing online content. It includes metrics such as blog visitors, pageviews, newsletter conversion rate, new signups, new customers, etc. Showcasing this set of slides titled Consumer Journey Mapping Techniques Dashboard For Tracking Digital Content Performance Clipart PDF. The topics addressed in these templates are Purchase Amount, Customers, Tracking Digital Content Performance. All the content presented in this PPT design is completely editable. Download it and make adjustments in color, background, font etc. as per your unique business setting.
Consumer Journey Mapping Techniques Dashboard For Tracking Social Media Platforms Introduction PDF
This slide covers the KPI dashboard for analyzing social media channels. It includes metrics such as social media followers, Facebook daily reach, Facebook engaged users and page impressions, etc. Pitch your topic with ease and precision using this Consumer Journey Mapping Techniques Dashboard For Tracking Social Media Platforms Introduction PDF. This layout presents information on Linkedin Key Metrics, Social Media Followers, Awareness. It is also available for immediate download and adjustment. So, changes can be made in the color, design, graphics or any other component to create a unique layout.
Consumer Journey Mapping Techniques Loyalty Program Performance Tracking Dashboard Portrait PDF
This slide covers the KPI dashboard for analyzing customer loyalty campaign results. It includes metrics such as revenue, liability, NQP accrued, transaction count, members, redemption ratio, etc. Pitch your topic with ease and precision using this Consumer Journey Mapping Techniques Loyalty Program Performance Tracking Dashboard Portrait PDF. This layout presents information on Transaction Count, Revenue, Redemption Ratio. It is also available for immediate download and adjustment. So, changes can be made in the color, design, graphics or any other component to create a unique layout.
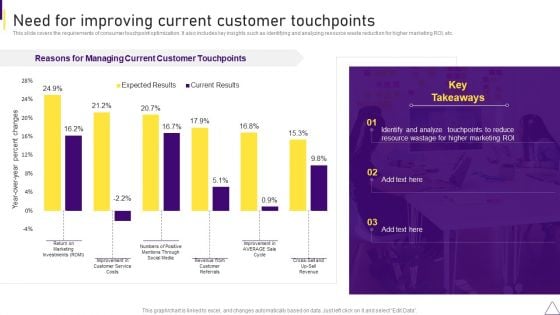
Consumer Journey Mapping Techniques Need For Improving Current Customer Touchpoints Microsoft PDF
This slide covers the requirements of consumer touchpoint optimization. It also includes key insights such as identifying and analyzing resource waste reduction for higher marketing ROI, etc. Showcasing this set of slides titled Consumer Journey Mapping Techniques Need For Improving Current Customer Touchpoints Microsoft PDF. The topics addressed in these templates are Social Media, Average Sale, Marketing. All the content presented in this PPT design is completely editable. Download it and make adjustments in color, background, font etc. as per your unique business setting.
Consumer Journey Mapping Techniques Online Ad Campaign Performance Tracking Dashboard Topics PDF
This slide covers the KPI dashboard for measuring digital campaign results. It includes metrics such as Ad cost, clicks, impressions, CTR, cost per click, conversions, conversion rate, cost per click, cost per thousand impressions, etc. Showcasing this set of slides titled Consumer Journey Mapping Techniques Online Ad Campaign Performance Tracking Dashboard Topics PDF. The topics addressed in these templates are Conversation Rate, Cost Per Conversion. All the content presented in this PPT design is completely editable. Download it and make adjustments in color, background, font etc. as per your unique business setting.
Consumer Journey Mapping Techniques Referral Program Performance Tracking Dashboard Formats PDF
This slide covers the KPI dashboard for analyzing referral campaign results. It includes metrics such as total revenue generated, monthly recurring revenue, new customers, clicks, cancelled customers, paying customers, etc. Showcasing this set of slides titled Consumer Journey Mapping Techniques Referral Program Performance Tracking Dashboard Formats PDF. The topics addressed in these templates are Revenue, New Customers, Paying Customers. All the content presented in this PPT design is completely editable. Download it and make adjustments in color, background, font etc. as per your unique business setting.
Dashboard For Tracking Customer Service Team Performance Information PDF
This slide covers the KPI dashboard for analyzing the performance of client support department. It includes metrics such as first call resolution, unresolved calls, average response rate, the best day to call, average time to solve issues, etc. Deliver an awe inspiring pitch with this creative Dashboard For Tracking Customer Service Team Performance Information PDF bundle. Topics like Dashboard For Tracking Customer, Service Team Performance can be discussed with this completely editable template. It is available for immediate download depending on the needs and requirements of the user.
Online Ad Campaign Performance Tracking Dashboard Demonstration PDF
This slide covers the KPI dashboard for measuring digital campaign results. It includes metrics such as Ad cost, clicks, impressions, CTR, cost per click, conversions, conversion rate, cost per click, cost per thousand impressions, etc. Deliver and pitch your topic in the best possible manner with this Online Ad Campaign Performance Tracking Dashboard Demonstration PDF. Use them to share invaluable insights on Online Ad Campaign Performance, Tracking Dashboard and impress your audience. This template can be altered and modified as per your expectations. So, grab it now.
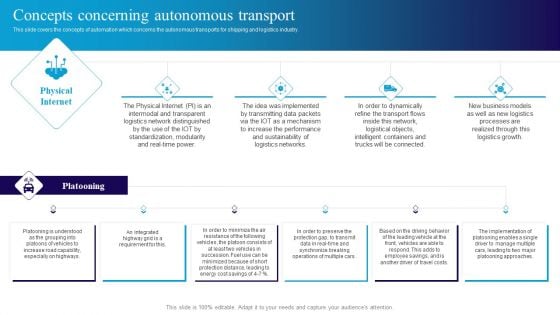
Deploying Automation In Logistics To Improve Concepts Concerning Autonomous Transport Rules PDF
This slide covers the current order accuracy status in the company in terms of accurate and inaccurate percentages.From laying roadmaps to briefing everything in detail, our templates are perfect for you. You can set the stage with your presentation slides. All you have to do is download these easy to edit and customizable templates. Deploying Automation In Logistics To Improve Concepts Concerning Autonomous Transport Rules PDF will help you deliver an outstanding performance that everyone would remember and praise you for. Do download this presentation today.
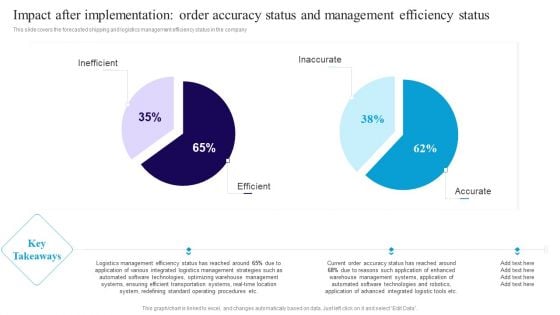
Impact After Implementation Order Accuracy Status And Management Efficiency Status Inspiration PDF
This slide covers the forecasted shipping and logistics management efficiency status in the company. Slidegeeks has constructed Impact After Implementation Order Accuracy Status And Management Efficiency Status Inspiration PDF after conducting extensive research and examination. These presentation templates are constantly being generated and modified based on user preferences and critiques from editors. Here, you will find the most attractive templates for a range of purposes while taking into account ratings and remarks from users regarding the content. This is an excellent jumping off point to explore our content and will give new users an insight into our top notch PowerPoint Templates.
Shipping And Logistics Tracking Dashboard With Shipments And Fleet Status Elements PDF
This slide covers Key performance indicators to track the automation system of the company. This dashboard includes Logistics Efficiency Status, delivery time accuracy etc. Take your projects to the next level with our ultimate collection of Shipping And Logistics Tracking Dashboard With Shipments And Fleet Status Elements PDF. Slidegeeks has designed a range of layouts that are perfect for representing task or activity duration, keeping track of all your deadlines at a glance. Tailor these designs to your exact needs and give them a truly corporate look with your own brand colors they ll make your projects stand out from the rest.
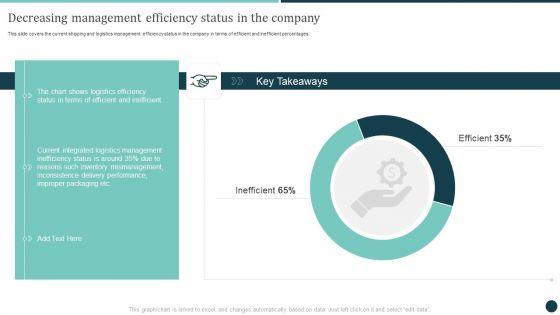
Decreasing Management Efficiency Status In The Company Logistics Strategy To Improve Slides PDF
This slide covers the current shipping and logistics management efficiency status in the company in terms of efficient and inefficient percentages.This Decreasing Management Efficiency Status In The Company Logistics Strategy To Improve Slides PDF from Slidegeeks makes it easy to present information on your topic with precision. It provides customization options, so you can make changes to the colors, design, graphics, or any other component to create a unique layout. It is also available for immediate download, so you can begin using it right away. Slidegeeks has done good research to ensure that you have everything you need to make your presentation stand out. Make a name out there for a brilliant performance.
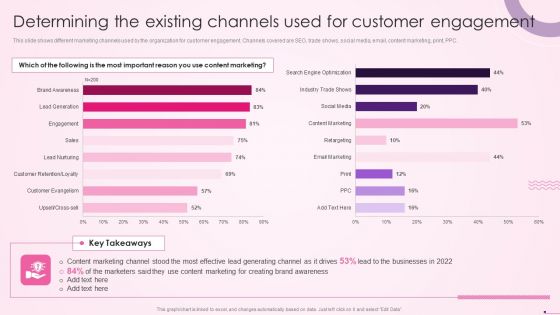
Determining The Existing Channels Used For Customer Engagement Social Media Content Topics PDF
This slide shows different marketing channels used by the organization for customer engagement. Channels covered are SEO, trade shows, social media, email, content marketing, print, PPC.From laying roadmaps to briefing everything in detail, our templates are perfect for you. You can set the stage with your presentation slides. All you have to do is download these easytoedit and customizable templates. Determining The Existing Channels Used For Customer Engagement Social Media Content Topics PDF will help you deliver an outstanding performance that everyone would remember and praise you for. Do download this presentation today.
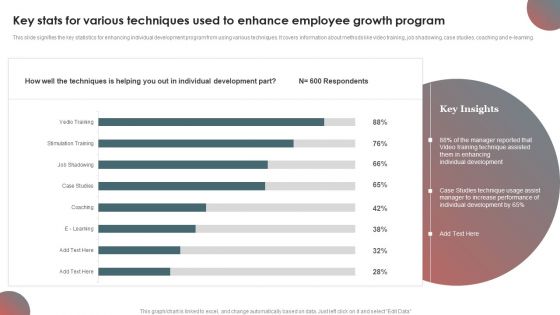
Key Stats For Various Techniques Used To Enhance Employee Growth Program Information PDF
This slide signifies the key statistics for enhancing individual development program from using various techniques. It covers information about methods like video training, job shadowing, case studies, coaching and e-learning.Pitch your topic with ease and precision using this Key Stats For Various Techniques Used To Enhance Employee Growth Program Information PDF. This layout presents information on Manager Reported, Technique Assisted, Them Enhancing. It is also available for immediate download and adjustment. So, changes can be made in the color, design, graphics or any other component to create a unique layout.
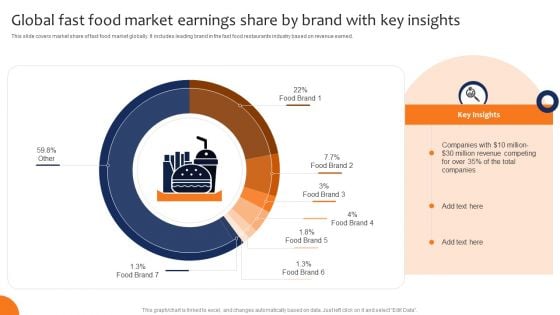
Global Fast Food Market Earnings Share By Brand With Key Insights Structure PDF
This slide covers market share of fast food market globally. It includes leading brand in the fast food restaurants industry based on revenue earned. Showcasing this set of slides titled Global Fast Food Market Earnings Share By Brand With Key Insights Structure PDF. The topics addressed in these templates are Global, Market Earnings Share, Brand With Key Insights. All the content presented in this PPT design is completely editable. Download it and make adjustments in color, background, font etc. as per your unique business setting.
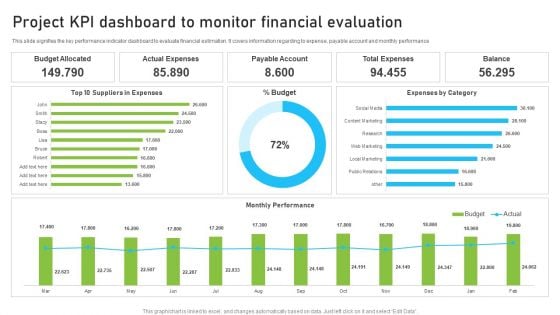
Project KPI Dashboard To Monitor Financial Evaluation Background PDF
This slide signifies the construction project management projection plan. It covers information regarding to the estimate ID, Task, effort hours, resource quantity, performance factor and duration evaluation. Pitch your topic with ease and precision using this Project KPI Dashboard To Monitor Financial Evaluation Background PDF. This layout presents information on Actual Expenses, Payable Account, Budget Allocated. It is also available for immediate download and adjustment. So, changes can be made in the color, design, graphics or any other component to create a unique layout.
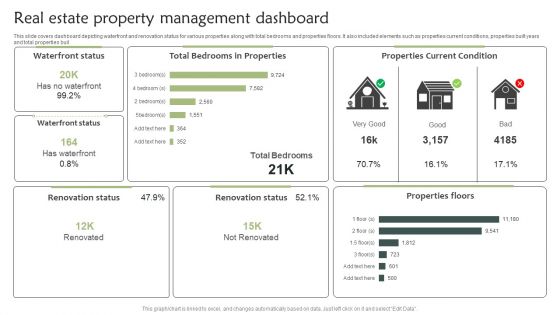
Real Estate Property Management Dashboard Introduction PDF
This slide covers dashboard depicting waterfront and renovation status for various properties along with total bedrooms and properties floors. It also included elements such as properties current conditions, properties built years and total properties buil. Pitch your topic with ease and precision using this Real Estate Property Management Dashboard Introduction PDF. This layout presents information on Real Estate Property, Management Dashboard. It is also available for immediate download and adjustment. So, changes can be made in the color, design, graphics or any other component to create a unique layout.
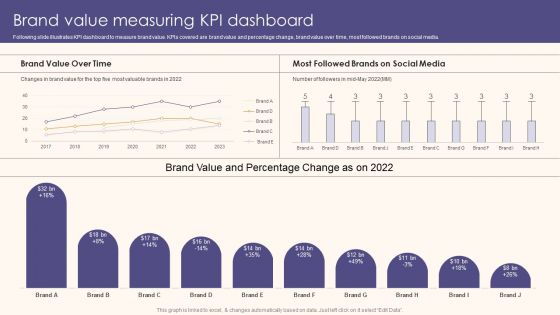
Brand Value Measuring KPI Dashboard Guide To Understand Evaluate And Enhance Brand Value Slides PDF
Following slide illustrates KPI dashboard to measure brand value. KPIs covered are brand value and percentage change, brand value over time, most followed brands on social media.Take your projects to the next level with our ultimate collection of Brand Value Measuring KPI Dashboard Guide To Understand Evaluate And Enhance Brand Value Slides PDF. Slidegeeks has designed a range of layouts that are perfect for representing task or activity duration, keeping track of all your deadlines at a glance. Tailor these designs to your exact needs and give them a truly corporate look with your own brand colors they all make your projects stand out from the rest
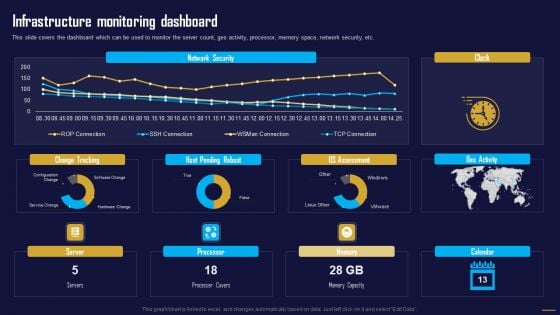
Infrastructure Monitoring Dashboard Information Tech System Maintenance Pictures PDF
This slide covers the dashboard which can be used to monitor the server count, geo activity, processor, memory space, network security, etc.Crafting an eye-catching presentation has never been more straightforward. Let your presentation shine with this tasteful yet straightforward Infrastructure Monitoring Dashboard Information Tech System Maintenance Pictures PDF template. It offers a minimalistic and classy look that is great for making a statement. The colors have been employed intelligently to add a bit of playfulness while still remaining professional. Construct the ideal Infrastructure Monitoring Dashboard Information Tech System Maintenance Pictures PDF that effortlessly grabs the attention of your audience Begin now and be certain to wow your customers.
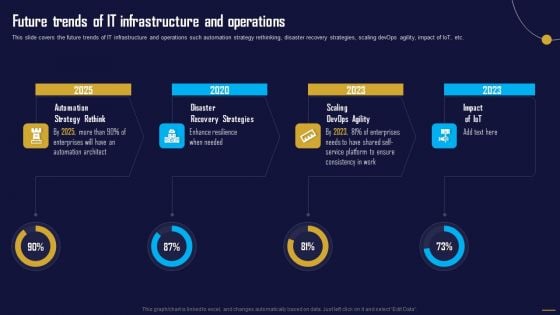
Future Trends Of IT Infrastructure And Operations Information Tech System Maintenance Ideas PDF
This slide covers the future trends of IT infrastructure and operations such automation strategy rethinking, disaster recovery strategies, scaling devOps agility, impact of IoT, etc. Find a pre-designed and impeccable Future Trends Of IT Infrastructure And Operations Information Tech System Maintenance Ideas PDF. The templates can ace your presentation without additional effort. You can download these easy to edit presentation templates to make your presentation stand out from others. So, what are you waiting for Download the template from Slidegeeks today and give a unique touch to your presentation.
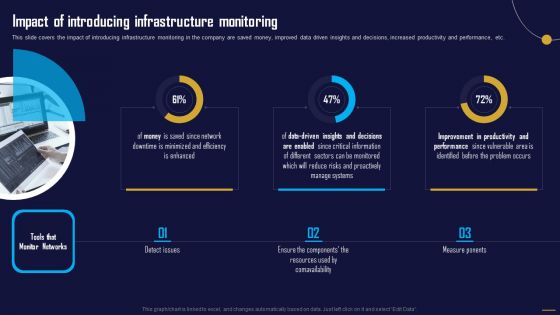
Impact Of Introducing Infrastructure Monitoring Information Tech System Maintenance Guidelines PDF
This slide covers the impact of introducing infrastructure monitoring in the company are saved money, improved data driven insights and decisions, increased productivity and performance, etc. Boost your pitch with our creative Impact Of Introducing Infrastructure Monitoring Information Tech System Maintenance Guidelines PDF. Deliver an awe-inspiring pitch that will mesmerize everyone. Using these presentation templates you will surely catch everyones attention. You can browse the ppts collection on our website. We have researchers who are experts at creating the right content for the templates. So you don not have to invest time in any additional work. Just grab the template now and use them.


 Continue with Email

 Home
Home


