Layer Diagram
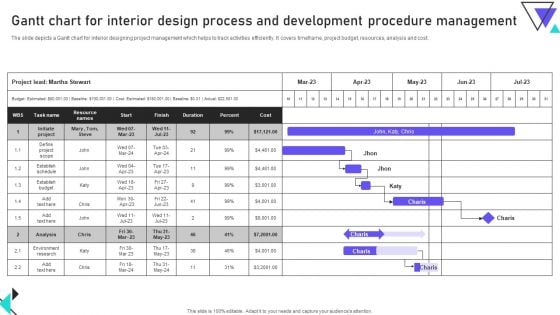
Gantt Chart For Interior Design Process And Development Procedure Management Diagrams PDF
The slide depicts a Gantt chart for interior designing project management which helps to track activities efficiently. It covers timeframe, project budget, resources, analysis and cost. Showcasing this set of slides titled Gantt Chart For Interior Design Process And Development Procedure Management Diagrams PDF. The topics addressed in these templates are Cost, Establish Budget, Development Procedure Management. All the content presented in this PPT design is completely editable. Download it and make adjustments in color, background, font etc. as per your unique business setting.
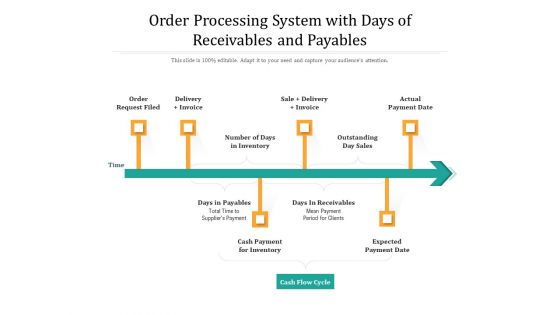
Order Processing System With Days Of Receivables And Payables Ppt PowerPoint Presentation Gallery Diagrams PDF
Persuade your audience using this order processing system with days of receivables and payables ppt powerpoint presentation gallery diagrams pdf. This PPT design covers six stages, thus making it a great tool to use. It also caters to a variety of topics including order request filed, delivery invoice, sale delivery invoice, actual payment date, number of days in inventory, outstanding day sales, days in payables, days in receivables, cash payment for inventory, expected payment date, cash flow cycle. Download this PPT design now to present a convincing pitch that not only emphasizes the topic but also showcases your presentation skills.
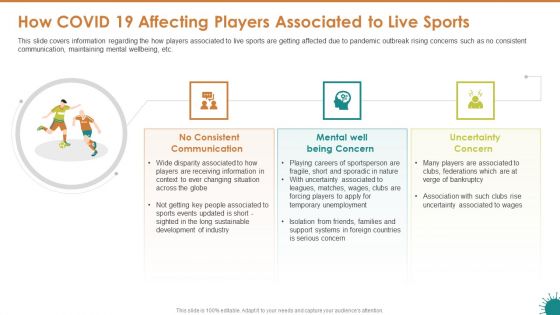
How COVID 19 Affecting Players Associated To Live Sports Diagrams PDF
This slide covers information regarding the how players associated to live sports are getting affected due to pandemic outbreak rising concerns such as no consistent communication, maintaining mental wellbeing, etc. Presenting how covid 19 affecting players associated to live sports diagrams pdf to provide visual cues and insights. Share and navigate important information on three stages that need your due attention. This template can be used to pitch topics like sustainable development, communication, uncertainty concern. In addition, this PPT design contains high-resolution images, graphics, etc, that are easily editable and available for immediate download.
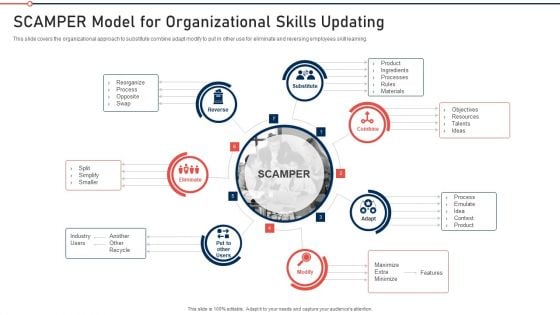
Modernization And Product Scamper Model For Organizational Skills Updating Diagrams PDF
This slide covers the organizational approach to substitute combine adapt modify to put in other use for eliminate and reversing employees skill learning. This is a modernization and product scamper model for organizational skills updating diagrams pdf template with various stages. Focus and dispense information on seven stages using this creative set, that comes with editable features. It contains large content boxes to add your information on topics like reverse, substitute, combine, adapt od, eliminate. You can also showcase facts, figures, and other relevant content using this PPT layout. Grab it now.
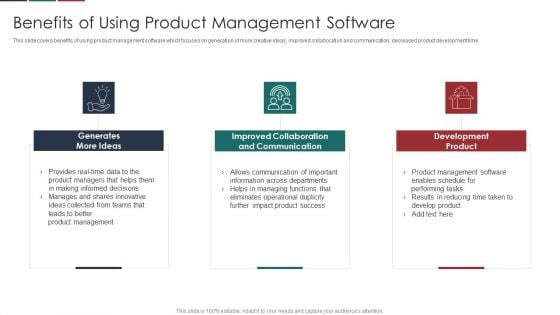
Deliver Efficiency Innovation Benefits Of Using Product Management Software Diagrams PDF
This slide covers benefits of using product management software which focuses on generation of more creative ideas, improved collaboration and communication, decreased product development time. Presenting Deliver Efficiency Innovation Benefits Of Using Product Management Software Diagrams PDF to provide visual cues and insights. Share and navigate important information on three stages that need your due attention. This template can be used to pitch topics like Generates More Ideas, Improved Collaboration And Communication, Development Product. In addtion, this PPT design contains high resolution images, graphics, etc, that are easily editable and available for immediate download.
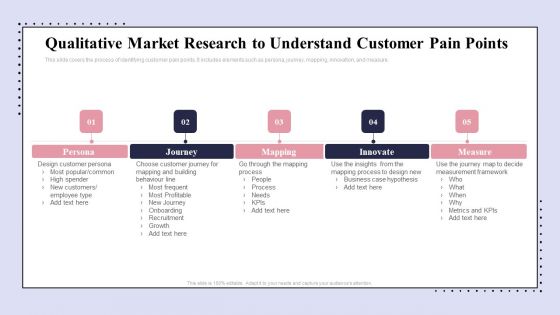
Brand Promotion Communication Strategy Qualitative Market Research To Understand Diagrams PDF
This slide covers the process of identifying customer pain points. It includes elements such as persona, journey, mapping, innovation, and measure. This is a Brand Promotion Communication Strategy Qualitative Market Research To Understand Diagrams PDF template with various stages. Focus and dispense information on five stages using this creative set, that comes with editable features. It contains large content boxes to add your information on topics like Persona, Journey, Mapping, Innovate. You can also showcase facts, figures, and other relevant content using this PPT layout. Grab it now.
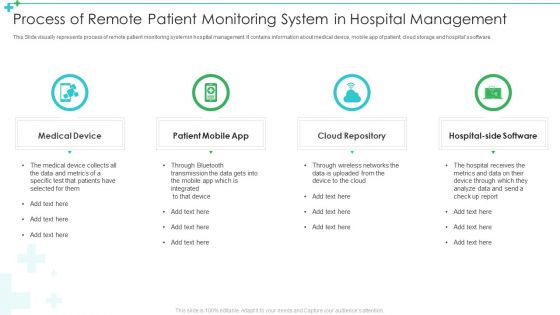
Process Of Remote Patient Monitoring System In Hospital Management Diagrams PDF
This Slide visually represents process of remote patient monitoring system in hospital management. It contains information about medical device, mobile app of patient, cloud storage and hospitals software. Persuade your audience using this Process Of Remote Patient Monitoring System In Hospital Management Diagrams PDF. This PPT design covers four stages, thus making it a great tool to use. It also caters to a variety of topics including Medical Device, Patient Mobile App, Cloud Repository, Hospital Side Software. Download this PPT design now to present a convincing pitch that not only emphasizes the topic but also showcases your presentation skills.
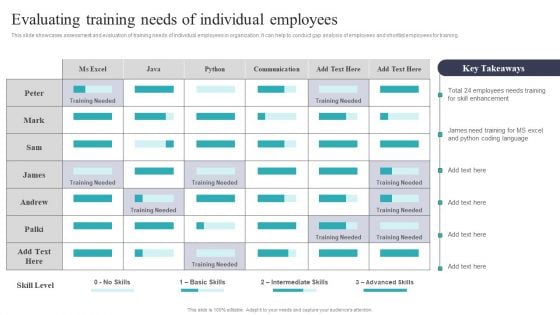
Developing And Executing On Job Coaching Program In Company Evaluating Training Needs Diagrams PDF
Retrieve professionally designed Developing And Executing On Job Coaching Program In Company Evaluating Training Needs Diagrams PDF to effectively convey your message and captivate your listeners. Save time by selecting pre-made slideshows that are appropriate for various topics, from business to educational purposes. These themes come in many different styles, from creative to corporate, and all of them are easily adjustable and can be edited quickly. Access them as PowerPoint templates or as Google Slides themes. You dont have to go on a hunt for the perfect presentation because Slidegeeks got you covered from everywhere.
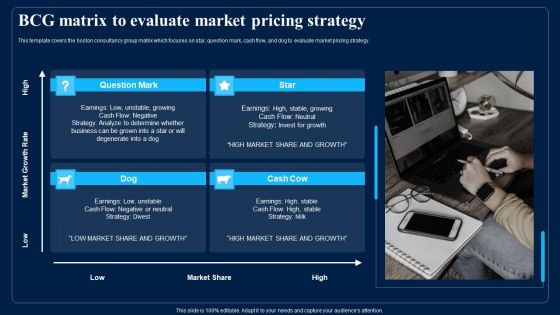
Identifying Optimum Pricing Methods For Business Bcg Matrix To Evaluate Market Pricing Strategy Diagrams PDF
This template covers the boston consultancy group matrix which focuses on star, question mark, cash flow, and dog to evaluate market pricing strategy. This is a Identifying Optimum Pricing Methods For Business Bcg Matrix To Evaluate Market Pricing Strategy Diagrams PDF template with various stages. Focus and dispense information on four stages using this creative set, that comes with editable features. It contains large content boxes to add your information on topics like Strategy, Market Share, Growth. You can also showcase facts, figures, and other relevant content using this PPT layout. Grab it now.
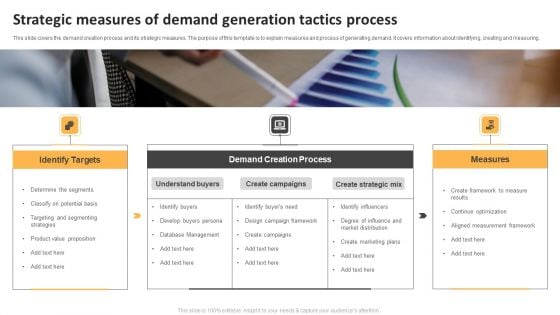
Strategic Measures Of Demand Generation Tactics Process Ppt Professional Diagrams PDF
This slide covers the demand creation process and its strategic measures. The purpose of this template is to explain measures and process of generating demand. It covers information about identifying, creating and measuring. Presenting Strategic Measures Of Demand Generation Tactics Process Ppt Professional Diagrams PDF to dispense important information. This template comprises three stages. It also presents valuable insights into the topics including Identify Targets, Demand Creation Process, Measures. This is a completely customizable PowerPoint theme that can be put to use immediately. So, download it and address the topic impactfully.
Iot In Agriculture Industry Market Size And Growth Ppt PowerPoint Presentation Icon Diagrams PDF
This slide covers market size of IOT enabled modern farming strategies. It also includes elements such key drivers to promote IOT for smart farming, market segmentation based on components, applications used and geography along with CAGR and market size. Presenting Iot In Agriculture Industry Market Size And Growth Ppt PowerPoint Presentation Icon Diagrams PDF to dispense important information. This template comprises one stages. It also presents valuable insights into the topics including Market Segmentation, Drivers, Geography. This is a completely customizable PowerPoint theme that can be put to use immediately. So, download it and address the topic impactfully.

Market Overview Fitness Industry How Often Do People Use Health And Fitness Apps Diagrams PDF
This slide covers average weekly session frequency of health and fitness app users . Over 75 percent of active users open their health and fitness app at least two times a week. Deliver an awe-inspiring pitch with this creative market overview fitness industry how often do people use health and fitness apps diagrams pdf bundle. Topics like people use health and fitness apps can be discussed with this completely editable template. It is available for immediate download depending on the needs and requirements of the user.
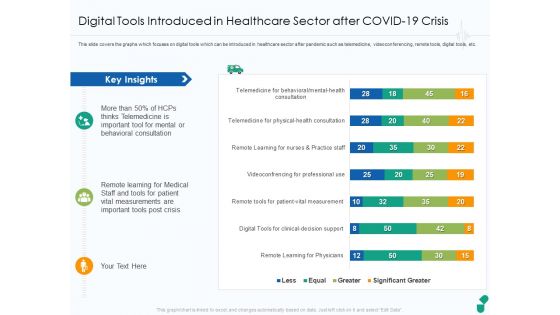
Digital Tools Introduced In Healthcare Sector After COVID 19 Crisis Ppt Outline Diagrams PDF
This slide covers the graphs which focuses on digital tools which can be introduced in healthcare sector after pandemic such as telemedicine, videoconferencing, remote tools, digital tools, etc. Deliver an awe-inspiring pitch with this creative digital tools introduced in healthcare sector after covid 19 crisis ppt outline diagrams pdf bundle. Topics like key insights, patient vital measurements, important tools post crisis, behavioral consultation can be discussed with this completely editable template. It is available for immediate download depending on the needs and requirements of the user.
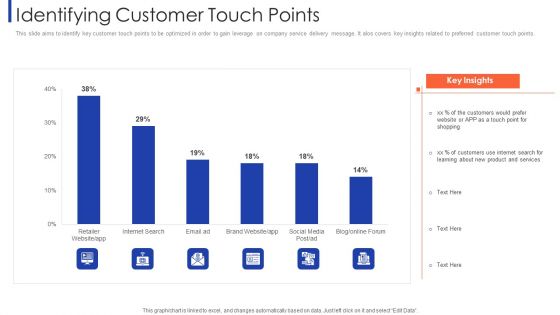
Customer Relationship Strategy For Building Loyalty Identifying Customer Touch Points Diagrams PDF
This slide aims to identify key customer touch points to be optimized in order to gain leverage on company service delivery message. It alos covers key insights related to preferred customer touch points. Deliver an awe inspiring pitch with this creative customer relationship strategy for building loyalty identifying customer touch points diagrams pdf bundle. Topics like retailer website, internet search, brand website, social media can be discussed with this completely editable template. It is available for immediate download depending on the needs and requirements of the user.
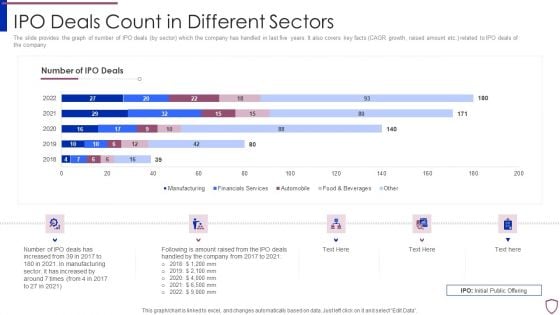
Financing Catalogue For Security Underwriting Agreement IPO Deals Count In Different Sectors Diagrams PDF
The slide provides the graph of number of IPO deals by sector which the company has handled in last five years. It also covers key facts CAGR growth, raised amount etc. related to IPO deals of the company. Deliver an awe inspiring pitch with this creative financing catalogue for security underwriting agreement ipo deals count in different sectors diagrams pdf bundle. Topics like manufacturing, financial services, automobile, food and beverages can be discussed with this completely editable template. It is available for immediate download depending on the needs and requirements of the user.
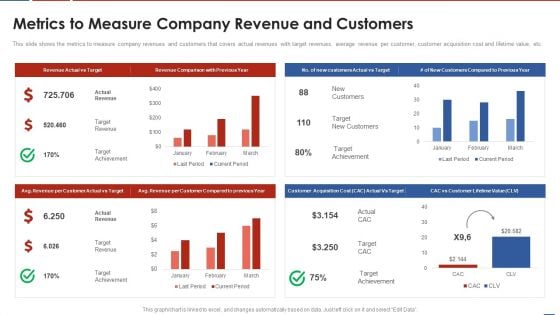
Formulating Product Development Action Plan To Enhance Client Experience Metrics To Measure Company Diagrams PDF
This slide shows the metrics to measure company revenues and customers that covers actual revenues with target revenues, average revenue per customer, customer acquisition cost and lifetime value, etc. Deliver and pitch your topic in the best possible manner with this formulating product development action plan to enhance client experience metrics to measure company diagrams pdf. Use them to share invaluable insights on target revenues, average revenue per customer, customer acquisition cost, lifetime value and impress your audience. This template can be altered and modified as per your expectations. So, grab it now.
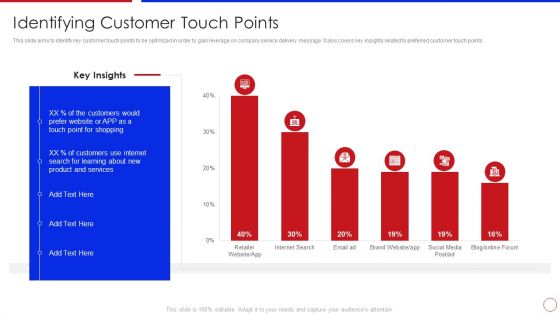
Strategy To Enhance Buyer Intimacy Identifying Customer Touch Points Ppt Infographics Diagrams PDF
This slide aims to identify key customer touch points to be optimized in order to gain leverage on company service delivery message. It alos covers key insights related to preferred customer touch points. Deliver and pitch your topic in the best possible manner with this strategy to enhance buyer intimacy identifying customer touch points ppt infographics diagrams pdf. Use them to share invaluable insights on identifying customer touch points and impress your audience. This template can be altered and modified as per your expectations. So, grab it now.
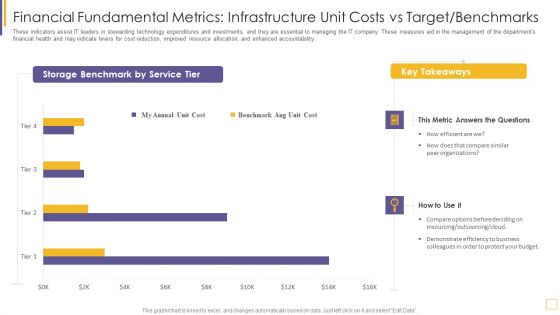
Guidelines For Exhibiting Business Value Of Information And Technology Financial Fundamental Metrics Diagrams PDF
This template covers fundamental financial metrics IT spend vs Plan for both opex and capex budgets, and application and service total cost, which aligns business value communication to IT values. Deliver and pitch your topic in the best possible manner with this guidelines for exhibiting business value of information and technology financial fundamental metrics diagrams pdf. Use them to share invaluable insights on metric, budget, accountability, planned and impress your audience. This template can be altered and modified as per your expectations. So, grab it now.
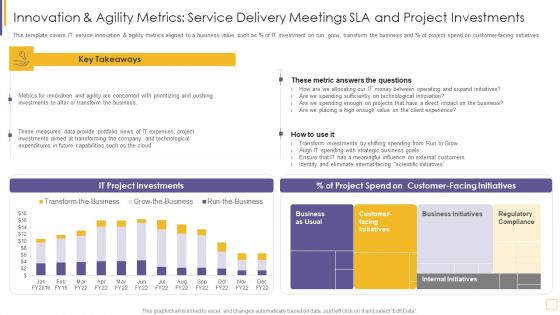
Guidelines For Exhibiting Business Value Of Information And Technology Innovation And Agility Metrics Diagrams PDF
This template covers IT service innovation and agility metrics aligned to a business value such as percentage of IT investment on run, grow, transform the business and percentage of project spend on customer facing initiatives. Deliver an awe inspiring pitch with this creative guidelines for exhibiting business value of information and technology innovation and agility metrics diagrams pdf bundle. Topics like measures, investments, expenses, technological, capabilities can be discussed with this completely editable template. It is available for immediate download depending on the needs and requirements of the user.
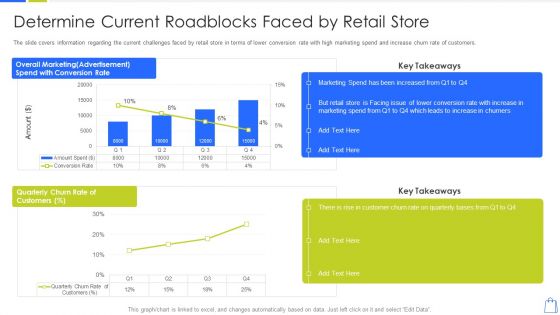
Redefining Experiential Retail Marketing Determine Current Roadblocks Faced By Retail Store Diagrams PDF
The slide covers information regarding the current challenges faced by retail store in terms of lower conversion rate with high marketing spend and increase churn rate of customers. Deliver and pitch your topic in the best possible manner with this redefining experiential retail marketing determine current roadblocks faced by retail store diagrams pdf. Use them to share invaluable insights on determine current roadblocks faced by retail store and impress your audience. This template can be altered and modified as per your expectations. So, grab it now.
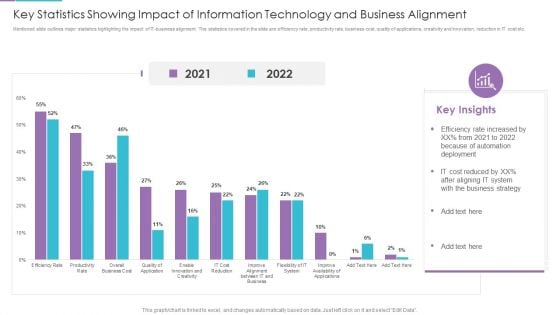
Key Statistics Showing Impact Of Information Technology And Business Alignment Diagrams PDF
Mentioned slide outlines major statistics highlighting the impact of IT business alignment. The statistics covered in the slide are efficiency rate, productivity rate, business cost, quality of applications, creativity and innovation, reduction in IT cost etc. Showcasing this set of slides titled key statistics showing impact of information technology and business alignment diagrams pdf. The topics addressed in these templates are reduced, system, business strategy. All the content presented in this PPT design is completely editable. Download it and make adjustments in color, background, font etc. as per your unique business setting.
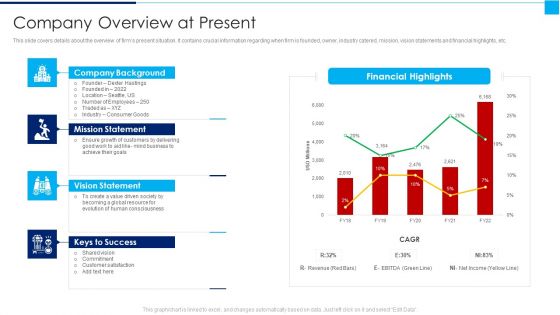
Ways To Enhance Organizations Profitability Company Overview At Present Diagrams PDF
This slide covers details about the overview of firms present situation. It contains crucial information regarding when firm is founded, owner, industry catered, mission, vision statements and financial highlights, etc. Deliver and pitch your topic in the best possible manner with this ways to enhance organizations profitability company overview at present diagrams pdf Use them to share invaluable insights on mission statement, vision statement, keys to success and impress your audience. This template can be altered and modified as per your expectations. So, grab it now.
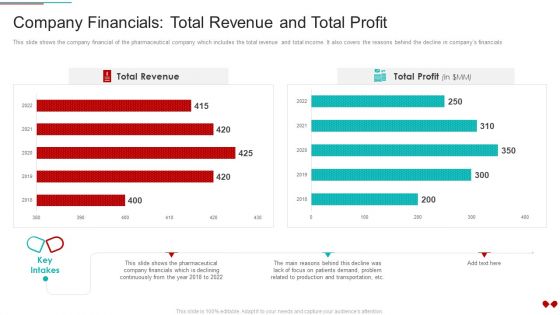
Environmental Impact Analysis For A Pharmaceutical Company Financials Total Revenue And Total Profit Diagrams PDF
This slide shows the company financial of the pharmaceutical company which includes the total revenue and total income. It also covers the reasons behind the decline in companys financialsDeliver an awe inspiring pitch with this creative Environmental Impact Analysis For A Pharmaceutical Company Financials Total Revenue And Total Profit Diagrams PDF bundle. Topics like Company Financials Total Revenue And Total Profit can be discussed with this completely editable template. It is available for immediate download depending on the needs and requirements of the user.
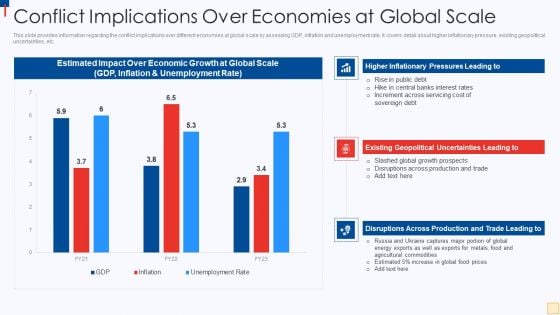
Ukraine Vs Russia Examining Conflict Implications Over Economies At Global Scale Diagrams PDF
This slide provides information regarding the conflict implications over different economies at global scale by assessing GDP, inflation and unemployment rate. It covers detail about higher inflationary pressure, existing geopolitical uncertainties, etc. Deliver and pitch your topic in the best possible manner with this Ukraine Vs Russia Examining Conflict Implications Over Economies At Global Scale Diagrams PDF. Use them to share invaluable insights on Estimated Impact Over, Economic Growth, Global Scale, GDP, Inflation And Unemployment Rate and impress your audience. This template can be altered and modified as per your expectations. So, grab it now.
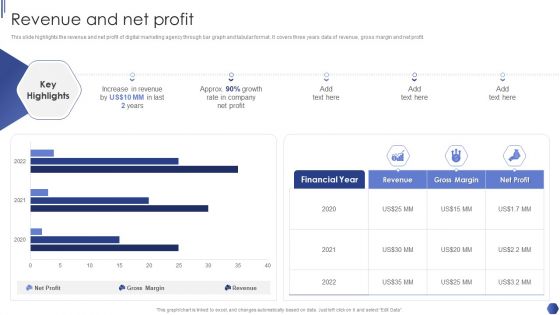
Digital Marketing Agency Business Profile Revenue And Net Profit Diagrams PDF
This slide highlights the revenue and net profit of digital marketing agency through bar graph and tabular format. It covers three years data of revenue, gross margin and net profit. Deliver and pitch your topic in the best possible manner with this Digital Marketing Agency Business Profile Revenue And Net Profit Diagrams PDF. Use them to share invaluable insights on Increase In Revenue, Growth Rate, Net Profit and impress your audience. This template can be altered and modified as per your expectations. So, grab it now.

Retail Merchandising Program Decline In Return On Investment For Past 4 Years Diagrams PDF
This slide shows the graphical representation that covers the yearly decline in return on investments due to multiple reasons such as inappropriate sales forecasting, excessive inventory level, poor vendor selection, etc. Deliver and pitch your topic in the best possible manner with this Retail Merchandising Program Decline In Return On Investment For Past 4 Years Diagrams PDF. Use them to share invaluable insights on Yearly Return, Investments, Poor Vendor Selection, 2019 To 2022 and impress your audience. This template can be altered and modified as per your expectations. So, grab
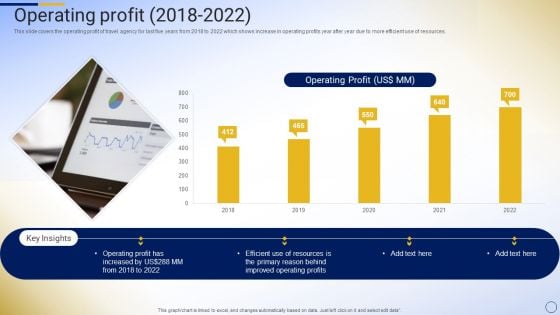
Online Tour And Travel Company Profile Operating Profit 2018 To 2022 Diagrams PDF
This slide covers the operating profit of travel agency for last five years from 2018 to 2022 which shows increase in operating profits year after year due to more efficient use of resources.Deliver and pitch your topic in the best possible manner with this Online Tour And Travel Company Profile Operating Profit 2018 To 2022 Diagrams PDF. Use them to share invaluable insights on Operating Profit, Improved Operating, Primary Reason and impress your audience. This template can be altered and modified as per your expectations. So, grab it now.
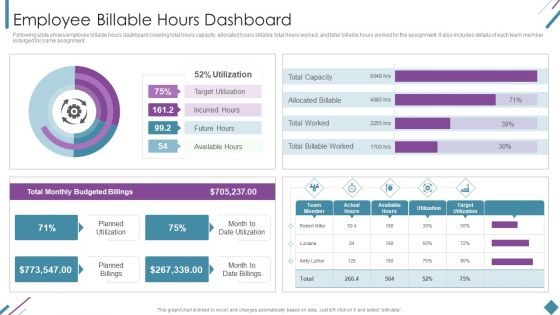
Metrics To Measure Business Performance Employee Billable Hours Dashboard Diagrams PDF
Following slide shows employee billable hours dashboard covering total hours capacity, allocated hours billable, total hours worked, and total billable hours worked for the assignment. It also includes details of each team member indulged for same assignment. Deliver an awe inspiring pitch with this creative Metrics To Measure Business Performance Employee Billable Hours Dashboard Diagrams PDF bundle. Topics like Total Monthly, Budgeted Billings, Planned Utilization can be discussed with this completely editable template. It is available for immediate download depending on the needs and requirements of the user.
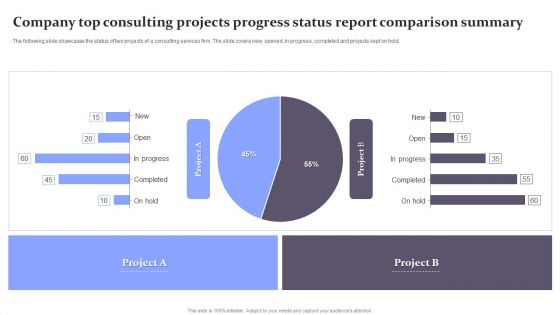
Company Top Consulting Projects Progress Status Report Comparison Summary Diagrams PDF
The following slide showcases the status of two projects of a consulting services firm. The slide covers new, opened, in progress, completed and projects kept on hold. Pitch your topic with ease and precision using this Company Top Consulting Projects Progress Status Report Comparison Summary Diagrams PDF. This layout presents information on Company Top Consulting Projects Progress, Status Report Comparison Summary. It is also available for immediate download and adjustment. So, changes can be made in the color, design, graphics or any other component to create a unique layout.
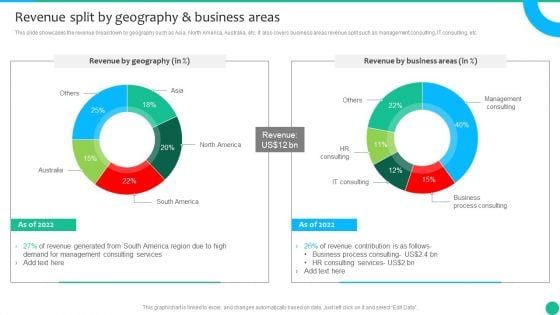
Strategic Management Consultancy Business Profile Revenue Split By Geography And Business Areas Diagrams PDF
This slide showcases the revenue breakdown by geography such as Asia, North America, Australia, etc. It also covers business areas revenue split such as management consulting, IT consulting, etc. Deliver and pitch your topic in the best possible manner with this Strategic Management Consultancy Business Profile Revenue Split By Geography And Business Areas Diagrams PDF. Use them to share invaluable insights on Demand For Management, Consulting Services, Revenue and impress your audience. This template can be altered and modified as per your expectations. So, grab it now.
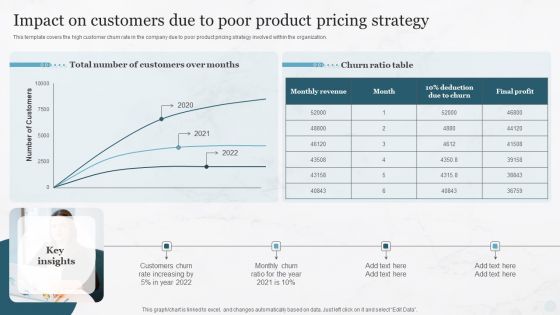
Impact On Customers Due To Poor Product Pricing Strategy Pricing Strategies For New Diagrams PDF
This template covers the high customer churn rate in the company due to poor product pricing strategy involved within the organization.Present like a pro with Impact On Customers Due To Poor Product Pricing Strategy Pricing Strategies For New Diagrams PDF Create beautiful presentations together with your team, using our easy-to-use presentation slides. Share your ideas in real-time and make changes on the fly by downloading our templates. So whether you are in the office, on the go, or in a remote location, you can stay in sync with your team and present your ideas with confidence. With Slidegeeks presentation got a whole lot easier. Grab these presentations today.
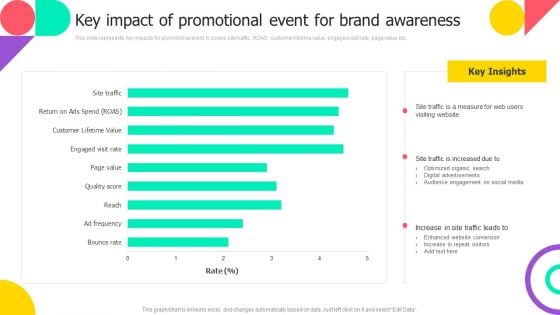
Brand Engagement Promotional Campaign Implementation Key Impact Of Promotional Event For Brand Awareness Diagrams PDF
This slide represents key impacts for promotional event. It covers site traffic, ROAS, customer lifetime value, engaged visit rate, page value etc. Find a pre designed and impeccable Brand Engagement Promotional Campaign Implementation Key Impact Of Promotional Event For Brand Awareness Diagrams PDF. The templates can ace your presentation without additional effort. You can download these easy to edit presentation templates to make your presentation stand out from others. So, what are you waiting for Download the template from Slidegeeks today and give a unique touch to your presentation.
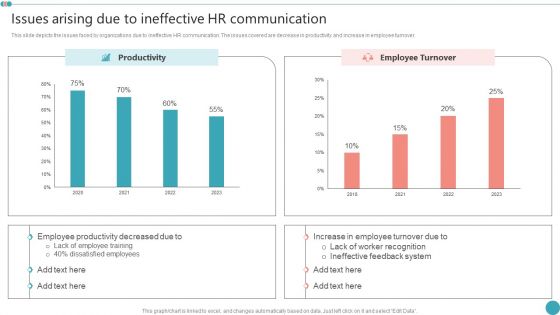
Issues Arising Due To Ineffective HR Communication Employee Engagement HR Strategy At Organization Diagrams PDF
This slide depicts the issues faced by organizations due to ineffective HR communication. The issues covered are decrease in productivity and increase in employee turnover.Want to ace your presentation in front of a live audience Our Issues Arising Due To Ineffective HR Communication Employee Engagement HR Strategy At Organization Diagrams PDF can help you do that by engaging all the users towards you.. Slidegeeks experts have put their efforts and expertise into creating these impeccable powerpoint presentations so that you can communicate your ideas clearly. Moreover, all the templates are customizable, and easy-to-edit and downloadable. Use these for both personal and commercial use.

Comprehensive Market Research Guide Growth Opportunities In Market Research Industry Diagrams PDF
The following slide outlines market size of global market research industry. Information covered in this slide is related to projected revenue from 2022 to 2030 and compound annual growth rate CAGR. Make sure to capture your audiences attention in your business displays with our gratis customizable Comprehensive Market Research Guide Growth Opportunities In Market Research Industry Diagrams PDF. These are great for business strategies, office conferences, capital raising or task suggestions. If you desire to acquire more customers for your tech business and ensure they stay satisfied, create your own sales presentation with these plain slides.

Identifying And Increasing Brand Awareness Current Issues Faced By Company Diagrams PDF
This slide covers the current issues faced by company such as rise in bounce rate and low conversion rate due to low-quality content, slow loading time, ad heavy images, lack of sufficient information, poor website performance, etc. Want to ace your presentation in front of a live audience Our Identifying And Increasing Brand Awareness Current Issues Faced By Company Diagrams PDF can help you do that by engaging all the users towards you.. Slidegeeks experts have put their efforts and expertise into creating these impeccable powerpoint presentations so that you can communicate your ideas clearly. Moreover, all the templates are customizable, and easy-to-edit and downloadable. Use these for both personal and commercial use.
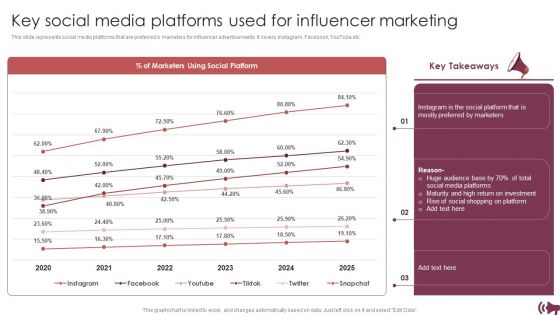
Guide Digital Advertising Optimize Lead Targeting Key Social Media Platforms Used For Influencer Marketing Diagrams PDF
This slide represents social media platforms that are preferred b marketers for influencer advertisements. It covers Instagram, Facebook, YouTube etc. Find a pre designed and impeccable Guide Digital Advertising Optimize Lead Targeting Key Social Media Platforms Used For Influencer Marketing Diagrams PDF. The templates can ace your presentation without additional effort. You can download these easy to edit presentation templates to make your presentation stand out from others. So, what are you waiting for Download the template from Slidegeeks today and give a unique touch to your presentation.
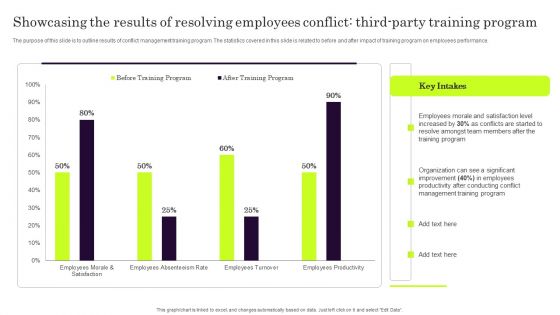
Showcasing The Results Of Resolving Employees Conflict Third Party Training Program Diagrams PDF
The purpose of this slide is to outline results of conflict management training program. The statistics covered in this slide is related to before and after impact of training program on employees performance. From laying roadmaps to briefing everything in detail, our templates are perfect for you. You can set the stage with your presentation slides. All you have to do is download these easy to edit and customizable templates. Showcasing The Results Of Resolving Employees Conflict Third Party Training Program Diagrams PDF will help you deliver an outstanding performance that everyone would remember and praise you for. Do download this presentation today.
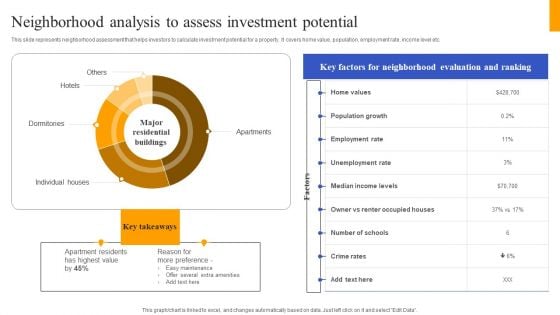
Fix And Flip Method For Renovating Real Estate Neighborhood Analysis Assess Investment Diagrams PDF
This slide represents neighborhood assessment that helps investors to calculate investment potential for a property. It covers home value, population, employment rate, income level etc. Want to ace your presentation in front of a live audience Our Fix And Flip Method For Renovating Real Estate Neighborhood Analysis Assess Investment Diagrams PDF can help you do that by engaging all the users towards you. Slidegeeks experts have put their efforts and expertise into creating these impeccable powerpoint presentations so that you can communicate your ideas clearly. Moreover, all the templates are customizable, and easy to edit and downloadable. Use these for both personal and commercial use.
Providing Efficient Client Services Kpi Dashboard For Tracking Customer Retention Diagrams PDF
This slide covers the dashboard for analyzing customer loyalty with metrics such as NPS, loyal customer rate, premium users, CLV, customer churn, revenue churn, net retention, MRR growth, etc. Take your projects to the next level with our ultimate collection of Providing Efficient Client Services Kpi Dashboard For Tracking Customer Retention Diagrams PDF. Slidegeeks has designed a range of layouts that are perfect for representing task or activity duration, keeping track of all your deadlines at a glance. Tailor these designs to your exact needs and give them a truly corporate look with your own brand colors they will make your projects stand out from the rest.
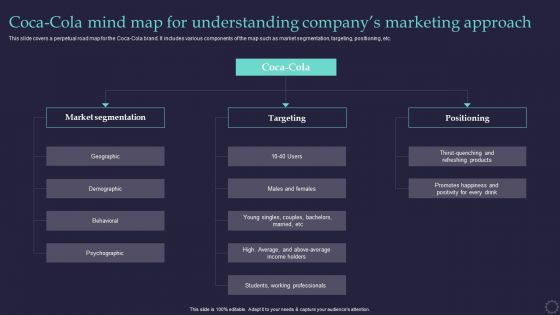
Effective Positioning Strategy Plan Coca Cola Mind Map For Understanding Companygcos Diagrams PDF
This slide covers a perpetual road map for the Coca-Cola brand. It includes various components of the map such as market segmentation, targeting, positioning, etc. Presenting Effective Positioning Strategy Plan Coca Cola Mind Map For Understanding Companygcos Diagrams PDF to provide visual cues and insights. Share and navigate important information on seven stages that need your due attention. This template can be used to pitch topics like Market segmentation, Targeting, Positioning. In addtion, this PPT design contains high resolution images, graphics, etc, that are easily editable and available for immediate download.
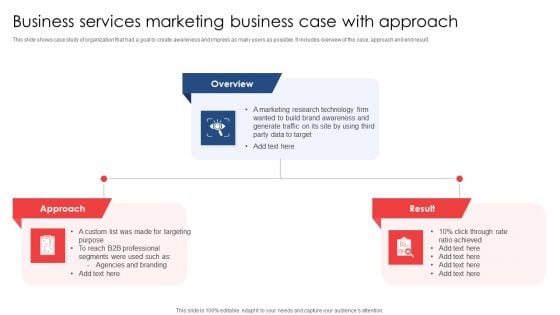
Business Services Marketing Business Case With Approach Ppt Gallery Diagrams PDF
This slide shows case study of organization that had a goal to create awareness and impress as many users as possible. It includes overview of the case, approach and end result. Persuade your audience using this Business Services Marketing Business Case With Approach Ppt Gallery Diagrams PDF. This PPT design covers three stages, thus making it a great tool to use. It also caters to a variety of topics including Overview, Result, Approach. Download this PPT design now to present a convincing pitch that not only emphasizes the topic but also showcases your presentation skills.
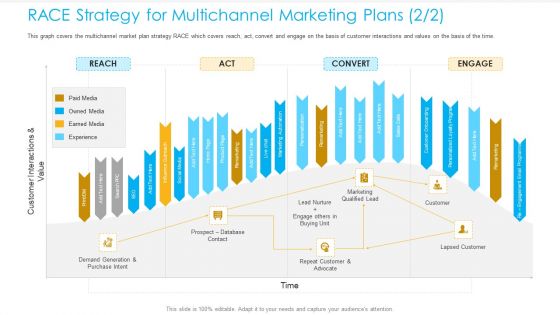
Unified Business Consumer Marketing Strategy RACE Strategy Multichannel Marketing Plans Marketing Diagrams PDF
This graph covers the multichannel market plan strategy RACE which covers reach, act, convert and engage on the basis of customer interactions and values on the basis of the time.Deliver an awe-inspiring pitch with this creative unified business consumer marketing strategy race strategy multichannel marketing plans marketing diagrams pdf bundle. Topics like demand generation and purchase intent, prospect database contact, repeat customer and advocate can be discussed with this completely editable template. It is available for immediate download depending on the needs and requirements of the user.
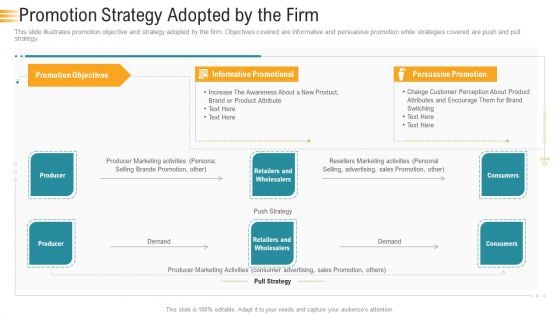
Establishing An Efficient Integrated Marketing Communication Process Promotion Strategy Adopted By The Firm Diagrams PDF
This slide illustrates promotion objective and strategy adopted by the firm. Objectives covered are informative and persuasive promotion while strategies covered are push and pull strategy. Deliver an awe inspiring pitch with this creative establishing an efficient integrated marketing communication process promotion strategy adopted by the firm diagrams pdf bundle. Topics like producer marketing activities, push strategy, product attribute, promotion objectives, persuasive promotion can be discussed with this completely editable template. It is available for immediate download depending on the needs and requirements of the user.
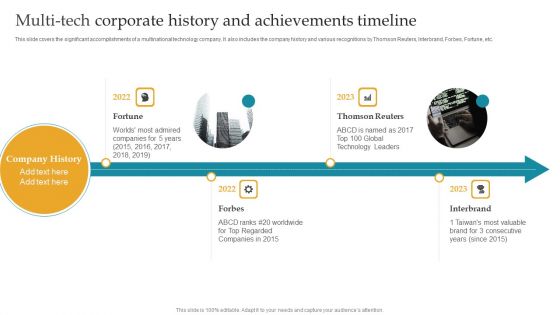
Multi Tech Corporate History And Achievements Timeline Ppt Inspiration Diagrams PDF
This slide covers the significant accomplishments of a multinational technology company. It also includes the company history and various recognitions by Thomson Reuters, Interbrand, Forbes, Fortune, etc. Persuade your audience using this Multi Tech Corporate History And Achievements Timeline Ppt Inspiration Diagrams PDF. This PPT design covers four stages, thus making it a great tool to use. It also caters to a variety of topics including Fortune, Thomson Reuters, Forbes, Interbrand. Download this PPT design now to present a convincing pitch that not only emphasizes the topic but also showcases your presentation skills
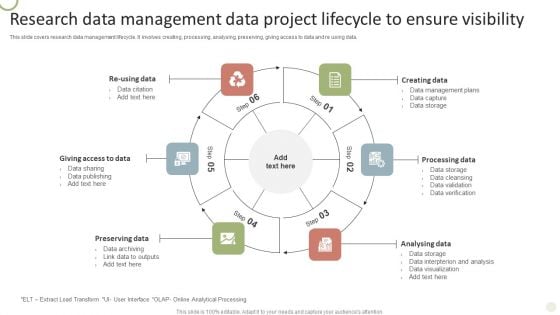
Research Data Management Data Project Lifecycle To Ensure Visibility Diagrams PDF
This slide covers research data management lifecycle. It involves creating, processing, analysing, preserving, giving access to data and re using data.Persuade your audience using this Research Data Management Data Project Lifecycle To Ensure Visibility Diagrams PDF. This PPT design covers six stages, thus making it a great tool to use. It also caters to a variety of topics including Data Interpterion, Data Visualization, Data Verification. Download this PPT design now to present a convincing pitch that not only emphasizes the topic but also showcases your presentation skills.

6 Stage Process To Successfully Develop Product Pre Launch Activities Event Diagrams PDF
This slide signifies the six stage process to successfully implement product pre launch activities event. It covers information about identify target audience, conduct market analysis, platforms to reach , conduct campaign and launch. Persuade your audience using this 6 Stage Process To Successfully Develop Product Pre Launch Activities Event Diagrams PDF. This PPT design covers Six stages, thus making it a great tool to use. It also caters to a variety of topics including Target Audience, Conduct Thorough Market Analysis, New Product Launch. Download this PPT design now to present a convincing pitch that not only emphasizes the topic but also showcases your presentation skills.
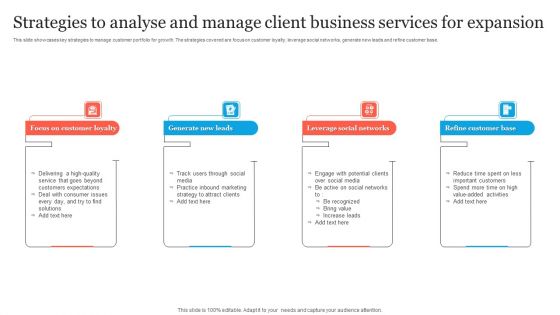
Strategies To Analyse And Manage Client Business Services For Expansion Diagrams PDF
This slide showcases key strategies to manage customer portfolio for growth. The strategies covered are focus on customer loyalty, leverage social networks, generate new leads and refine customer base. Persuade your audience using this Strategies To Analyse And Manage Client Business Services For Expansion Diagrams PDF. This PPT design covers four stages, thus making it a great tool to use. It also caters to a variety of topics including Focus On Customer Loyalty, Leverage Social Networks, Refine Customer Base. Download this PPT design now to present a convincing pitch that not only emphasizes the topic but also showcases your presentation skills.
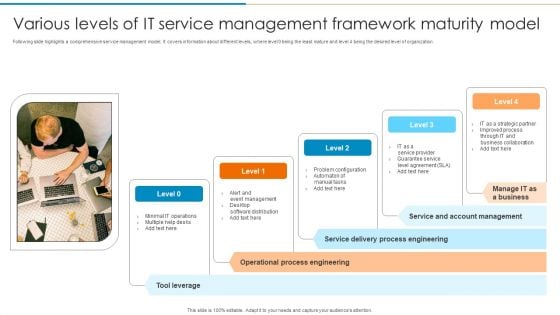
Various Levels Of IT Service Management Framework Maturity Model Diagrams PDF
Following slide highlights a comprehensive service management model. It covers information about different levels, where level 0 being the least mature and level 4 being the desired level of organization. Persuade your audience using this Various Levels Of IT Service Management Framework Maturity Model Diagrams PDF. This PPT design covers four stages, thus making it a great tool to use. It also caters to a variety of topics including Tool Leverage, Operational Process Engineering, Service Delivery Process Engineering, Service And Account Management, Manage IT Business. Download this PPT design now to present a convincing pitch that not only emphasizes the topic but also showcases your presentation skills.
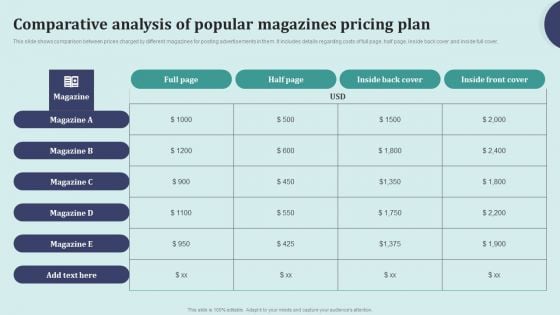
Offline Marketing Techniques To Elevate Brand Visibility Comparative Analysis Of Popular Magazines Diagrams PDF
This slide shows comparison between prices charged by different magazines for posting advertisements in them. It includes details regarding costs of full page, half page, inside back cover and inside full cover. Make sure to capture your audiences attention in your business displays with our gratis customizable Offline Marketing Techniques To Elevate Brand Visibility Comparative Analysis Of Popular Magazines Diagrams PDF. These are great for business strategies, office conferences, capital raising or task suggestions. If you desire to acquire more customers for your tech business and ensure they stay satisfied, create your own sales presentation with these plain slides.
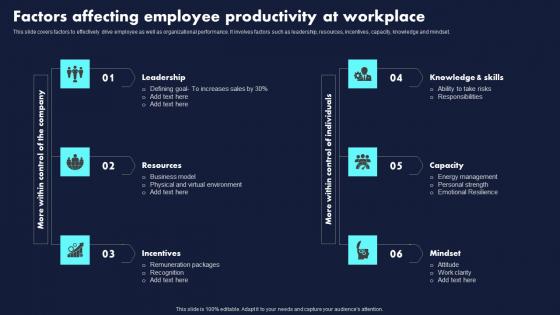
Factors Affecting Employee Productivity At Workplace Proven Techniques For Enhancing Diagrams Pdf
This slide covers factors to effectively drive employee as well as organizational performance. It involves factors such as leadership, resources, incentives, capacity, knowledge and mindset.Find a pre-designed and impeccable Factors Affecting Employee Productivity At Workplace Proven Techniques For Enhancing Diagrams Pdf. The templates can ace your presentation without additional effort. You can download these easy-to-edit presentation templates to make your presentation stand out from others. So, what are you waiting for Download the template from Slidegeeks today and give a unique touch to your presentation. This slide covers factors to effectively drive employee as well as organizational performance. It involves factors such as leadership, resources, incentives, capacity, knowledge and mindset.
Global Positioning System GPS For Effective Asset Tracking Tech Asset Management Diagrams Pdf
This slide covers GPS asset tracking system to effectively manage inventory and asset data. It involves working and key components involves such as receivers, tags and tracker systems.There are so many reasons you need a Global Positioning System GPS For Effective Asset Tracking Tech Asset Management Diagrams Pdf. The first reason is you can not spend time making everything from scratch, Thus, Slidegeeks has made presentation templates for you too. You can easily download these templates from our website easily. This slide covers GPS asset tracking system to effectively manage inventory and asset data. It involves working and key components involves such as receivers, tags and tracker systems.
Batch Operating System Workflow With Payroll And Billing Ppt PowerPoint Presentation Icon Diagrams PDF
This slide depicts various example of batch processing operating system such as payroll, bank invoice, billing, daily report etc. Persuade your audience using this batch operating system workflow with payroll and billing ppt powerpoint presentation icon diagrams pdf. This PPT design covers six stages, thus making it a great tool to use. It also caters to a variety of topics including transaction process, research segment, bank invoice system. Download this PPT design now to present a convincing pitch that not only emphasizes the topic but also showcases your presentation skills.
Effective And Efficient Framework Of Agile Project Management Ppt PowerPoint Presentation Icon Diagrams PDF
This slide depicts the process framework of agile project management which covers concept, initiation, delivery, closure, etc. that helps in identifying problems and opportunities, validating idea, building, deployment, etc. Showcasing this set of slides titled effective and efficient framework of agile project management ppt powerpoint presentation icon diagrams pdf. The topics addressed in these templates are concept, opportunity, deliver. All the content presented in this PPT design is completely editable. Download it and make adjustments in color, background, font etc. as per your unique business setting.
Strategic Database Accessibility Management Objectives On Multiple Domain Icon Diagrams PDF
This slide covers 3 main goals of data lifecycle management to organise large data volumes . It includes objectives such as data confidentiality , data availability and long-term structural integrity.Pitch your topic with ease and precision using this Strategic Database Accessibility Management Objectives On Multiple Domain Icon Diagrams PDF. This layout presents information on Strategic Database, Accessibility Management, Objectives On Multiple. It is also available for immediate download and adjustment. So, changes can be made in the color, design, graphics or any other component to create a unique layout.
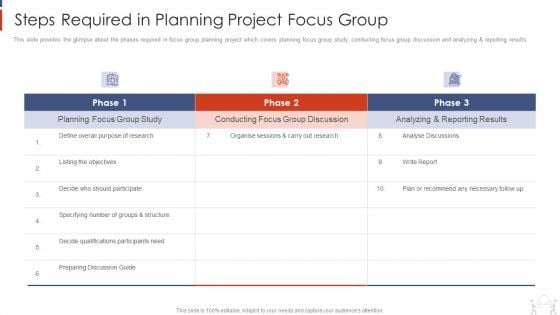
Project Management Modelling Techniques IT Steps Required In Planning Project Focus Group Diagrams PDF
This slide provides the glimpse about the phases required in focus group planning project which covers planning focus group study, conducting focus group discussion and analyzing and reporting results. Deliver an awe inspiring pitch with this creative project management modelling techniques it steps required in planning project focus group diagrams pdf bundle. Topics like planning focus group study, conducting focus group discussion, analyzing and reporting results can be discussed with this completely editable template. It is available for immediate download depending on the needs and requirements of the user.
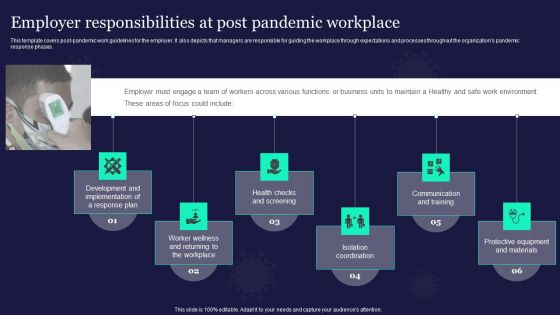
New General Adaption Playbook For Organizations Employer Responsibilities At Post Pandemic Workplace Diagrams PDF
This template covers post pandemic work guidelines for the employer. It also depicts that managers are responsible for guiding the workplace through expectations and processes throughout the organizations pandemic response phases. This is a New General Adaption Playbook For Organizations Employer Responsibilities At Post Pandemic Workplace Diagrams PDF template with various stages. Focus and dispense information on six stages using this creative set, that comes with editable features. It contains large content boxes to add your information on topics like Development, Implementation, Protective Equipment And Materials. You can also showcase facts, figures, and other relevant content using this PPT layout. Grab it now.
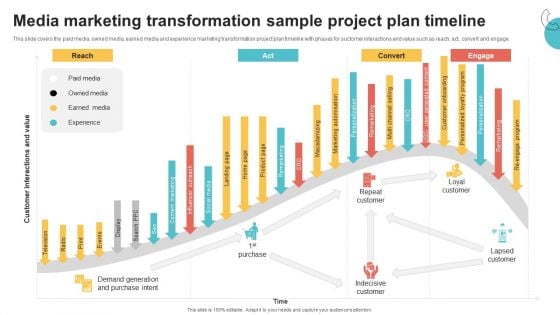
Digital Marketing Toolkit Media Marketing Transformation Sample Project Plan Timeline Diagrams PDF
This slide covers the paid media, owned media, earned media and experience marketing transformation project plan timeline with phases for suctomer interactions and value such as reach, act, convert and engage. If your project calls for a presentation, then Slidegeeks is your go-to partner because we have professionally designed, easy-to-edit templates that are perfect for any presentation. After downloading, you can easily edit Digital Marketing Toolkit Media Marketing Transformation Sample Project Plan Timeline Diagrams PDF and make the changes accordingly. You can rearrange slides or fill them with different images. Check out all the handy templates
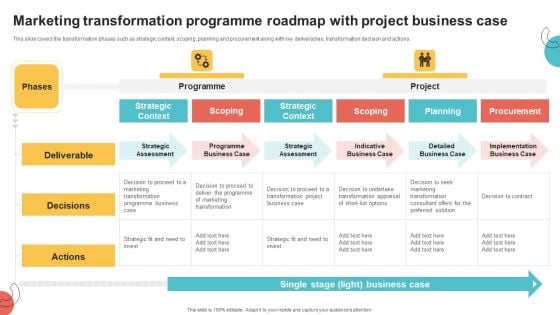
Digital Marketing Toolkit Marketing Transformation Programme Roadmap With Project Business Case Diagrams PDF
This slide covers the transformation phases such as strategic context, scoping, planning and procurement along with key deliverables, transformation decision and actions. This modern and well-arranged Digital Marketing Toolkit Marketing Transformation Programme Roadmap With Project Business Case Diagrams PDF provides lots of creative possibilities. It is very simple to customize and edit with the Powerpoint Software. Just drag and drop your pictures into the shapes. All facets of this template can be edited with Powerpoint, no extra software is necessary. Add your own material, put your images in the places assigned for them, adjust the colors, and then you can show your slides to the world, with an animated slide included.
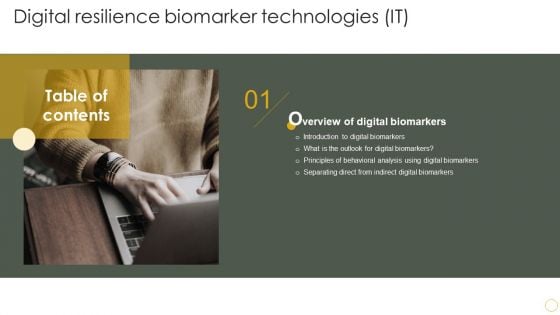
Table Of Contents Digital Resilience Biomarker Technologies IT Biomarkers Diagrams PDF
Retrieve professionally designed Table Of Contents Digital Resilience Biomarker Technologies IT Biomarkers Diagrams PDF to effectively convey your message and captivate your listeners. Save time by selecting pre made slideshows that are appropriate for various topics, from business to educational purposes. These themes come in many different styles, from creative to corporate, and all of them are easily adjustable and can be edited quickly. Access them as PowerPoint templates or as Google Slides themes. You do not have to go on a hunt for the perfect presentation because Slidegeeks got you covered from everywhere.
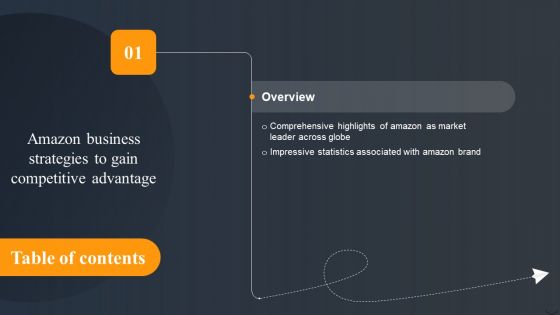
Table Of Contents Amazon Business Strategies To Gain Competitive Advantage Globe Diagrams PDF
Retrieve professionally designed Table Of Contents Amazon Business Strategies To Gain Competitive Advantage Globe Diagrams PDF to effectively convey your message and captivate your listeners. Save time by selecting pre made slideshows that are appropriate for various topics, from business to educational purposes. These themes come in many different styles, from creative to corporate, and all of them are easily adjustable and can be edited quickly. Access them as PowerPoint templates or as Google Slides themes. You do not have to go on a hunt for the perfect presentation because Slidegeeks got you covered from everywhere.


 Continue with Email

 Home
Home


