Learning Organization
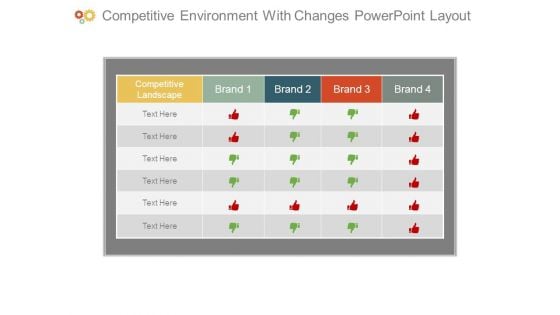
Competitive Environment With Changes Powerpoint Layout
This is a competitive environment with changes powerpoint layout. This is a four stage process. The stages in this process are competitive landscape, brand.
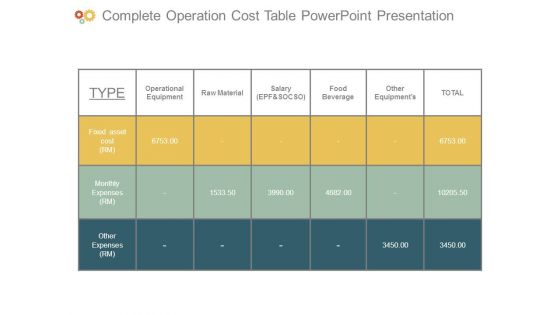
Complete Operation Cost Table Powerpoint Presentation
This is a complete operation cost table powerpoint presentation. This is a six stage process. The stages in this process are type, fixed asset cost rm, monthly expenses rm, other expenses rm, operational equipment, raw material, salary epf and socso, food beverage, other equipments, total.
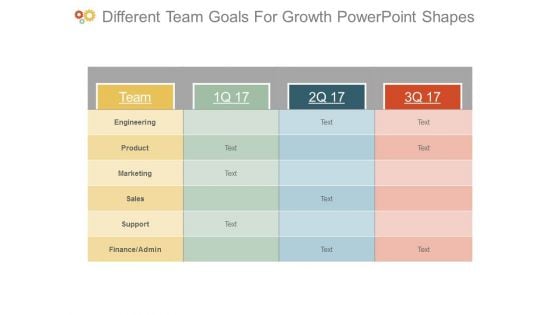
Different Team Goals For Growth Powerpoint Shapes
This is a different team goals for growth powerpoint shapes. This is a three stage process. The stages in this process are team, engineering, product, marketing, sales, support, finance admin.
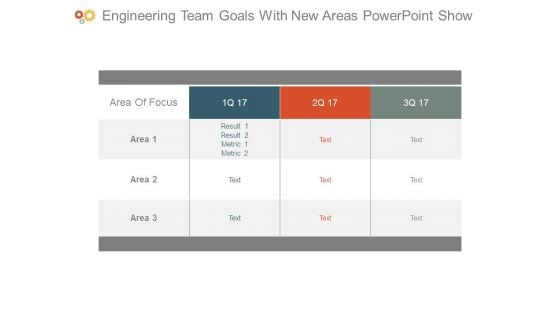
Engineering Team Goals With New Areas Powerpoint Show
This is a engineering team goals with new areas powerpoint show. This is a three stage process. The stages in this process are area of focus, area, result.
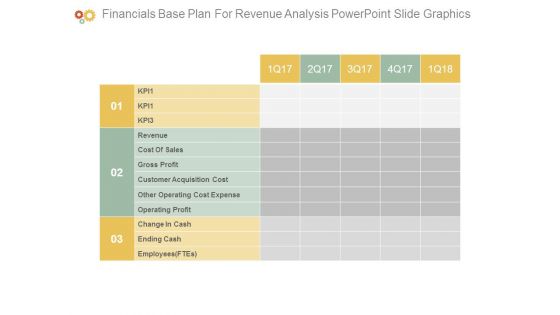
Financials Base Plan For Revenue Analysis Powerpoint Slide Graphics
This is a financials base plan for revenue analysis powerpoint slide graphics. This is a three stage process. The stages in this process are kp, revenue, cost of sales, gross profit, customer acquisition cost, other operating cost expense, operating profit, change in cash, ending cash, employees ftes.

Lifetime Customer Value Lcv Display Table Powerpoint Themes
This is a lifetime customer value lcv display table powerpoint themes. This is a five stage process. The stages in this process are complete clv year, average acquisition cost, average customer revenue, average customer costs, average customer profit, customer retention rate, cumulative retention rate, likely customer profit, discount rate, clv per year, cumulative clv.
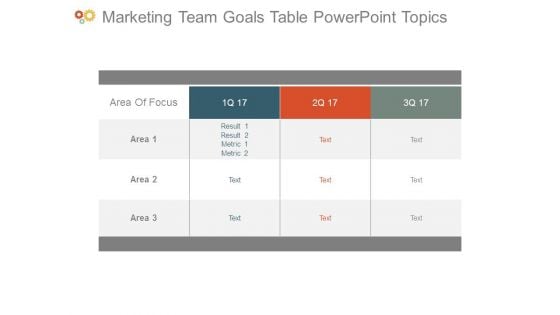
Marketing Team Goals Table Powerpoint Topics
This is a marketing team goals table powerpoint topics. This is a three stage process. The stages in this process are area of focus, area, result, metric.
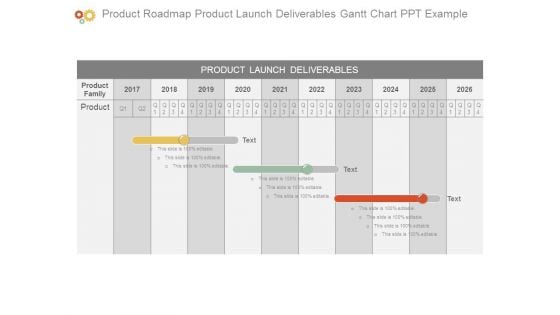
Product Roadmap Product Launch Deliverables Gantt Chart Ppt Example
This is a product roadmap product launch deliverables gantt chart ppt example. This is a three stage process. The stages in this process are product launch deliverables, product family, product.
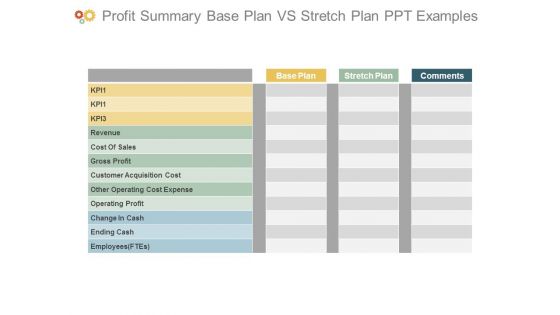
Profit Summary Base Plan Vs Stretch Plan Ppt Examples
This is a profit summary base plan vs stretch plan ppt examples. This is a three stage process. The stages in this process are base plan, kp, revenue, stretch plan, comments, cost of sales, gross profit, customer acquisition cost, other operating cost expense, operating profit, change in cash, ending cash, employees ftes.
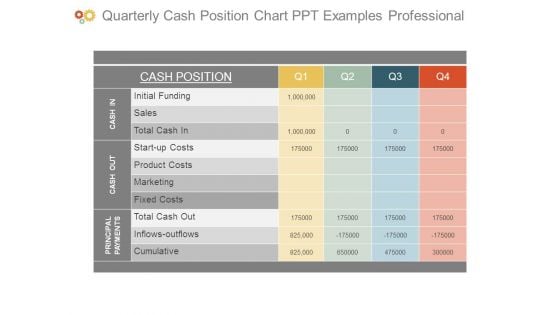
Quarterly Cash Position Chart Ppt Examples Professional
This is a quarterly cash position chart ppt examples professional. This is a four stage process. The stages in this process are cash position, initial funding, sales, total cash in, start up costs, product costs, marketing, fixed costs, total cash out, inflows outflows, cumulative, cash in, cash out, principal payments.
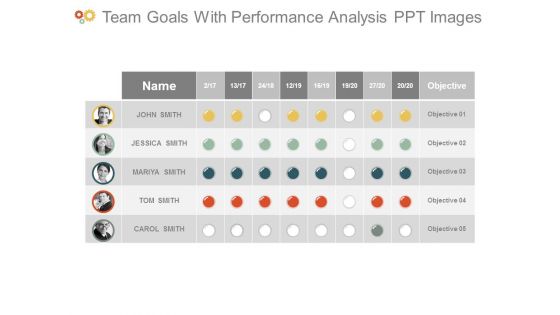
Team Goals With Performance Analysis Ppt Images
This is a team goals with performance analysis ppt images. This is a five stage process. The stages in this process are name, john smith, jessica smith, mariya smith, tom smith, carol smith, objective.
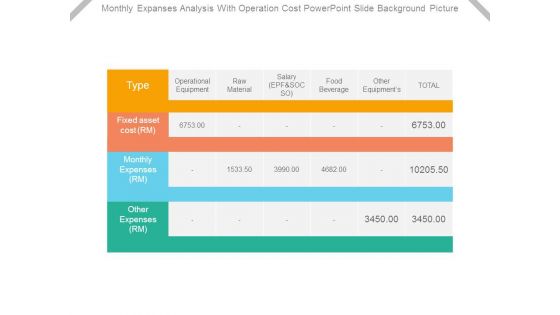
Monthly Expanses Analysis With Operation Cost Powerpoint Slide Background Picture
This is a monthly expanses analysis with operation cost powerpoint slide background picture. This is a six stage process. The stages in this process are type, operational equipment, raw material, salary epf and socso, food beverage, other equipment, total, fixed asset cost rm, monthly expenses rm, other expenses rm.
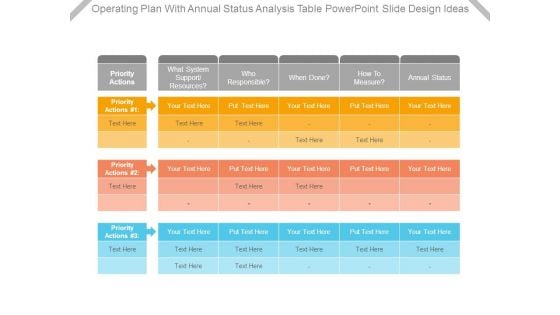
Operating Plan With Annual Status Analysis Table Powerpoint Slide Design Ideas
This is a operating plan with annual status analysis table powerpoint slide design ideas. This is a five stage process. The stages in this process are priority actions, what system support resources, who responsible, when done, how to measure, annual status.
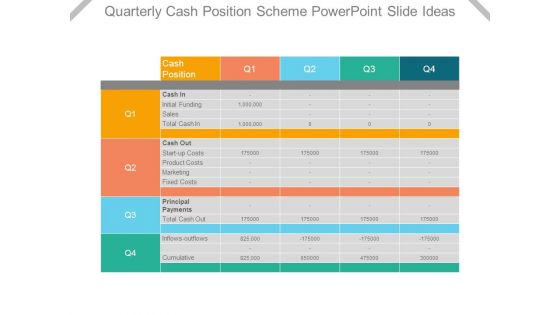
Quarterly Cash Position Scheme Powerpoint Slide Ideas
This is a quarterly cash position scheme powerpoint slide ideas. This is a four stage process. The stages in this process are cash position, initial funding, cash in, sales, total cash in, cash out, start up costs, product costs, marketing, fixed costs, principal, payments, total cash out, inflows outflows, cumulative.
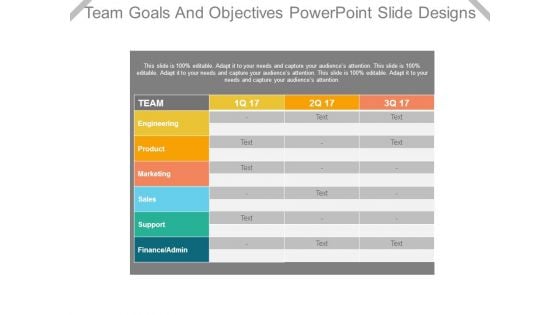
Team Goals And Objectives Powerpoint Slide Designs
This is a team goals and objectives powerpoint slide designs. This is a three stage process. The stages in this process are team, engineering, product, marketing, sales, support, finance admin.
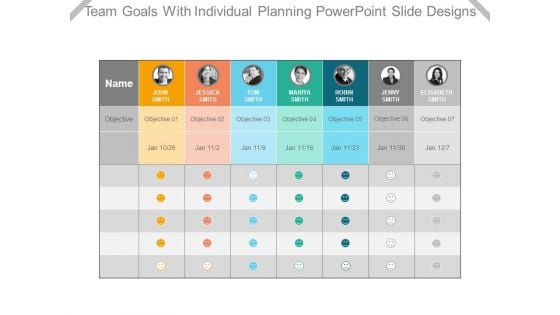
Team Goals With Individual Planning Powerpoint Slide Designs
This is a team goals with individual planning powerpoint slide designs. This is a seven stage process. The stages in this process are john smith, jessica smith, tom smith, mariya smith, robin smith, jenny smith, elisabeth smith, objective, name, jan.
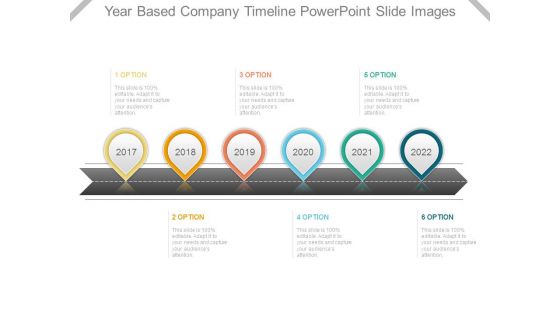
Year Based Company Timeline Powerpoint Slide Images
This is a year based company timeline powerpoint slide images. This is a six stage process. The stages in this process are option.
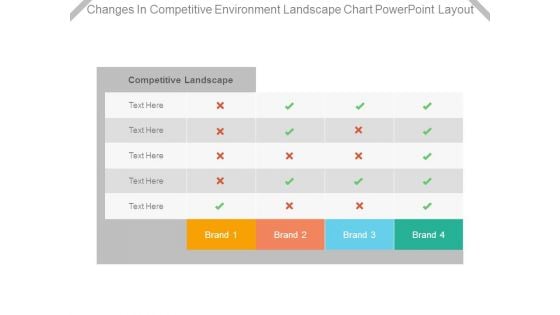
Changes In Competitive Environment Landscape Chart Powerpoint Layout
This is a changes in competitive environment landscape chart powerpoint layout. This is a four stage process. The stages in this process are competitive landscape, brand.
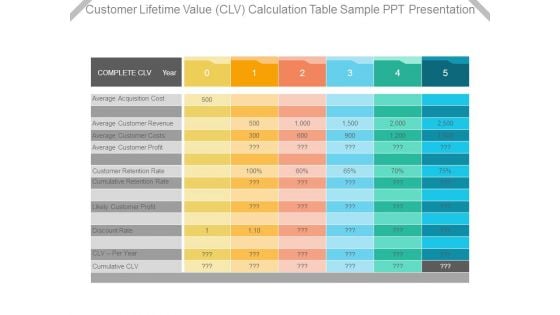
Customer Lifetime Value Clv Calculation Table Sample Ppt Presentation
This is a customer lifetime value clv calculation table sample ppt presentation. This is a five stage process. The stages in this process are complete clv year, average acquisition cost, average customer revenue, average customer costs, average customer profit, customer retention rate, cumulative retention rate, likely customer profit, discount rate, clv per year, cumulative clv.
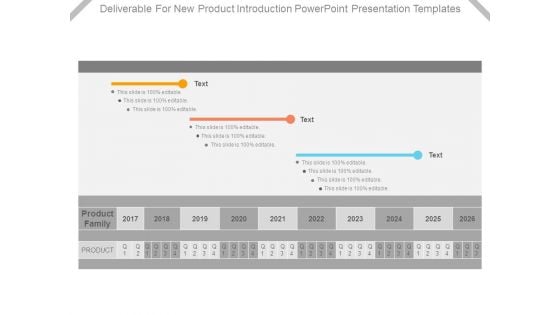
Deliverable For New Product Introduction Powerpoint Presentation Templates
This is a deliverable for new product introduction powerpoint presentation templates. This is a three stage process. The stages in this process are product family, product.
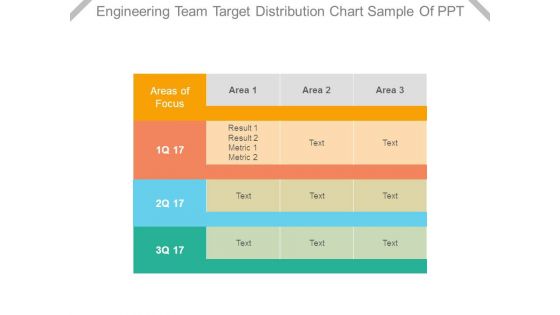
Engineering Team Target Distribution Chart Sample Of Ppt
This is a engineering team target distribution chart sample of ppt. This is a three stage process. The stages in this process are areas of focus, area, result, metric.
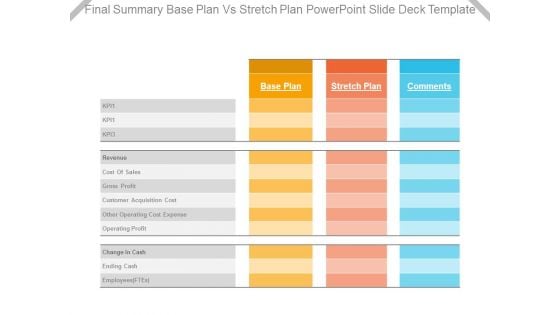
Final Summary Base Plan Vs Stretch Plan Powerpoint Slide Deck Template
This is a final summary base plan vs stretch plan powerpoint slide deck template. This is a three stage process. The stages in this process are kpi, revenue, cost of sales, gross profit, customer acquisition cost, other operating cost expense, operating profit, change in cash, ending cash, employees ftes.
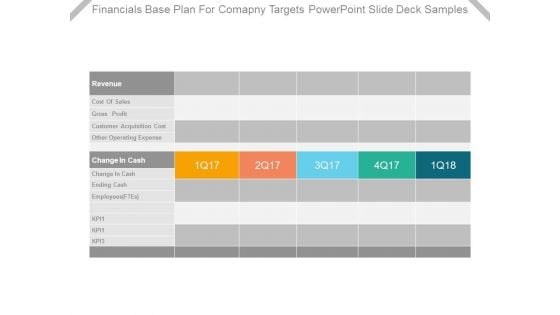
Financials Base Plan For Company Targets Powerpoint Slide Deck Samples
This is a financials base plan for company targets powerpoint slide deck samples. This is a five stage process. The stages in this process are revenue, cost of sales, gross profit, customer acquisition cost, other operating expense, change in cash, change in cash, ending cash, employees ftes, kpi.
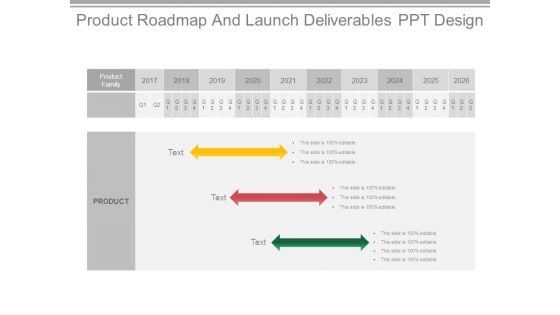
Product Roadmap And Launch Deliverables Ppt Design
This is a product roadmap and launch deliverables ppt design. This is a three stage process. The stages in this process are product family.
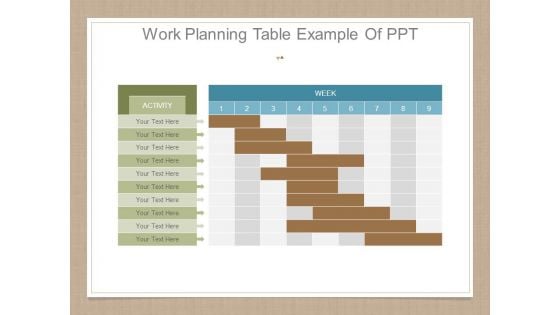
Work Planning Table Example Of Ppt
This is a work planning table example of ppt. This is a nine stage process. The stages in this process are activity, week.
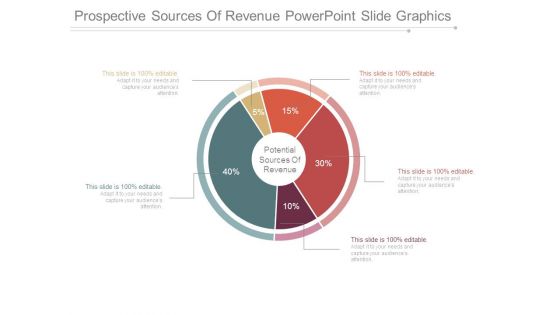
Prospective Sources Of Revenue Powerpoint Slide Graphics
This is a prospective sources of revenue powerpoint slide graphics. This is a five stage process. The stages in this process are potential sources of revenue.
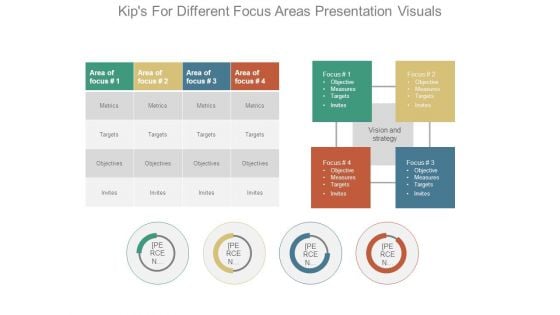
Kips For Different Focus Areas Presentation Visuals
This is a kips for different focus areas presentation visuals. This is a four stage process. The stages in this process are area of focus, metrics, targets, objectives, invites, vision and strategy, focus.
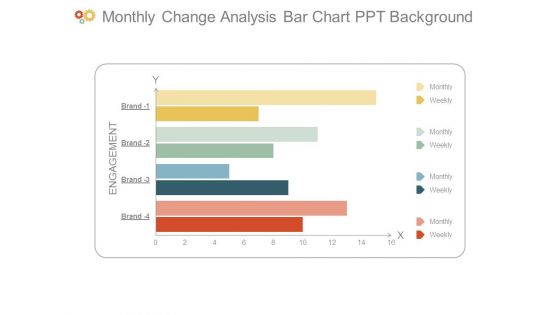
Monthly Change Analysis Bar Chart Ppt Background
This is a monthly change analysis bar chart ppt background. This is a four stage process. The stages in this process are engagement, monthly, weekly, brand.
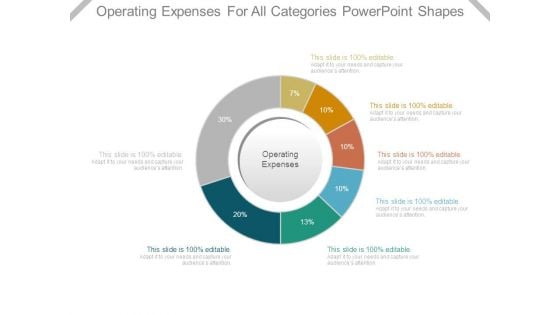
Operating Expenses For All Categories Powerpoint Shapes
This is a operating expenses for all categories powerpoint shapes. This is a seven stage process. The stages in this process are operating expenses.
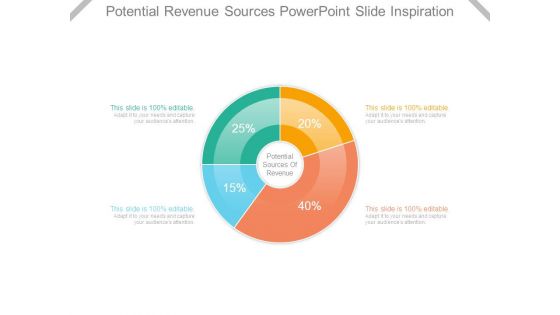
Potential Revenue Sources Powerpoint Slide Inspiration
This is a potential revenue sources powerpoint slide inspiration. This is a four stage process. The stages in this process are potential sources of revenue.
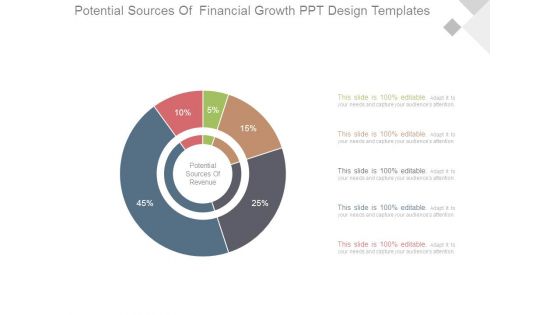
Potential Sources Of Financial Growth Ppt Design Templates
This is a potential sources of financial growth ppt design templates. This is a five stage process. The stages in this process are potential sources of revenue.
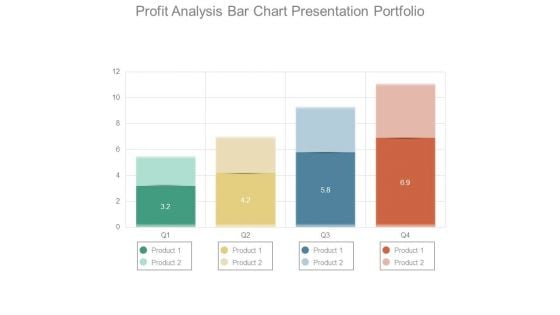
Profit Analysis Bar Chart Presentation Portfolio
This is a profit analysis bar chart presentation portfolio. This is a four stage process. The stages in this process are product.
Customer Testimonials For Feedback Ppt Icon
This is a customer testimonials for feedback ppt icon. This is a two stage process. The stages in this process are ceo, graphic designer.
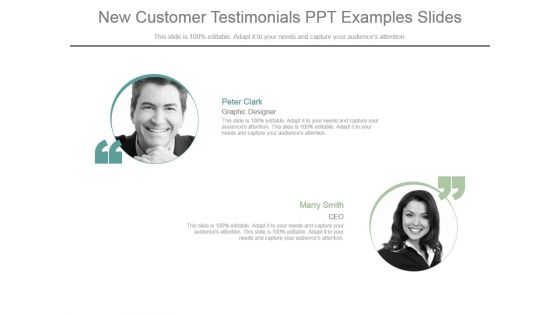
New Customer Testimonials Ppt Examples Slides
This is a new customer testimonials ppt examples slides. This is a two stage process. The stages in this process are graphic designer, ceo.
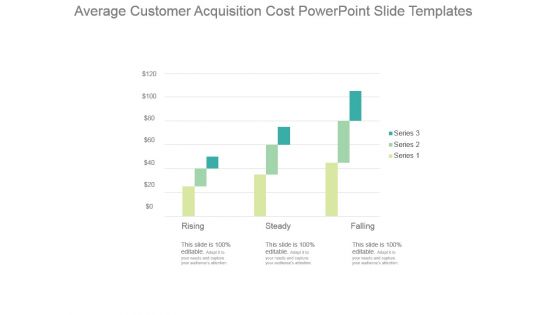
Average Customer Acquisition Cost Powerpoint Slide Templates
This is a average customer acquisition cost powerpoint slide templates. This is a three stage process. The stages in this process are rising, steady, falling.
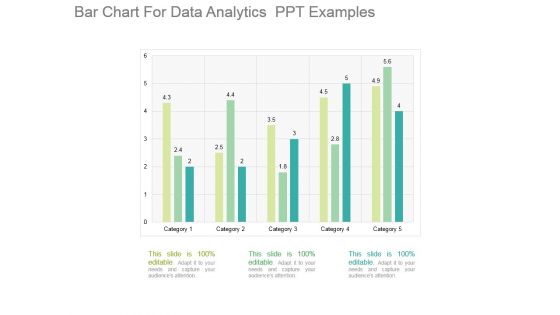
Bar Chart For Data Analytics Ppt Examples
This is a bar chart for data analytics ppt examples. This is a five stage process. The stages in this process are category.
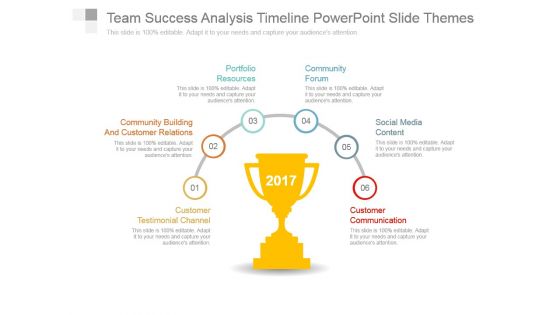
Team Success Analysis Timeline Powerpoint Slide Themes
This is a team success analysis timeline powerpoint slide themes. This is a six stage process. The stages in this process are customer testimonial channel, community building and customer relations, portfolio resources, community forum, social media content, customer communication.
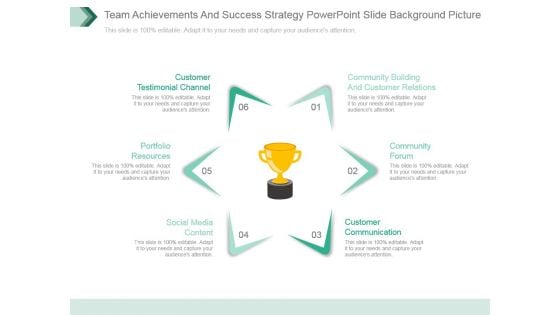
Team Achievements And Success Strategy Powerpoint Slide Background Picture
This is a team achievements and success strategy powerpoint slide background picture. This is a six stage process. The stages in this process are community building and customer relations, community forum, customer communication, social media content, portfolio resources, customer testimonial channel.
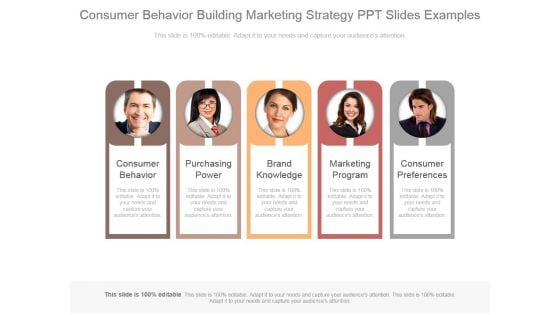
Consumer Behavior Building Marketing Strategy Ppt Slides Examples
This is a consumer behavior building marketing strategy ppt slides examples. This is a five stage process. The stages in this process are consumer behavior, purchasing power, brand knowledge, marketing program, consumer preferences.
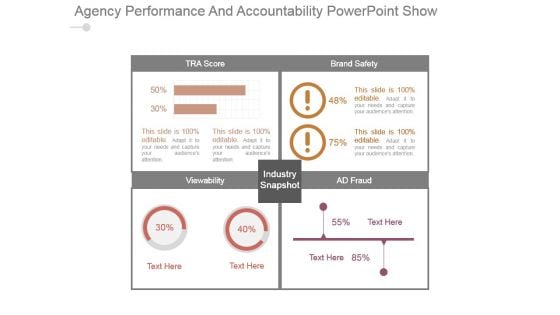
Agency Performance And Accountability Powerpoint Show
This is a agency performance and accountability powerpoint show. This is a four stage process. The stages in this process are tra score, brand safety, view ability, ad fraud, industry snapshot.

Agency Performance Dashboard Sample Of Ppt
This is a agency performance dashboard sample of ppt. This is a four stage process. The stages in this process are tra score, brand safety, view ability, ad fraud, industry snapshot.
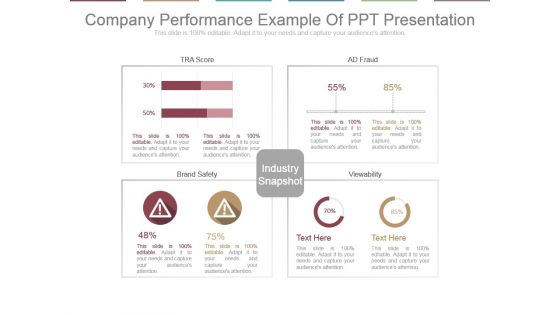
Company Performance Example Of Ppt Presentation
This is a company performance example of ppt presentation. This is a four stage process. The stages in this process are tra score, ad fraud, brand safety, view ability, industry snapshot.
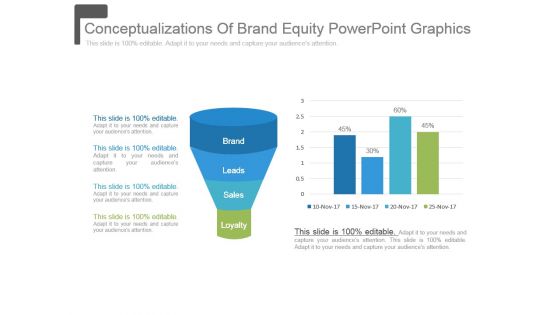
Conceptualizations Of Brand Equity Powerpoint Graphics
This is a conceptualizations of brand equity powerpoint graphics. This is a two stage process. The stages in this process are brand, leads, sales, loyalty.
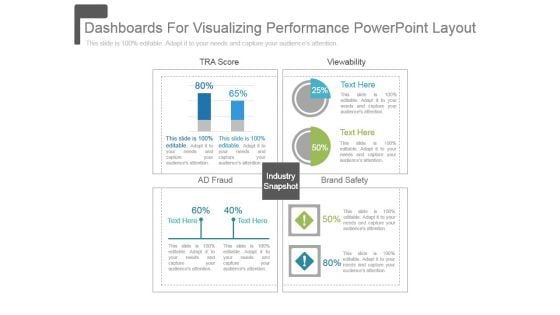
Dashboards For Visualizing Performance Powerpoint Layout
This is a dashboards for visualizing performance powerpoint layout. This is a four stage process. The stages in this process are tra score, view ability, ad fraud, brand safety, industry snapshot.
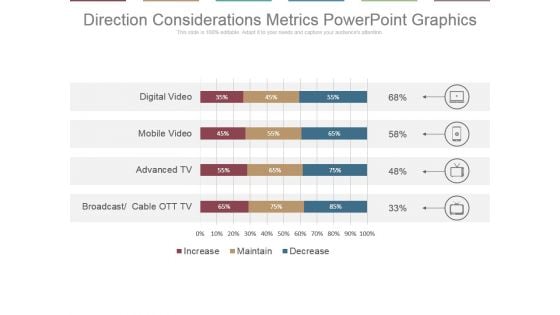
Direction Considerations Metrics Powerpoint Graphics
This is a direction considerations metrics powerpoint graphics. This is a four stage process. The stages in this process are digital video, mobile video, advanced tv, broadcast, cable ott tv.
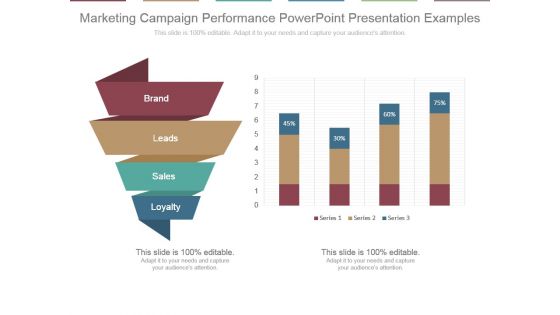
Marketing Campaign Performance Powerpoint Presentation Examples
This is a marketing campaign performance powerpoint presentation examples. This is a two stage process. The stages in this process are brand, leads, sales, loyalty.
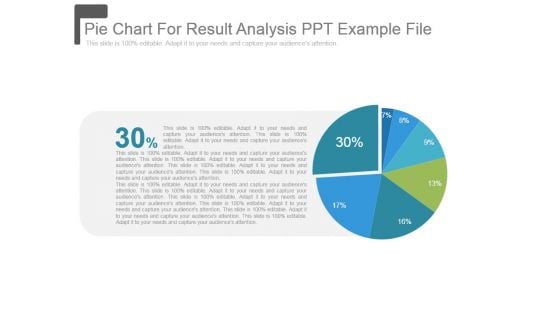
Pie Chart For Result Analysis Ppt Example File
This is a pie chart for result analysis ppt example file. This is a seven stage process. The stages in this process are pie, marketing, strategy, finance, percentage.
Spending Directions For Media Channels Ppt Icon
This is a spending directions for media channels ppt icon. This is a four stage process. The stages in this process are digital video, mobile video, advanced tv, broadcast, cable ott tv.
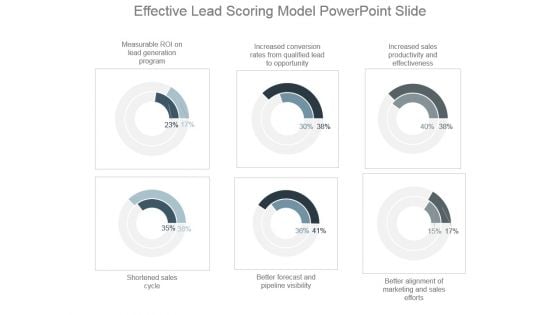
Effective Lead Scoring Model Powerpoint Slide
This is a effective lead scoring model powerpoint slide. This is a six stage process. The stages in this process are measurable roi on lead generation program, increased conversion rates from qualified lead to opportunity, increased sales productivity and effectiveness, shortened sales cycle, better forecast and pipeline visibility, better alignment of marketing and sales efforts.

Omni Channel Marketing To Reach Customers Powerpoint Slide Information
This is a omni channel marketing to reach customers powerpoint slide information. This is a two stage process. The stages in this process are which marketing channel is growing fastest, influencer engagement use cases.
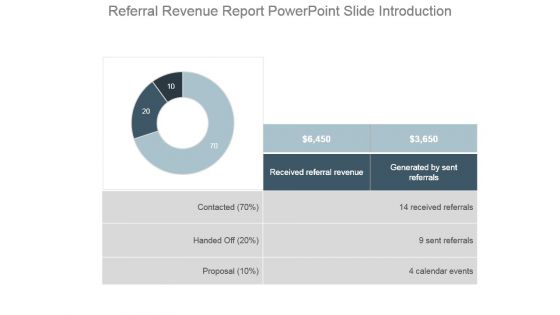
Referral Revenue Report Powerpoint Slide Introduction
This is a referral revenue report powerpoint slide introduction. This is a three stage process. The stages in this process are contacted, handed off, proposal, received referral revenue, generated by sent referrals, received referrals, sent referrals, calendar events.
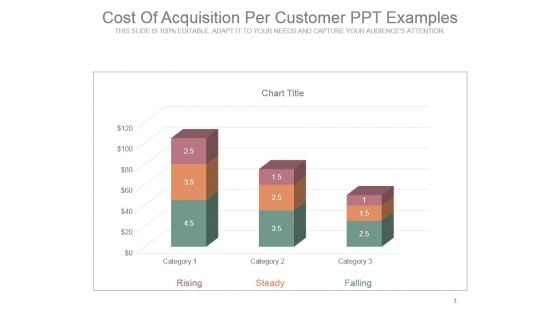
Cost Of Acquisition Per Customer Ppt Examples
This is a cost of acquisition per customer ppt examples. This is a three stage process. The stages in this process are rising, steady, falling.
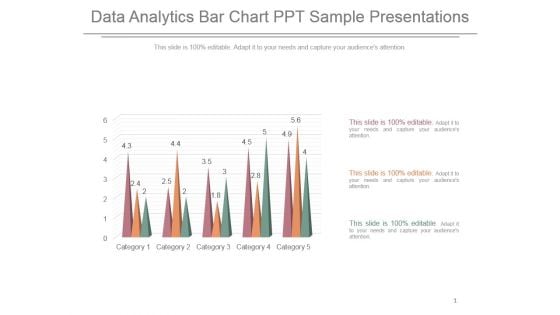
Data Analytics Bar Chart Ppt Sample Presentations
This is a data analytics bar chart ppt sample presentations. This is a five stage process. The stages in this process are category.
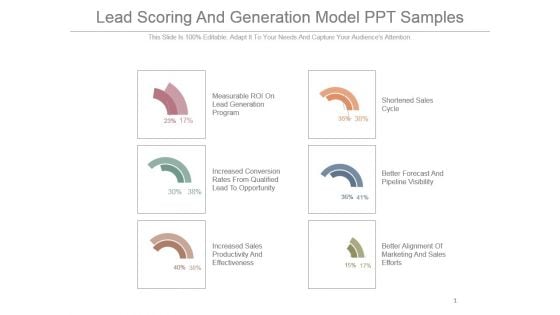
Lead Scoring And Generation Model Ppt Samples
This is a lead scoring and generation model ppt samples. This is a six stage process. The stages in this process are measurable roi on lead generation program, increased conversion rates from qualified lead to opportunity, increased sales productivity and effectiveness, shortened sales cycle, better forecast and pipeline visibility, better alignment of marketing and sales efforts.
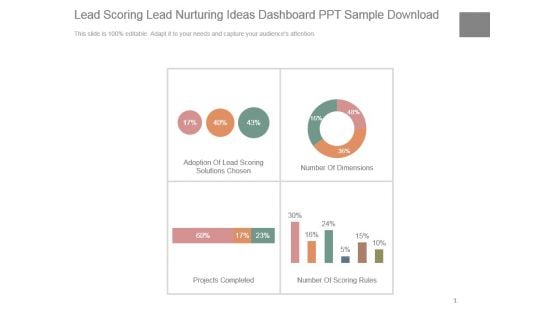
Lead Scoring Lead Nurturing Ideas Dashboard Ppt Sample Download
This is a lead scoring lead nurturing ideas dashboard ppt sample download. This is a four stage process. The stages in this process are adoption of lead scoring solutions chosen, number of dimensions, projects completed, number of scoring rules.
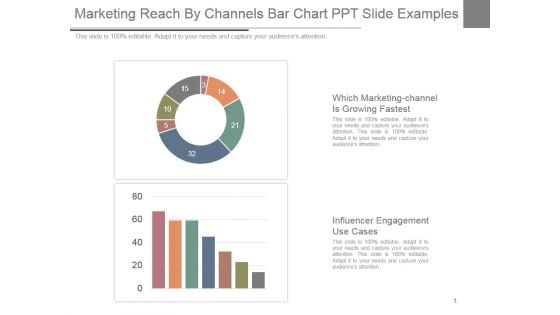
Marketing Reach By Channels Bar Chart Ppt Slide Examples
This is a marketing reach by channels bar chart ppt slide examples. This is a two stage process. The stages in this process are which marketing-channel is growing fastest, influencer engagement use cases.
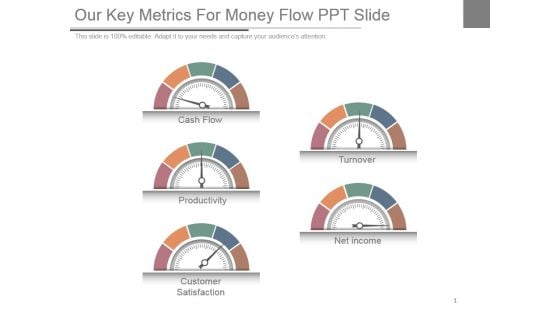
Our Key Metrics For Money Flow Ppt Slide
This is a our key metrics for money flow ppt slide. This is a five stage process. The stages in this process are cash flow, productivity, customer satisfaction, turnover, net income.
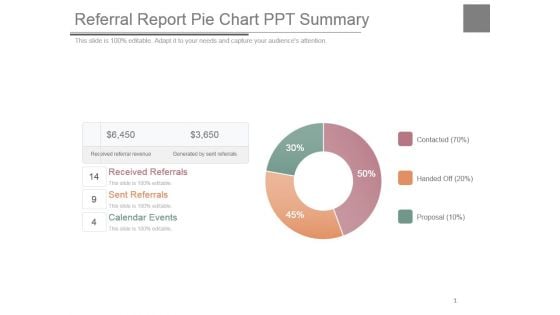
Referral Report Pie Chart Ppt Summary
This is a referral report pie chart ppt summary. This is a three stage process. The stages in this process are received referrals, sent referrals, calendar events.
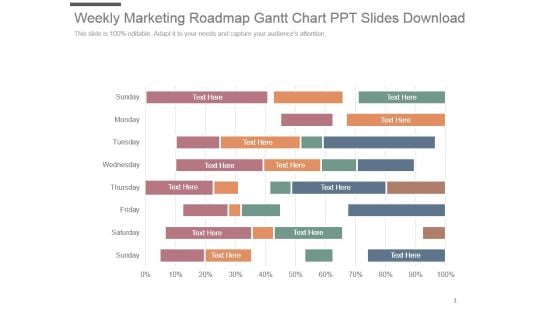
Weekly Marketing Roadmap Gantt Chart Ppt Slides Download
This is a weekly marketing roadmap gantt chart ppt slides download. This is a eight stage process. The stages in this process are sunday, monday, tuesday, wednesday, thursday, friday, saturday, Sunday.
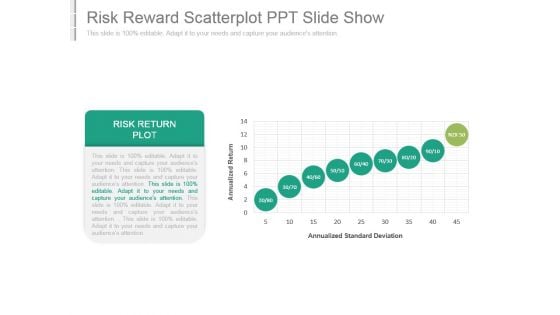
Risk Reward Scatterplot Ppt Slide Show
This is a risk reward scatterplot ppt slide show. This is a nine stage process. The stages in this process are risk return plot, annualized standard deviation, annualized return.


 Continue with Email

 Home
Home


