Line Chart

Chart Business PowerPoint Themes And PowerPoint Slides 0511
Microsoft PowerPoint Theme and Slide with orange bar on screen business conceptual illustration Connect the dots with our Chart Business PowerPoint Themes And PowerPoint Slides 0511. You will come out on top.
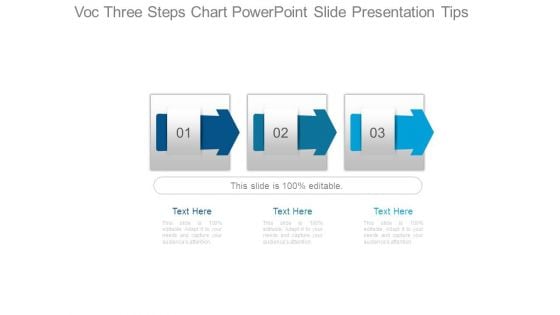
Voc Three Steps Chart Powerpoint Slide Presentation Tips
This is a voc three steps chart powerpoint slide presentation tips. This is a three stage process. The stages in this process are business, marketing, strategy, arrows, management.
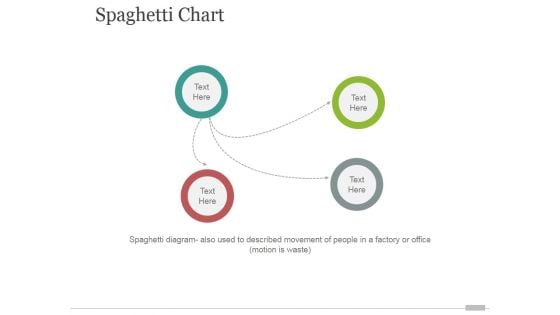
Spaghetti Chart Tamplate 1 Ppt PowerPoint Presentation Summary
This is a spaghetti chart tamplate 1 ppt powerpoint presentation summary. This is a three stage process. The stages in this process are business, marketing, analysis, success, strategy.
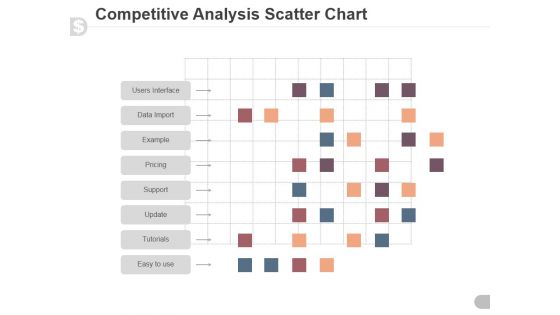
Competitive Analysis Scatter Chart Ppt PowerPoint Presentation Samples
This is a competitive analysis scatter chart ppt powerpoint presentation samples. This is a six stage process. The stages in this process are competitive, analysis, business, marketing, management.

Eight Stages Sequential Function Chart Ppt PowerPoint Presentation Slides Graphics
This is a eight stages sequential function chart ppt powerpoint presentation slides graphics. This is a eight stage process. The stages in this process are circular, continuity, continuum.
Best Practice For Project Management Chart Ppt Icons
This is a best practice for project management chart ppt icons. This is a four stage process. The stages in this process are risk management, scope, communication, budget.
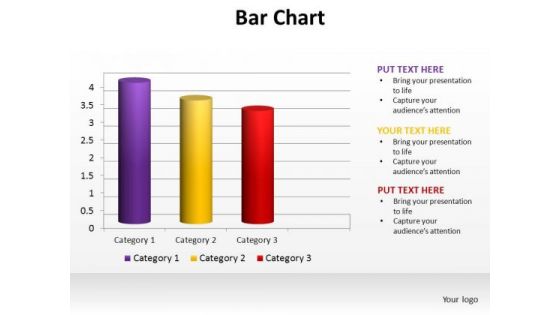
PowerPoint Slide Designs Data Driven Bar Chart Ppt Template
PowerPoint Slide Designs Data Driven Bar Chart PPT Template-These high quality powerpoint pre-designed slides and powerpoint templates have been carefully created by our professional team to help you impress your audience. All slides have been created and are 100% editable in powerpoint. Each and every property of any graphic - color, size, orientation, shading, outline etc. can be modified to help you build an effective powerpoint presentation. Any text can be entered at any point in the powerpoint template or slide. Simply DOWNLOAD, TYPE and PRESENT! Engineering changes is easier with our PowerPoint Slide Designs Data Driven Bar Chart Ppt Template. They enhance the chances of acceptance.

Chart Business PowerPoint Templates And PowerPoint Backgrounds 0511
Microsoft PowerPoint Template and Background with orange bar on screen business conceptual illustration Enhance your charisma with our Chart Business PowerPoint Templates And PowerPoint Backgrounds 0511. Allow your aura to flow around.

Column Chart Ppt PowerPoint Presentation Styles Graphic Tips
This is a column chart ppt powerpoint presentation styles graphic tips. This is a six stage process. The stages in this process are slide bar, business, marketing, strategy, finance.
Bar Chart Finance Ppt PowerPoint Presentation Icon Introduction
Presenting this set of slides with name bar chart finance ppt powerpoint presentation icon introduction. The topics discussed in these slides are marketing, business, management, planning, strategy. This is a completely editable PowerPoint presentation and is available for immediate download. Download now and impress your audience.
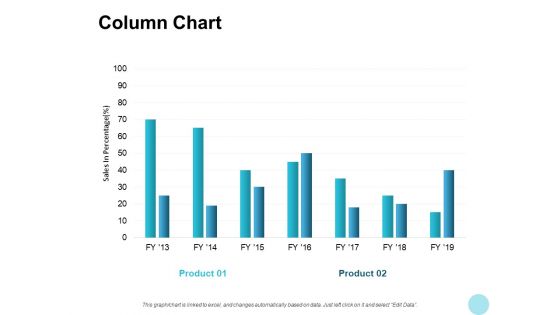
Column Chart Bar Ppt PowerPoint Presentation Styles Aids
Presenting this set of slides with name column chart bar ppt powerpoint presentation styles aids. The topics discussed in these slides are marketing, business, management, planning, strategy. This is a completely editable PowerPoint presentation and is available for immediate download. Download now and impress your audience.
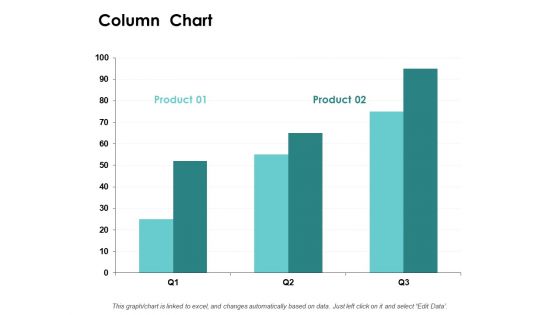
Column Chart Bar Ppt PowerPoint Presentation File Design Templates
Presenting this set of slides with name column chart bar ppt powerpoint presentation file design templates. The topics discussed in these slides are marketing, business, management, planning, strategy. This is a completely editable PowerPoint presentation and is available for immediate download. Download now and impress your audience.
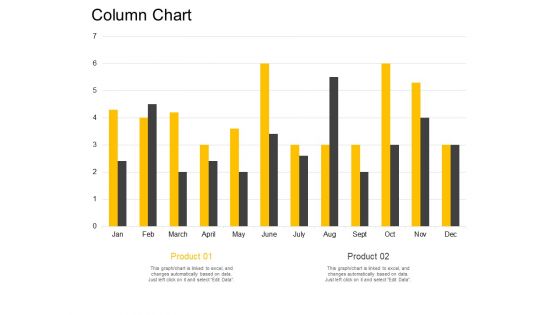
Column Chart Bar Ppt PowerPoint Presentation Infographics Slide Download
Presenting this set of slides with name column chart bar ppt powerpoint presentation infographics slide download. The topics discussed in these slides are marketing, business, management, planning, strategy. This is a completely editable PowerPoint presentation and is available for immediate download. Download now and impress your audience.
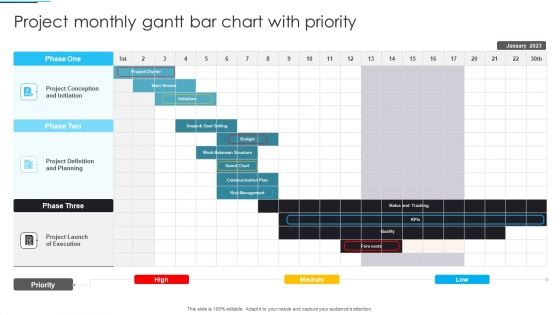
Project Monthly Gantt Bar Chart With Priority Inspiration PDF
Showcasing this set of slides titled Project Monthly Gantt Bar Chart With Priority Inspiration PDF. The topics addressed in these templates are Project Conception And Initiation, Project Definition And Planning, Project Launch Of Execution. All the content presented in this PPT design is completely editable. Download it and make adjustments in color, background, font etc. as per your unique business setting.
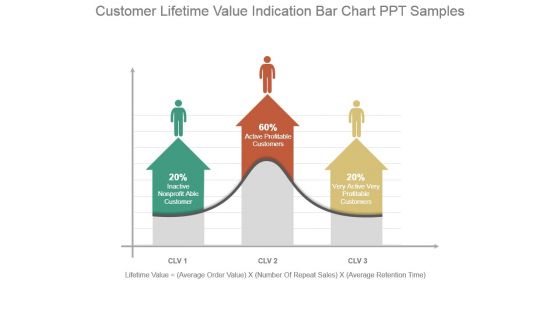
Customer Lifetime Value Indication Bar Chart Ppt Samples
This is a customer lifetime value indication bar chart ppt samples. This is a three stage process. The stages in this process are inactive nonprofit able customer, active profitable customers, very active very profitable customers, lifetime value, average order value, number of repeat sales, average retention time.
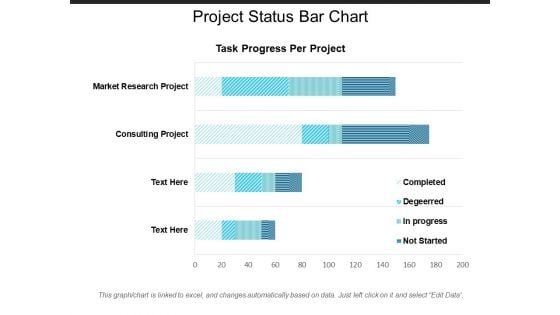
Project Status Bar Chart Ppt PowerPoint Presentation Visual Aids Show
Presenting this set of slides with name project status bar chart ppt powerpoint presentation visual aids show. The topics discussed in these slides are project management, project progress, project growth. This is a completely editable PowerPoint presentation and is available for immediate download. Download now and impress your audience.
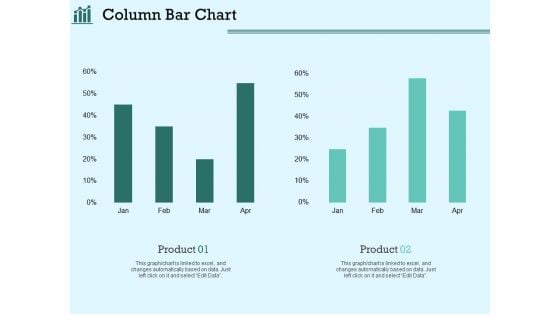
Survey Analysis Gain Marketing Insights Column Bar Chart Template PDF
Presenting this set of slides with name survey analysis gain marketing insights column bar chart template pdf. The topics discussed in these slides are product 1, product 2. This is a completely editable PowerPoint presentation and is available for immediate download. Download now and impress your audience.
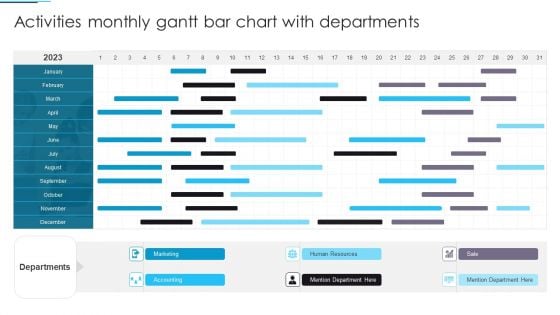
Activities Monthly Gantt Bar Chart With Departments Infographics PDF
Showcasing this set of slides titled Activities Monthly Gantt Bar Chart With Departments Infographics PDF. The topics addressed in these templates are Marketing, Accounting, Human Resources. All the content presented in this PPT design is completely editable. Download it and make adjustments in color, background, font etc. as per your unique business setting.
Production Gantt Chart Ppt PowerPoint Presentation Ideas Gridlines Cpb
Presenting this set of slides with name production gantt chart ppt powerpoint presentation ideas gridlines cpb. This is a six stage process. The stages in this process are production gantt chart. This is a completely editable PowerPoint presentation and is available for immediate download. Download now and impress your audience.
Employee Termination Process Flow Chart Ppt PowerPoint Presentation Graphics Cpb
Presenting this set of slides with name employee termination process flow chart ppt powerpoint presentation graphics cpb. This is a six stage process. The stages in this process are employee termination process flow chart. This is a completely editable PowerPoint presentation and is available for immediate download. Download now and impress your audience.
Successful Strategy Implementation Process Organization Organization Chart Microsoft PDF
Presenting this set of slides with name successful strategy implementation process organization organization chart microsoft pdf. This is a three stage process. The stages in this process are organization chart. This is a completely editable PowerPoint presentation and is available for immediate download. Download now and impress your audience.
Four Arrows Process Chart Ppt PowerPoint Presentation File Shapes PDF
Presenting this set of slides with name four arrows process chart ppt powerpoint presentation file shapes pdf. This is a four stage process. The stages in this process are four arrows process chart. This is a completely editable PowerPoint presentation and is available for immediate download. Download now and impress your audience.
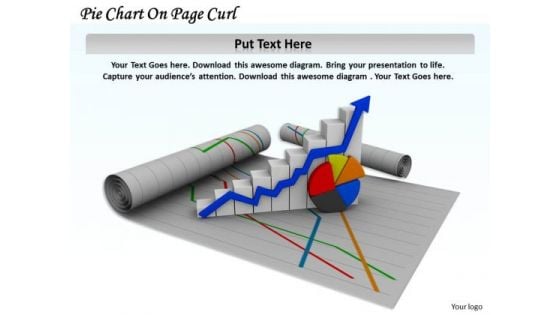
Stock Photo Pie Chart On Page Curl Arrow PowerPoint Slide
This image slide displays pie chart and growth bar graph on page curl. Use this image slide, in your presentations to express views on progress, growth and achievements. This image slide may also be used to depict strategic business planning. Make professional presentations using this image slide.
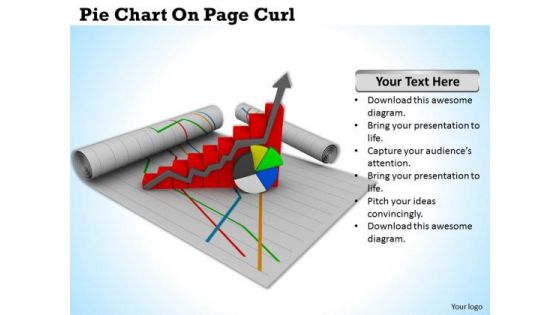
Stock Photo Pie Chart On Page Curl PowerPoint Slide
This image slide displays pie chart and growth bar graph on page curl on blue shaded background. Use this image slide, in your presentations to express views on progress, growth and achievements. This image slide may also be used to depict strategic business planning. Make professional presentations using this image slide.
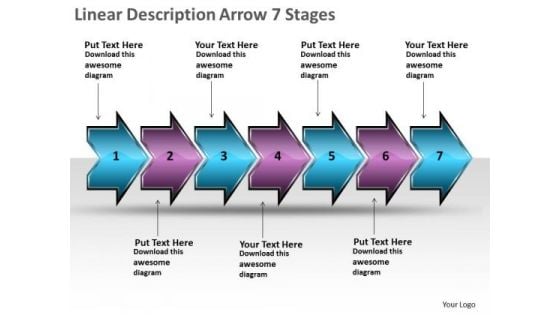
Linear Description Arrow 7 Stages Flow Chart Slides PowerPoint
We present our linear description arrow 7 stages flow chart Slides PowerPoint. Use our Arrows PowerPoint Templates because; discuss each path to the smallest detail. Use our Marketing PowerPoint Templates because, you have some great folks working with you, thinking with you. Use our Success PowerPoint Templates because, they enhance the essence of your viable ideas. Use our Process and Flows PowerPoint Templates because, you are the star of your enlightened team. Use our Business PowerPoint Templates because, Marketing Strategy Business Template:- maximizing sales of your product is the intended destination. Use these PowerPoint slides for presentations relating to Abstract, Arrow, Arrows, Business, Chart, Design, Development, Diagram, Direction, Element, Flow, Flowchart, Graph, Linear, Management, Model, Motion, Organization, Plan, Process, Program, Section, Segment, Set, Sign, Solution, Strategy, Symbol, Technology. The prominent colors used in the PowerPoint template are Blue, Purple, and Black Present technologically advanced operations with our Linear Description Arrow 7 Stages Flow Chart Slides PowerPoint. They will make you look good.
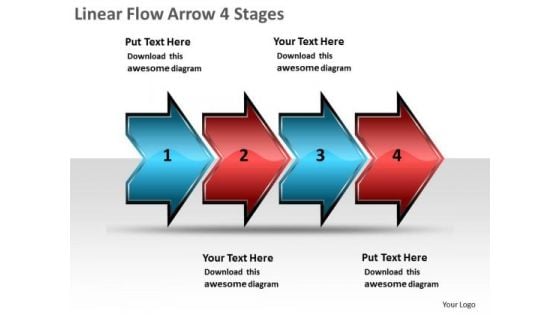
Linear Flow Arrow 4 Stages Chart Slides PowerPoint
We present our linear flow arrow 4 stages chart Slides PowerPoint. Use our Arrows PowerPoint Templates because; Get them in the desired sequence into the bracket. Use our Marketing PowerPoint Templates because; Lay down the fundamentals to build upon. Use our Success PowerPoint Templates because; educate your listeners on the means to keep it ticking over. Use our Process and Flows PowerPoint Templates because; Place them where they need to be. Use our Business PowerPoint Templates because, However it requires care and diligence to function well. Use these PowerPoint slides for presentations relating to Abstract, Arrow, Arrows, Business, Chart, Design, Development, Diagram, Direction, Element, Flow, Flowchart, Graph, Linear, Management, Model, Motion, Organization, Plan, Process, Program, Section, Segment, Set, Sign, Solution, Strategy, Symbol, Technology. The prominent colors used in the PowerPoint template are Blue, Red, and Black Educate teams with our Linear Flow Arrow 4 Stages Chart Slides PowerPoint. Download without worries with our money back guaranteee.
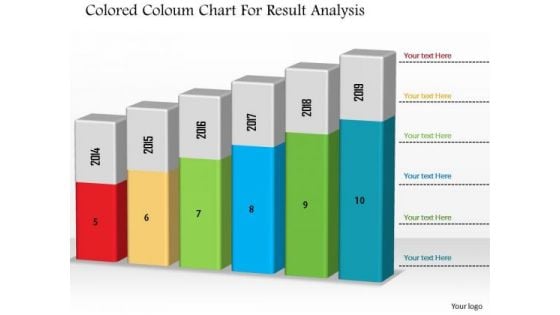
Business Diagram Colored Column Chart For Result Analysis PowerPoint Slide
This Power Point diagram has been designed with graphic of column chart. It contains diagram of bar char depicting annual business progress report. Use this diagram to build professional presentations for your viewers.
Food Macros Chart In Powerpoint And Google Slides Cpb
Presenting our innovatively designed set of slides titled Food Macros Chart In Powerpoint And Google Slides Cpb. This completely editable PowerPoint graphic exhibits Food Macros Chart that will help you convey the message impactfully. It can be accessed with Google Slides and is available in both standard screen and widescreen aspect ratios. Apart from this, you can download this well structured PowerPoint template design in different formats like PDF, JPG, and PNG. So, click the download button now to gain full access to this PPT design. Our Food Macros Chart In Powerpoint And Google Slides Cpb are topically designed to provide an attractive backdrop to any subject. Use them to look like a presentation pro.
Ursodeoxycholic Acid Dosage Chart In Powerpoint And Google Slides Cpb
Introducing our well designed Ursodeoxycholic Acid Dosage Chart In Powerpoint And Google Slides Cpb This PowerPoint design presents information on topics like Ursodeoxycholic Acid Dosage Chart As it is predesigned it helps boost your confidence level. It also makes you a better presenter because of its high quality content and graphics. This PPT layout can be downloaded and used in different formats like PDF, PNG, and JPG. Not only this, it is available in both Standard Screen and Widescreen aspect ratios for your convenience. Therefore, click on the download button now to persuade and impress your audience. Our Ursodeoxycholic Acid Dosage Chart In Powerpoint And Google Slides Cpb are topically designed to provide an attractive backdrop to any subject. Use them to look like a presentation pro.
Vaccines Effectiveness Chart In Powerpoint And Google Slides Cpb
Presenting our innovatively designed set of slides titled Vaccines Effectiveness Chart In Powerpoint And Google Slides Cpb. This completely editable PowerPoint graphic exhibits Vaccines Effectiveness Chart that will help you convey the message impactfully. It can be accessed with Google Slides and is available in both standard screen and widescreen aspect ratios. Apart from this, you can download this well structured PowerPoint template design in different formats like PDF, JPG, and PNG. So, click the download button now to gain full access to this PPT design. Our Vaccines Effectiveness Chart In Powerpoint And Google Slides Cpb are topically designed to provide an attractive backdrop to any subject. Use them to look like a presentation pro.
Kindle Tablet Comparison Chart In Powerpoint And Google Slides Cpb
Introducing our well designed Kindle Tablet Comparison Chart In Powerpoint And Google Slides Cpb This PowerPoint design presents information on topics like Kindle Tablet Comparison Chart As it is predesigned it helps boost your confidence level. It also makes you a better presenter because of its high quality content and graphics. This PPT layout can be downloaded and used in different formats like PDF, PNG, and JPG. Not only this, it is available in both Standard Screen and Widescreen aspect ratios for your convenience. Therefore, click on the download button now to persuade and impress your audience. Our Kindle Tablet Comparison Chart In Powerpoint And Google Slides Cpb are topically designed to provide an attractive backdrop to any subject. Use them to look like a presentation pro.
Blood Pressure Chart In Powerpoint And Google Slides Cpb
Introducing our well designed Blood Pressure Chart In Powerpoint And Google Slides Cpb. This PowerPoint design presents information on topics like Blood Pressure Chart. As it is predesigned it helps boost your confidence level. It also makes you a better presenter because of its high quality content and graphics. This PPT layout can be downloaded and used in different formats like PDF, PNG, and JPG. Not only this, it is available in both Standard Screen and Widescreen aspect ratios for your convenience. Therefore, click on the download button now to persuade and impress your audience. Our Blood Pressure Chart In Powerpoint And Google Slides Cpb are topically designed to provide an attractive backdrop to any subject. Use them to look like a presentation pro.
Hockey Cage Size Chart In Powerpoint And Google Slides Cpb
Presenting our innovatively designed set of slides titled Hockey Cage Size Chart In Powerpoint And Google Slides Cpb. This completely editable PowerPoint graphic exhibits Hockey Cage Size Chart that will help you convey the message impactfully. It can be accessed with Google Slides and is available in both standard screen and widescreen aspect ratios. Apart from this, you can download this well structured PowerPoint template design in different formats like PDF, JPG, and PNG. So, click the download button now to gain full access to this PPT design. Our Hockey Cage Size Chart In Powerpoint And Google Slides Cpb are topically designed to provide an attractive backdrop to any subject. Use them to look like a presentation pro.
Dehydration Headache Location Chart In Powerpoint And Google Slides Cpb
Introducing our well designed Dehydration Headache Location Chart In Powerpoint And Google Slides Cpb. This PowerPoint design presents information on topics like Dehydration Headache Location Chart. As it is predesigned it helps boost your confidence level. It also makes you a better presenter because of its high quality content and graphics. This PPT layout can be downloaded and used in different formats like PDF, PNG, and JPG. Not only this, it is available in both Standard Screen and Widescreen aspect ratios for your convenience. Therefore, click on the download button now to persuade and impress your audience. Our Dehydration Headache Location Chart In Powerpoint And Google Slides Cpb are topically designed to provide an attractive backdrop to any subject. Use them to look like a presentation pro.
Should Oxygen Levels Chart In Powerpoint And Google Slides Cpb
Presenting our innovatively designed set of slides titled Should Oxygen Levels Chart In Powerpoint And Google Slides Cpb This completely editable PowerPoint graphic exhibits Should Oxygen Levels Chart that will help you convey the message impactfully. It can be accessed with Google Slides and is available in both standard screen and widescreen aspect ratios. Apart from this, you can download this well structured PowerPoint template design in different formats like PDF, JPG, and PNG. So, click the download button now to gain full access to this PPT design. Our Should Oxygen Levels Chart In Powerpoint And Google Slides Cpb are topically designed to provide an attractive backdrop to any subject. Use them to look like a presentation pro.
Comparison Chart Template Powerpoint In Powerpoint And Google Slides Cpb
Introducing our well-designed Comparison Chart Template Powerpoint In Powerpoint And Google Slides Cpb. This PowerPoint design presents information on topics like Comparison Chart Template Powerpoint. As it is predesigned it helps boost your confidence level. It also makes you a better presenter because of its high-quality content and graphics. This PPT layout can be downloaded and used in different formats like PDF, PNG, and JPG. Not only this, it is available in both Standard Screen and Widescreen aspect ratios for your convenience. Therefore, click on the download button now to persuade and impress your audience. Our Comparison Chart Template Powerpoint In Powerpoint And Google Slides Cpb are topically designed to provide an attractive backdrop to any subject. Use them to look like a presentation pro.
Language Milestone Timeline Chart In Powerpoint And Google Slides Cpb
Presenting our innovatively-designed set of slides titled Language Milestone Timeline Chart In Powerpoint And Google Slides Cpb. This completely editable PowerPoint graphic exhibits Language Milestone Timeline Chart that will help you convey the message impactfully. It can be accessed with Google Slides and is available in both standard screen and widescreen aspect ratios. Apart from this, you can download this well-structured PowerPoint template design in different formats like PDF, JPG, and PNG. So, click the download button now to gain full access to this PPT design. Our Language Milestone Timeline Chart In Powerpoint And Google Slides Cpb are topically designed to provide an attractive backdrop to any subject. Use them to look like a presentation pro.
Processor Comparison Chart In Powerpoint And Google Slides Cpb
Introducing our well-designed Processor Comparison Chart In Powerpoint And Google Slides Cpb. This PowerPoint design presents information on topics like Processor Comparison Chart. As it is predesigned it helps boost your confidence level. It also makes you a better presenter because of its high-quality content and graphics. This PPT layout can be downloaded and used in different formats like PDF, PNG, and JPG. Not only this, it is available in both Standard Screen and Widescreen aspect ratios for your convenience. Therefore, click on the download button now to persuade and impress your audience. Our Processor Comparison Chart In Powerpoint And Google Slides Cpb are topically designed to provide an attractive backdrop to any subject. Use them to look like a presentation pro.
Design Chart Paper In Powerpoint And Google Slides Cpb
Introducing our well designed Design Chart Paper In Powerpoint And Google Slides Cpb. This PowerPoint design presents information on topics like Design Chart Paper. As it is predesigned it helps boost your confidence level. It also makes you a better presenter because of its high quality content and graphics. This PPT layout can be downloaded and used in different formats like PDF, PNG, and JPG. Not only this, it is available in both Standard Screen and Widescreen aspect ratios for your convenience. Therefore, click on the download button now to persuade and impress your audience. Our Design Chart Paper In Powerpoint And Google Slides Cpb are topically designed to provide an attractive backdrop to any subject. Use them to look like a presentation pro.
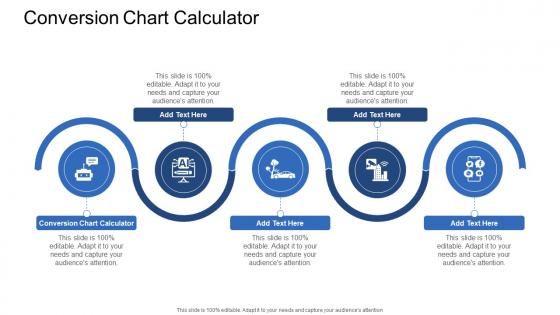
Conversion Chart Calculator In Powerpoint And Google Slides Cpb
Introducing our well designed Conversion Chart Calculator In Powerpoint And Google Slides Cpb. This PowerPoint design presents information on topics like Conversion Chart Calculator. As it is predesigned it helps boost your confidence level. It also makes you a better presenter because of its high quality content and graphics. This PPT layout can be downloaded and used in different formats like PDF, PNG, and JPG. Not only this, it is available in both Standard Screen and Widescreen aspect ratios for your convenience. Therefore, click on the download button now to persuade and impress your audience. Our Conversion Chart Calculator In Powerpoint And Google Slides Cpb are topically designed to provide an attractive backdrop to any subject. Use them to look like a presentation pro.

Organizational Hierarchy Chart Food And Grocery Retail Ppt Example
This slide covers hierarchy chart for supermarket or grocery store. It involves regional managers, merchandising, public relations and vice president distribution. Are you in need of a template that can accommodate all of your creative concepts This one is crafted professionally and can be altered to fit any style. Use it with Google Slides or PowerPoint. Include striking photographs, symbols, depictions, and other visuals. Fill, move around, or remove text boxes as desired. Test out color palettes and font mixtures. Edit and save your work, or work with colleagues. Download Organizational Hierarchy Chart Food And Grocery Retail Ppt Example and observe how to make your presentation outstanding. Give an impeccable presentation to your group and make your presentation unforgettable. This slide covers hierarchy chart for supermarket or grocery store. It involves regional managers, merchandising, public relations and vice president distribution.
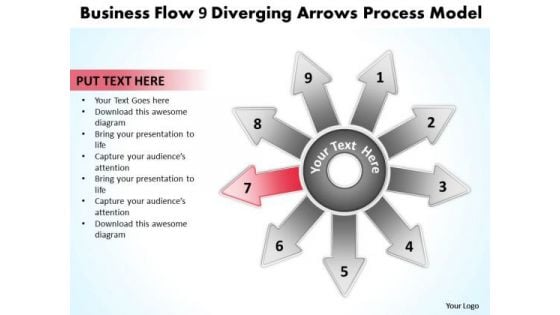
Templates Flow 9 Diverging Arrows Process Model Cycle Chart PowerPoint
We present our templates flow 9 diverging arrows process model Cycle Chart PowerPoint.Download our Business PowerPoint Templates because everybody knows The world over it is a priority for many. Along with it there are so many oppurtunities waiting to be utilised. Download and present our Shapes PowerPoint Templates because Our PowerPoint Templates and Slides are effectively colour coded to prioritise your plans They automatically highlight the sequence of events you desire. Download and present our Success PowerPoint Templates because the choices you make today will determine the future growth of your enterprise. Present our Process and Flows PowerPoint Templates because this diagram helps you to develop your marketing strategy and communicate your enthusiasm and motivation to raise the bar. Download our Arrows PowerPoint Templates because you can Adorn them with your ideas and thoughts.Use these PowerPoint slides for presentations relating to Arrow, Background, Center, Chart, Clip, Communication, Competition, Computer, Concept, Connect, Connection, Diagram, Direction, Group, Illustration, Information, Network, Process, Progress, Purpose, Strategy, Symbol, Target. The prominent colors used in the PowerPoint template are Pink, White, Gray. People tell us our templates flow 9 diverging arrows process model Cycle Chart PowerPoint are Playful. People tell us our Computer PowerPoint templates and PPT Slides are Ultra. The feedback we get is that our templates flow 9 diverging arrows process model Cycle Chart PowerPoint are Multicolored. Presenters tell us our Computer PowerPoint templates and PPT Slides are Sparkling. Customers tell us our templates flow 9 diverging arrows process model Cycle Chart PowerPoint are No-nonsense. The feedback we get is that our Chart PowerPoint templates and PPT Slides are Exuberant. Curb assumptions with our Templates Flow 9 Diverging Arrows Process Model Cycle Chart PowerPoint. Face up to them with the facts.
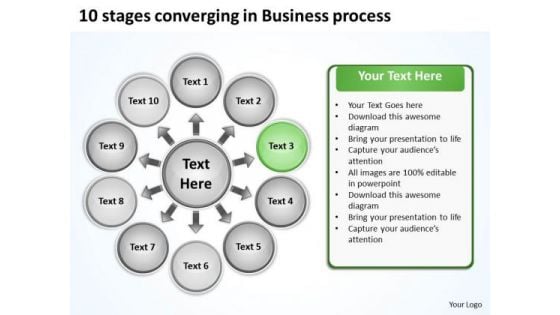
In Business PowerPoint Presentations Process Circular Chart Slides
We present our in business powerpoint presentations process Circular Chart Slides.Present our Arrows PowerPoint Templates because it demonstrates to your audience how the best and most refined ideas pass through. Download and present our Business PowerPoint Templates because it helps you to explain your plans in all earnest to your colleagues and raise the bar for all. Present our Signs PowerPoint Templates because support groups are an essential element of the on going struggle against cancer. Download and present our Shapes PowerPoint Templates because this slide represents the tools of the trade. Use our Spheres PowerPoint Templates because honesty is the best policy has an ardent follower in you.Use these PowerPoint slides for presentations relating to Arrows, Business, Chart, Circular, Commerce, Concept, Contribution, Cycle, Development, Diagram, Global, Idea, Informative, Internet, Join, Making, Manage, Management, Market, Marketing, Partner, Paying, Performance, Plans, Process, Productive, Productivity, Profit, Profitable, Project. The prominent colors used in the PowerPoint template are Green, Black, Gray. Professionals tell us our in business powerpoint presentations process Circular Chart Slides are Zippy. You can be sure our Chart PowerPoint templates and PPT Slides are Attractive. Customers tell us our in business powerpoint presentations process Circular Chart Slides will help you be quick off the draw. Just enter your specific text and see your points hit home. Professionals tell us our Circular PowerPoint templates and PPT Slides are Classic. People tell us our in business powerpoint presentations process Circular Chart Slides will generate and maintain the level of interest you desire. They will create the impression you want to imprint on your audience. People tell us our Cycle PowerPoint templates and PPT Slides are Nostalgic. Exhibit your talent with our In Business PowerPoint Presentations Process Circular Chart Slides. Let the audience see your dexterity.
Linear Steps Timeline Chart And Icons Powerpoint Slides
This PowerPoint template graphics of linear timeline steps. Download this PPT chart for yearly business performance analysis. This PowerPoint slide is of great help in the business sector to make realistic presentations and provides effective way of presenting your newer thoughts.
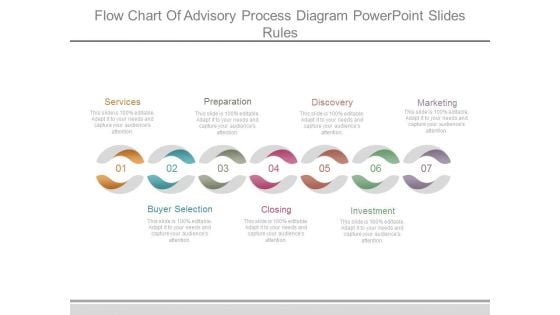
Flow Chart Of Advisory Process Diagram Powerpoint Slides Rules
This is a flow chart of advisory process diagram powerpoint slides rules. This is a seven stage process. The stages in this process are services, buyer selection, preparation, closing, discovery, investment, marketing.
Management Organizational Chart Ppt PowerPoint Presentation Portfolio Icon
This is a management organizational chart ppt powerpoint presentation portfolio icon. This is a three stage process. The stages in this process are tony williams, bill durbin, david johnson, robert fowler, kate jeter.
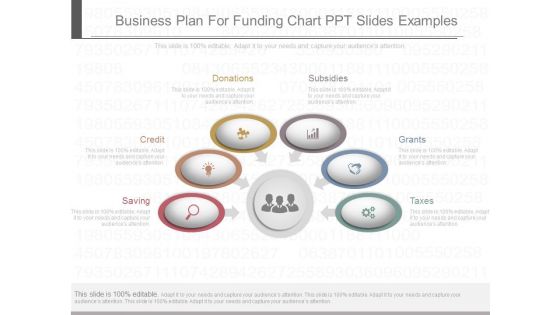
Business Plan For Funding Chart Ppt Slides Examples
This is a business plan for funding chart ppt slides examples. This is a five stage process. The stages in this process are saving, credit, donations, subsidies, grants, taxes.
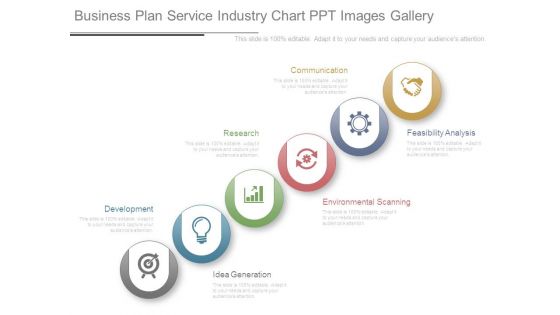
Business Plan Service Industry Chart Ppt Images Gallery
This is a business plan service industry chart ppt images gallery. This is a six stage process. The stages in this process are development, research, communication, idea generation, environmental scanning, feasibility analysis.
Product Marketing Department Team Organizational Chart Icon Professional PDF
Persuade your audience using this Product Marketing Department Team Organizational Chart Icon Professional PDF. This PPT design covers three stages, thus making it a great tool to use. It also caters to a variety of topics including Team Organizational Chart Icon, Product Marketing Department. Download this PPT design now to present a convincing pitch that not only emphasizes the topic but also showcases your presentation skills.
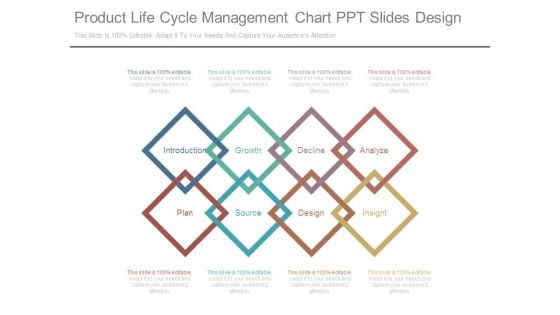
Product Life Cycle Management Chart Ppt Slides Design
This is a product life cycle management chart ppt slides design. This is a eight stage process. The stages in this process are introduction, growth, decline, analyze, plan, source, design, insight.
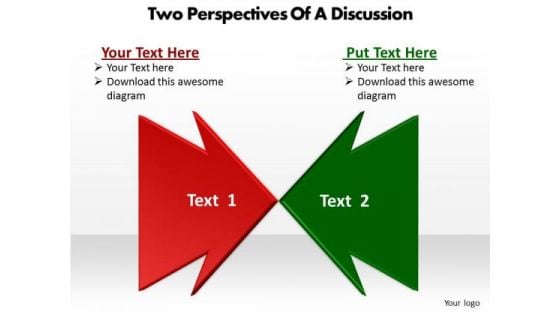
Two Perspectives Of A Discussion Cycle Chart PowerPoint Slides
We present our two perspectives of a discussion Cycle Chart PowerPoint Slides.Use our Marketing PowerPoint Templates because customer satisfaction is a mantra of the marketplace. Building a loyal client base is an essential element of your business. Download and present our Business PowerPoint Templates because your thoughts are pointed and sharp as arrows. Download our Shapes PowerPoint Templates because there is a very good saying that prevention is better than cure, either way you have a store of knowledge for sure. Use our Finance PowerPoint Templates because you have the right arrows in your quiver. Use our Symbol PowerPoint Templates because this Slide offers an excellent background to build up the various stages of your business process.Use these PowerPoint slides for presentations relating to Arrow, Background, Banner, Bar, Blue, Collection, Completed, Completion, Concept, Confirmation, Design, Five, Flow, Four, Graph, Graphic, Illustration, Indication, Indicator, Information, Instruction, Interface, Internet, Layout, Measurement, Modern, Number, One, Order, Phase, Pointer, Process, Progress, Reflection, Scale, Send, Set, Shape, Stage, Status, Step, Design, Web, Design, Elements. The prominent colors used in the PowerPoint template are Red, Green, Black. We assure you our two perspectives of a discussion Cycle Chart PowerPoint Slides are Sparkling. Customers tell us our Bar PowerPoint templates and PPT Slides are Radiant. The feedback we get is that our two perspectives of a discussion Cycle Chart PowerPoint Slides are Bright. We assure you our Collection PowerPoint templates and PPT Slides will get their audience's attention. People tell us our two perspectives of a discussion Cycle Chart PowerPoint Slides are Efficient. We assure you our Completed PowerPoint templates and PPT Slides are Efficient. Diversify plans with our Two Perspectives Of A Discussion Cycle Chart PowerPoint Slides. Download without worries with our money back guaranteee.
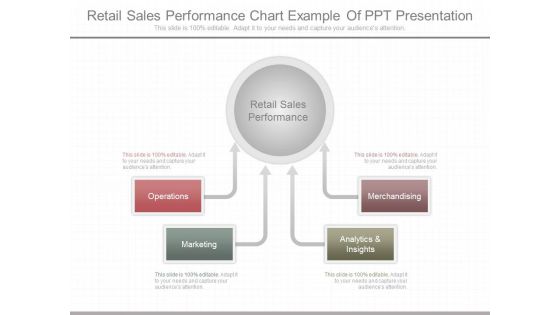
Retail Sales Performance Chart Example Of Ppt Presentation
This is a retail sales performance chart example of ppt presentation. This is a four stage process. The stages in this process are operations, marketing, analytics and insights, merchandising, retail sales performance.
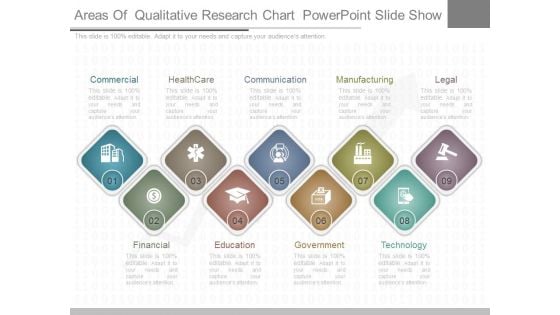
Areas Of Qualitative Research Chart Powerpoint Slide Show
This is a areas of qualitative research chart powerpoint slide show. This is a nine stage process. The stages in this process are commercial, healthcare, communication, manufacturing, legal, financial,, education, government, technology.
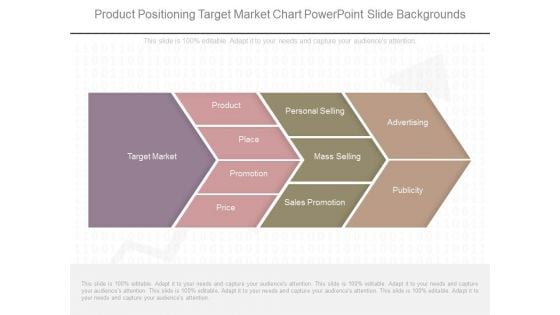
Product Positioning Target Market Chart Powerpoint Slide Backgrounds
This is a product positioning target market chart powerpoint slide backgrounds. This is a four stage process. The stages in this process are target market, product, place, promotion, price, personal selling, mass selling, sales promotion, advertising, publicity.
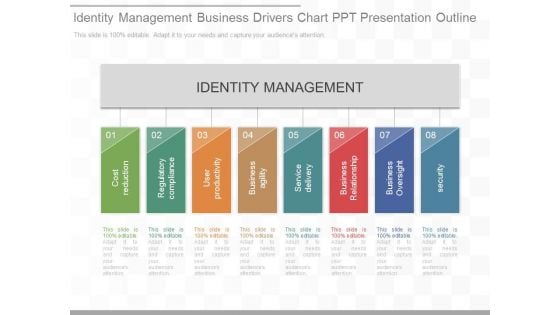
Identity Management Business Drivers Chart Ppt Presentation Outline
This is a identity management business drivers chart ppt presentation outline. This is a eight stage process. The stages in this process are identity management, cost reduction, regulatory compliance, user productivity, business agility, service delivery, business relationship, business oversight, security.
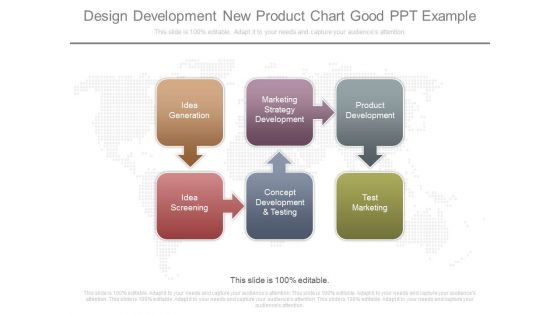
Design Development New Product Chart Good Ppt Example
This is a design development new product chart good ppt example. This is a six stage process. The stages in this process are idea generation, marketing strategy development, product development, idea screening, concept development and testing, test marketing.
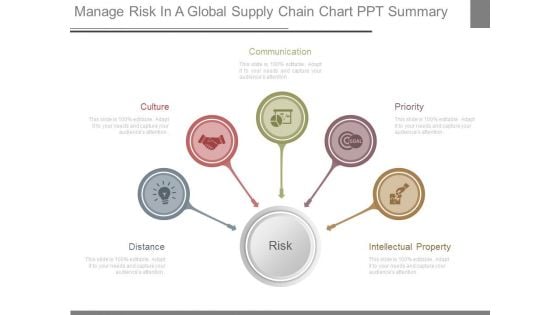
Manage Risk In A Global Supply Chain Chart Ppt Summary
This is a Manage Risk In A Global Supply Chain Chart Ppt Summary. This is a five stage process. The stages in this process are distance, culture, communication, priority, intellectual property, risk.
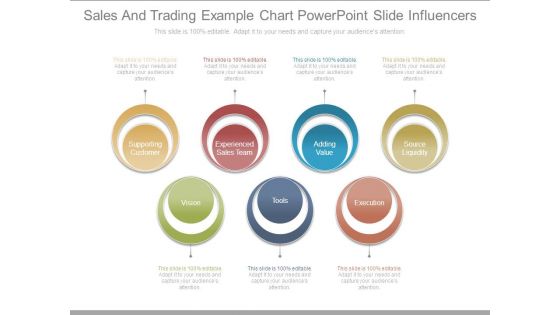
Sales And Trading Example Chart Powerpoint Slide Influencers
This is a sales and trading example chart powerpoint slide influencers. This is a seven stage process. The stages in this process are supporting customer, experienced sales team, adding value, source liquidity, vision, tools, execution.
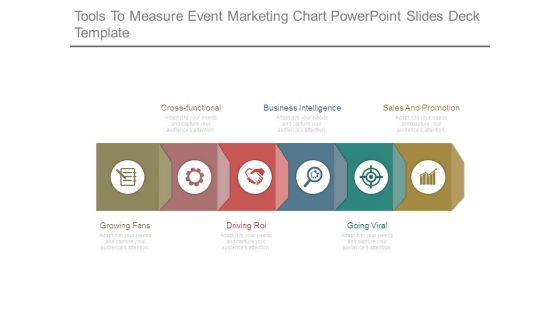
Tools To Measure Event Marketing Chart Powerpoint Slides Deck Template
This is a tools to measure event marketing chart powerpoint slides deck template. This is a six stage process. The stages in this process are cross functional, business intelligence, sales and promotion, going viral, driving roi, growing fans.
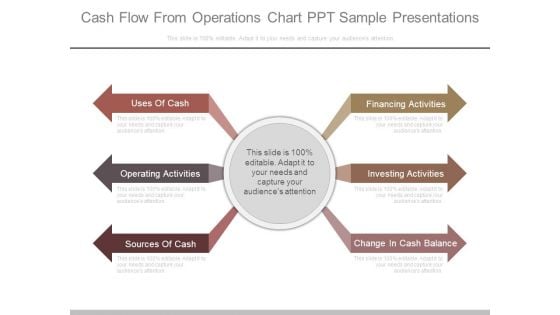
Cash Flow From Operations Chart Ppt Sample Presentations
This is a cash flow from operations chart ppt sample presentations. This is a six stage process. The stages in this process are uses of cash, operating activities, sources of cash, financing activities, investing activities, change in cash balance.


 Continue with Email

 Home
Home


