Line Graph
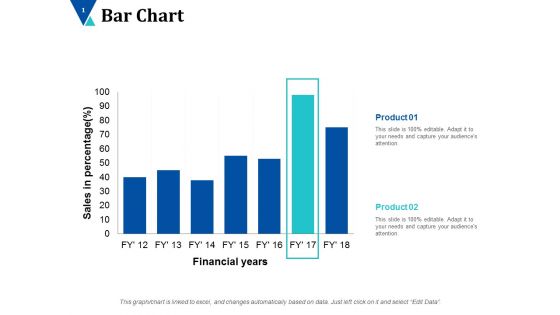
Bar Chart Finance Ppt PowerPoint Presentation Infographics Background Images
This is a bar chart finance ppt powerpoint presentation infographics background images. This is a seven stages process. The stages in this process are alpha testing, beta testing, full scale show.
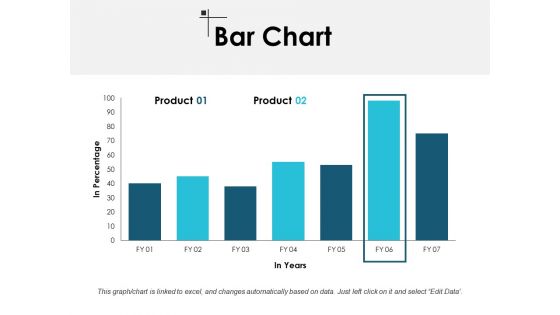
Bar Chart Finance Ppt PowerPoint Presentation Model Master Slide
This is a bar chart finance ppt powerpoint presentation model master slide. This is a two stage process. The stages in this process are finance, marketing, management, investment, analysis.
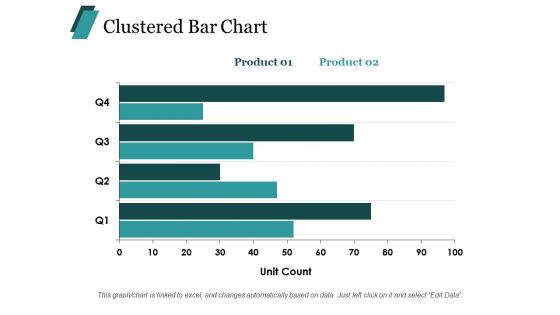
Clustered Bar Chart Finance Ppt PowerPoint Presentation Summary Layouts
This is a clustered bar chart finance ppt powerpoint presentation summary layouts. This is a two stage process. The stages in this process are finance, marketing, management, investment, analysis.
Clustered Bar Chart Marketing Ppt PowerPoint Presentation Layouts Icon
This is a clustered bar chart marketing ppt powerpoint presentation layouts icon. This is a four stage process. The stages in this process are finance, marketing, analysis, business, investment.
Bar Chart Finance Marketing Ppt PowerPoint Presentation Icon Display
This is a bar chart finance marketing ppt powerpoint presentation icon display. This is a three stage process. The stages in this process are finance, analysis, business, investment, marketing.
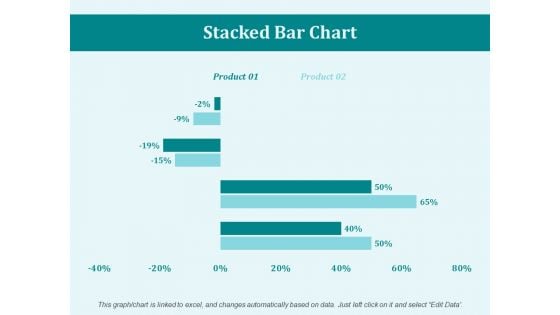
Stacked Bar Chart Percentage Ppt PowerPoint Presentation Portfolio Mockup
This is a stacked bar chart percentage ppt powerpoint presentation portfolio mockup. This is a two stage process. The stages in this process are business, marketing, management, percentage, product.
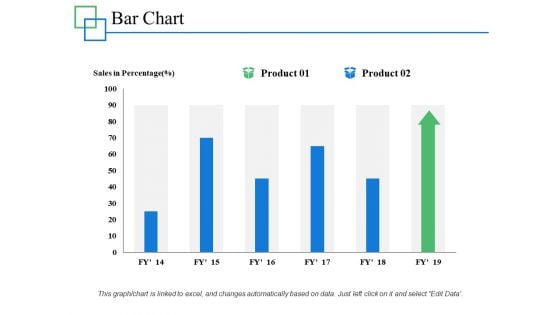
Bar Chart Percentage Product Ppt PowerPoint Presentation Layouts Designs Download
This is a bar chart percentage product ppt powerpoint presentation layouts designs download. This is a two stage process. The stages in this process are percentage, product, business, management.

Bar Chart Finance Marketing Ppt PowerPoint Presentation File Good
This is a bar chart finance marketing ppt powerpoint presentation file good. This is a three stage process. The stages in this process are finance, marketing, management, investment, analysis.
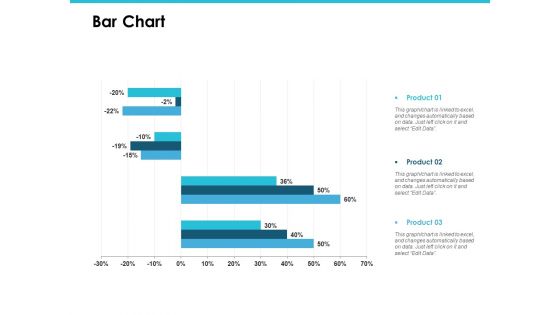
Bar Chart Management Investment Ppt PowerPoint Presentation File Rules
This is a bar chart management investment ppt powerpoint presentation file rules. This is a three stage process. The stages in this process are finance, marketing, management, investment, analysis.
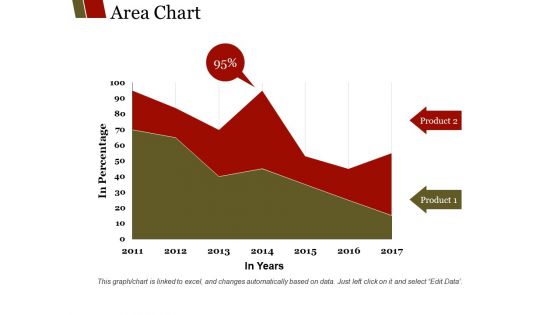
Area Chart Ppt PowerPoint Presentation Show Templates
This is a area chart ppt powerpoint presentation show templates. This is a two stage process. The stages in this process are product, in percentage, in years, finance, graph.
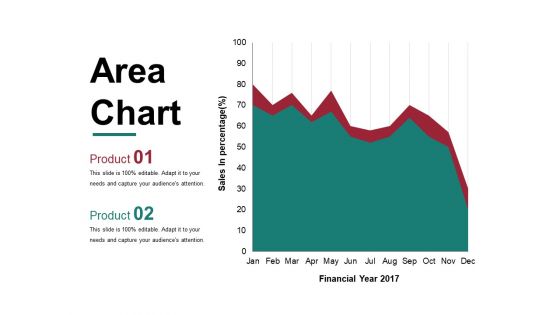
Area Chart Ppt PowerPoint Presentation Layouts Maker
This is a area chart ppt powerpoint presentation layouts maker. This is a two stage process. The stages in this process are financial year, sales in percentage, graph, business, marketing.
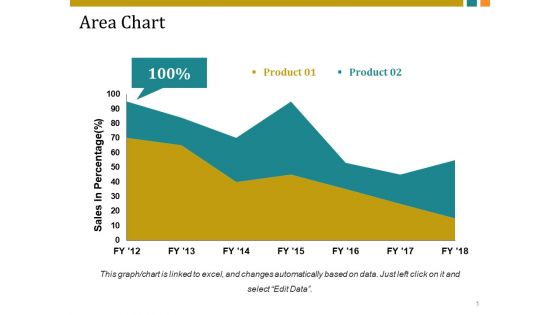
Area Chart Ppt PowerPoint Presentation Professional Brochure
This is a area chart ppt powerpoint presentation professional brochure. This is a two stage process. The stages in this process are sales in percentage, business, marketing, finance, graph.
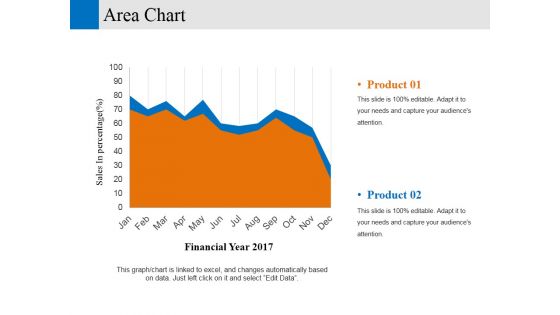
area chart ppt powerpoint presentation professional elements
This is a area chart ppt powerpoint presentation professional elements. This is a two stage process. The stages in this process are financial year sales in percentage, business, marketing, graph.
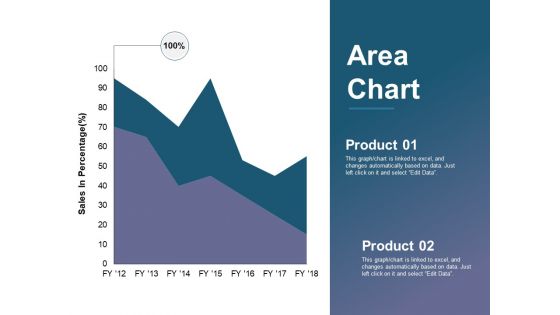
Area Chart Ppt PowerPoint Presentation Summary Information
This is a area chart ppt powerpoint presentation summary information. This is a two stage process. The stages in this process are business, sales in percentage, percentage, marketing, graph.
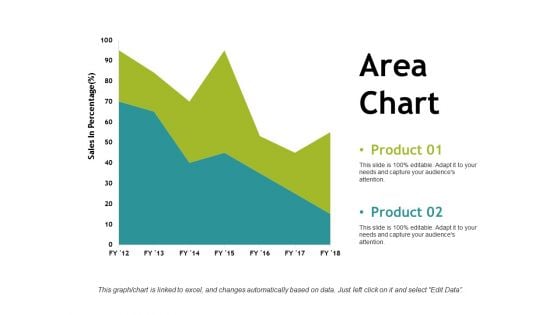
Area Chart Ppt PowerPoint Presentation File Visuals
This is a area chart ppt powerpoint presentation file visuals. This is a two stage process. The stages in this process are business, sales in percentage, marketing, graph, strategy, finance.
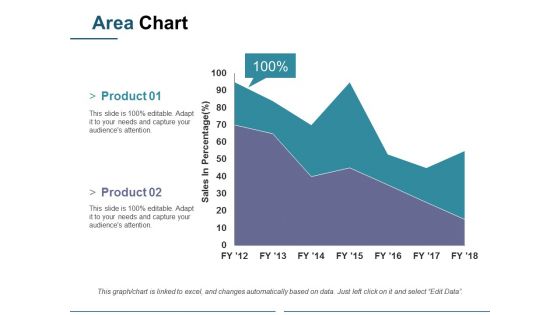
Area Chart Ppt PowerPoint Presentation Pictures Vector
This is a area chart ppt powerpoint presentation pictures vector. This is a two stage process. The stages in this process are sales in percentage, business, marketing, graph, percentage.
Area Chart Ppt PowerPoint Presentation Icon Aids
This is a area chart ppt powerpoint presentation icon aids. This is a three stage process. The stages in this process are financial years, sales in percentage, business, marketing, graph.
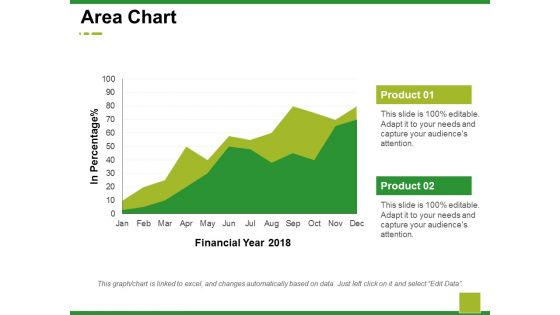
Area Chart Ppt PowerPoint Presentation Model Demonstration
This is a area chart ppt powerpoint presentation model demonstration. This is a two stage process. The stages in this process are business, marketing, financial year, in percentage, graph.
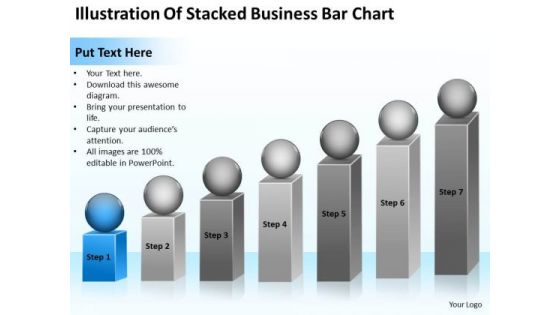
Illustration Of Stacked Business Bar Chart Ppt Consultant Plan PowerPoint Templates
We present our illustration of stacked business bar chart ppt consultant plan PowerPoint templates.Use our Process and Flows PowerPoint Templates because You will get more than you ever bargained for. Use our Spheres PowerPoint Templates because Our PowerPoint Templates and Slides provide you with a vast range of viable options. Select the appropriate ones and just fill in your text. Download our Flow Charts PowerPoint Templates because Our PowerPoint Templates and Slides are topically designed to provide an attractive backdrop to any subject. Present our Business PowerPoint Templates because You should Ascend the ladder of success with ease. Our PowerPoint Templates and Slides will provide strong and sturdy steps. Download our Shapes PowerPoint Templates because Our PowerPoint Templates and Slides will help you be quick off the draw. Just enter your specific text and see your points hit home.Use these PowerPoint slides for presentations relating to Diagram, chart, market, statistics, square, grow, infograph, bar, corporate, red, business, vector, success, presentation, growing, circle, finance,analyst, goal, report, marketing, different, accounting, management, graph, illustration, geometric, sphere, design, growth, infographic, progress, profit,information, increase, aim, analyze, financial, rising, measure, block. The prominent colors used in the PowerPoint template are Gray, Blue, Gray. Embark upon an epic journey. Chart it out to the last detail on our Illustration Of Stacked Business Bar Chart Ppt Consultant Plan PowerPoint Templates.
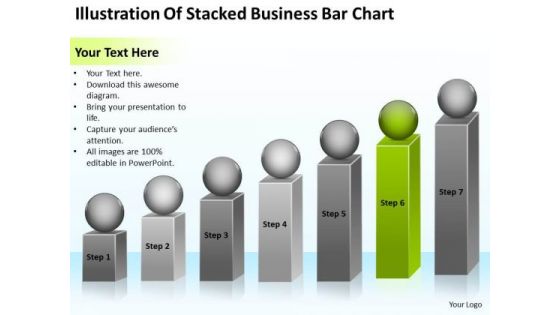
Illustration Of Stacked Business Bar Chart Ppt How To Start Plan PowerPoint Slides
We present our illustration of stacked business bar chart ppt how to start plan PowerPoint Slides.Present our Process and Flows PowerPoint Templates because Our PowerPoint Templates and Slides will let you Clearly mark the path for others to follow. Use our Flow Charts PowerPoint Templates because Our PowerPoint Templates and Slides are created by a hardworking bunch of busybees. Always flitting around with solutions gauranteed to please. Download and present our Business PowerPoint Templates because Our PowerPoint Templates and Slides will give you great value for your money. Be assured of finding the best projection to highlight your words. Present our Spheres PowerPoint Templates because our PowerPoint Templates and Slides are the string of your bow. Fire of your ideas and conquer the podium. Use our Marketing PowerPoint Templates because You can Zap them with our PowerPoint Templates and Slides. See them reel under the impact.Use these PowerPoint slides for presentations relating to Diagram, chart, market, statistics, square, grow, infograph, bar, corporate, red, business, vector, success, presentation, growing, circle, finance,analyst, goal, report, marketing, different, accounting, management, graph, illustration, geometric, sphere, design, growth, infographic, progress, profit,information, increase, aim, analyze, financial, rising, measure, block. The prominent colors used in the PowerPoint template are Green, Black, Gray. Recognize your calling with our Illustration Of Stacked Business Bar Chart Ppt How To Start Plan PowerPoint Slides. Download without worries with our money back guaranteee.
Illustration Of Stacked Business Bar Chart Ppt Plan For Hair Salon PowerPoint Templates
We present our illustration of stacked business bar chart ppt plan for hair salon PowerPoint templates.Download our Business PowerPoint Templates because you should Experience excellence with our PowerPoint Templates and Slides. They will take your breath away. Download our Spheres PowerPoint Templates because Our PowerPoint Templates and Slides will Activate the energies of your audience. Get their creative juices flowing with your words. Download our Marketing PowerPoint Templates because Our PowerPoint Templates and Slides are created with admirable insight. Use them and give your group a sense of your logical mind. Present our Process and Flows PowerPoint Templates because you should Whip up a frenzy with our PowerPoint Templates and Slides. They will fuel the excitement of your team. Download and present our Flow Charts PowerPoint Templates because Our PowerPoint Templates and Slides will let you Hit the target. Go the full distance with ease and elan.Use these PowerPoint slides for presentations relating to Diagram, chart, market, statistics, square, grow, infograph, bar, corporate, red, business, vector, success, presentation, growing, circle, finance,analyst, goal, report, marketing, different, accounting, management, graph, illustration, geometric, sphere, design, growth, infographic, progress, profit,information, increase, aim, analyze, financial, rising, measure, block. The prominent colors used in the PowerPoint template are Black, Green, Gray. Encourage teams with our Illustration Of Stacked Business Bar Chart Ppt Plan For Hair Salon PowerPoint Templates. Download without worries with our money back guaranteee.
Illustration Of Stacked Business Bar Chart Start Up Plan PowerPoint Templates
We present our illustration of stacked business bar chart start up plan PowerPoint templates.Use our Flow Charts PowerPoint Templates because Our PowerPoint Templates and Slides will bullet point your ideas. See them fall into place one by one. Use our Process and Flows PowerPoint Templates because Our PowerPoint Templates and Slides are Clear and concise. Use them and dispel any doubts your team may have. Download and present our Spheres PowerPoint Templates because It can Leverage your style with our PowerPoint Templates and Slides. Charm your audience with your ability. Download our Marketing PowerPoint Templates because Our PowerPoint Templates and Slides will let you Hit the right notes. Watch your audience start singing to your tune. Present our Shapes PowerPoint Templates because Our PowerPoint Templates and Slides are the chords of your song. String them along and provide the lilt to your views.Use these PowerPoint slides for presentations relating to Diagram, chart, market, statistics, square, grow, infograph, bar, corporate, red, business, vector, success, presentation, growing, circle, finance,analyst, goal, report, marketing, different, accounting, management, graph, illustration, geometric, sphere, design, growth, infographic, progress, profit,information, increase, aim, analyze, financial, rising, measure, block. The prominent colors used in the PowerPoint template are Blue, Black, Gray. Clear the blocks for your thoughts. Open up the pipeline with our Illustration Of Stacked Business Bar Chart Start Up Plan PowerPoint Templates.
Illustration Of Stacked Business Bar Chart Ppt Examples Plan PowerPoint Templates
We present our illustration of stacked business bar chart ppt examples plan PowerPoint templates.Present our Flow Charts PowerPoint Templates because You can Bait your audience with our PowerPoint Templates and Slides. They will bite the hook of your ideas in large numbers. Use our Process and Flows PowerPoint Templates because Our PowerPoint Templates and Slides are innately eco-friendly. Their high recall value negate the need for paper handouts. Present our Spheres PowerPoint Templates because These PowerPoint Templates and Slides will give the updraft to your ideas. See them soar to great heights with ease. Present our Marketing PowerPoint Templates because Our PowerPoint Templates and Slides will definately Enhance the stature of your presentation. Adorn the beauty of your thoughts with their colourful backgrounds. Present our Business PowerPoint Templates because Our PowerPoint Templates and Slides are innately eco-friendly. Their high recall value negate the need for paper handouts.Use these PowerPoint slides for presentations relating to Diagram, chart, market, statistics, square, grow, infograph, bar, corporate, red, business, vector, success, presentation, growing, circle, finance,analyst, goal, report, marketing, different, accounting, management, graph, illustration, geometric, sphere, design, growth, infographic, progress, profit,information, increase, aim, analyze, financial, rising, measure, block. The prominent colors used in the PowerPoint template are Blue, Gray, Black. Get your ideas buzzing with our Illustration Of Stacked Business Bar Chart Ppt Examples Plan PowerPoint Templates. They will be flying all around.
Illustration Of Stacked Business Bar Chart Ppt Plans Pro PowerPoint Templates
We present our illustration of stacked business bar chart ppt plans pro PowerPoint templates.Download our Spheres PowerPoint Templates because Our PowerPoint Templates and Slides will let you Clearly mark the path for others to follow. Download our Flow Charts PowerPoint Templates because You should Throw the gauntlet with our PowerPoint Templates and Slides. They are created to take up any challenge. Present our Process and Flows PowerPoint Templates because Your ideas provide food for thought. Our PowerPoint Templates and Slides will help you create a dish to tickle the most discerning palate. Use our Business PowerPoint Templates because Our PowerPoint Templates and Slides will definately Enhance the stature of your presentation. Adorn the beauty of your thoughts with their colourful backgrounds. Use our Shapes PowerPoint Templates because Our PowerPoint Templates and Slides will provide the perfect balance. Your weighty ideas will get the ideal impetus.Use these PowerPoint slides for presentations relating to Diagram, chart, market, statistics, square, grow, infograph, bar, corporate, red, business, vector, success, presentation, growing, circle, finance,analyst, goal, report, marketing, different, accounting, management, graph, illustration, geometric, sphere, design, growth, infographic, progress, profit,information, increase, aim, analyze, financial, rising, measure, block. The prominent colors used in the PowerPoint template are Green, Gray, Black. Advocate ecofrindly approaches in daily business. Encourage your employees with our Illustration Of Stacked Business Bar Chart Ppt Plans Pro PowerPoint Templates.
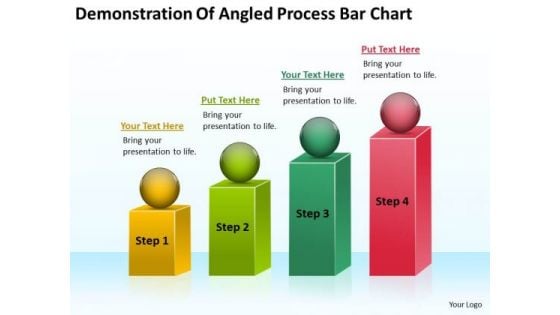
Demonstration Of Angled Process Bar Chart Help Me Write Business Plan PowerPoint Slides
We present our demonstration of angled process bar chart help me write business plan PowerPoint Slides.Download and present our Process and Flows PowerPoint Templates because It will let you Set new benchmarks with our PowerPoint Templates and Slides. They will keep your prospects well above par. Download our Flow Charts PowerPoint Templates because It can Leverage your style with our PowerPoint Templates and Slides. Charm your audience with your ability. Present our Spheres PowerPoint Templates because Our PowerPoint Templates and Slides will weave a web of your great ideas. They are gauranteed to attract even the most critical of your colleagues. Present our Marketing PowerPoint Templates because Our PowerPoint Templates and Slides are like the strings of a tennis racquet. Well strung to help you serve aces. Download our Business PowerPoint Templates because They will Put the wind in your sails. Skim smoothly over the choppy waters of the market.Use these PowerPoint slides for presentations relating to Diagram, chart, market, statistics, square, grow, infograph, bar, corporate, business, vector, success, presentation, growing, circle, finance,analyst, goal, report, marketing, different, accounting, management, graph, illustration, geometric, sphere, design, growth, infographic, progress, profit,information, increase, aim, analyze, financial, rising, measure, block. The prominent colors used in the PowerPoint template are Green, Green lime, Red. Our Demonstration Of Angled Process Bar Chart Help Me Write Business Plan PowerPoint Slides will ensure you are the best presenter in the room. You will be glad you tried us out.
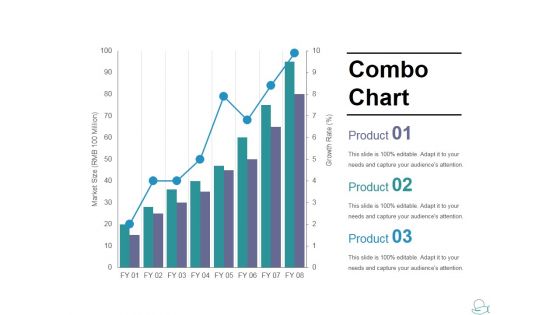
Combo Chart Ppt PowerPoint Presentation Slides Show
This is a combo chart ppt powerpoint presentation slides show. This is a three stage process. The stages in this process are combo chart, market size, product, bar graph, growth.
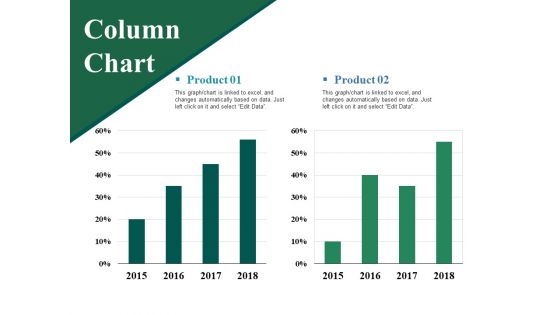
Column Chart Ppt PowerPoint Presentation Layouts Vector
This is a column chart ppt powerpoint presentation layouts vector. This is a two stage process. The stages in this process are product, column chart, bar graph, percentage, finance.
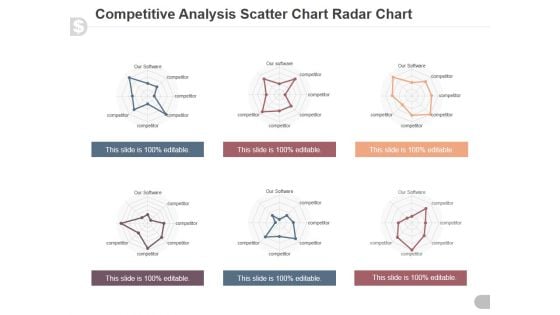
Competitive Analysis Scatter Chart Radar Chart Ppt PowerPoint Presentation Model
This is a competitive analysis scatter chart radar chart ppt powerpoint presentation model. This is a eight stage process. The stages in this process are users interface, data import, example, pricing, support, update, tutorials, easy to use.
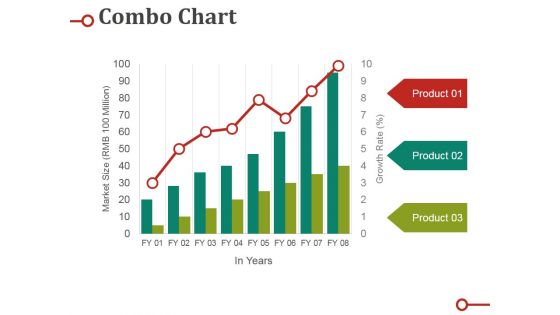
Combo Chart Ppt PowerPoint Presentation Gallery Sample
This is a combo chart ppt powerpoint presentation gallery sample. This is a three stage process. The stages in this process are market size, product, growth rate, bar, graph.
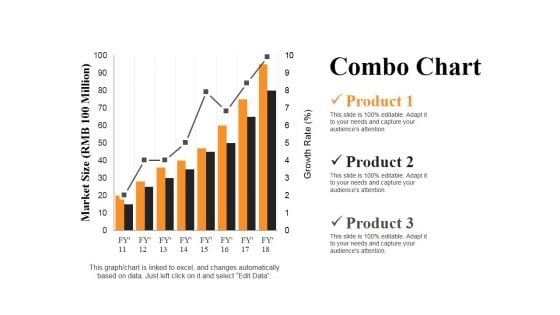
Combo Chart Ppt PowerPoint Presentation Summary Slides
This is a combo chart ppt powerpoint presentation summary slides. This is a three stage process. The stages in this process are market size, product, growth rate, bar graph, success.
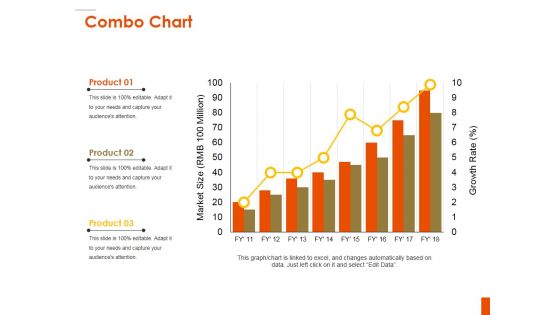
Combo Chart Ppt PowerPoint Presentation Inspiration Background
This is a combo chart ppt powerpoint presentation inspiration background. This is a three stage process. The stages in this process are product, bar graph, market size, growth, growth rate.
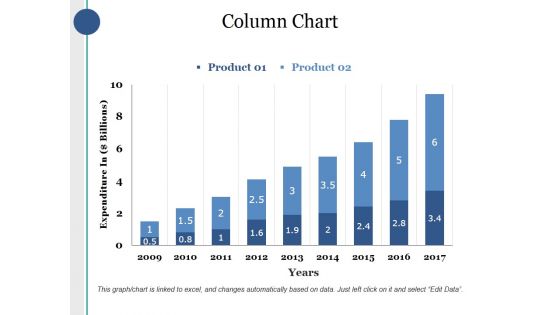
Column Chart Ppt PowerPoint Presentation Infographics Deck
This is a column chart ppt powerpoint presentation infographics deck. This is a two stage process. The stages in this process are product, expenditure in, years, bar graph, growth.
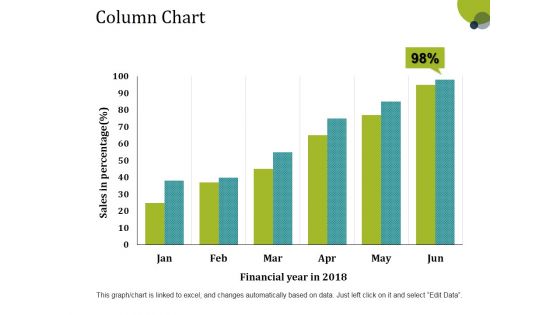
Column Chart Ppt PowerPoint Presentation Layouts Tips
This is a column chart ppt powerpoint presentation layouts tips. This is a six stage process. The stages in this process are sales in percentage, financial year, bar graph, growth, success.
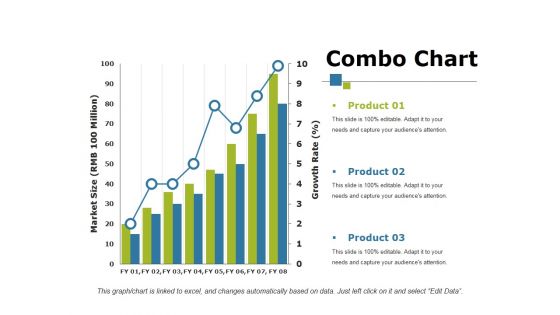
Combo Chart Ppt PowerPoint Presentation Show Influencers
This is a combo chart ppt powerpoint presentation show influencers. This is a three stage process. The stages in this process are product, bar graph, growth, growth rate, market size.
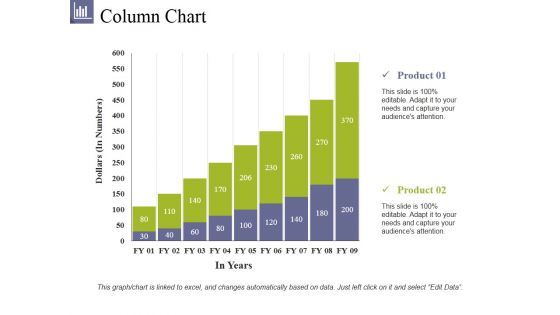
Column Chart Ppt PowerPoint Presentation File Summary
This is a column chart ppt powerpoint presentation file summary. This is a two stage process. The stages in this process are product, dollars, in years, bar graph, growth.
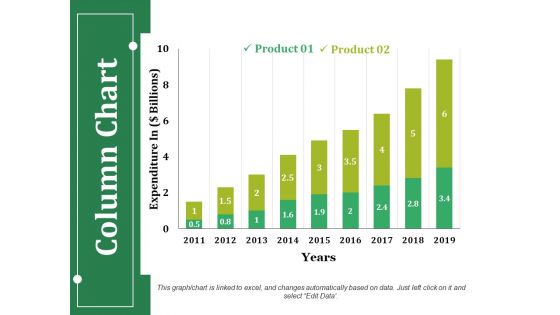
Column Chart Ppt PowerPoint Presentation Infographics Guidelines
This is a column chart ppt powerpoint presentation infographics guidelines. This is a two stage process. The stages in this process are product, expenditure in, years, business, bar graph.
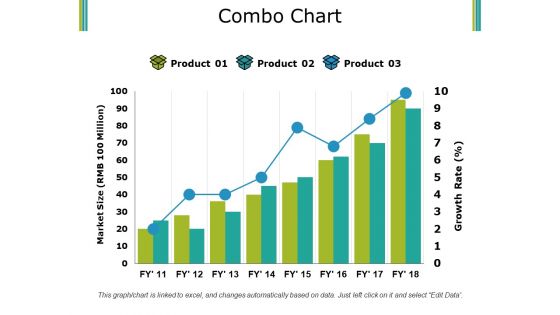
Combo Chart Ppt PowerPoint Presentation Pictures Summary
This is a combo chart ppt powerpoint presentation pictures summary. This is a three stage process. The stages in this process are product, market size, growth rate, bar graph, success.
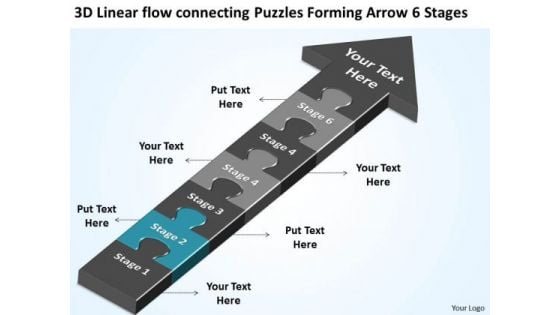
Flow Connecting Puzzles Forming Arrow 6 Stages Juice Bar Business Plan PowerPoint Slides
We present our flow connecting puzzles forming arrow 6 stages juice bar business plan PowerPoint Slides.Download and present our Symbol PowerPoint Templates because this Diagram emphasizes on any critical or key factors within them. Use our Business PowerPoint Templates because you have selected your team man for man. Download and present our Flow charts PowerPoint Templates because you will be able to Highlight these individual targets and the paths to their achievement. Present our Arrows PowerPoint Templates because displaying your ideas and highlighting your ability will accelerate the growth of your company and yours. Download and present our Puzzles or Jigsaws PowerPoint Templates because you have a good idea of the roadmap to your desired destination.Use these PowerPoint slides for presentations relating to 3d, Puzzle, Process, Arrow, Arrows, Block, Business, Chart, Design, Development, Diagram, Direction, Element, Flow, Flowchart, Graph, Linear, Management, Organization, Process, Program, Section, Sign, Solution, Symbol. The prominent colors used in the PowerPoint template are Blue, Gray, Black. Presenters tell us our flow connecting puzzles forming arrow 6 stages juice bar business plan PowerPoint Slides are Tranquil. Use our Design PowerPoint templates and PPT Slides are Awesome. You can be sure our flow connecting puzzles forming arrow 6 stages juice bar business plan PowerPoint Slides are Elegant. Professionals tell us our Chart PowerPoint templates and PPT Slides are Magical. Presenters tell us our flow connecting puzzles forming arrow 6 stages juice bar business plan PowerPoint Slides are One-of-a-kind. PowerPoint presentation experts tell us our Block PowerPoint templates and PPT Slides are Excellent. Break out of the confines with our Flow Connecting Puzzles Forming Arrow 6 Stages Juice Bar Business Plan PowerPoint Slides. They give you access to an eclectic atmosphere.
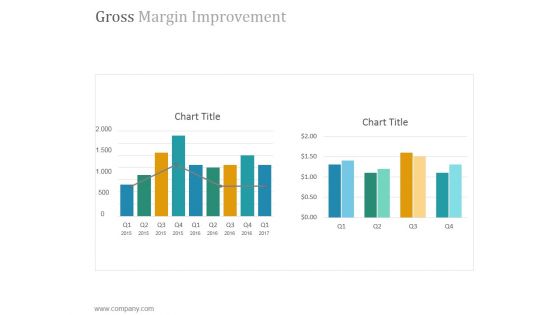
Gross Margin Improvement Ppt PowerPoint Presentation Layout
This is a gross margin improvement ppt powerpoint presentation layout. This is a two stage process. The stages in this process are chart, bar graph, success, growth, marketing.
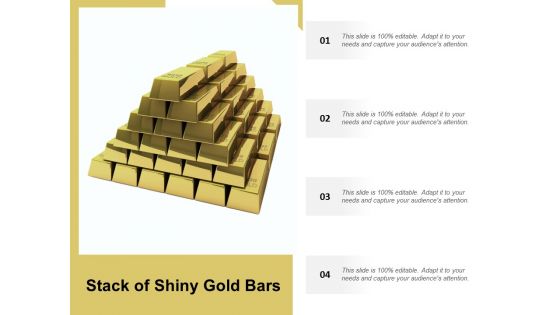
Stack Of Shiny Gold Bars Ppt Powerpoint Presentation Gallery Show
This is a stack of shiny gold bars ppt powerpoint presentation gallery show. This is a four stage process. The stages in this process are stacked bar, pile bar, heap bar.
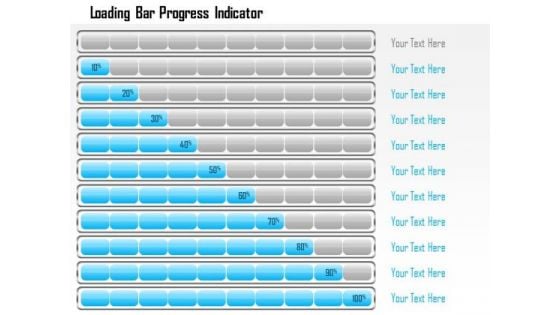
Business Framework Loading Bar Progress Indicator PowerPoint Presentation
This business diagram displays bar progress indicators. This business slide contains the concept of business growth shown in multiple levels. Use this diagram to present and compare data in an impressive manner.
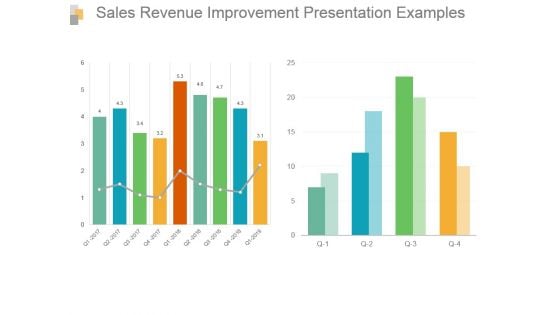
Sales Revenue Improvement Presentation Examples
This is a sales revenue improvement presentation examples. This is a two stage process. The stages in this process are bar graph, growth, sales, data, analysis.
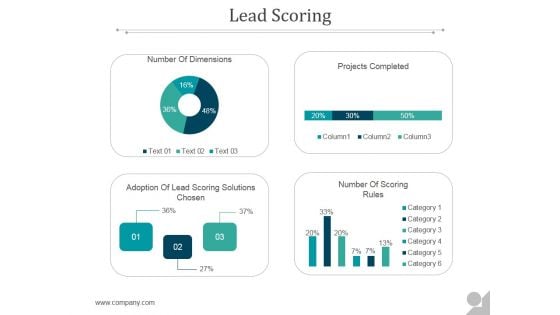
Lead Scoring Ppt PowerPoint Presentation Layouts
This is a lead scoring ppt powerpoint presentation layouts. This is a four stage process. The stages in this process are lead, business, bar graph, marketing, management.
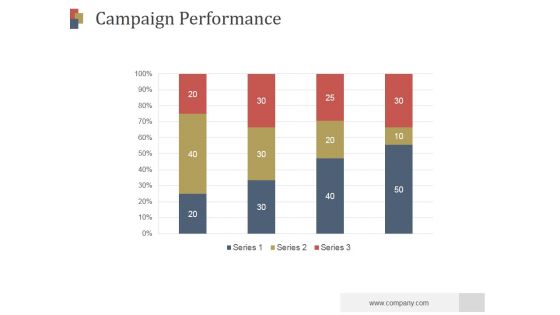
Campaign Performance Ppt PowerPoint Presentation Deck
This is a campaign performance ppt powerpoint presentation deck. This is a four stage process. The stages in this process are business, bar graph, strategy, growth, success.
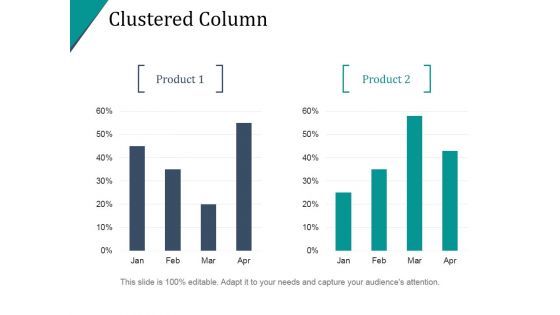
Clustered Column Ppt PowerPoint Presentation Infographic Template
This is a clustered column ppt powerpoint presentation infographic template. This is a two stage process. The stages in this process are finance, percentage, bar graph, business, marketing.
Stacked Column Ppt PowerPoint Presentation Icon Samples
This is a stacked column ppt powerpoint presentation icon samples. This is a nine stage process. The stages in this process are bar graph, business, marketing, success, growth.
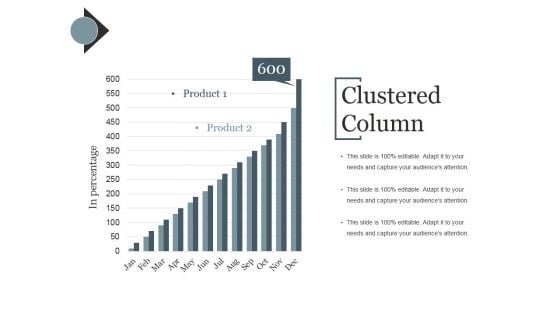
Clustered Column Template Ppt PowerPoint Presentation Portfolio Deck
This is a clustered column template ppt powerpoint presentation portfolio deck. This is a two stage process. The stages in this process are business, graph, bar, finance, analysis.
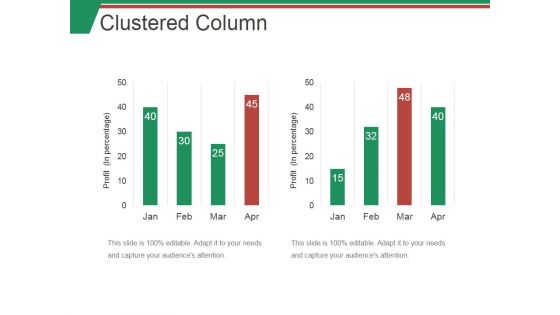
Clustered Column Ppt PowerPoint Presentation Summary Topics
This is a clustered column ppt powerpoint presentation summary topics. This is a two stage process. The stages in this process are bar, graph, finance, marketing, strategy.
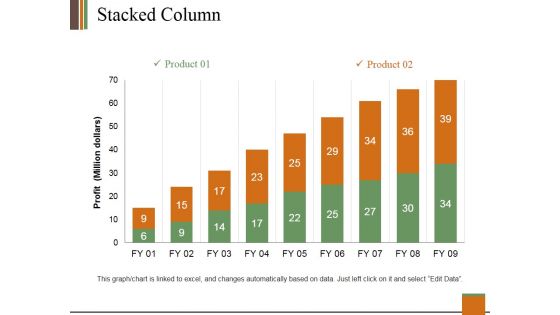
Stacked Column Ppt PowerPoint Presentation Outline Information
This is a stacked column ppt powerpoint presentation outline information. This is a two stage process. The stages in this process are profit, product, bar graph, growth, success.
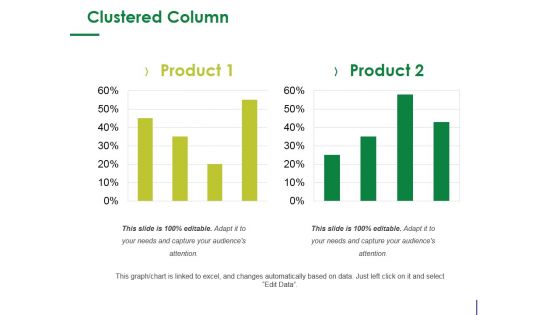
Clustered Column Ppt PowerPoint Presentation Ideas Show
This is a clustered column ppt powerpoint presentation ideas show. This is a two stage process. The stages in this process are product, percentage, finance, business, bar graph.
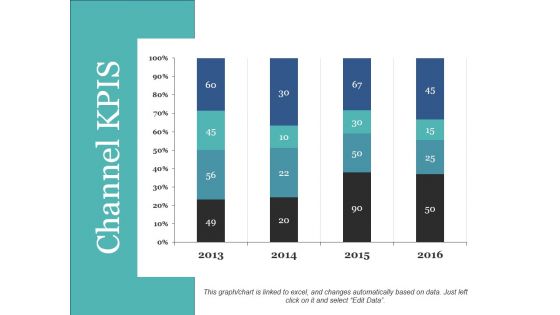
Channel Kpis Ppt PowerPoint Presentation Professional Inspiration
This is a channel kpis ppt powerpoint presentation professional inspiration. This is a four stage process. The stages in this process are bar graph, marketing, finance, strategy, planning.
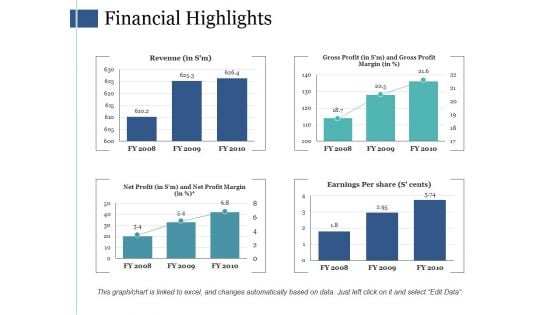
Financial Highlights Ppt PowerPoint Presentation Gallery Deck
This is a financial highlights ppt powerpoint presentation gallery deck. This is a four stage process. The stages in this process are bar graph, marketing, finance, strategy, planning.
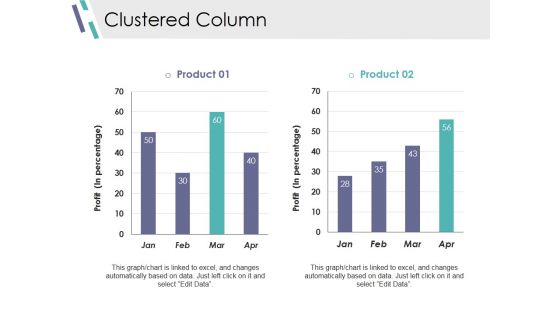
Clustered Column Ppt PowerPoint Presentation Slides Visuals
This is a clustered column ppt powerpoint presentation slides visuals. This is a two stage process. The stages in this process are bar graph, marketing, strategy, finance, planning.
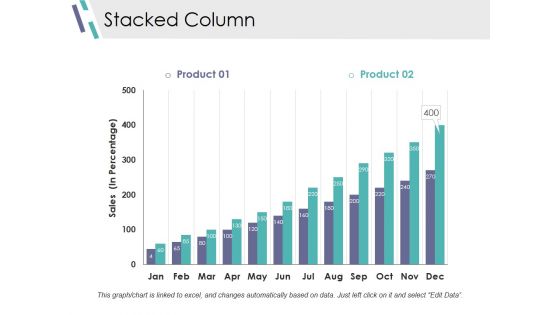
Stacked Column Ppt PowerPoint Presentation Professional Display
This is a stacked column ppt powerpoint presentation professional display. This is a two stage process. The stages in this process are bar graph, marketing, strategy, finance, planning.
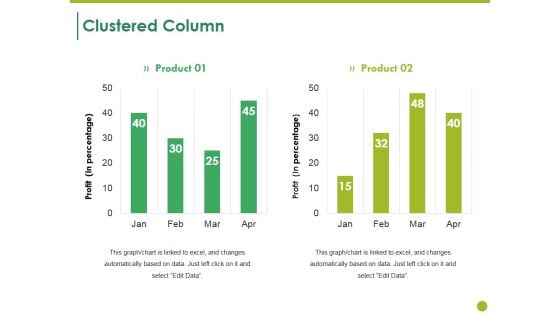
Clustered Column Ppt PowerPoint Presentation Layouts Ideas
This is a clustered column ppt powerpoint presentation layouts ideas. This is a two stage process. The stages in this process are product, profit, bar graph, growth, finance.
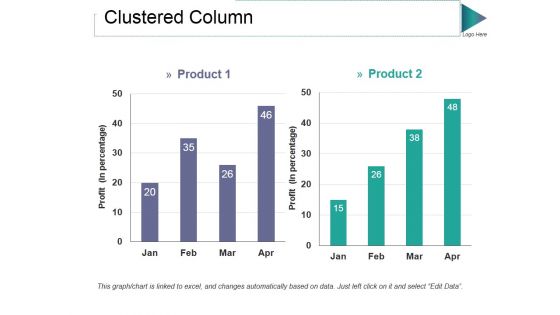
Clustered Column Ppt PowerPoint Presentation Professional Styles
This is a clustered column ppt powerpoint presentation professional styles. This is a two stage process. The stages in this process are product, profit, bar graph, growth, success.
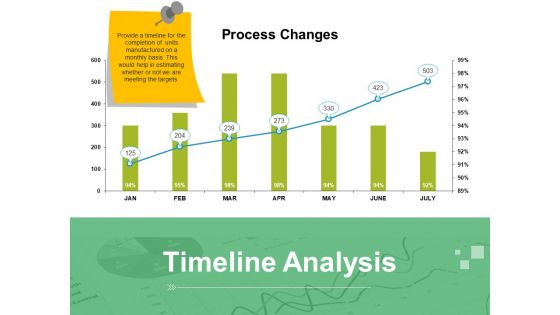
Timeline Analysis Ppt PowerPoint Presentation Professional Ideas
This is a timeline analysis ppt powerpoint presentation professional ideas. This is a seven stage process. The stages in this process are process changes, timeline analysis, bar graph.
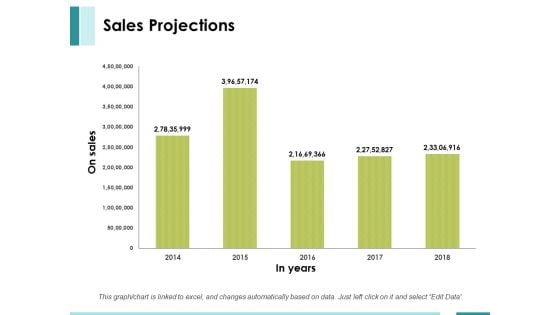
Sales Projections Ppt PowerPoint Presentation Model Examples
This is a sales projections ppt powerpoint presentation model examples. This is a five stage process. The stages in this process are on sales, in years, bar graph.
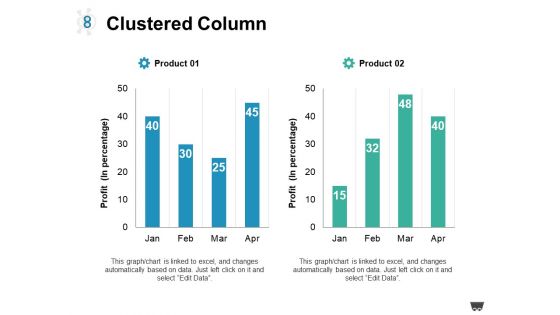
Clustered Column Ppt PowerPoint Presentation Show Introduction
This is a clustered column ppt powerpoint presentation show introduction. This is a two stage process. The stages in this process are product, profit, bar graph.
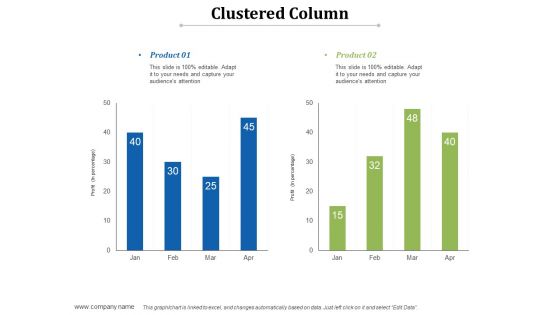
Clustered Column Ppt PowerPoint Presentation Styles Templates
This is a clustered column ppt powerpoint presentation styles templates. This is a two stage process. The stages in this process are product, profit, bar graph.


 Continue with Email

 Home
Home


