Linear Programming
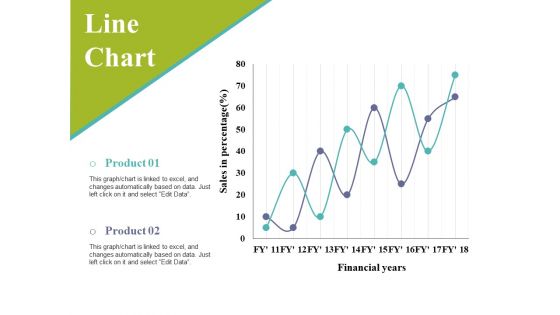
Line Chart Ppt PowerPoint Presentation Infographic Template Slides
This is a line chart ppt powerpoint presentation infographic template slides. This is a two stage process. The stages in this process are sales in percentage, financial years, business, marketing, graph.
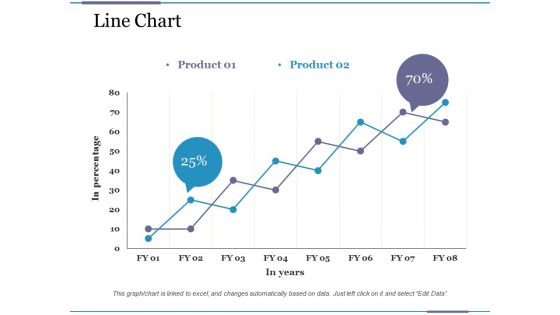
Line Chart Ppt PowerPoint Presentation Pictures File Formats
This is a line chart ppt powerpoint presentation pictures file formats. This is a two stage process. The stages in this process are business, financial, in percentage, in years, graph.
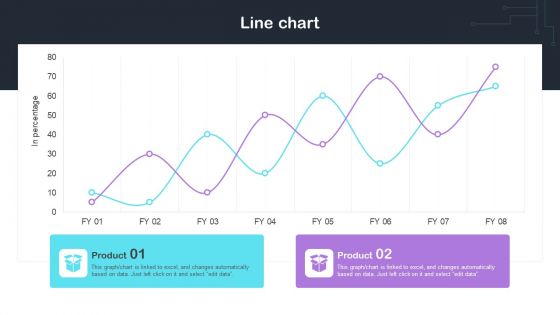
Cyber Risks And Incident Response Playbook Line Chart Professional PDF
The Cyber Risks And Incident Response Playbook Line Chart Professional PDF is a compilation of the most recent design trends as a series of slides. It is suitable for any subject or industry presentation, containing attractive visuals and photo spots for businesses to clearly express their messages. This template contains a variety of slides for the user to input data, such as structures to contrast two elements, bullet points, and slides for written information. Slidegeeks is prepared to create an impression.
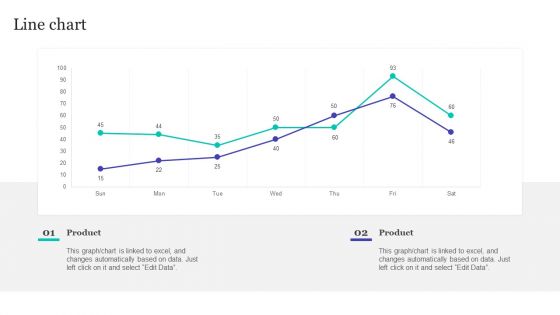
Strategic Brand Refreshing Actions Line Chart Information PDF
This Strategic Brand Refreshing Actions Line Chart Information PDF from Slidegeeks makes it easy to present information on your topic with precision. It provides customization options, so you can make changes to the colors, design, graphics, or any other component to create a unique layout. It is also available for immediate download, so you can begin using it right away. Slidegeeks has done good research to ensure that you have everything you need to make your presentation stand out. Make a name out there for a brilliant performance.
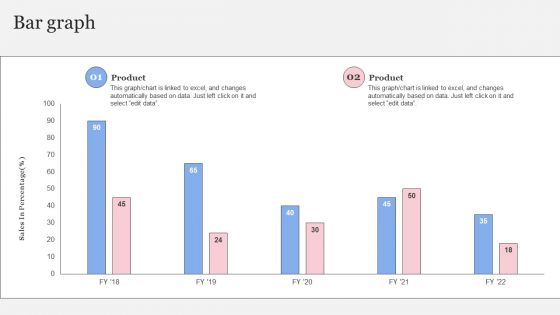
Complete Brand Promotion Playbook Bar Graph Structure PDF
Deliver an awe inspiring pitch with this creative Complete Brand Promotion Playbook Bar Graph Structure PDF bundle. Topics like Product, Automatically, Excel Changes can be discussed with this completely editable template. It is available for immediate download depending on the needs and requirements of the user.
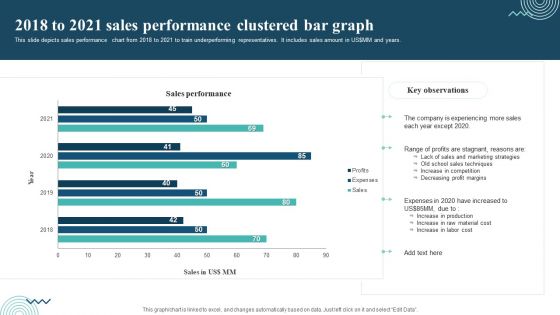
2018 To 2021 Sales Performance Clustered Bar Graph Graphics PDF
Showcasing this set of slides titled 2018 To 2021 Sales Performance Clustered Bar Graph Graphics PDF. The topics addressed in these templates are Range Of Profits, Increase In Production, Profits Are Stagnant. All the content presented in this PPT design is completely editable. Download it and make adjustments in color, background, font etc. as per your unique business setting.
Profits And Discounts On Products Clustered Bar Graph Icons PDF
Showcasing this set of slides titled Profits And Discounts On Products Clustered Bar Graph Icons PDF. The topics addressed in these templates are Profits And Discounts, Less Discounts, Market Penetration. All the content presented in this PPT design is completely editable. Download it and make adjustments in color, background, font etc. as per your unique business setting.
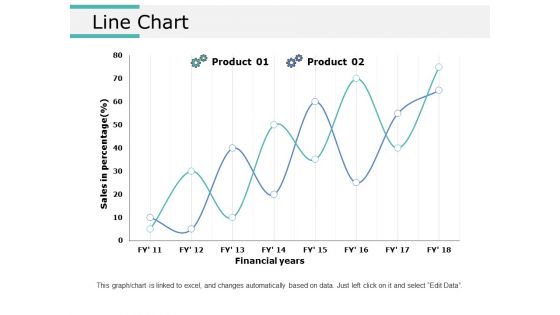
Line Chart Ppt PowerPoint Presentation Ideas Graphics Tutorials
This is a line chart ppt powerpoint presentation ideas graphics tutorials. This is a two stage process. The stages in this process are line chart, marketing, strategy, planning, finance.
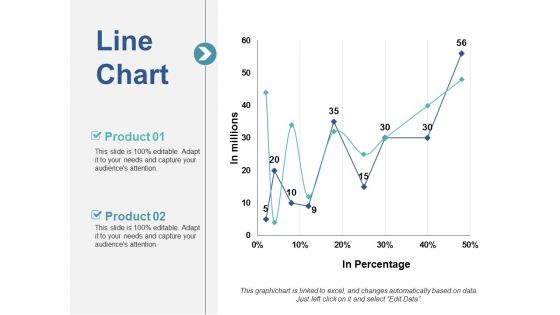
Line Chart Ppt PowerPoint Presentation Slides Clipart Images
This is a line chart ppt powerpoint presentation slides clipart images. This is a two stage process. The stages in this process are line chart, marketing, strategy, planning, finance.
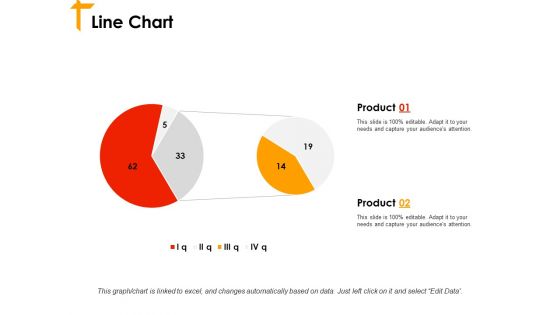
Line Chart Ppt PowerPoint Presentation Styles Format Ideas
This is a line chart ppt powerpoint presentation styles format ideas. This is a two stage process. The stages in this process are line chart, financial, business, planning, marketing, management.
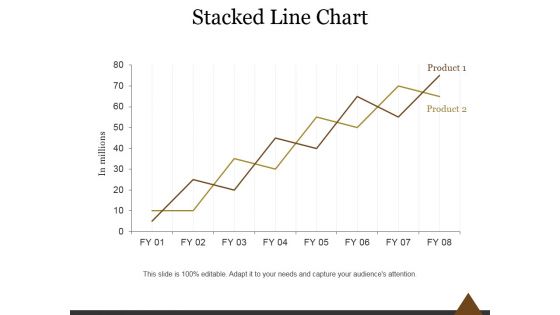
Stacked Line Chart Ppt PowerPoint Presentation Example 2015
This is a stacked line chart ppt powerpoint presentation example 2015. This is a two stage process. The stages in this process are business, marketing, stacked, line, chart.
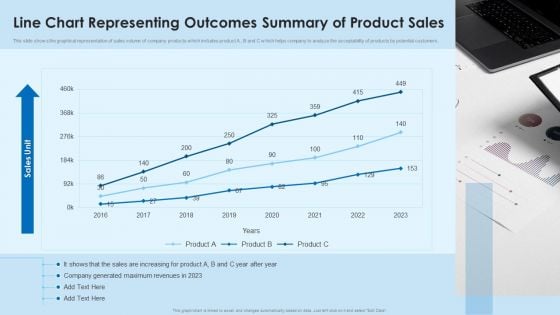
Line Chart Representing Outcomes Summary Of Product Sales Mockup PDF
This slide shows the graphical representation of sales volume of company products which includes product A , B and C which helps company to analyze the acceptability of products by potential customers.Pitch your topic with ease and precision using this Line Chart Representing Outcomes Summary Of Product Sales Mockup PDF This layout presents information on Company Generated, Maximum Revenues, Increasing For Product It is also available for immediate download and adjustment. So, changes can be made in the color, design, graphics or any other component to create a unique layout.
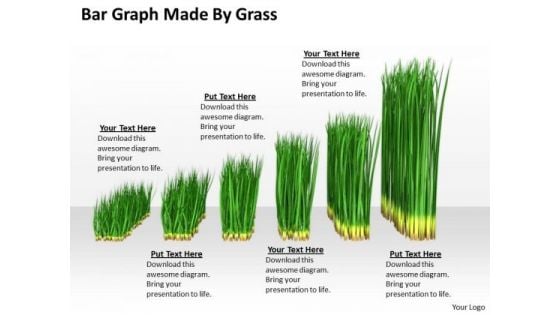
Business Strategy Plan Bar Graph Made By Grass Clipart
Brace Yourself, Arm Your Thoughts. Prepare For The Hustle With Our Business Strategy Plan Bar Graph Made By Grass Clipart Powerpoint Templates.
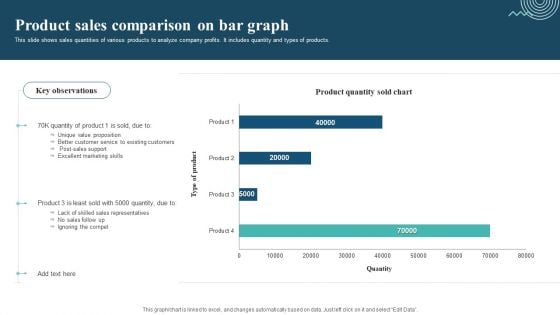
Product Sales Comparison On Bar Graph Sample PDF
This slide shows sales quantities of various products to analyze company profits. It includes quantity and types of products. Pitch your topic with ease and precision using this Product Sales Comparison On Bar Graph Sample PDF. This layout presents information on Unique Value Proposition, Excellent Marketing Skills, Ignoring The Compet. It is also available for immediate download and adjustment. So, changes can be made in the color, design, graphics or any other component to create a unique layout.
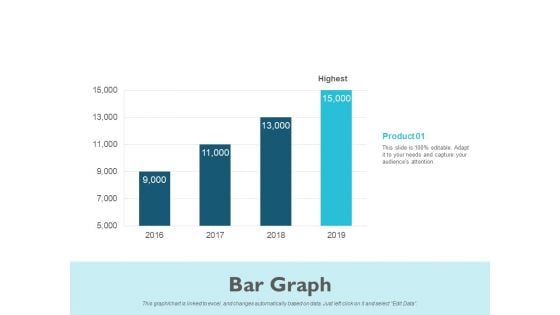
Bar Graph Process Ppt PowerPoint Presentation Portfolio Designs Download
Presenting this set of slides with name bar graph process ppt powerpoint presentation portfolio designs download. The topics discussed in these slides are finance, marketing, management, investment, analysis. This is a completely editable PowerPoint presentation and is available for immediate download. Download now and impress your audience.
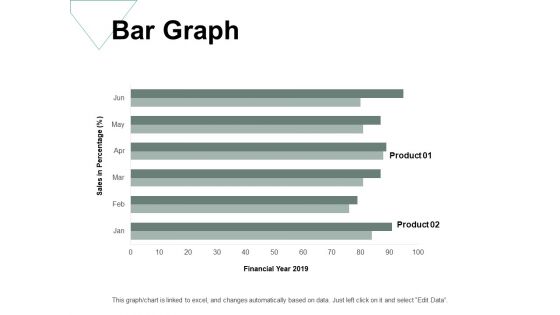
Bar Graph Investment Ppt PowerPoint Presentation Infographics Graphics Template
Presenting this set of slides with name bar graph investment ppt powerpoint presentation infographics graphics template. The topics discussed in these slides are finance, marketing, management, investment, analysis. This is a completely editable PowerPoint presentation and is available for immediate download. Download now and impress your audience.
Bar Graph Product Ppt PowerPoint Presentation Icon Layout
Presenting this set of slides with name bar graph product ppt powerpoint presentation icon layout. The topics discussed in these slides are finance, marketing, management, investment, analysis. This is a completely editable PowerPoint presentation and is available for immediate download. Download now and impress your audience.
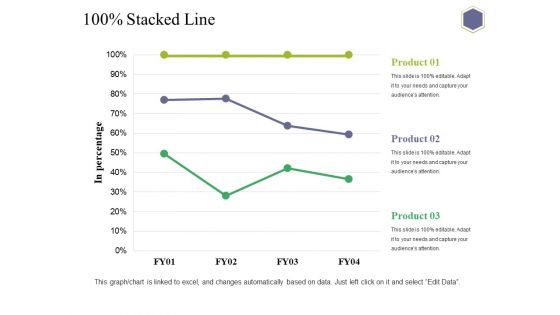
Stacked Line Ppt PowerPoint Presentation Professional Introduction
This is a stacked line ppt powerpoint presentation professional introduction. This is a three stage process. The stages in this process are in percentage, business, marketing, strategy, graph.
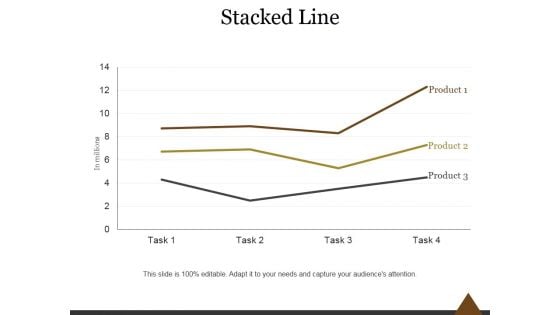
Stacked Line Ppt PowerPoint Presentation Graphics
This is a stacked line ppt powerpoint presentation graphics. This is a three stage process. The stages in this process are business, marketing, stacked, line, success.

Line Chart Ppt PowerPoint Presentation Gallery Example Introduction
This is a line chart ppt powerpoint presentation portfolio shapes. This is a two stage process. The stages in this process are product, financial years, line chart.

Line Chart Ppt PowerPoint Presentation Portfolio File Formats
This is a line chart ppt powerpoint presentation portfolio file formats. This is a two stage process. The stages in this process are product, profit, line chart.
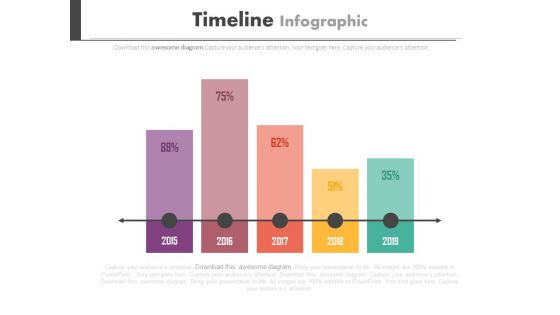
Timeline Bar Graph For Yearly Planning Powerpoint Slides
This PowerPoint template has been designed with timeline bar graph. You may download this timeline diagram slide to display long term planning for business. Chart the course you intend to take with this slide.
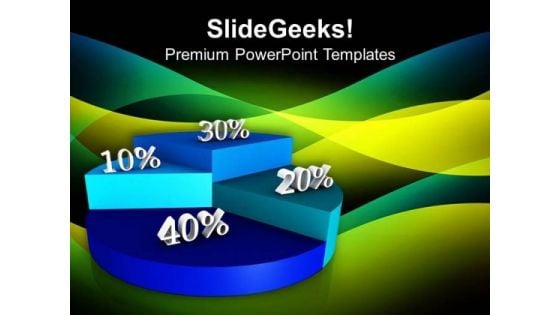
Blue Pie Chart Percentage Growth Future PowerPoint Templates Ppt Backgrounds For Slides 0313
We present our Blue Pie Chart Percentage Growth Future PowerPoint Templates PPT Backgrounds For Slides 0313.Download our Pie Charts PowerPoint Templates because Our PowerPoint Templates and Slides will let Your superior ideas hit the target always and everytime. Use our Circle Charts PowerPoint Templates because You have belief amd faith in your futuristic plans. Chalk them out for your team with our PowerPoint Templates and Slides. Download and present our Business PowerPoint Templates because You can Hit a home run with our PowerPoint Templates and Slides. See your ideas sail into the minds of your audience. Present our Marketing PowerPoint Templates because You should Kick up a storm with our PowerPoint Templates and Slides. The heads of your listeners will swirl with your ideas. Download our Curves and Lines PowerPoint Templates because Our PowerPoint Templates and Slides are a sure bet. Gauranteed to win against all odds. Use these PowerPoint slides for presentations relating to Blue pie chart with percents written on it, pie charts, circle charts, business, marketing, curves and lines. The prominent colors used in the PowerPoint template are Blue light, Blue, White. Lick the cream with our Blue Pie Chart Percentage Growth Future PowerPoint Templates Ppt Backgrounds For Slides 0313.They will be the icing on the cake.
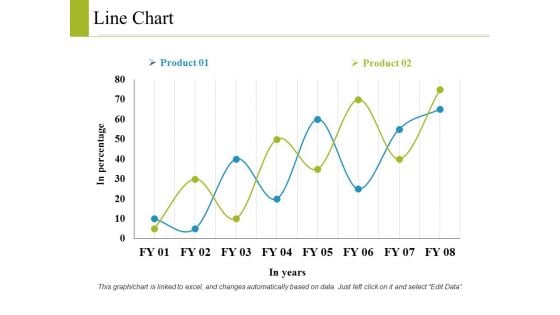
Line Chart Ppt PowerPoint Presentation Layouts Graphics Design
This is a line chart ppt powerpoint presentation layouts graphics design. This is a two stage process. The stages in this process are business, marketing, strategy, planning, finance.
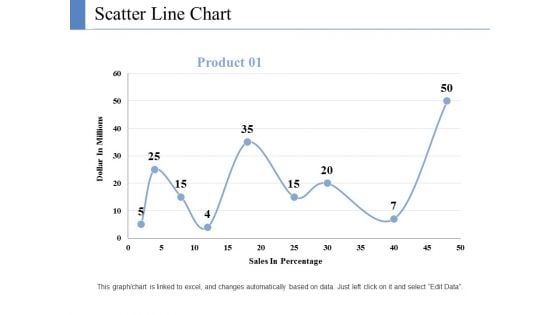
Scatter Line Chart Ppt PowerPoint Presentation Gallery Topics
This is a scatter line chart ppt powerpoint presentation gallery topics. This is a nine stage process. The stages in this process are business, marketing, strategy, planning, finance.
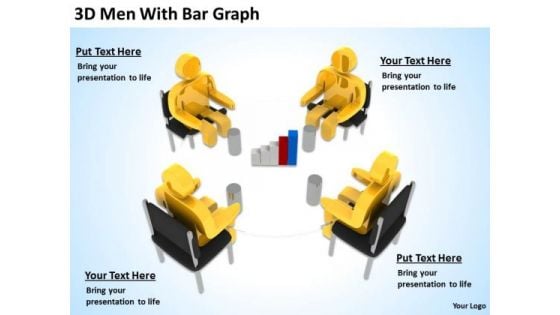
Business People Vector 3d Men With Bar Graph PowerPoint Slides
We present our business people vector 3d men with bar graph PowerPoint Slides.Use our People PowerPoint Templates because Our PowerPoint Templates and Slides are a sure bet. Gauranteed to win against all odds. Download and present our Business PowerPoint Templates because Our PowerPoint Templates and Slides will bullet point your ideas. See them fall into place one by one. Download and present our Flow Charts PowerPoint Templates because Our PowerPoint Templates and Slides are created by a hardworking bunch of busybees. Always flitting around with solutions gauranteed to please. Download our Marketing PowerPoint Templates because It can Bubble and burst with your ideas. Use our Shapes PowerPoint Templates because Our PowerPoint Templates and Slides will let you Leave a lasting impression to your audiences. They possess an inherent longstanding recall factor.Use these PowerPoint slides for presentations relating to 3d, accounting, analysis, bar, business, cartoon,cash, character, chart, clipart, committee, company, concept, corporate,council, directors, display, document, economics, executive, figure, finance,financial, goal, graph, group, growth, guy, human, humanoid, man, management,market, meeting, money, office, percentage, performance, pie, presentation, report,room, statistics, table, team. The prominent colors used in the PowerPoint template are Yellow, Black, Gray. Professionals tell us our business people vector 3d men with bar graph PowerPoint Slides have awesome images to get your point across. Professionals tell us our analysis PowerPoint templates and PPT Slides will help you be quick off the draw. Just enter your specific text and see your points hit home. People tell us our business people vector 3d men with bar graph PowerPoint Slides effectively help you save your valuable time. Customers tell us our bar PowerPoint templates and PPT Slides are effectively colour coded to prioritise your plans They automatically highlight the sequence of events you desire. The feedback we get is that our business people vector 3d men with bar graph PowerPoint Slides will generate and maintain the level of interest you desire. They will create the impression you want to imprint on your audience. Use our business PowerPoint templates and PPT Slides have awesome images to get your point across. Upgrade your presentation with our Business People Vector 3d Men With Bar Graph PowerPoint Slides. Download without worries with our money back guaranteee.
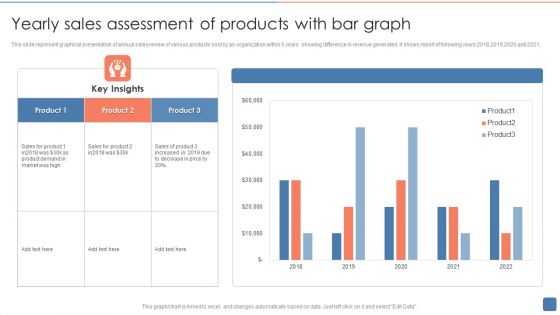
Yearly Sales Assessment Of Products With Bar Graph Structure PDF
This slide represent graphical presentation of annual sales review of various products sold by an organization within 5 years showing difference in revenue generated .It shows report of following years 2018,2019,2020,and 2021. Showcasing this set of slides titled Yearly Sales Assessment Of Products With Bar Graph Structure PDF. The topics addressed in these templates are Product, Sales Of Product, Product Demand. All the content presented in this PPT design is completely editable. Download it and make adjustments in color, background, font etc. as per your unique business setting.
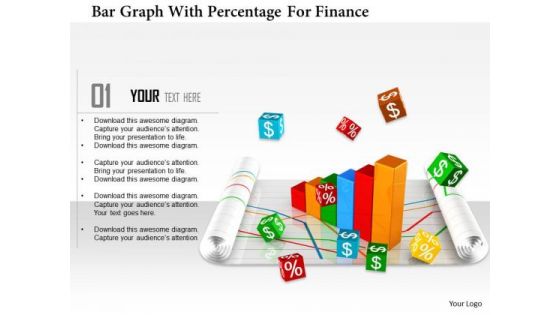
Stock Photo Bar Graph With Percentage For Finance PowerPoint Slide
This Power Point template has been designed with graphic of bar graph and percentage value. This image slide contains the concept of finance and accounting. Use this editable diagram for your business and finance related presentations.
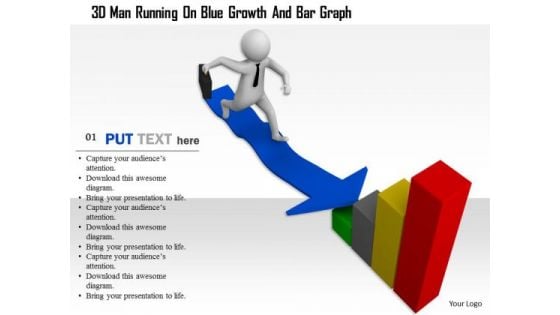
3d Man Running On Blue Growth And Bar Graph
This image slide has been designed with graphic of 3d man on blue arrow moving towards bar graph. This professional slide contains the concept of growth and success. Use this editable slide to depict business growth.
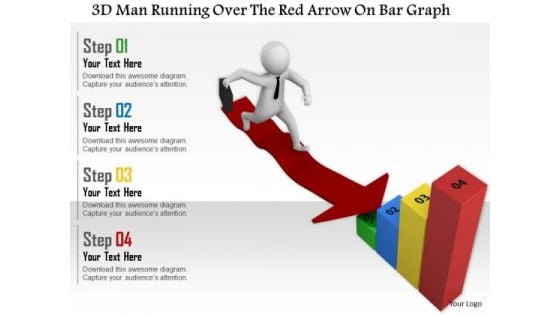
3d Man Running Over The Red Arrow On Bar Graph
This image slide has been designed with graphic of 3d man on red arrow moving towards bar graph. This professional slide contains the concept of growth and success. Use this editable slide to depict business growth.
Business Diagram Human Icon Bar Graph For Business Presentation Template
Graphic of human icons and bar graph has been used to decorate this power point template. This PPT contains the concept of business communication and result analysis. Use this PPT for business and marketing related presentations.
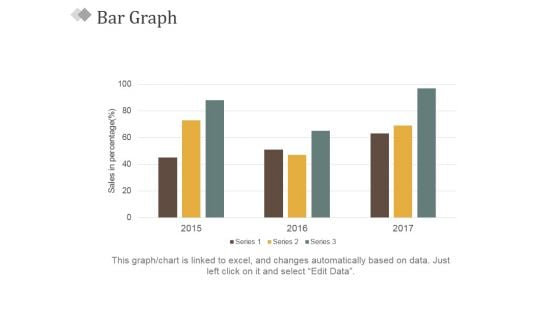
Bar Graph Ppt PowerPoint Presentation Slides Visual Aids
This is a bar graph ppt powerpoint presentation slides visual aids. This is a three stage process. The stages in this process are sales in percentage, bar graph, business, marketing, success.
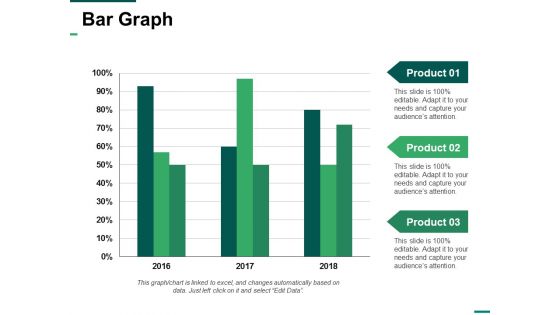
Bar Graph Ppt PowerPoint Presentation Styles Visual Aids
This is a bar graph ppt powerpoint presentation styles visual aids. This is a three stage process. The stages in this process are bar, marketing, strategy, finance, planning.
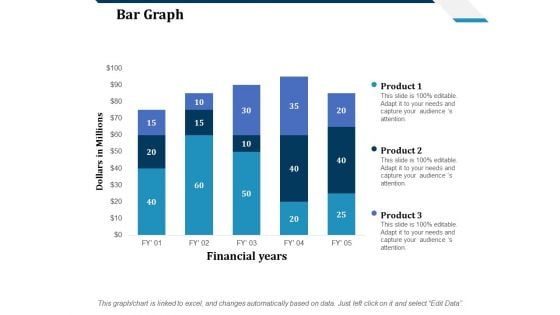
Bar Graph Ppt PowerPoint Presentation Ideas Design Inspiration
This is a bar graph ppt powerpoint presentation ideas design inspiration. This is a five stage process. The stages in this process are bar, marketing, strategy, planning, finance.
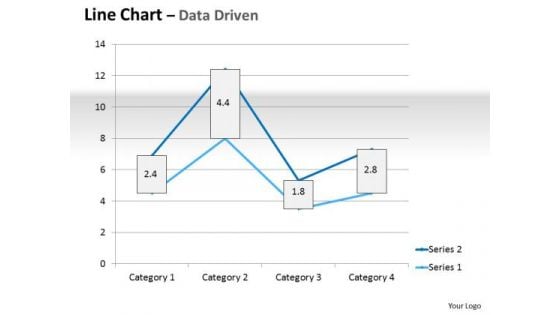
Multivariate Data Analysis Driven Line Chart Market Graph PowerPoint Slides Templates
Plan For All Contingencies With Our multivariate data analysis driven line chart market graph powerpoint slides Templates . Douse The Fire Before It Catches.
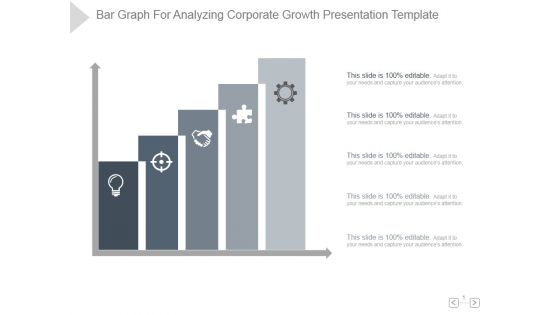
Bar Graph For Analyzing Corporate Growth Ppt PowerPoint Presentation Ideas
This is a bar graph for analyzing corporate growth ppt powerpoint presentation ideas. This is a five stage process. The stages in this process are bar graph, analyzing, corporate, growth, presentation, strategy.
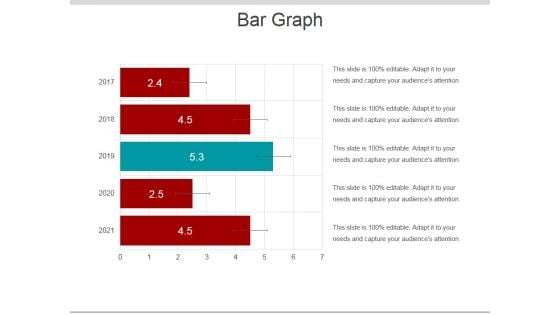
Bar Graph Ppt PowerPoint Presentation Infographic Template Deck
This is a bar graph ppt powerpoint presentation infographic template deck. This is a five stage process. The stages in this process are bar chart, business, marketing, strategy, planning.
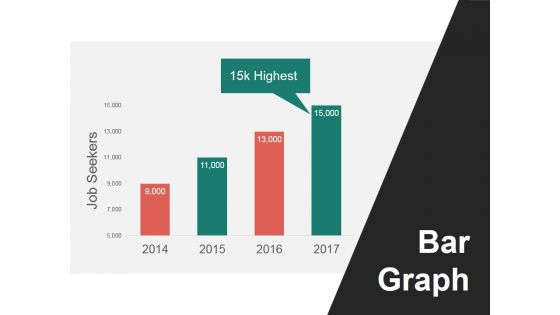
Bar Graph Ppt PowerPoint Presentation Model Slide Download
This is a bar graph ppt powerpoint presentation model slide download. This is a four stage process. The stages in this process are job seekers, bar graph, highest.
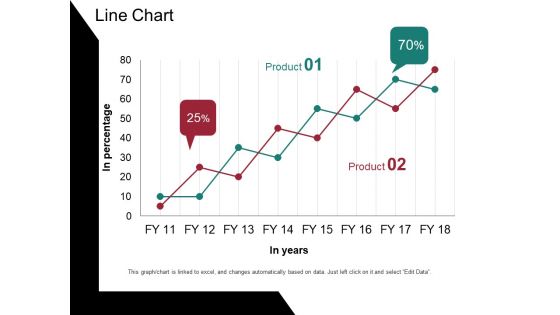
Line Chart Ppt PowerPoint Presentation Portfolio Design Templates
This is a line chart ppt powerpoint presentation portfolio design templates. This is a two stage process. The stages in this process are in percentage, in years, percentage, business, graph.
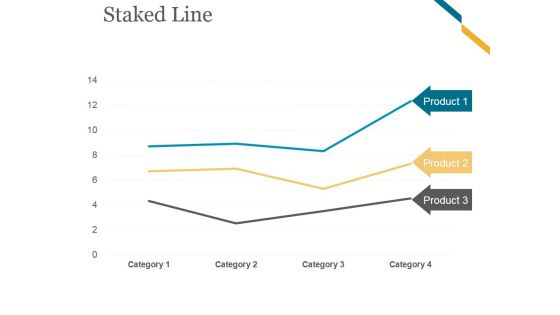
Staked Line Ppt PowerPoint Presentation Designs Download
This is a staked line ppt powerpoint presentation designs download. This is a three stage process. The stages in this process are business, marketing, line chart, analysis, product.
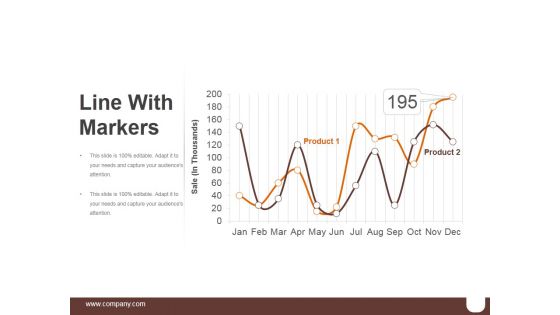
Line With Markers Ppt PowerPoint Presentation Microsoft
This is a line with markers ppt powerpoint presentation microsoft. This is a two stage process. The stages in this process are business, marketing, line chart, finance, management.
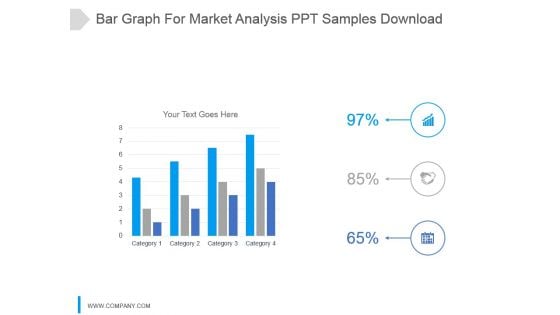
Bar Graph For Market Analysis Ppt Samples Download
This is a bar graph for market analysis ppt samples download. This is a four stage process. The stages in this process are category.
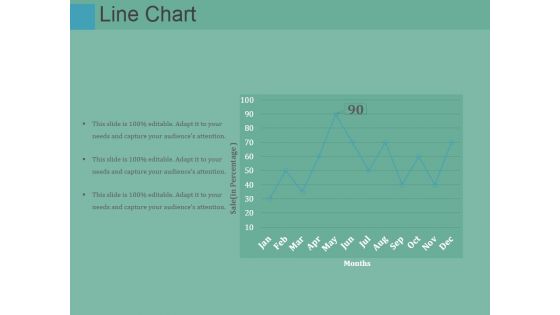
Line Chart Ppt PowerPoint Presentation Outline Design Inspiration
This is a line chart ppt powerpoint presentation outline design inspiration. This is a five stage process. The stages in this process are line chart, management, business, strategy, marketing.
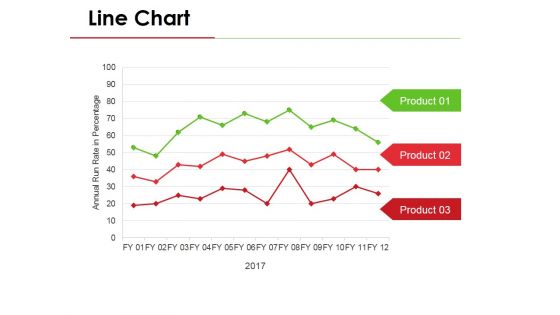
Line Chart Ppt PowerPoint Presentation Visual Aids Pictures
This is a line chart ppt powerpoint presentation visual aids pictures. This is a three stage process. The stages in this process are business, marketing, line chart, analysis, growth.
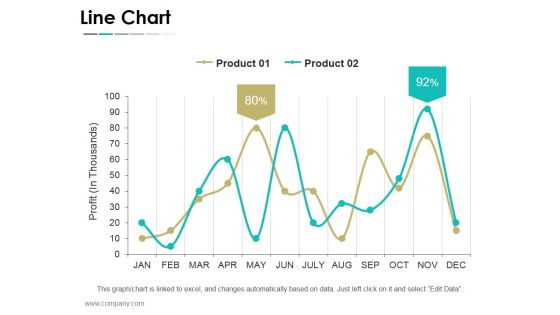
Line Chart Ppt PowerPoint Presentation File Graphics Template
This is a line chart ppt powerpoint presentation file graphics template. This is a twelve stage process. The stages in this process are business, strategy, marketing, success, line chart.
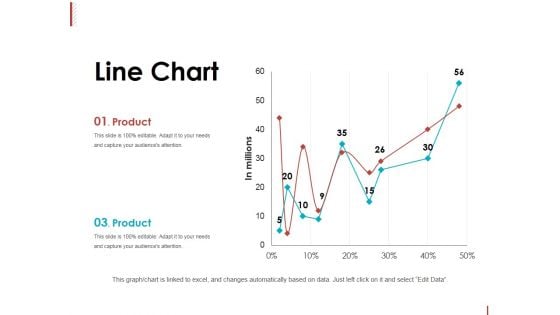
Line Chart Ppt PowerPoint Presentation Slides Graphics Tutorials
This is a line chart ppt powerpoint presentation slides graphics tutorials. This is a two stage process. The stages in this process are product, in millions, line chart, percentage, finance.
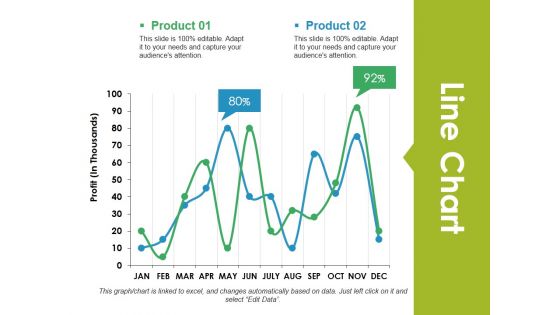
Line Chart Ppt PowerPoint Presentation Ideas Background Designs
This is a line chart ppt powerpoint presentation ideas background designs. This is a two stage process. The stages in this process are line chart, growth, business, marketing, strategy.
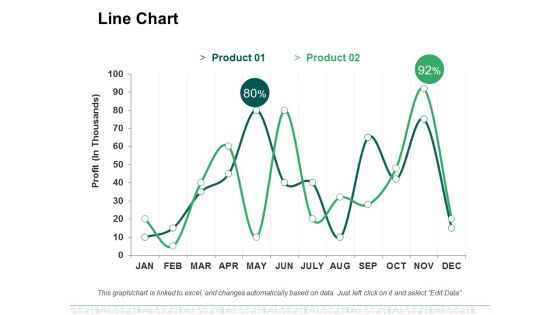
Line Chart Ppt PowerPoint Presentation File Designs Download
This is a line chart ppt powerpoint presentation file designs download. This is a two stage process. The stages in this process are business, marketing, profit, line chart, percentage.
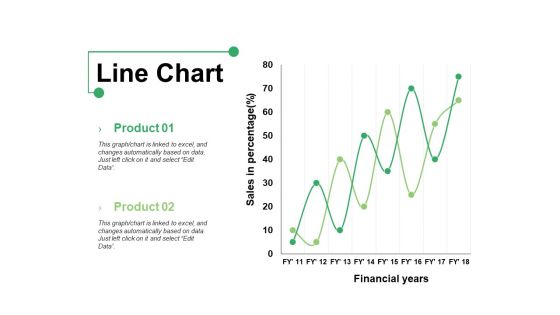
Line Chart Ppt PowerPoint Presentation Show Graphics Example
This is a line chart ppt powerpoint presentation show graphics example. This is a two stage process. The stages in this process are product, line chart, financial years, sales in percentage.
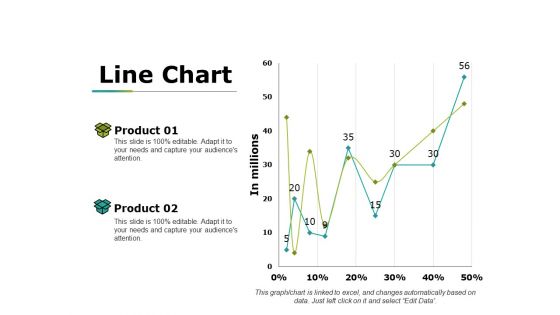
Line Chart Ppt PowerPoint Presentation Infographic Template Design Ideas
This is a line chart ppt powerpoint presentation infographic template design ideas. This is a two stage process. The stages in this process are product, in millions, percentage, line chart, success.
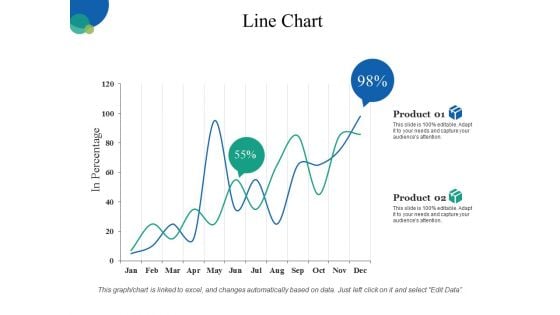
Line Chart Ppt PowerPoint Presentation Gallery Clipart Images
This is a line chart ppt powerpoint presentation gallery clipart images. This is a two stage process. The stages in this process are business, line chart, finance, marketing, strategy.
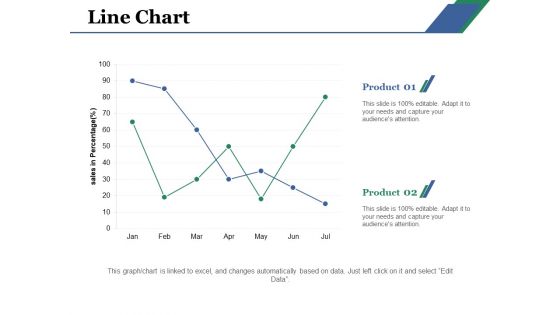
Line Chart Ppt PowerPoint Presentation Layouts Example File
This is a line chart ppt powerpoint presentation layouts example file. This is a two stage process. The stages in this process are line chart, product, business, sales, analysis.
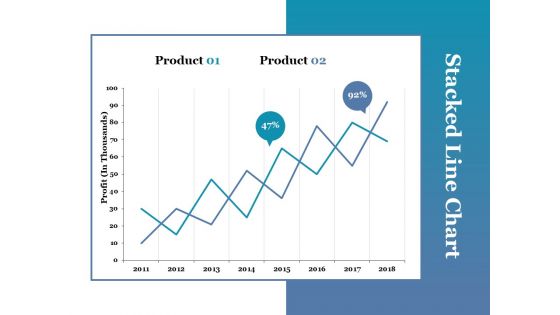
Stacked Line Chart Ppt PowerPoint Presentation Portfolio Picture
This is a stacked line chart ppt powerpoint presentation portfolio picture. This is a two stage process. The stages in this process are stacked line chart, product, profit, growth.
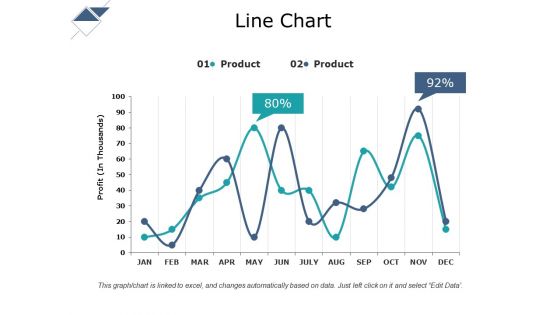
Line Chart Ppt PowerPoint Presentation Gallery Format Ideas
This is a line chart ppt powerpoint presentation gallery format ideas. This is a two stage process. The stages in this process are line chart, product, in year, profit.
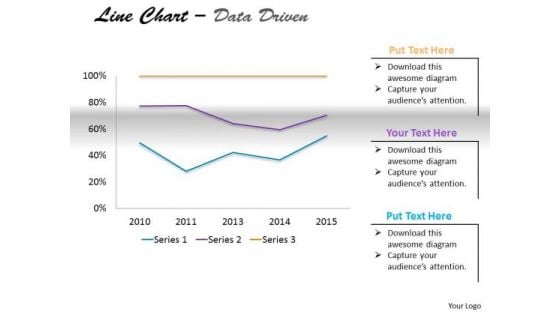
Multivariate Data Analysis Driven Market Line Chart PowerPoint Slides Templates
Delight Them With Our multivariate data analysis driven market line chart powerpoint slides Templates .
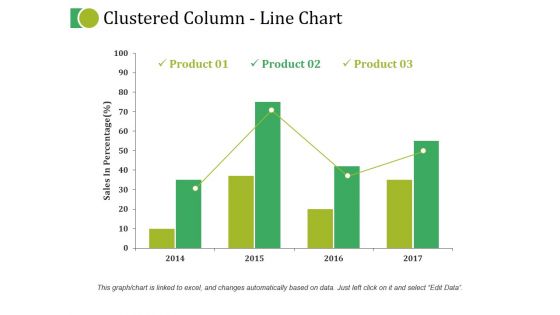
Clustered Column Line Chart Ppt PowerPoint Presentation Inspiration Graphics Pictures
This is a clustered column line chart ppt powerpoint presentation inspiration graphics pictures. This is a four stage process. The stages in this process are business, marketing, strategy, planning, finance.
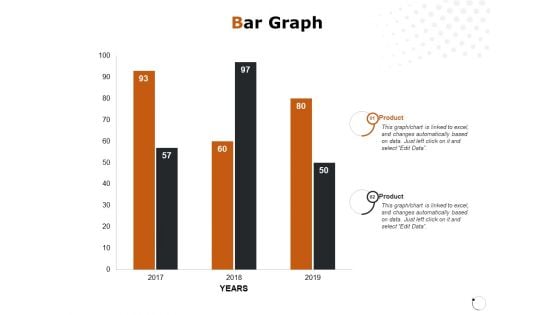
Bar Graph Financial Ppt PowerPoint Presentation Professional Master Slide
Presenting this set of slides with name bar graph financial ppt powerpoint presentation professional master slide. The topics discussed in these slides are bar graph, product, year, finance, marketing. This is a completely editable PowerPoint presentation and is available for immediate download. Download now and impress your audience.
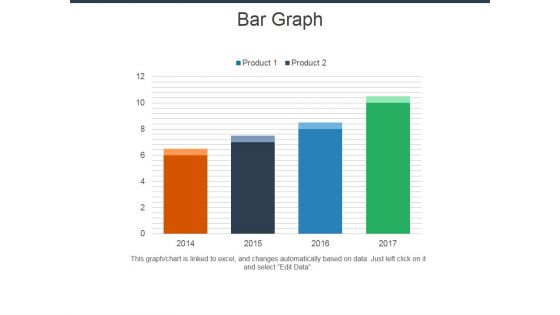
Bar Graph Ppt Powerpoint Presentation Infographic Template Smartart
This is a bar graph ppt powerpoint presentation infographic template smartart. This is a four stage process. The stages in this process are bar graph, business, management, strategy, planning.
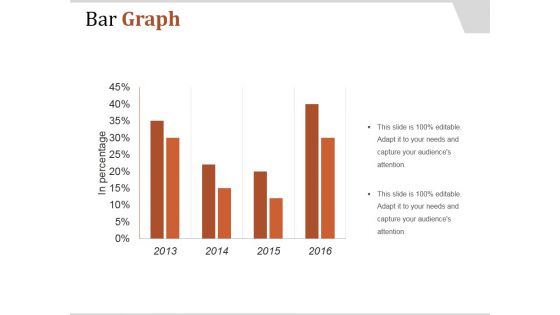
Bar Graph Ppt PowerPoint Presentation Layouts Design Templates
This is a bar graph ppt powerpoint presentation layouts design templates. This is a four stage process. The stages in this process are bar graph, planning, business, management, strategy.
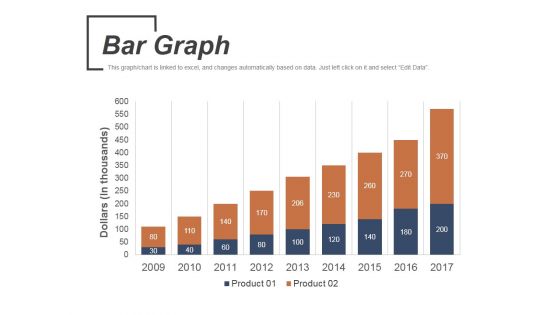
Bar Graph Ppt PowerPoint Presentation Outline Design Templates
This is a bar graph ppt powerpoint presentation outline design templates. This is a nine stage process. The stages in this process are bar graph, management, planning, strategy, marketing.


 Continue with Email

 Home
Home


