Linear
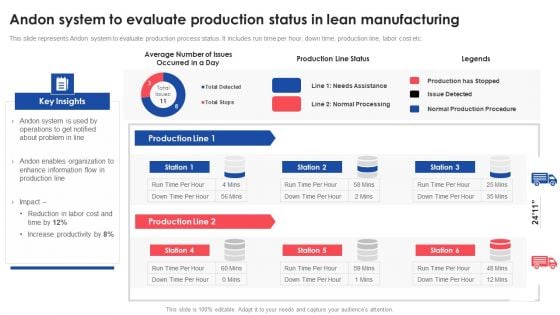
Andon System To Evaluate Production Status In Lean Manufacturing Deploying And Managing Lean Clipart PDF
This slide represents Andon system to evaluate production process status. It includes run time per hour, down time, production line, labor cost etc. Deliver an awe inspiring pitch with this creative Andon System To Evaluate Production Status In Lean Manufacturing Deploying And Managing Lean Clipart PDF bundle. Topics like Enables Organization, Enhance Information, Production Line can be discussed with this completely editable template. It is available for immediate download depending on the needs and requirements of the user.
Lego Growth Chart Business PowerPoint Templates And PowerPoint Themes 0512
Lego Growth Chart Business PowerPoint Templates And PowerPoint Themes PPT designs-Microsoft Powerpoint Templates and Background with bar graph Give your audience a feast for their eyes. Our brightly colored Lego Growth Chart Business PowerPoint Templates And PowerPoint Themes 0512 will hold their fascnation.
Business Flow Charts Examples Green Question Mark PowerPoint Templates Ppt Backgrounds For Slides
We present our business flow charts examples green question mark PowerPoint templates PPT backgrounds for slides.Download our People PowerPoint Templates because Our PowerPoint Templates and Slides will definately Enhance the stature of your presentation. Adorn the beauty of your thoughts with their colourful backgrounds. Download our Business PowerPoint Templates because Our PowerPoint Templates and Slides will steer your racing mind. Hit the right buttons and spur on your audience. Download and present our Shapes PowerPoint Templates because you should Whip up a frenzy with our PowerPoint Templates and Slides. They will fuel the excitement of your team. Download and present our Symbol PowerPoint Templates because Our PowerPoint Templates and Slides will let you meet your Deadlines. Download and present our Curves and Lines PowerPoint Templates because You should Ascend the ladder of success with ease. Our PowerPoint Templates and Slides will provide strong and sturdy steps.Use these PowerPoint slides for presentations relating to 3d, Abstract, Advice, Answer, Ask, Background, Bright, Business, Businessman, Career, Character, Choice, Choose, Concept, Confused, Confusion, Decision, Design, Doubt, Geometry, Green, Guy, Help, Human, Icon, Idea, Illustration, Information, Isolated, Man, Mark, Orange, Plastic, Problem, Puppet, Question, Question Mark, Risk, Sign, Solution, Stand, Support, Symbol, Think, Three, Wallpaper, White. The prominent colors used in the PowerPoint template are Green, Gray, White. The feedback we get is that our business flow charts examples green question mark PowerPoint templates PPT backgrounds for slides effectively help you save your valuable time. Customers tell us our Businessman PowerPoint templates and PPT Slides have awesome images to get your point across. The feedback we get is that our business flow charts examples green question mark PowerPoint templates PPT backgrounds for slides will help you be quick off the draw. Just enter your specific text and see your points hit home. Professionals tell us our Bright PowerPoint templates and PPT Slides provide great value for your money. Be assured of finding the best projection to highlight your words. Presenters tell us our business flow charts examples green question mark PowerPoint templates PPT backgrounds for slides are designed to make your presentations professional. You can be sure our Answer PowerPoint templates and PPT Slides will save the presenter time. Our Business Flow Charts Examples Green Question Mark PowerPoint Templates Ppt Backgrounds For Slides team keep their eyes open. Always digging out new designs for you.
Business Process Diagram Chart 3d Family With Sweet Home PowerPoint Slides
We present our business process diagram chart 3d family with sweet home PowerPoint Slides.Use our Family PowerPoint Templates because Our PowerPoint Templates and Slides will bullet point your ideas. See them fall into place one by one. Present our Symbol PowerPoint Templates because You canTake a leap off the starting blocks with our PowerPoint Templates and Slides. They will put you ahead of the competition in quick time. Use our Shapes PowerPoint Templates because It will Give impetus to the hopes of your colleagues. Our PowerPoint Templates and Slides will aid you in winning their trust. Download our Lifestyle PowerPoint Templates because Our PowerPoint Templates and Slides help you pinpoint your timelines. Highlight the reasons for your deadlines with their use. Use our Curves and Lines PowerPoint Templates because Our PowerPoint Templates and Slides will let you Hit the target. Go the full distance with ease and elan.Use these PowerPoint slides for presentations relating to Boy, Brother, Care, Cartoon, Character, Child, Comfort, Concept, Dad, Digital, Enjoying, Family, Father, Female, Figure, Fun, Graphic, Green, Group, Guy, Happiness, Happy, Home, House, Household, Human, Kid, Life, Lifestyle, Love, Male, Man, Mom, Mother, Mum, Parent, People, Person, Rendered, Safety, Son, Sweet, Symbol, Together, Togetherness, Union, White, Woman, Young. The prominent colors used in the PowerPoint template are Green, Gray, Red. The feedback we get is that our business process diagram chart 3d family with sweet home PowerPoint Slides look good visually. Customers tell us our Dad PowerPoint templates and PPT Slides will help you be quick off the draw. Just enter your specific text and see your points hit home. The feedback we get is that our business process diagram chart 3d family with sweet home PowerPoint Slides are designed by professionals Professionals tell us our Dad PowerPoint templates and PPT Slides are designed by professionals Presenters tell us our business process diagram chart 3d family with sweet home PowerPoint Slides are topically designed to provide an attractive backdrop to any subject. You can be sure our Character PowerPoint templates and PPT Slides will make you look like a winner. Scale mountains with our Business Process Diagram Chart 3d Family With Sweet Home PowerPoint Slides. You will come out on top.
Business Graph Global PowerPoint Templates And PowerPoint Themes 0512
Microsoft Powerpoint Templates and Background with bar graphs-These templates can be used for presentations relating to-Bar graph global, global, background, business, finance, success-Business Graph Global PowerPoint Templates And PowerPoint Themes 0512 Elevate the experience with our Business Graph Global PowerPoint Templates And PowerPoint Themes 0512. Give your thoughts the warmth of applause.
Business Graph Sales PowerPoint Templates And PowerPoint Themes 0512
Microsoft Powerpoint Templates and Background with Bar graph down-These templates can be used for presentations relating to-Bar graph down, business, sales, finance, arrows, cylinders-Business Graph Sales PowerPoint Templates And PowerPoint Themes 0512 Go on the lookout for something new. Explore away with our Business Graph Sales PowerPoint Templates And PowerPoint Themes 0512.
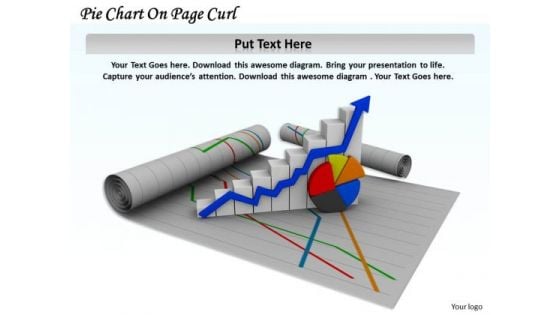
Stock Photo Pie Chart On Page Curl Arrow PowerPoint Slide
This image slide displays pie chart and growth bar graph on page curl. Use this image slide, in your presentations to express views on progress, growth and achievements. This image slide may also be used to depict strategic business planning. Make professional presentations using this image slide.
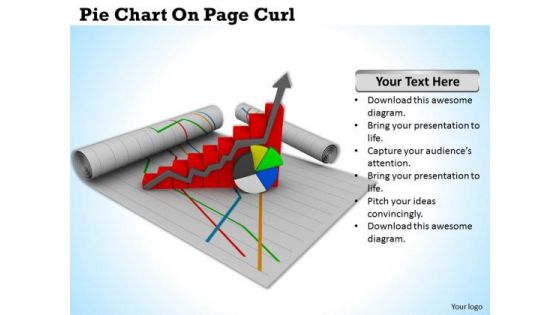
Stock Photo Pie Chart On Page Curl PowerPoint Slide
This image slide displays pie chart and growth bar graph on page curl on blue shaded background. Use this image slide, in your presentations to express views on progress, growth and achievements. This image slide may also be used to depict strategic business planning. Make professional presentations using this image slide.
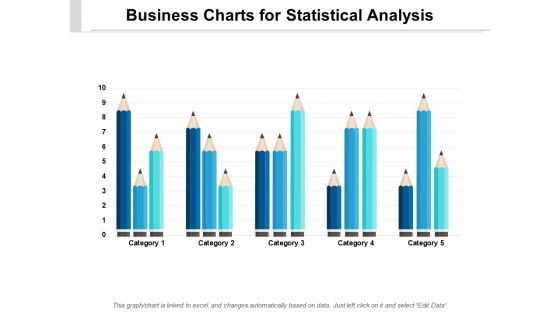
Business Charts For Statistical Analysis Ppt PowerPoint Presentation Pictures Gridlines
Presenting this set of slides with name business charts for statistical analysis ppt powerpoint presentation pictures gridlines. The topics discussed in these slides are education, growth, pencil bar graph. This is a completely editable PowerPoint presentation and is available for immediate download. Download now and impress your audience.
Stock Market Analysis Magnifying Glass Over Bar Graph And Dollar Sign Ppt PowerPoint Presentation Icon Visual Aids
This is a stock market analysis magnifying glass over bar graph and dollar sign ppt powerpoint presentation icon visual aids. This is a four stage process. The stages in this process are stock market, financial markets, bull market.
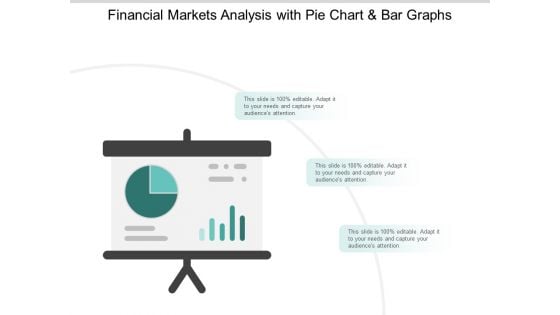
Stock Market Survey Reporting With Pie Chat And Bar Graph Ppt PowerPoint Presentation Infographic Template Example 2015
This is a stock market survey reporting with pie chat and bar graph ppt powerpoint presentation infographic template example 2015. This is a three stage process. The stages in this process are stock market, financial markets, bull market.
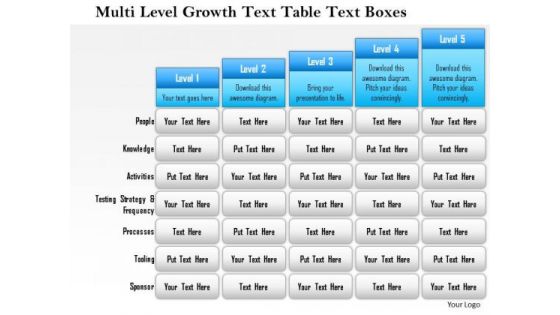
Business Framework Multi Level Growth Text Table Text Boxes 2 PowerPoint Presentation
Five staged text box style chart in bar graph design has been used to decorate this power point template slide. This diagram slide contains the multilevel growth concept. Use this PPT slide for financial growth and result analysis related topics.
Consulting Services With Bar Graph And Chat Bo Vector Icon Ppt PowerPoint Presentation File Background Designs PDF
Persuade your audience using this consulting services with bar graph and chat bo vector icon ppt powerpoint presentation file background designs pdf. This PPT design covers three stages, thus making it a great tool to use. It also caters to a variety of topics including consulting services with bar graph and chat bo vector icon. Download this PPT design now to present a convincing pitch that not only emphasizes the topic but also showcases your presentation skills.
Key Drivers Of Sales And Marketing Growth With Bar Graph Vector Icon Ppt PowerPoint Presentation File Inspiration PDF
Presenting key drivers of sales and marketing growth with bar graph vector icon ppt powerpoint presentation file inspiration pdf to dispense important information. This template comprises one stages. It also presents valuable insights into the topics including key drivers of sales and marketing growth with bar graph vector icon. This is a completely customizable PowerPoint theme that can be put to use immediately. So, download it and address the topic impactfully.
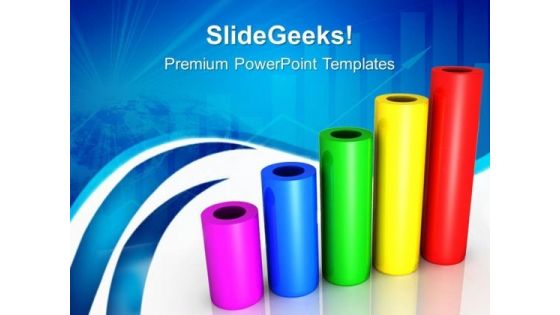
Cylinder Graph Business PowerPoint Templates And PowerPoint Themes 0512
Microsoft Powerpoint Templates and Background with bar graph-Cylinder Graph Business PowerPoint Templates And PowerPoint Themes 0512-These PowerPoint designs and slide layouts can be used for themes relating to -Bar graph,success, marketing, sales, business, finance Take your thoughts on an interesting escapade. Our Cylinder Graph Business PowerPoint Templates And PowerPoint Themes 0512 will give them a sense of adventure.
Cylinder Graph Success PowerPoint Templates And PowerPoint Themes 0512
Microsoft Powerpoint Templates and Background with bar graph-Cylinder Graph Success PowerPoint Templates And PowerPoint Themes 0512-These PowerPoint designs and slide layouts can be used for themes relating to -Bar graph,success, marketing, sales, business, finance The audience will be hard put to find fault. Our Cylinder Graph Success PowerPoint Templates And PowerPoint Themes 0512 ensure accuracy of thought.
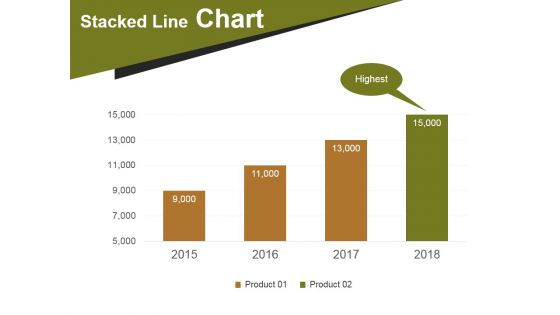
Stacked Line Chart Template 1 Ppt PowerPoint Presentation Infographic Template Layout
This is a stacked line chart template 1 ppt powerpoint presentation infographic template layout. This is a four stage process. The stages in this process are stacked line chart, highest, product.
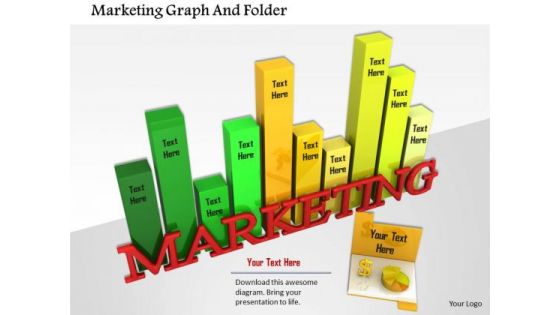
Stock Photo Marketing Graph And Folder PowerPoint Slide
Define your ideas in a unique and inspiring manner using this image which contains a graphic of colorful bar graph. This pre-designed and appealing bar graph offers an optimized possibility to illustrate your marketing strategy. Use this Image in presentations relating to business and sales.
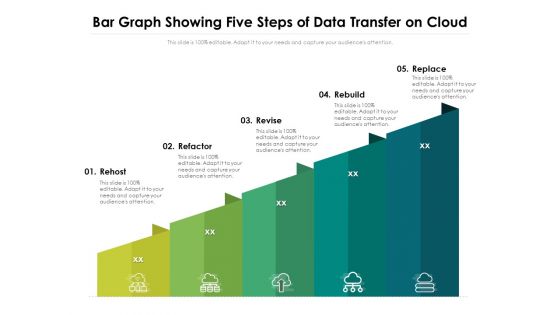
Bar Graph Showing Five Steps Of Data Transfer On Cloud Ppt PowerPoint Presentation Ideas Slide Download PDF
Presenting this set of slides with name bar graph showing five steps of data transfer on cloud ppt powerpoint presentation ideas slide download pdf. This is a five stage process. The stages in this process are rehost, refactor, revise, rebuild, replace. This is a completely editable PowerPoint presentation and is available for immediate download. Download now and impress your audience.
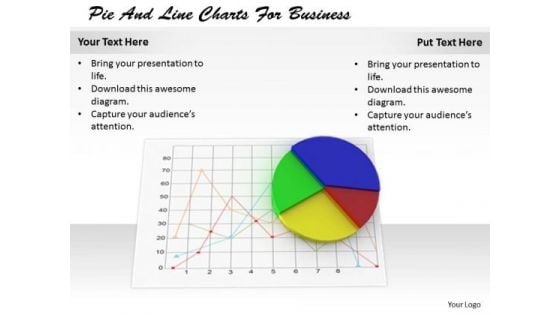
Stock Photo Creative Marketing Concepts Pie And Line Charts For Business Images Photos
Take the next step with absolute confidence. Our stock photo creative marketing concepts pie and line charts for business images photos assure a foothold. Acquire a foothold with our finance. You will feel an air of certainty.
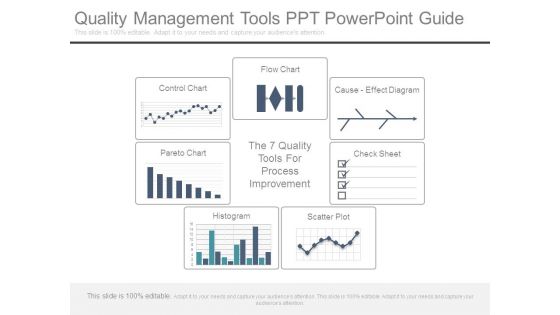
Quality Management Tools Ppt Powerpoint Guide
This is a quality management tools ppt powerpoint guide. This is a seven stage process. The stages in this process are control chart, flow chart, cause effect diagram, pareto chart, the 7 quality tools, for process improvement, check sheet, histogram, scatter plot.
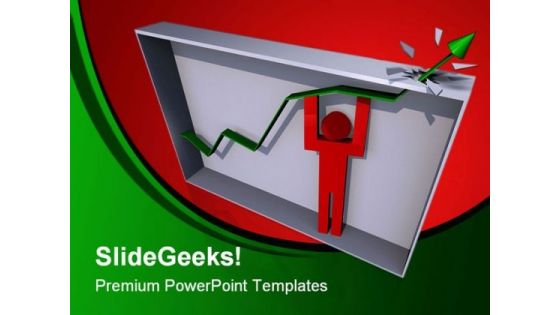
Surpassing The Goal Business PowerPoint Template 1110
3D render of a person lifting a trend line to burst from its bounding box Our Surpassing The Goal Business PowerPoint Template 1110 give a boost to your campaign. Back up the credibility you can create.
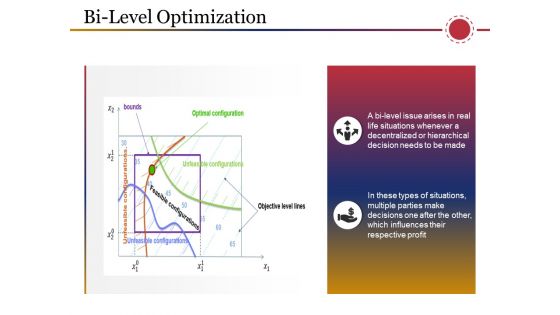
Bi Level Optimization Ppt PowerPoint Presentation Model Summary
This is a bi level optimization ppt powerpoint presentation model summary. This is a two stage process. The stages in this process are bounds, optimal configuration, objective level lines, icons, business.
Bi Level Optimization Ppt PowerPoint Presentation Gallery Icons
This is a bi level optimization ppt powerpoint presentation gallery icons. This is a two stage process. The stages in this process are objective level lines, bounds, optimal configuration, feasible configurations, business, marketing.
Bi Level Optimization Ppt PowerPoint Presentation Infographics Icon
This is a bi level optimization ppt powerpoint presentation infographics icon. This is a two stage process. The stages in this process are icons, business, marketing, bound, objective level lines.
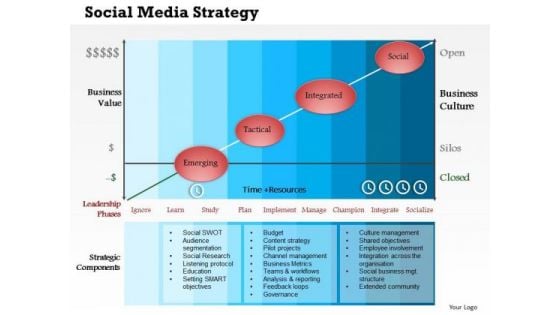
Business Framework Social Media Strategy PowerPoint Presentation
Define social media strategies in your business presentations by using this innovative business framework PPT. This PPT contains the social media marketing strategy and tools with the bar graph. Use this PPT for your social media and business related topics.

Line Chart For Product Performance Analysis Ppt PowerPoint Presentation Portfolio Portrait PDF
Pitch your topic with ease and precision using this line chart for product performance analysis ppt powerpoint presentation portfolio portrait pdf. This layout presents information on line chart for product performance analysis. It is also available for immediate download and adjustment. So, changes can be made in the color, design, graphics or any other component to create a unique layout.
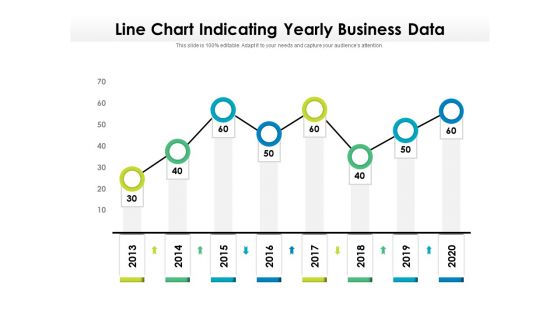
Line Chart Indicating Yearly Business Data Ppt PowerPoint Presentation Styles Deck PDF
Showcasing this set of slides titled line chart indicating yearly business data ppt powerpoint presentation styles deck pdf. The topics addressed in these templates are line chart indicating yearly business data, 2013 to 2020. All the content presented in this PPT design is completely editable. Download it and make adjustments in color, background, font etc. as per your unique business setting.
Line Chart Showing Business Trends Vector Icon Ppt PowerPoint Presentation Outline Infographics PDF
Presenting line chart showing business trends vector icon ppt powerpoint presentation outline infographics pdf to dispense important information. This template comprises three stages. It also presents valuable insights into the topics including line chart showing business trends vector icon. This is a completely customizable PowerPoint theme that can be put to use immediately. So, download it and address the topic impactfully.

XY Axis Parabolic Line On Chart Ppt PowerPoint Presentation Model Background Image PDF
Pitch your topic with ease and precision using this xy axis parabolic line on chart ppt powerpoint presentation model background image pdf. This layout presents information on xy axis parabolic line on chart. It is also available for immediate download and adjustment. So, changes can be made in the color, design, graphics or any other component to create a unique layout.
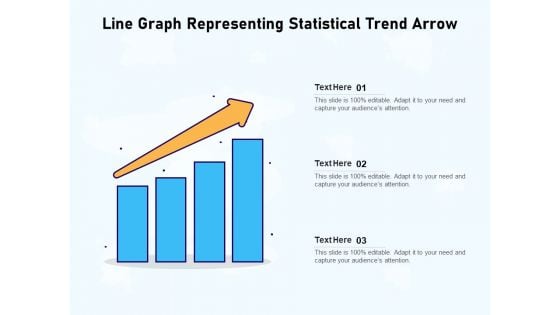
Line Chart Illustrating Business Statistical Trends Ppt PowerPoint Presentation Outline Deck PDF
Presenting line chart illustrating business statistical trends ppt powerpoint presentation outline deck pdf to dispense important information. This template comprises three stages. It also presents valuable insights into the topics including line chart illustrating business statistical trends. This is a completely customizable PowerPoint theme that can be put to use immediately. So, download it and address the topic impactfully.
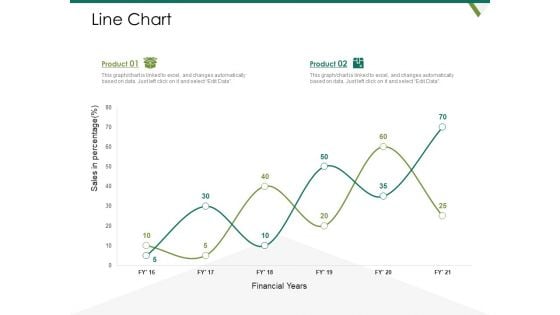
Value Chain Assessment Of Strategic Leadership Line Chart Ppt PowerPoint Presentation Ideas Demonstration PDF
Deliver and pitch your topic in the best possible manner with this value chain assessment of strategic leadership line chart ppt powerpoint presentation ideas demonstration pdf. Use them to share invaluable insights on line chart and impress your audience. This template can be altered and modified as per your expectations. So, grab it now.
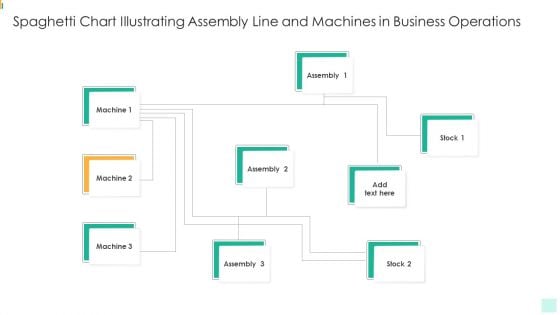
Spaghetti Chart Illustrating Assembly Line And Machines In Business Operations Download PDF
Showcasing this set of slides titled spaghetti chart illustrating assembly line and machines in business operations download pdf. The topics addressed in these templates are spaghetti chart illustrating assembly line and machines in business operations. All the content presented in this PPT design is completely editable. Download it and make adjustments in color, background, font etc. as per your unique business setting.
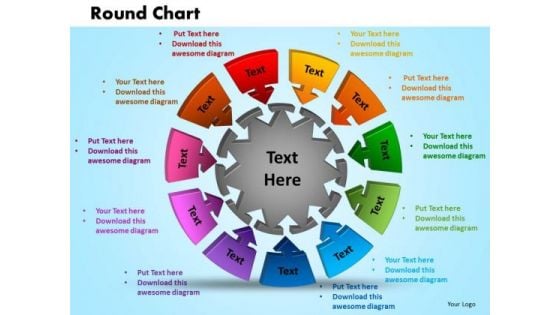
PowerPoint Template Round Chart Success Ppt Slides
PowerPoint Template Round Chart Success PPT Slides-Round charts show the relative importance of values over a period of time. Although Round charts are similar to line charts, area charts emphasize the amount of change or magnitude of values, rather than time and the rate of change. This PowerPoint Diagram is an excellent graphic to attract the attention of and understanding by your audience to improve earnings.-PowerPoint Template Round Chart Success PPT Slides Accentuate the beauty of your thoughts with our PowerPoint Template Round Chart Success Ppt Slides. They will prove an apt adornment.
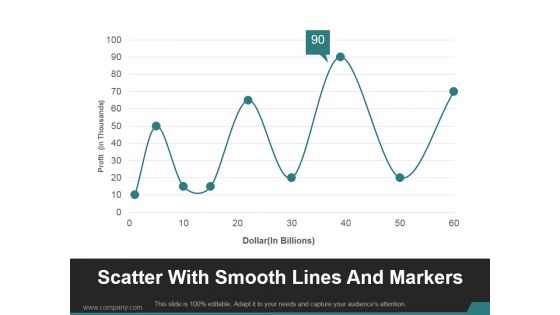
Scatter With Smooth Lines And Markers Ppt PowerPoint Presentation Show
This is a scatter with smooth lines and markers ppt powerpoint presentation show. This is a nine stage process. The stages in this process are business, marketing, line chart, profit, management.
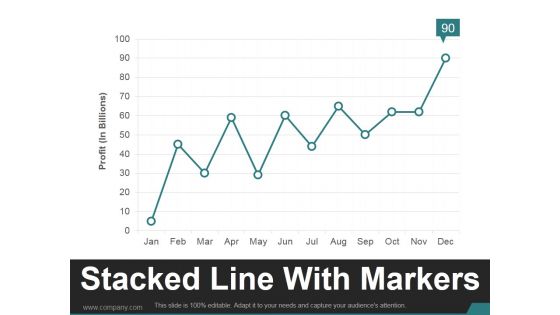
Stacked Line With Markers Ppt PowerPoint Presentation Sample
This is a stacked line with markers ppt powerpoint presentation sample. This is a one stage process. The stages in this process are business, marketing, growth, management, line chart.
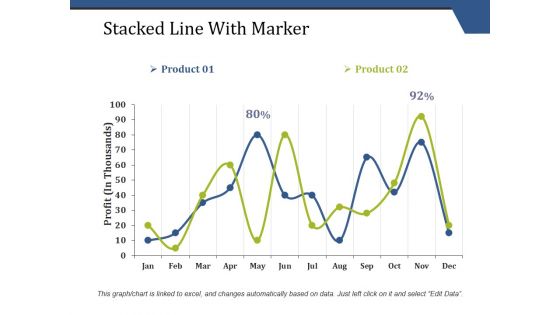
Stacked Line With Marker Ppt PowerPoint Presentation Model Background
This is a stacked line with marker ppt powerpoint presentation model background. This is a two stage process. The stages in this process are business, line chart, finance, growth, analysis.
Pie Chart And Trend Line For Market Size Icon Ppt PowerPoint Presentation Layouts Professional PDF
Presenting pie chart and trend line for market size icon ppt powerpoint presentation layouts professional pdf to dispense important information. This template comprises three stages. It also presents valuable insights into the topics including pie chart and trend line for market size icon. This is a completely customizable PowerPoint theme that can be put to use immediately. So, download it and address the topic impactfully.
Communication Strategy Vector With Chart And Trend Line Icon Ppt PowerPoint Presentation Icon Graphics Download PDF
Showcasing this set of slides titled communication strategy vector with chart and trend line icon ppt powerpoint presentation icon graphics download pdf. The topics addressed in these templates are communication strategy vector with chart and trend line icon. All the content presented in this PPT design is completely editable. Download it and make adjustments in color, background, font etc. as per your unique business setting.
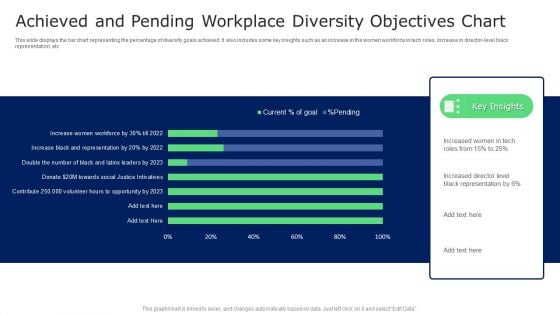
Achieved And Pending Workplace Diversity Objectives Chart Guidelines PDF
This slide displays the bar chart representing the percentage of diversity goals achieved. It also includes some key insights such as an increase in the women workforce in tech roles, increase in director level black representation, etc. Showcasing this set of slides titled Achieved And Pending Workplace Diversity Objectives Chart Guidelines PDF. The topics addressed in these templates are Achieved And Pending Workplace, Diversity Objectives Chart. All the content presented in this PPT design is completely editable. Download it and make adjustments in color, background, font etc. as per your unique business setting.
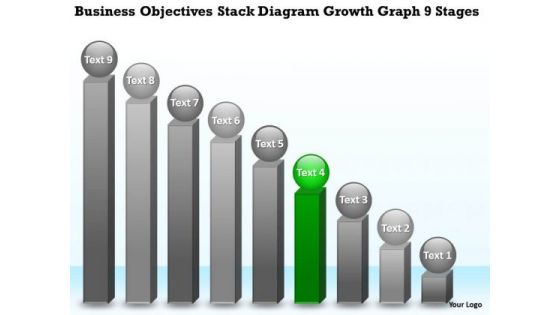
Theme Objectives Stack Diagram Growth Graph 9 Stages Business Plan PowerPoint Slides
We present our theme objectives stack diagram growth graph 9 stages business plan PowerPoint Slides.Download and present our Business PowerPoint Templates because Our PowerPoint Templates and Slides has conjured up a web of all you need with the help of our great team. Use them to string together your glistening ideas. Download and present our Marketing PowerPoint Templates because Our PowerPoint Templates and Slides are effectively colour coded to prioritise your plans They automatically highlight the sequence of events you desire. Present our Process and Flows PowerPoint Templates because Our PowerPoint Templates and Slides will let your ideas bloom. Create a bed of roses for your audience. Download and present our Shapes PowerPoint Templates because Our PowerPoint Templates and Slides are designed to help you succeed. They have all the ingredients you need. Present our Flow Charts PowerPoint Templates because Our PowerPoint Templates and Slides will provide you a launch platform. Give a lift off to your ideas and send them into orbit.Use these PowerPoint slides for presentations relating to Abstract, account, advertise, analyze, bar, business, catalog, chart, circle, circular, concept, data,design,diagram, finance, financial, four, goals, graph, growth, icon, illustration, info-graphic, information, marketing, pie, presentation, professional, profit, sign, success, symbol, vector, web. The prominent colors used in the PowerPoint template are Green, Gray, White. Attain victory with our Theme Objectives Stack Diagram Growth Graph 9 Stages Business Plan PowerPoint Slides. You will come out on top.
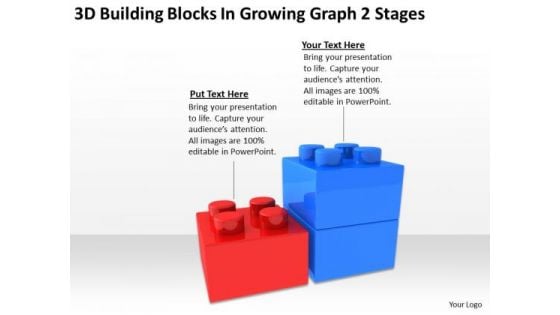
3d Building Blocks Growing Graph 2 Stages Business Plan PowerPoint Slides
We present our 3d building blocks growing graph 2 stages business plan PowerPoint Slides.Download and present our Flow Charts PowerPoint Templates because Our PowerPoint Templates and Slides will weave a web of your great ideas. They are gauranteed to attract even the most critical of your colleagues. Present our Business PowerPoint Templates because You can Bait your audience with our PowerPoint Templates and Slides. They will bite the hook of your ideas in large numbers. Use our Marketing PowerPoint Templates because You can Be the puppeteer with our PowerPoint Templates and Slides as your strings. Lead your team through the steps of your script. Use our Process and Flows PowerPoint Templates because Our PowerPoint Templates and Slides offer you the needful to organise your thoughts. Use them to list out your views in a logical sequence. Present our Success PowerPoint Templates because Our PowerPoint Templates and Slides are created by a hardworking bunch of busybees. Always flitting around with solutions gauranteed to please.Use these PowerPoint slides for presentations relating to Lego, building, concept, standard, electric, brick, economy, conservation, bar, eco, power, pollution, consumption, render, diagram, electricity, ecology, level, effectiveness, scale, idea, graph, protection, energy, comparison, object, efficiency, chart, protect, efficient, rating, norm, color, toy, friendly, saving, background, environment, ecological, construction, game, block, effective. The prominent colors used in the PowerPoint template are Blue, Red, Gray. Amplify on the basic principles with our 3d Building Blocks Growing Graph 2 Stages Business Plan PowerPoint Slides. Get through to the essence with your thoughts.
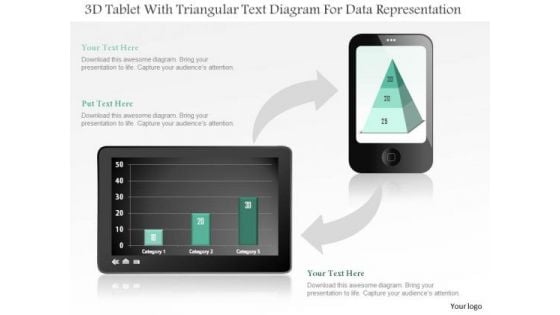
Business Diagram 3d Tablet With Triangular Text Diagram For Data Representation PowerPoint Slide
This business diagram displays bar graph on tablet and pyramid chart on mobile phone. Use this diagram, to make reports for interactive business presentations. Create professional presentations using this diagram.
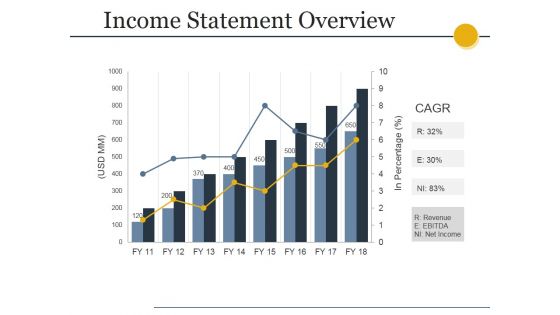
Income Statement Overview Ppt PowerPoint Presentation Professional Slides
This is a income statement overview ppt powerpoint presentation professional slides. This is a eight stage process. The stages in this process are business, marketing, bar, growth, success.
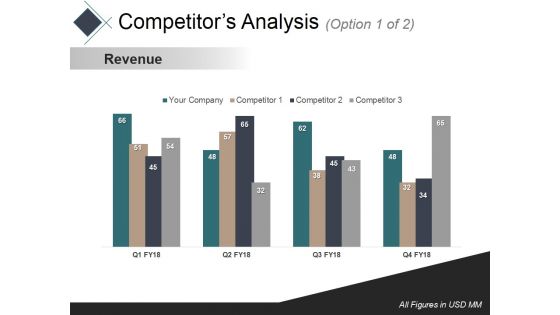
Competitors Analysis 1 Ppt PowerPoint Presentation Outline Templates
This is a competitors analysis 1 ppt powerpoint presentation outline templates. This is a four stage process. The stages in this process are revenue, business, marketing, bar, success.
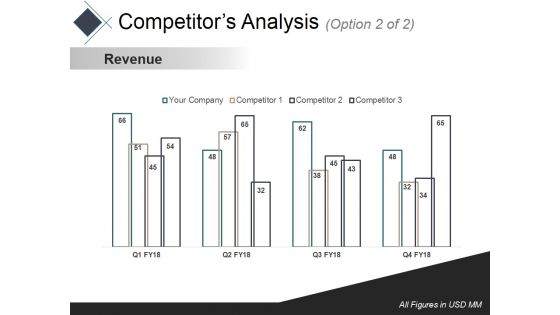
Competitors Analysis 2 Ppt PowerPoint Presentation Slides Gallery
This is a competitors analysis 2 ppt powerpoint presentation slides gallery. This is a four stage process. The stages in this process are revenue, business, marketing, bar, success.
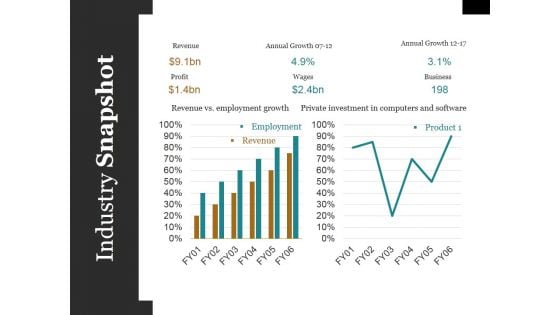
Industry Snapshot Ppt PowerPoint Presentation Styles Microsoft
This is a industry snapshot ppt powerpoint presentation styles microsoft. This is a two stage process. The stages in this process are employment, revenue, bar, marketing, success.
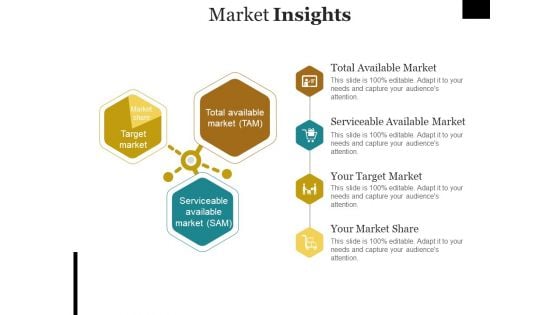
Market Insights Template Ppt PowerPoint Presentation Summary Example
This is a market insights template ppt powerpoint presentation summary example. This is a three stage process. The stages in this process are business, bar, market, growth, success.
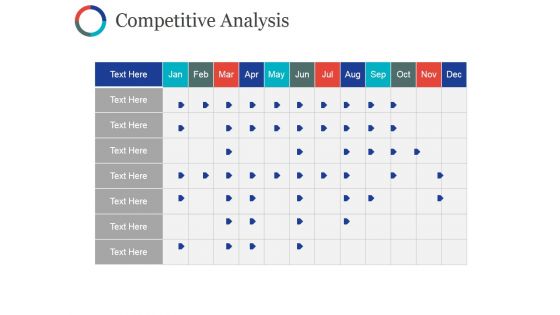
Competitive Analysis Ppt PowerPoint Presentation Summary Model
This is a competitive analysis ppt powerpoint presentation summary model. This is a six stage process. The stages in this process are business, marketing, strategy, bar, finance.
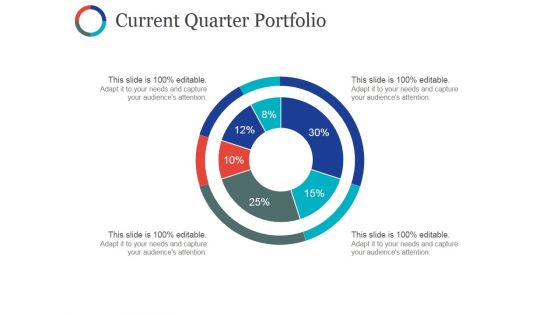
Current Quarter Portfolio Ppt PowerPoint Presentation Summary Ideas
This is a current quarter portfolio ppt powerpoint presentation summary ideas. This is a two stage process. The stages in this process are business, marketing, bar, finance, strategy.
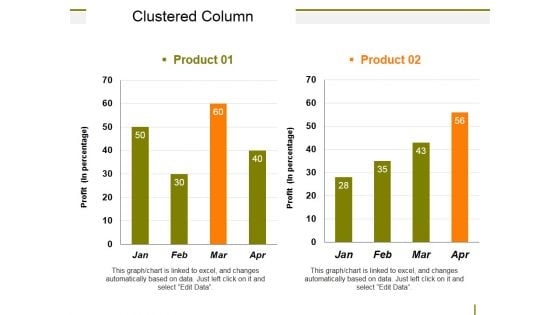
Clustered Column Ppt PowerPoint Presentation Inspiration Layouts
This is a clustered column ppt powerpoint presentation inspiration layouts. This is a two stage process. The stages in this process are business, marketing, bar, planning, strategy.
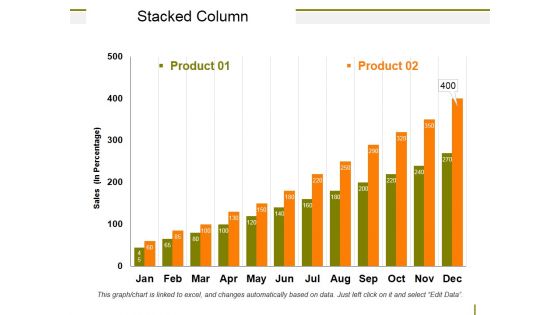
Stacked Column Ppt PowerPoint Presentation Show Tips
This is a stacked column ppt powerpoint presentation show tips. This is a two stage process. The stages in this process are business, marketing, bar, planning, strategy.
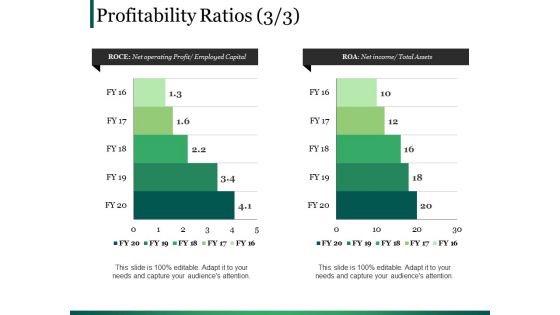
Profitability Ratios Template Ppt PowerPoint Presentation Templates
This is a profitability ratios template ppt powerpoint presentation templates. This is a two stage process. The stages in this process are business, marketing, bar, finance, planning.
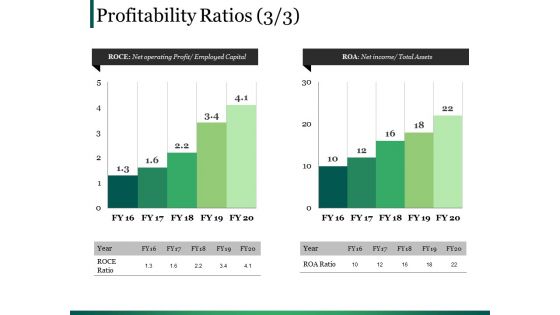
Profitability Ratios Ppt PowerPoint Presentation Model Picture
This is a profitability ratios ppt powerpoint presentation model picture. This is a two stage process. The stages in this process are business, marketing, bar, finance, planning.
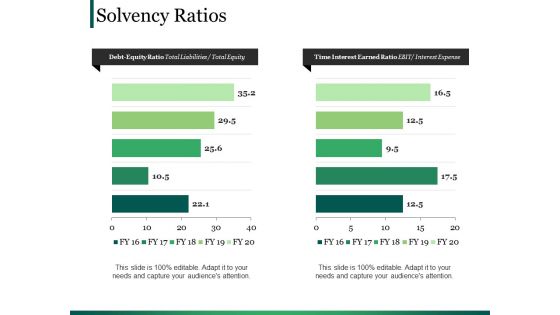
Solvency Ratios Ppt PowerPoint Presentation Summary
This is a solvency ratios ppt powerpoint presentation summary. This is a two stage process. The stages in this process are business, marketing, bar, finance, planning.
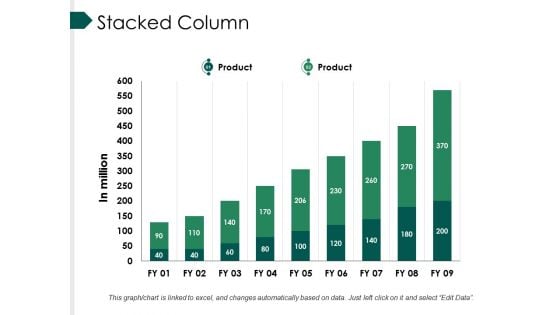
Stacked Column Ppt PowerPoint Presentation Professional Infographics
This is a stacked column ppt powerpoint presentation professional infographics. This is a nine stage process. The stages in this process are bar, marketing, strategy, finance, teamwork.
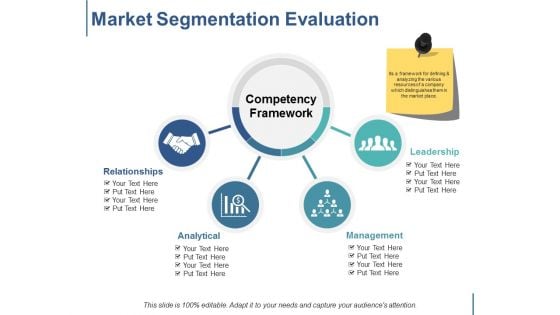
Market Segmentation Evaluation Ppt PowerPoint Presentation Ideas Elements
This is a market segmentation evaluation ppt powerpoint presentation ideas elements. This is a two stage process. The stages in this process are bar, marketing, strategy, planning, finance.
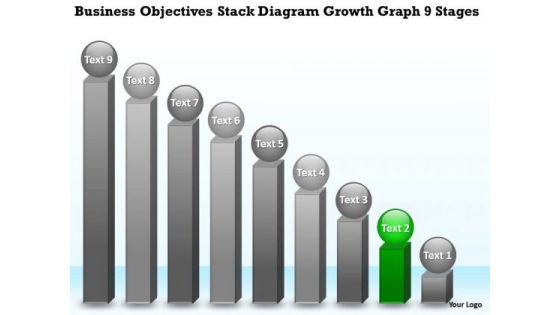
Stack Diagram Growth Graph 9 Stages Small Business Plan PowerPoint Templates
We present our stack diagram growth graph 9 stages small business plan PowerPoint templates.Download our Circle Charts PowerPoint Templates because Our PowerPoint Templates and Slides provide you with a vast range of viable options. Select the appropriate ones and just fill in your text. Download our Process and Flows PowerPoint Templates because It will Give impetus to the hopes of your colleagues. Our PowerPoint Templates and Slides will aid you in winning their trust. Present our Business PowerPoint Templates because Our PowerPoint Templates and Slides will let you Clearly mark the path for others to follow. Present our Success PowerPoint Templates because You can Be the star of the show with our PowerPoint Templates and Slides. Rock the stage with your ideas. Use our Marketing PowerPoint Templates because These PowerPoint Templates and Slides will give the updraft to your ideas. See them soar to great heights with ease.Use these PowerPoint slides for presentations relating to achievement, analyst, analyzing, arrow, aspirations, bar, bull, business, calculating, concepts, currency, development, diagram, dollar, factor, finance, financial, future, graph, graphic, growth, height, horizontal, illustration, improvement, investment, making, marketing, measuring, money, number, positivity, price, progress, savings, sign. The prominent colors used in the PowerPoint template are Green, Gray, Black. Exploit the ability of our Stack Diagram Growth Graph 9 Stages Small Business Plan PowerPoint Templates. They have many a useful attribute.
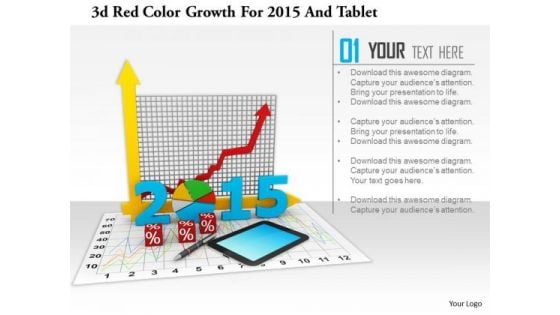
Stock Photo 3d Red Color Growth For 2015 And Tablet PowerPoint Slide
This image slide has graphics of financial charts and reports. This contains bar graph and pie chart to present business reports. Build an innovative presentation using this professional image slide.
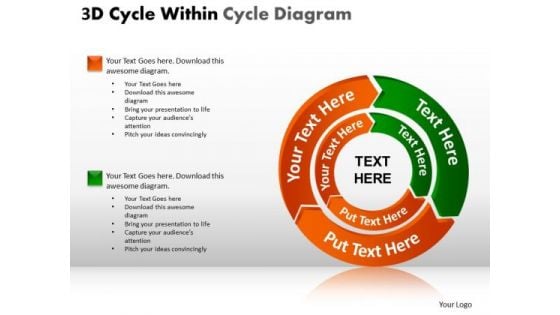
PowerPoint Templates Process Cycle Chart Ppt Slides
PowerPoint Templates Process Cycle Chart PPT Slides-These high quality powerpoint pre-designed slides and powerpoint templates have been carefully created by our professional team to help you impress your audience. All slides have been created and are 100% editable in powerpoint. Each and every property of any graphic - color, size, orientation, shading, outline etc. can be modified to help you build an effective powerpoint presentation. Any text can be entered at any point in the powerpoint template or slide. Simply DOWNLOAD, TYPE and PRESENT! Our PowerPoint Templates Process Cycle Chart Ppt Slides will fall in line with your thoughts. They will convey the essence accurately.

 Home
Home