List Template
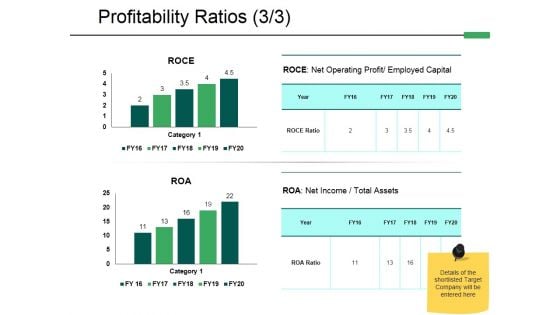
Profitability Ratios Template 3 Ppt PowerPoint Presentation Styles Introduction
This is a profitability ratios template 3 ppt powerpoint presentation styles introduction. This is a two stage process. The stages in this process are finance, analysis, compere, strategy, business.
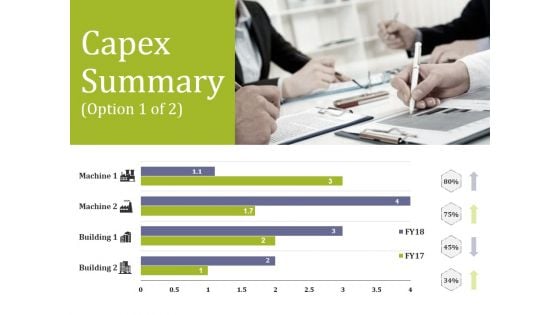
Capex Summary Template 1 Ppt PowerPoint Presentation Professional Mockup
This is a capex summary template 1 ppt powerpoint presentation professional mockup. This is a four stage process. The stages in this process are finance, analysis, business, marketing, strategy.
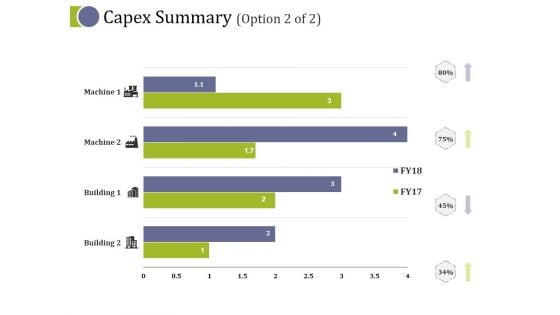
Capex Summary Template 2 Ppt PowerPoint Presentation Layouts Layout Ideas
This is a capex summary template 2 ppt powerpoint presentation layouts layout ideas. This is a four stage process. The stages in this process are finance, analysis, business, marketing, strategy.
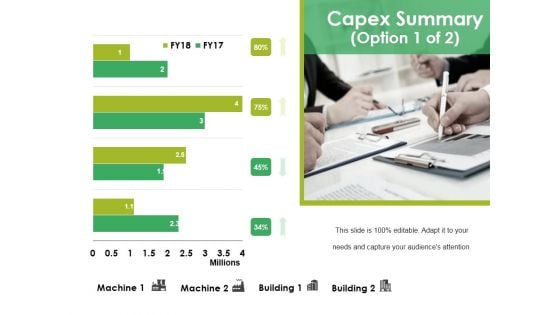
Capex Summary Template 1 Ppt PowerPoint Presentation Infographics Mockup
This is a capex summary template 1 ppt powerpoint presentation infographics mockup. This is a four stage process. The stages in this process are finance, marketing, business, analysis, strategy.
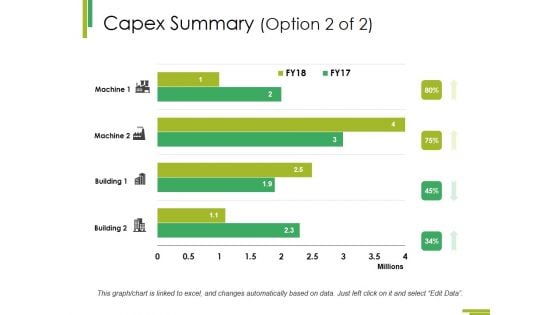
Capex Summary Template 2 Ppt PowerPoint Presentation Inspiration Samples
This is a capex summary template 2 ppt powerpoint presentation inspiration samples. This is a four stage process. The stages in this process are finance, marketing, business, analysis, strategy.
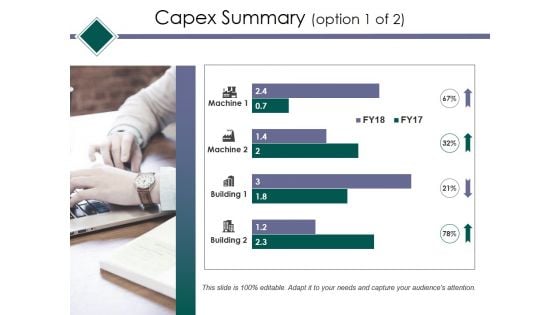
Capex Summary Template 1 Ppt PowerPoint Presentation Layouts Examples
This is a capex summary template 1 ppt powerpoint presentation layouts examples. This is a four stage process. The stages in this process are business, finance, marketing, analysis, investment.
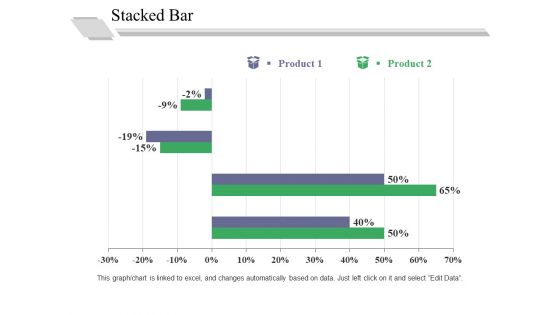
Stacked Bar Template 2 Ppt PowerPoint Presentation Professional Graphics Pictures
This is a stacked bar template 2 ppt powerpoint presentation professional graphics pictures. This is a two stage process. The stages in this process are in percentage, business, marketing, graph, strategy.
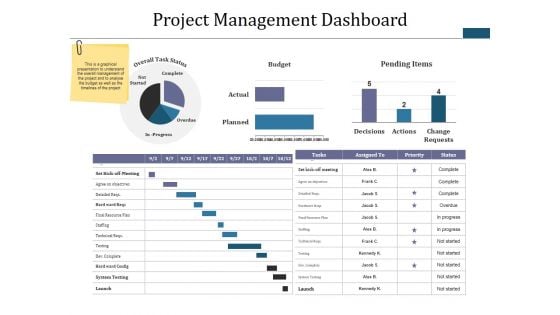
Project Management Dashboard Ppt PowerPoint Presentation Infographic Template Diagrams
This is a project management dashboard ppt powerpoint presentation infographic template diagrams. This is a three stage process. The stages in this process are budget, pending items, complete, overdue, not started.
Bar Graph Template 1 Ppt PowerPoint Presentation Icon Layouts
This is a bar graph template 1 ppt powerpoint presentation icon layouts. This is a three stage process. The stages in this process are bar graph, finance, analysis, marketing, strategy.
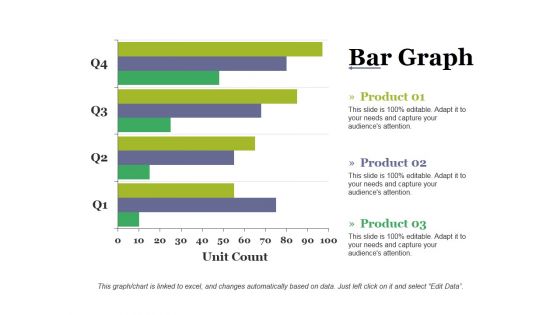
Bar Graph Template 2 Ppt PowerPoint Presentation Inspiration Backgrounds
This is a bar graph template 2 ppt powerpoint presentation inspiration backgrounds. This is a four stage process. The stages in this process are bar graph, finance, analysis, marketing, strategy.
Magnifying Glass Ppt PowerPoint Presentation Infographic Template Example File
This is a magnifying glass ppt powerpoint presentation infographic template example file. This is a two stage process. The stages in this process are magnifying glass, gears, technology, marketing, strategy, business.
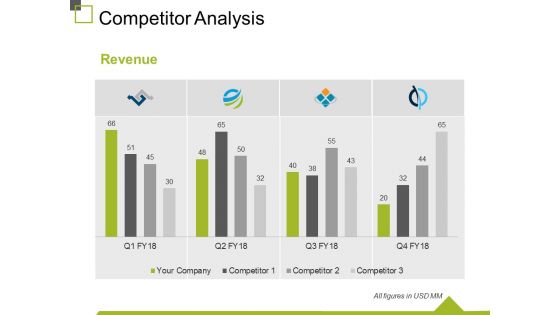
Competitor Analysis Template 1 Ppt PowerPoint Presentation File Grid
This is a competitor analysis template 1 ppt powerpoint presentation file grid. This is a four stage process. The stages in this process are finance, marketing, business, graph, analysis, revenue.
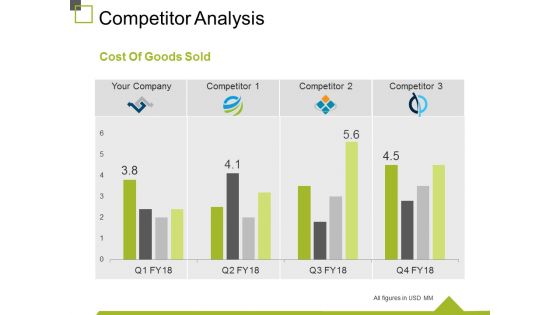
Competitor Analysis Template 3 Ppt PowerPoint Presentation Inspiration Visuals
This is a competitor analysis template 3 ppt powerpoint presentation inspiration visuals. This is a four stage process. The stages in this process are business, marketing, cost of goods sold, analysis, graph.
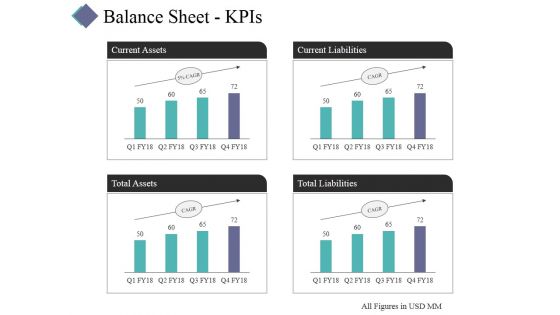
Balance Sheet Kpis Template 2 Ppt PowerPoint Presentation Ideas Show
This is a balance sheet kpis template 2 ppt powerpoint presentation ideas show. This is a four stage process. The stages in this process are current assets, total assets, total liabilities, current liabilities.
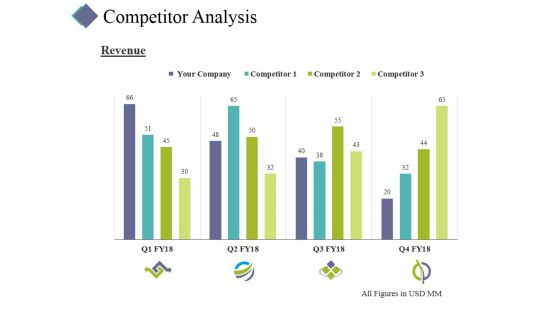
Competitor Analysis Template 1 Ppt PowerPoint Presentation Portfolio Inspiration
This is a competitor analysis template 1 ppt powerpoint presentation portfolio inspiration. This is a four stage process. The stages in this process are competitor, finance, marketing, strategy, analysis, business.
Competitor Analysis Template 3 Ppt PowerPoint Presentation Professional Icon
This is a competitor analysis template 3 ppt powerpoint presentation professional icon. This is a four stage process. The stages in this process are competitor, finance, marketing, strategy, analysis, business.
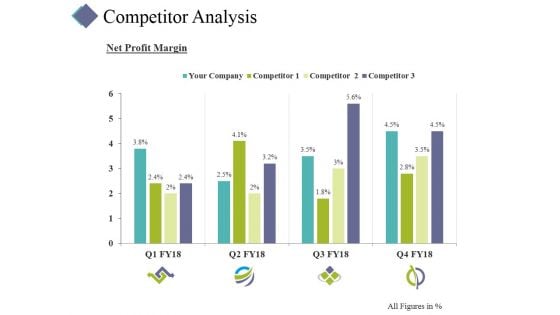
Competitor Analysis Template 4 Ppt PowerPoint Presentation Graphics
This is a competitor analysis template 4 ppt powerpoint presentation graphics. This is a four stage process. The stages in this process are competitor, finance, marketing, strategy, analysis, business.
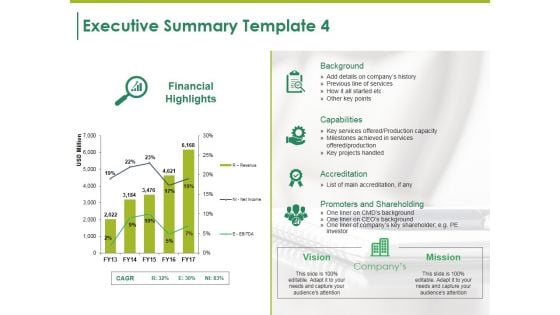
Executive Summary Template 4 Ppt PowerPoint Presentation Pictures File Formats
This is a executive summary template 4 ppt powerpoint presentation pictures file formats. This is a five stage process. The stages in this process are background, capabilities, accreditation, promoters and shareholding, vision.
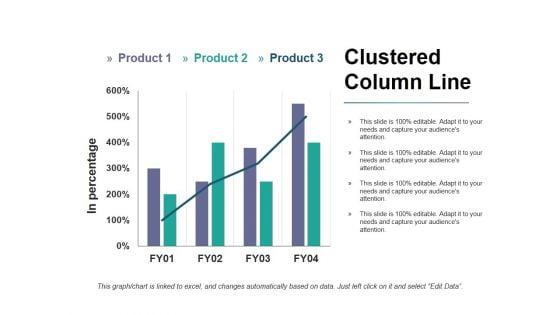
Clustered Column Line Ppt PowerPoint Presentation Infographic Template Pictures
This is a clustered column line ppt powerpoint presentation infographic template pictures. This is a three stage process. The stages in this process are product, in percentage, bar graph, growth, success.
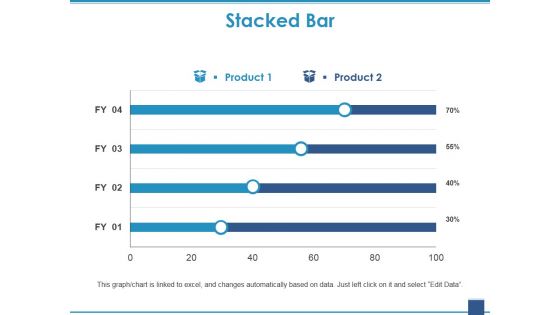
Stacked Bar Template 1 Ppt PowerPoint Presentation Gallery Deck
This is a stacked bar template 1 ppt powerpoint presentation gallery deck. This is a two stage process. The stages in this process are stacked bar, growth, finance, marketing, business.
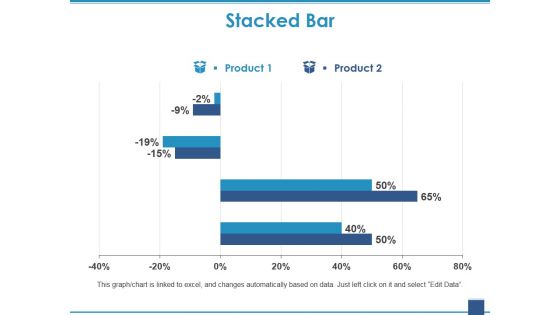
Stacked Bar Template 2 Ppt PowerPoint Presentation Show Clipart
This is a stacked bar template 2 ppt powerpoint presentation show clipart. This is a two stage process. The stages in this process are stacked bar, growth, finance, marketing, business, investment.
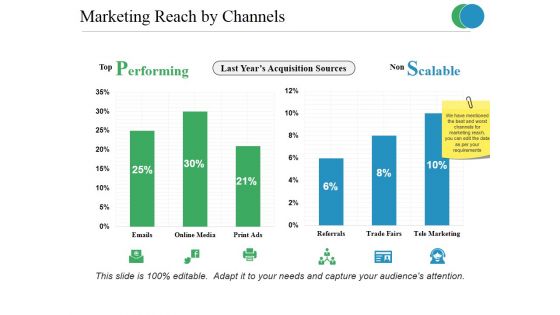
Marketing Reach By Channels Ppt PowerPoint Presentation Infographic Template Background
This is a marketing reach by channels ppt powerpoint presentation infographic template background. This is a two stage process. The stages in this process are performing, scalable, finance, marketing, strategy, business.
Pandl Kpis Template Ppt PowerPoint Presentation Model Icon
This is a pandl kpis template ppt powerpoint presentation model icon. This is a four stage process. The stages in this process are revenue, cogs, operating profit, net profit.
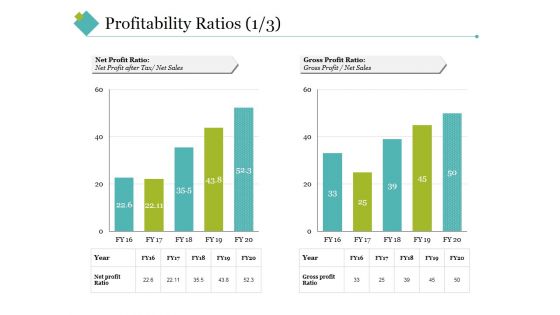
Profitability Ratios Template 2 Ppt PowerPoint Presentation Styles Example Topics
This is a profitability ratios template 2 ppt powerpoint presentation styles example topics. This is a two stage process. The stages in this process are net profit ratio, gross profit ratio, net sales, gross profit, year.
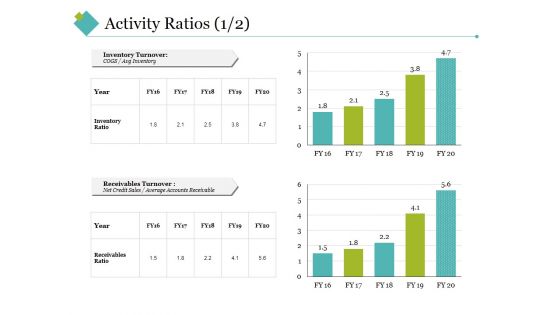
Activity Ratios Template 2 Ppt PowerPoint Presentation Show Images
This is a activity ratios template 2 ppt powerpoint presentation show images. This is a two stage process. The stages in this process are inventory turnover, receivables turnover, inventory ratio, receivables ratio, year.
Income Statement Overview Ppt PowerPoint Presentation Infographic Template Icon
This is a income statement overview ppt powerpoint presentation infographic template icon. This is a five stage process. The stages in this process are revenue, profit margin, operating profit margin.
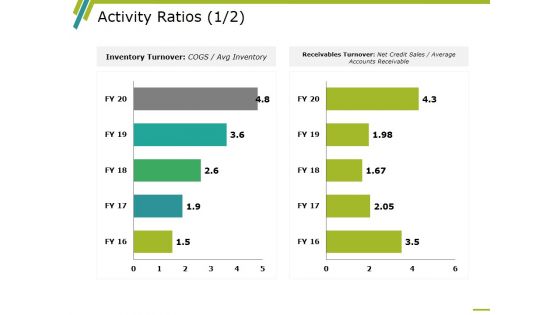
Activity Ratios Template 2 Ppt PowerPoint Presentation Summary Background Images
This is a activity ratios template 2 ppt powerpoint presentation summary background images. This is a two stage process. The stages in this process are business, finance, strategy, marketing, analysis.
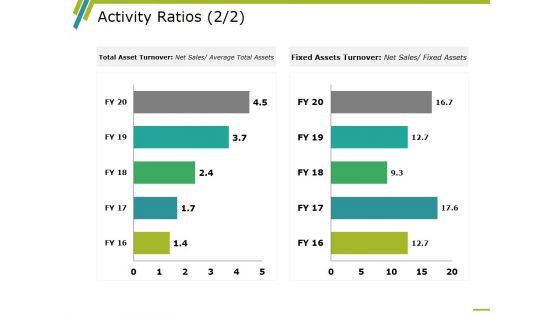
Activity Ratios Template 3 Ppt PowerPoint Presentation Professional Graphic Tips
This is a activity ratios template 3 ppt powerpoint presentation professional graphic tips. This is a two stage process. The stages in this process are business, finance, marketing, strategy, analysis.
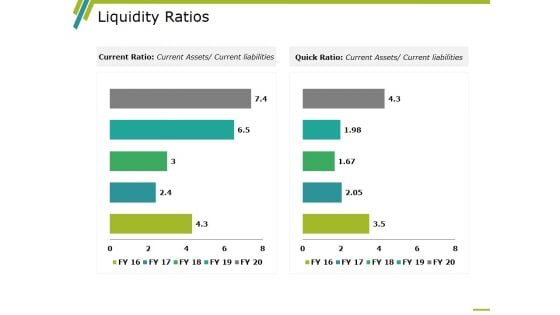
Liquidity Ratios Template 2 Ppt PowerPoint Presentation Ideas Microsoft
This is a liquidity ratios template 2 ppt powerpoint presentation ideas microsoft. This is a two stage process. The stages in this process are business, marketing, graph, year, current ratio, quick ratio.
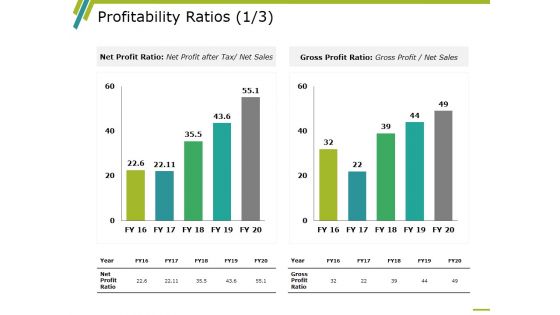
Profitability Ratios Template 2 Ppt PowerPoint Presentation Show Portfolio
This is a profitability ratios template 2 ppt powerpoint presentation show portfolio. This is a two stage process. The stages in this process are business, marketing, graph, net profit ratio, gross profit ratio, year.
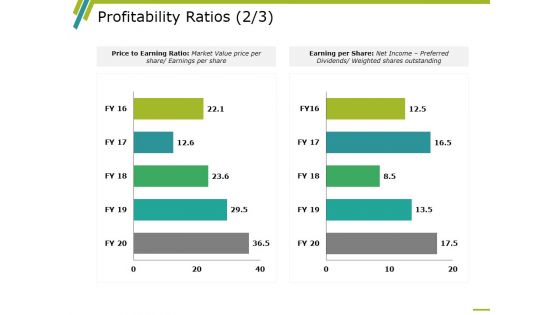
Profitability Ratios Template 3 Ppt PowerPoint Presentation Inspiration Backgrounds
This is a profitability ratios template 3 ppt powerpoint presentation inspiration backgrounds. This is a two stage process. The stages in this process are business, marketing, graph, price to earning ratio, earning per share.
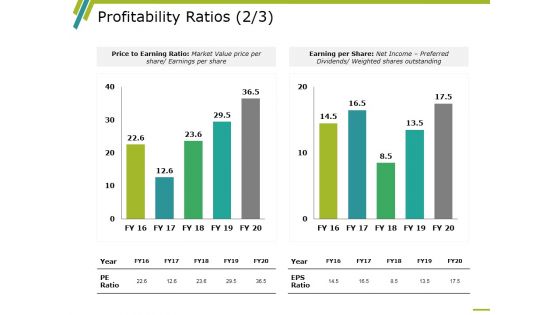
Profitability Ratios Template 4 Ppt PowerPoint Presentation Infographics Rules
This is a profitability ratios template 4 ppt powerpoint presentation infographics rules. This is a two stage process. The stages in this process are business, marketing, graph, price to earning ratio, earning per share.
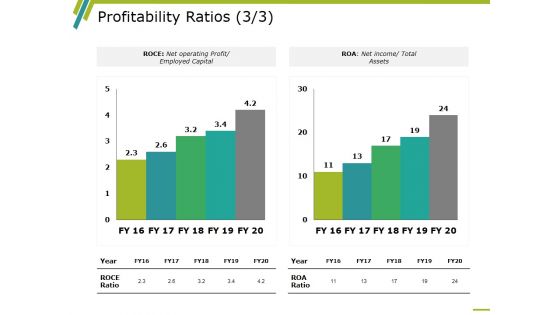
Profitability Ratios Template 6 Ppt PowerPoint Presentation Design Ideas
This is a profitability ratios template 6 ppt powerpoint presentation design ideas. This is a two stage process. The stages in this process are business, marketing, graph, roce, roa.
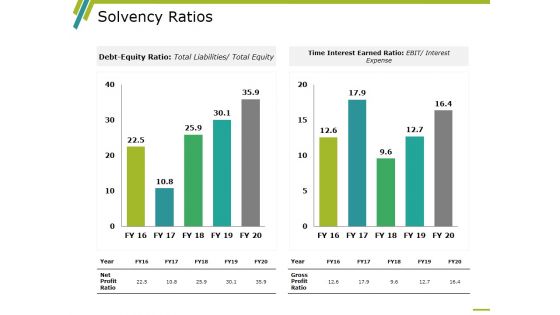
Solvency Ratios Template 1 Ppt PowerPoint Presentation Layouts Graphics Design
This is a solvency ratios template 1 ppt powerpoint presentation layouts graphics design. This is a two stage process. The stages in this process are time interest earned ratio, debt equity ratio, gross profit ratio, net profit ratio, year.
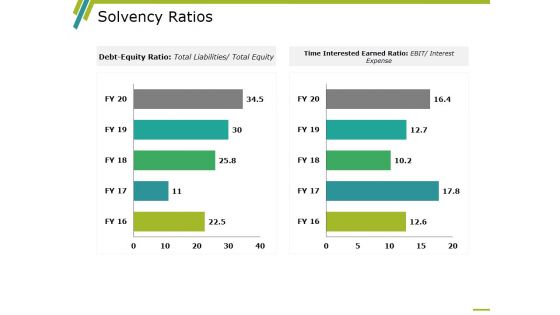
Solvency Ratios Template 2 Ppt PowerPoint Presentation Layouts Layouts
This is a solvency ratios template 2 ppt powerpoint presentation layouts layouts. This is a two stage process. The stages in this process are time interest earned ratio, debt equity ratio, gross profit ratio, net profit ratio, year.
Stacked Bar Template 1 Ppt PowerPoint Presentation Icon Portfolio
This is a stacked bar template 1 ppt powerpoint presentation icon portfolio. This is a two stage process. The stages in this process are business, marketing, finance, graph, strategy.
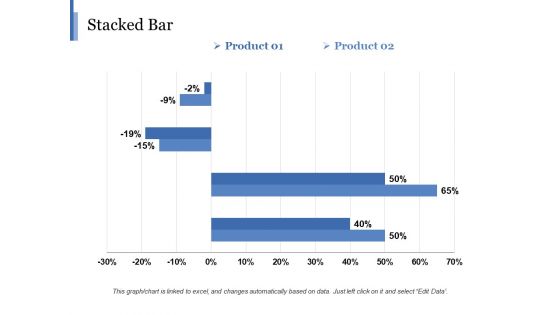
Stacked Bar Template 2 Ppt PowerPoint Presentation Gallery Background
This is a stacked bar template 2 ppt powerpoint presentation gallery background. This is a two stage process. The stages in this process are business, marketing, finance, graph, strategy, percentage.
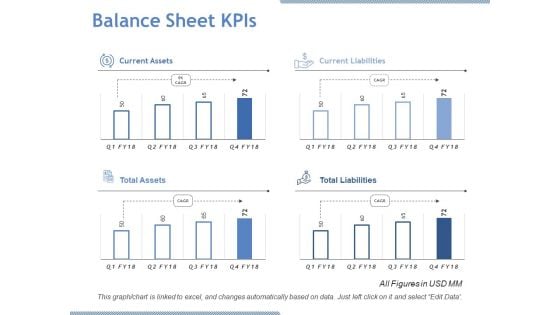
Balance Sheet Kpis Ppt PowerPoint Presentation Infographic Template Inspiration
This is a balance sheet kpis ppt powerpoint presentation infographic template inspiration. This is a four stage process. The stages in this process are current assets, current liabilities, total assets, total liabilities.
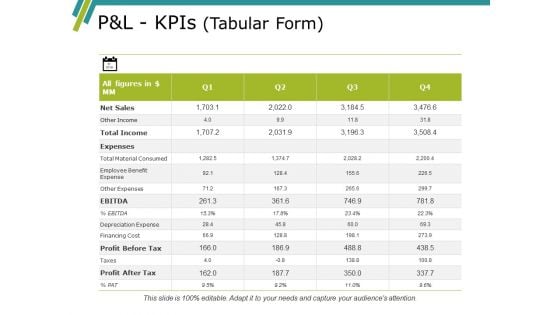
Pandl Kpis Template Ppt PowerPoint Presentation Gallery Summary
This is a pandl kpis template ppt powerpoint presentation gallery summary. This is a four stage process. The stages in this process are revenue, cogs, operating profit, net profit.
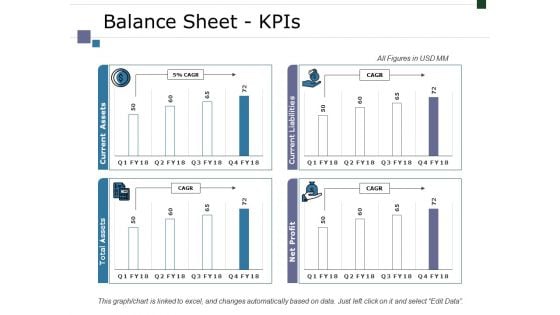
Balance Sheet Kpis Ppt PowerPoint Presentation Infographic Template Designs
This is a balance sheet kpis ppt powerpoint presentation infographic template designs. This is a four stage process. The stages in this process are business, marketing, finance, graph, strategy.
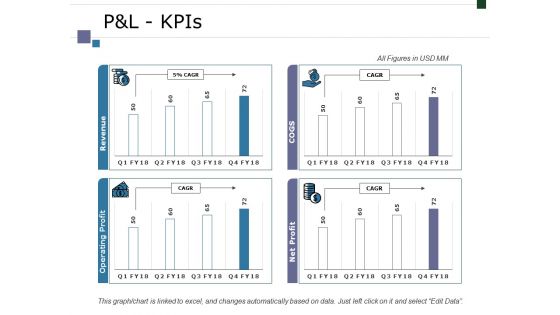
Pandl Kpis Ppt PowerPoint Presentation Infographic Template Graphics Tutorials
This is a pandl kpis ppt powerpoint presentation infographic template graphics tutorials. This is a four stage process. The stages in this process are business, marketing, finance, graph, strategy.
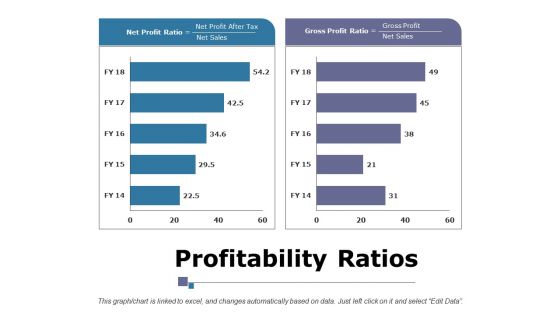
Profitability Ratios Ppt PowerPoint Presentation Infographic Template Portrait
This is a profitability ratios ppt powerpoint presentation infographic template portrait. This is a two stage process. The stages in this process are business, marketing, finance, net profit ratio, gross profit ratio.
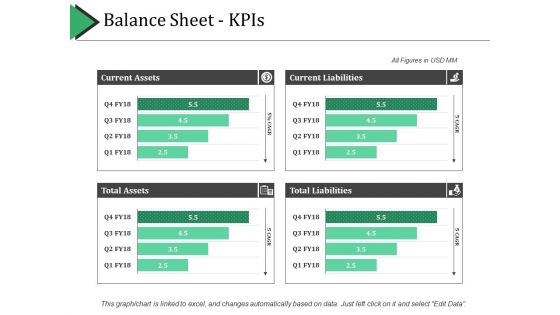
Balance Sheet Kpis Template 1 Ppt PowerPoint Presentation Pictures Grid
This is a balance sheet kpis template 1 ppt powerpoint presentation pictures grid. This is a four stage process. The stages in this process are current assets, current liabilities, total assets, total liabilities.
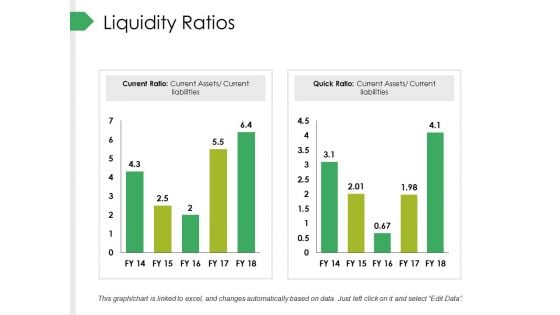
Liquidity Ratios Ppt PowerPoint Presentation Infographic Template Ideas
This is a liquidity ratios ppt powerpoint presentation infographic template ideas. This is a two stage process. The stages in this process are business, marketing, current ratio, quick ratio, finance.
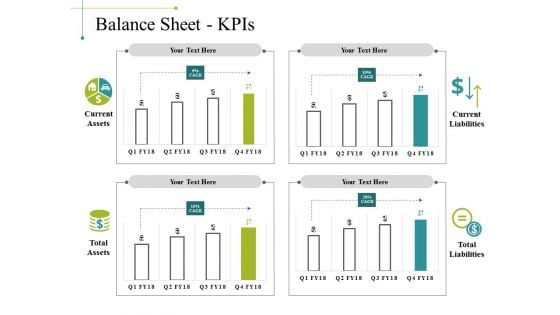
Balance Sheet Kpis Template 1 Ppt PowerPoint Presentation Show Inspiration
This is a balance sheet kpis template 1 ppt powerpoint presentation show inspiration. This is a four stage process. The stages in this process are business, marketing, graph, current liabilities, total liabilities.
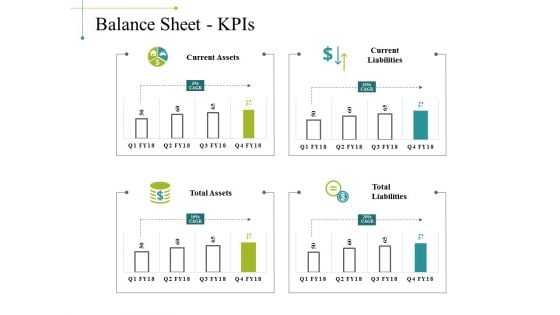
Balance Sheet Kpis Template 2 Ppt PowerPoint Presentation Gallery Example
This is a balance sheet kpis template 2 ppt powerpoint presentation gallery example. This is a four stage process. The stages in this process are business, marketing, graph, current liabilities, total liabilities.
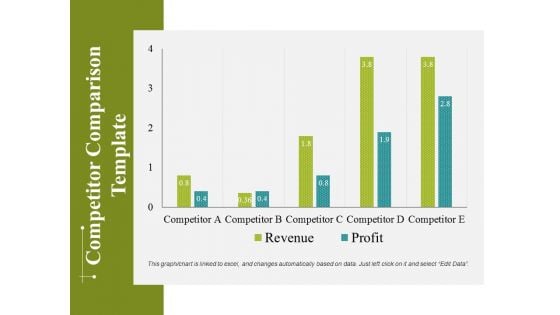
Competitor Comparison Template 2 Ppt PowerPoint Presentation Infographics Objects
This is a competitor comparison template 2 ppt powerpoint presentation infographics objects. This is a five stage process. The stages in this process are business, marketing, graph, finance, strategy.
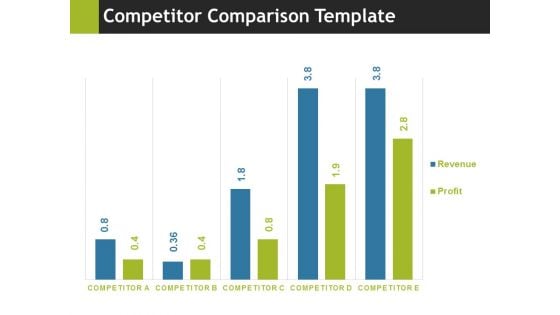
Competitor Comparison Template 2 Ppt PowerPoint Presentation Inspiration Images
This is a competitor comparison template 2 ppt powerpoint presentation inspiration images. This is a five stage process. The stages in this process are business, marketing, graph, finance, strategy.
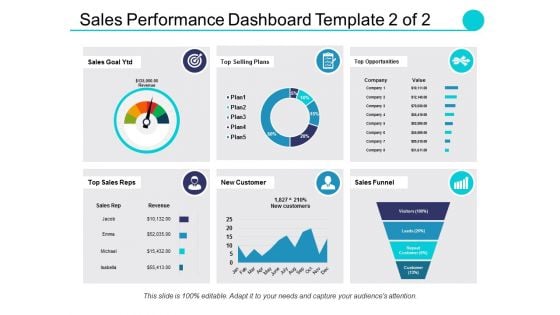
Sales Performance Dashboard Template Ppt PowerPoint Presentation Professional Elements
This is a sales performance dashboard template ppt powerpoint presentation professional elements. This is a eight stage process. The stages in this process are sales comparison, sales by product category, sales by month, brand profitability, revenue.
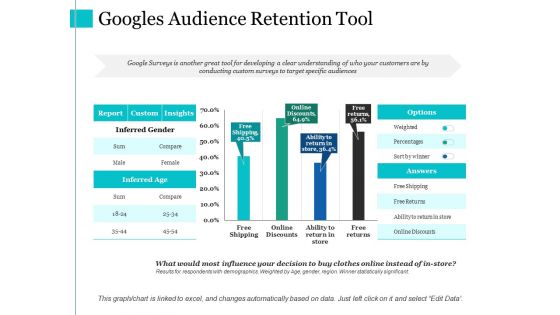
Googles Audience Retention Tool Ppt PowerPoint Presentation Infographic Template Infographics
This is a googles audience retention tool ppt powerpoint presentation infographic template infographics. This is a four stage process. The stages in this process are free shipping, online discounts, free returns, inferred age, custom.
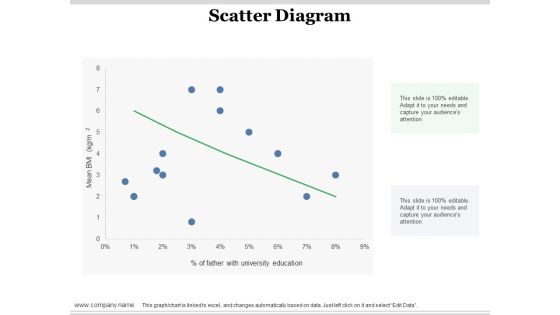
Scatter Diagram Ppt PowerPoint Presentation Infographic Template Design Ideas
This is a scatter diagram ppt powerpoint presentation infographic template design ideas. This is a one stage process. The stages in this process are scatter diagram, finance, in percentage, business, bar graph.
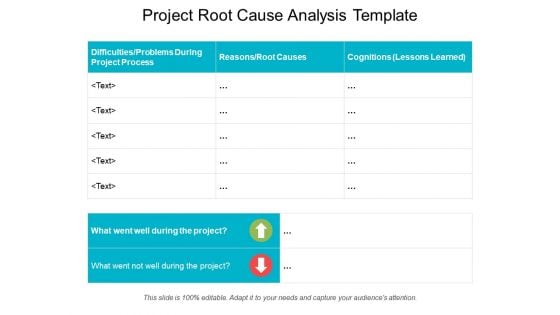
Project Root Cause Analysis Template Ppt PowerPoint Presentation Professional Show
This is a project root cause analysis template ppt powerpoint presentation professional show. This is a three stage process. The stages in this process are project analysis, project review, project performance management.
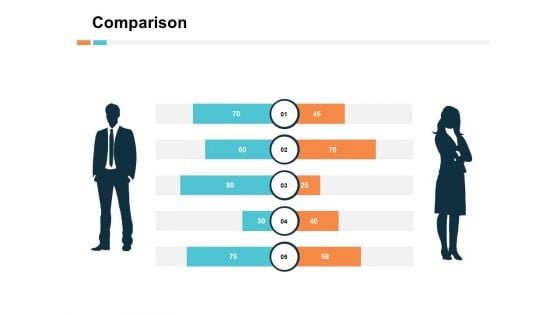
Comparison Male And Female Ppt PowerPoint Presentation Infographic Template Layouts
This is a comparison male and female ppt powerpoint presentation infographic template layouts. This is a five stage process. The stages in this process are business, management, marketing, compare.
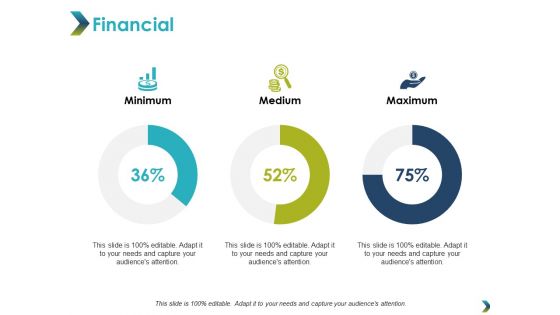
Financial Minimum Maximum Ppt PowerPoint Presentation Infographic Template Picture
This is a financial minimum maximum ppt powerpoint presentation infographic template picture. This is a three stage process. The stages in this process are financial, minimum, maximum, marketing, strategy.
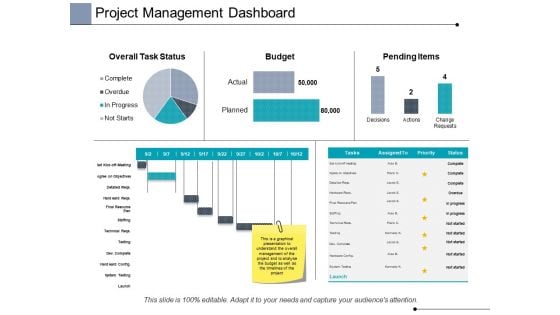
Project Management Dashboard Ppt PowerPoint Presentation Infographic Template Graphics
This is a project management dashboard ppt powerpoint presentation infographic template graphics. This is a three stage process. The stages in this process are finance, analysis, business, investment, marketing.
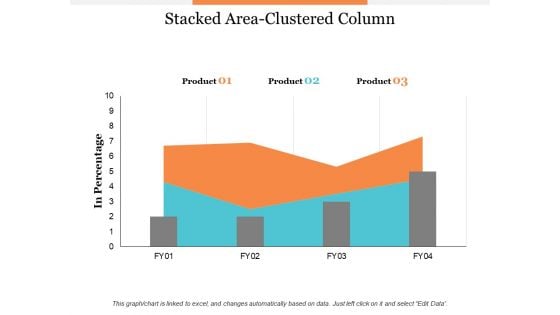
Stacked Area Clustered Column Ppt PowerPoint Presentation Infographic Template Summary
This is a stacked area clustered column ppt powerpoint presentation infographic template summary. This is a three stage process. The stages in this process are business, management, marketing, percentage, product.
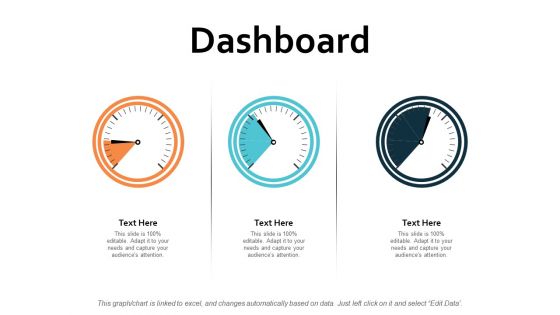
Dashboard Finance Ppt PowerPoint Presentation Infographic Template Graphic Tips
This is a dashboard finance ppt powerpoint presentation infographic template graphic tips. This is a three stage process. The stages in this process are dashboard, finance, analysis, business, investment.
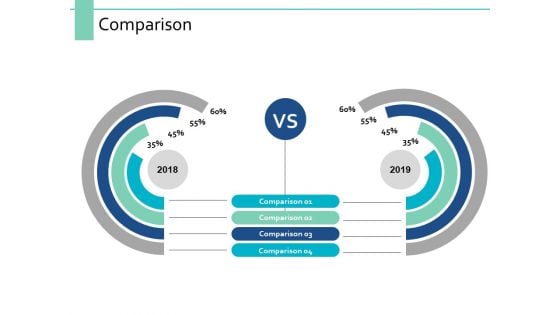
Comparison Marketing Strategy Ppt PowerPoint Presentation Infographic Template Example 2015
This is a comparison marketing strategy ppt powerpoint presentation infographic template example 2015. This is a two stage process. The stages in this process are finance, marketing, management, investment, analysis.
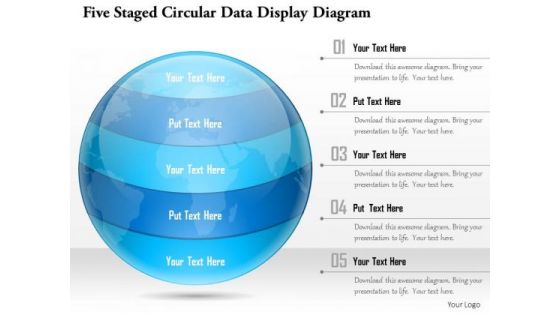
Business Diagram Five Staged Circular Data Display Diagram Presentation Template
This Power Point template slide has been crafted with graphic of five staged circular diagram. This PPT slide contains the concept of data analysis and representation. This PPT slide can be used for business data presentations.
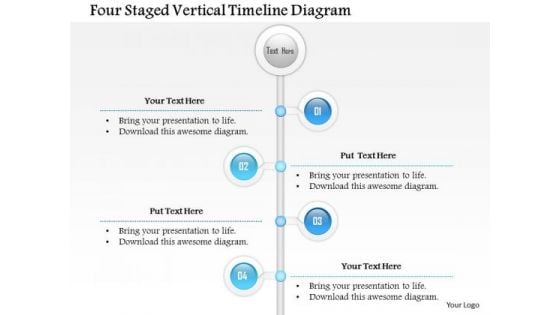
Business Diagram Four Staged Vertical Timeline Diagram Presentation Template
This PPT slide contains the concept of business timeline formation. This Power Point template slide has been designed with graphic of four staged vertical timeline text boxes diagram. Use this PPT slide and make an exclusive presentation.


 Continue with Email

 Home
Home


