List With Icons
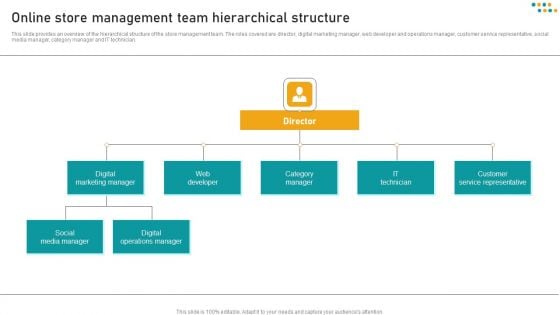
E Commerce Business Online Store Management Team Hierarchical Structure Microsoft PDF
This slide provides an overview of the hierarchical structure of the store management team. The roles covered are director, digital marketing manager, web developer and operations manager, customer service representative, social media manager, category manager and IT technician. Do you have an important presentation coming up Are you looking for something that will make your presentation stand out from the rest Look no further than E Commerce Business Online Store Management Team Hierarchical Structure Microsoft PDF. With our professional designs, you can trust that your presentation will pop and make delivering it a smooth process. And with Slidegeeks, you can trust that your presentation will be unique and memorable. So why wait Grab E Commerce Business Online Store Management Team Hierarchical Structure Microsoft PDF today and make your presentation stand out from the rest.
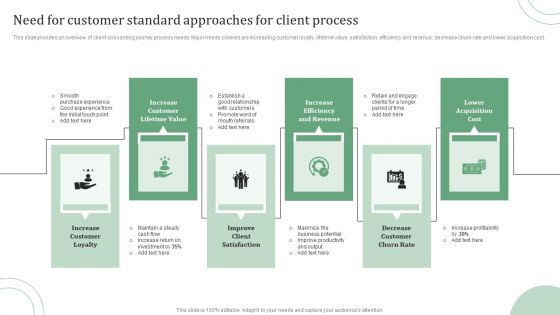
Standard Approaches For Client Onboarding Journey Need For Customer Standard Designs PDF
This slide provides an overview of client onboarding journey process needs. Major needs covered are increasing customer loyalty, lifetime value, satisfaction, efficiency and revenue, decrease churn rate and lower acquisition cost. Coming up with a presentation necessitates that the majority of the effort goes into the content and the message you intend to convey. The visuals of a PowerPoint presentation can only be effective if it supplements and supports the story that is being told. Keeping this in mind our experts created Standard Approaches For Client Onboarding Journey Need For Customer Standard Designs PDF to reduce the time that goes into designing the presentation. This way, you can concentrate on the message while our designers take care of providing you with the right template for the situation.
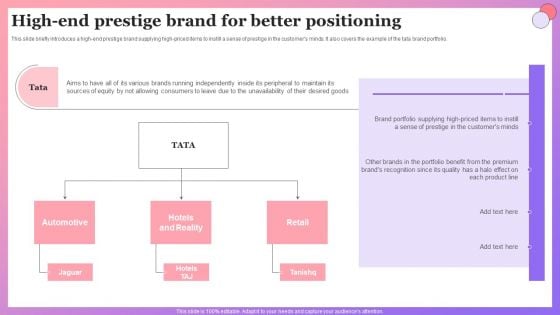
Enabling Brand Portfolio High End Prestige Brand For Better Positioning Structure PDF
This slide briefly introduces a high-end prestige brand supplying high-priced items to instill a sense of prestige in the customers minds. It also covers the example of the tata brand portfolio. Coming up with a presentation necessitates that the majority of the effort goes into the content and the message you intend to convey. The visuals of a PowerPoint presentation can only be effective if it supplements and supports the story that is being told. Keeping this in mind our experts created Enabling Brand Portfolio High End Prestige Brand For Better Positioning Structure PDF to reduce the time that goes into designing the presentation. This way, you can concentrate on the message while our designers take care of providing you with the right template for the situation.

Streamlining Brand Portfolio Technique Coca Cola Brand Portfolio Strategy Three Tier Brand System Summary PDF
This slide covers the 3 tier brand system of coca cola, which includes categories of brands based on scale and time, such as explorer, challenger, leader, etc. Are you in need of a template that can accommodate all of your creative concepts This one is crafted professionally and can be altered to fit any style. Use it with Google Slides or PowerPoint. Include striking photographs, symbols, depictions, and other visuals. Fill, move around, or remove text boxes as desired. Test out color palettes and font mixtures. Edit and save your work, or work with colleagues. Download Streamlining Brand Portfolio Technique Coca Cola Brand Portfolio Strategy Three Tier Brand System Summary PDF and observe how to make your presentation outstanding. Give an impeccable presentation to your group and make your presentation unforgettable.
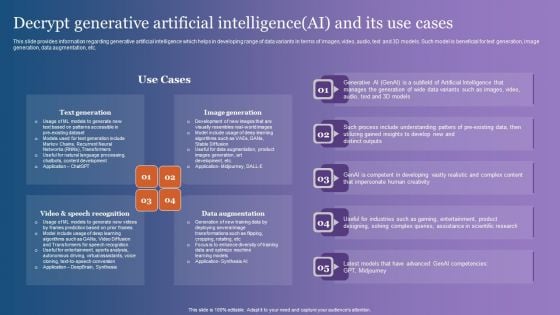
Decrypt Generative Artificial Intelligenceai And Its Use Cases Rules PDF
This slide provides information regarding generative artificial intelligence which helps in developing range of data variants in terms of images, video, audio, text and 3D models. Such model is beneficial for text generation, image generation, data augmentation, etc. .Take your projects to the next level with our ultimate collection of Decrypt Generative Artificial Intelligenceai And Its Use Cases Rules PDF. Slidegeeks has designed a range of layouts that are perfect for representing task or activity duration, keeping track of all your deadlines at a glance. Tailor these designs to your exact needs and give them a truly corporate look with your own brand colors they will make your projects stand out from the rest
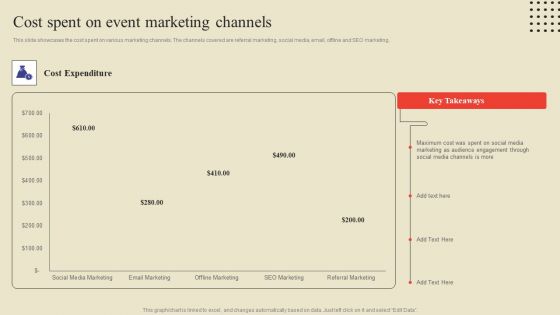
Cost Spent On Event Marketing Channels Ppt Infographic Template Design Templates PDF
This slide showcases the cost spent on various marketing channels. The channels covered are referral marketing, social media, email, offline and SEO marketing. Here you can discover an assortment of the finest PowerPoint and Google Slides templates. With these templates, you can create presentations for a variety of purposes while simultaneously providing your audience with an eye catching visual experience. Download Cost Spent On Event Marketing Channels Ppt Infographic Template Design Templates PDF to deliver an impeccable presentation. These templates will make your job of preparing presentations much quicker, yet still, maintain a high level of quality. Slidegeeks has experienced researchers who prepare these templates and write high quality content for you. Later on, you can personalize the content by editing the Cost Spent On Event Marketing Channels Ppt Infographic Template Design Templates PDF.
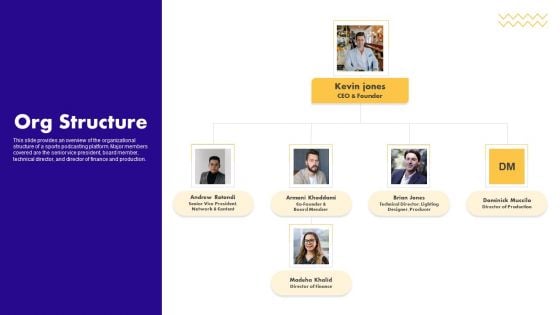
Audio Centric Firm Capital Raising Pitch Deck Org Structure Structure PDF
This slide provides an overview of the organizational structure of a sports podcasting platform. Major members covered are the senior vice president, board member, technical director, and director of finance and production. Do you have an important presentation coming up Are you looking for something that will make your presentation stand out from the rest Look no further than Audio Centric Firm Capital Raising Pitch Deck Org Structure Structure PDF. With our professional designs, you can trust that your presentation will pop and make delivering it a smooth process. And with Slidegeeks, you can trust that your presentation will be unique and memorable. So why wait Grab Audio Centric Firm Capital Raising Pitch Deck Org Structure Structure PDF today and make your presentation stand out from the rest.
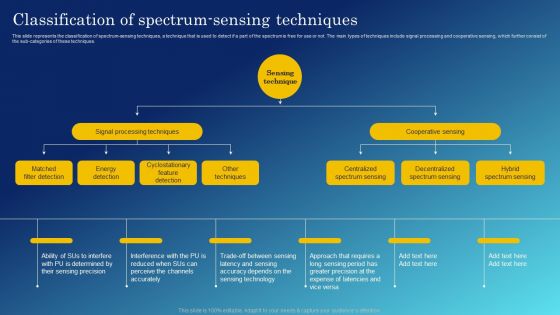
Cognitive Sensing Innovation Classification Of Spectrum Sensing Techniques Formats PDF
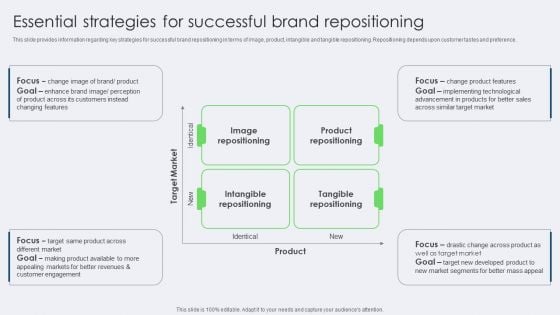
Essential Strategies For Successful Brand Repositioning Inspiration PDF
This slide provides information regarding key strategies for successful brand repositioning in terms of image, product, intangible and tangible repositioning. Repositioning depends upon customer tastes and preference. Are you in need of a template that can accommodate all of your creative concepts This one is crafted professionally and can be altered to fit any style. Use it with Google Slides or PowerPoint. Include striking photographs, symbols, depictions, and other visuals. Fill, move around, or remove text boxes as desired. Test out color palettes and font mixtures. Edit and save your work, or work with colleagues. Download Essential Strategies For Successful Brand Repositioning Inspiration PDF and observe how to make your presentation outstanding. Give an impeccable presentation to your group and make your presentation unforgettable.
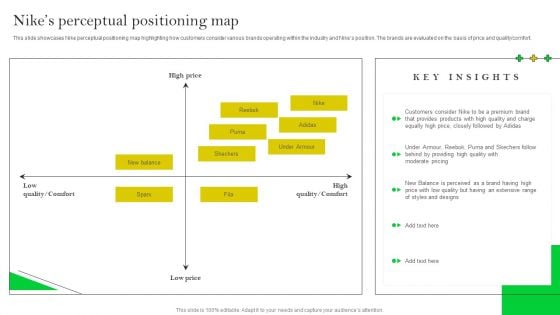
How Nike Developed And Executed Strategic Promotion Techniques Nikes Perceptual Positioning Map Pictures PDF
This slide showcases Nike perceptual positioning map highlighting how customers consider various brands operating within the industry and Nikes position. The brands are evaluated on the basis of price and quality or comfort. Do you have an important presentation coming up Are you looking for something that will make your presentation stand out from the rest Look no further than How Nike Developed And Executed Strategic Promotion Techniques Nikes Perceptual Positioning Map Pictures PDF. With our professional designs, you can trust that your presentation will pop and make delivering it a smooth process. And with Slidegeeks, you can trust that your presentation will be unique and memorable. So why wait Grab How Nike Developed And Executed Strategic Promotion Techniques Nikes Perceptual Positioning Map Pictures PDF today and make your presentation stand out from the rest.
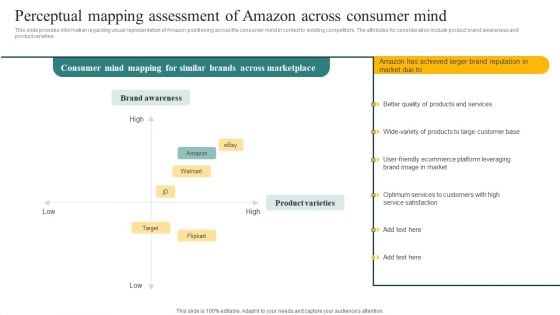
Perceptual Mapping Assessment Of Amazon Across Consumer Mind Ppt Model Summary PDF
This slide provides information regarding visual representation of Amazon positioning across the consumer mind in context to existing competitors. The attributes for consideration include product brand awareness and product varieties. Do you have an important presentation coming up Are you looking for something that will make your presentation stand out from the rest Look no further than Perceptual Mapping Assessment Of Amazon Across Consumer Mind Ppt Model Summary PDF. With our professional designs, you can trust that your presentation will pop and make delivering it a smooth process. And with Slidegeeks, you can trust that your presentation will be unique and memorable. So why wait Grab Perceptual Mapping Assessment Of Amazon Across Consumer Mind Ppt Model Summary PDF today and make your presentation stand out from the rest.
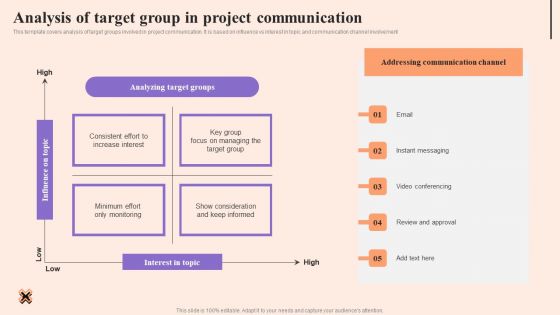
Corporate Communication Strategy Analysis Of Target Group In Project Communication Slides PDF
This template covers analysis of target groups involved in project communication. It is based on influence vs interest in topic and communication channel involvement Do you have an important presentation coming up Are you looking for something that will make your presentation stand out from the rest Look no further than Corporate Communication Strategy Analysis Of Target Group In Project Communication Slides PDF. With our professional designs, you can trust that your presentation will pop and make delivering it a smooth process. And with Slidegeeks, you can trust that your presentation will be unique and memorable. So why wait Grab Corporate Communication Strategy Analysis Of Target Group In Project Communication Slides PDF today and make your presentation stand out from the rest
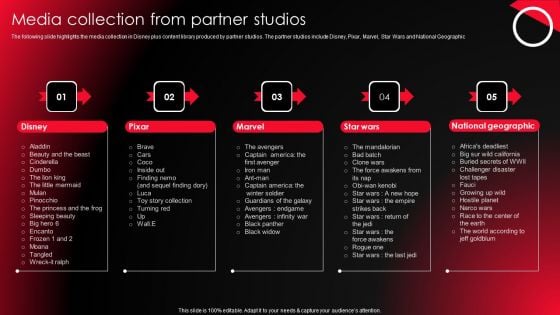
Company Profile For Online Video Service Provider Media Collection From Partner Studios Summary PDF
The following slide highlights the media collection in Disney plus content library produced by partner studios. The partner studios include Disney, Pixar, Marvel, Star Wars and National Geographic If you are looking for a format to display your unique thoughts, then the professionally designed Company Profile For Online Video Service Provider Media Collection From Partner Studios Summary PDF is the one for you. You can use it as a Google Slides template or a PowerPoint template. Incorporate impressive visuals, symbols, images, and other charts. Modify or reorganize the text boxes as you desire. Experiment with shade schemes and font pairings. Alter, share or cooperate with other people on your work. Download Company Profile For Online Video Service Provider Media Collection From Partner Studios Summary PDF and find out how to give a successful presentation. Present a perfect display to your team and make your presentation unforgettable.
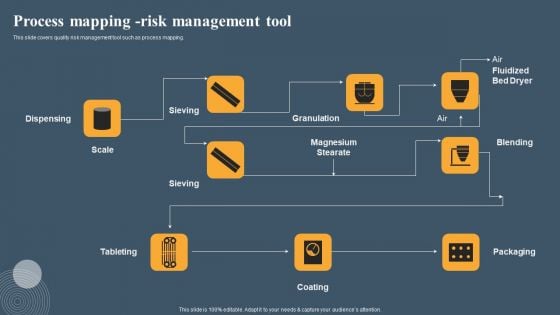
Risk Based Methodology Process Mapping Risk Management Tool Template PDF
This slide covers quality risk management tool such as process mapping. The best PPT templates are a great way to save time, energy, and resources. Slidegeeks have 100 percent editable powerpoint slides making them incredibly versatile. With these quality presentation templates, you can create a captivating and memorable presentation by combining visually appealing slides and effectively communicating your message. Download Risk Based Methodology Process Mapping Risk Management Tool Template PDF from Slidegeeks and deliver a wonderful presentation.
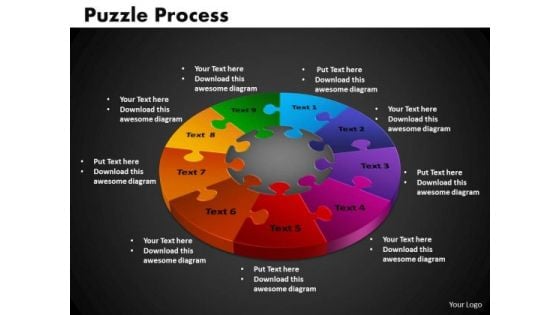
PowerPoint Process Puzzle Process Leadership Ppt Backgrounds
PowerPoint Process Puzzle Process Leadership PPT Backgrounds-It is all there in bits and pieces. Individual components well researched and understood in their place.Now youneed to get it all together to form the complete picture and reach the goal. You have the ideas and plans on how to go about it.Use this template to illustrate your method, piece by piece, and interlock the whole process in the minds of your audience-PowerPoint Process Puzzle Process Leadership PPT Backgrounds-This ppt can be used for presentations relating to-3d, Business, Circle, Circular, Clockwork, Cogs, Cogwheel, Colorful, Colors, Community, Component, Concept, Cooperate, Cooperation, Cycle, Cyclical, Different, Diverse, Diversity, Gear, Geometric, Hi-Tech, Idea, Industrial, Industry, Machine, Machinery, Mechanical, Mechanics, Round, Process, Progress Observe growth with our PowerPoint Process Puzzle Process Leadership Ppt Backgrounds. Download without worries with our money back guaranteee.
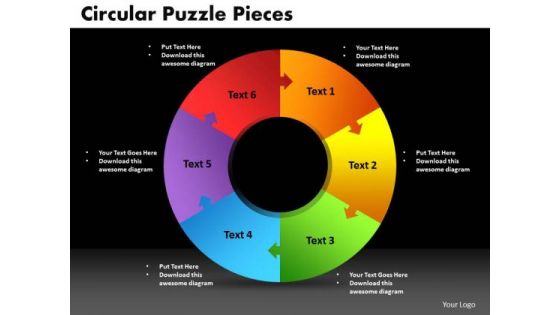
PowerPoint Slide Designs Circular Puzzle Pieces Growth Ppt Template
PowerPoint Slide Designs Circular Puzzle Pieces Growth PPT Template-It is all there in bits and pieces. Individual components well researched and understood in their place.Now youneed to get it all together to form the complete picture and reach the goal. You have the ideas and plans on how to go about it.Use this template to illustrate your method, piece by piece, and interlock the whole process in the minds of your audience-PowerPoint Slide Designs Circular Puzzle Pieces Growth PPT Template-This ppt can be used for presentations relating to-3d, Business, Circle, Circular, Clockwork, Cogs, Cogwheel, Colorful, Colors, Community, Component, Concept, Cooperate, Cooperation, Cycle, Cyclical, Different, Diverse, Diversity, Gear, Geometric, Hi-Tech, Idea, Industrial, Industry, Machine, Machinery, Mechanical, Mechanics, Round, Process, Progress Mate your views with our slides with our PowerPoint Slide Designs Circular Puzzle Pieces Growth Ppt Template. You will be at the top of your game.
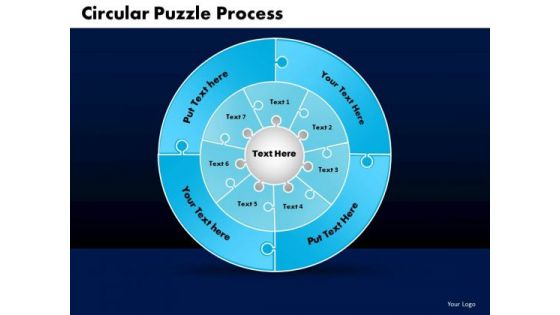
PowerPoint Template Circular Puzzle Marketing Ppt Slide Designs
PowerPoint Template Circular Puzzle Marketing PPT Slide Designs-It is all there in bits and pieces. Individual components well researched and understood in their place.Now youneed to get it all together to form the complete picture and reach the goal. You have the ideas and plans on how to go about it.Use this template to illustrate your method, piece by piece, and interlock the whole process in the minds of your audience-PowerPoint Template Circular Puzzle Marketing PPT Slide Designs-This ppt can be used for presentations relating to-3d, Business, Circle, Circular, Clockwork, Cogs, Cogwheel, Colorful, Colors, Community, Component, Concept, Cooperate, Cooperation, Cycle, Cyclical, Different, Diverse, Diversity, Gear, Geometric, Hi-Tech, Idea, Industrial, Industry, Machine, Machinery, Mechanical, Mechanics, Round, Process, Progress Facilitate growth with our PowerPoint Template Circular Puzzle Marketing Ppt Slide Designs. Download without worries with our money back guaranteee.
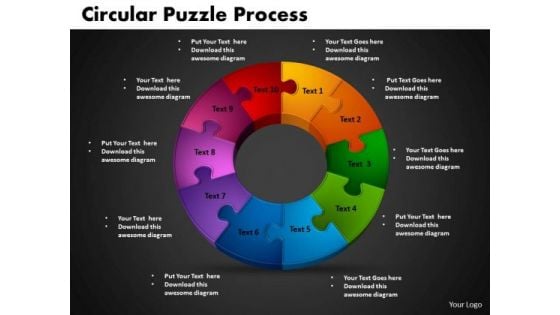
PowerPoint Templates Circular Puzzle Process Education Ppt Slides
PowerPoint Templates Circular Puzzle Process Education PPT Slides-It is all there in bits and pieces. Individual components well researched and understood in their place.Now youneed to get it all together to form the complete picture and reach the goal. You have the ideas and plans on how to go about it.Use this template to illustrate your method, piece by piece, and interlock the whole process in the minds of your audience-PowerPoint Templates Circular Puzzle Process Education PPT Slides-This ppt can be used for presentations relating to-3d, Business, Circle, Circular, Clockwork, Cogs, Cogwheel, Colorful, Colors, Community, Component, Concept, Cooperate, Cooperation, Cycle, Cyclical, Different, Diverse, Diversity, Gear, Geometric, Hi-Tech, Idea, Industrial, Industry, Machine, Machinery, Mechanical, Mechanics, Round, Process, Progress Accomplish success with our PowerPoint Templates Circular Puzzle Process Education Ppt Slides. Download without worries with our money back guaranteee.
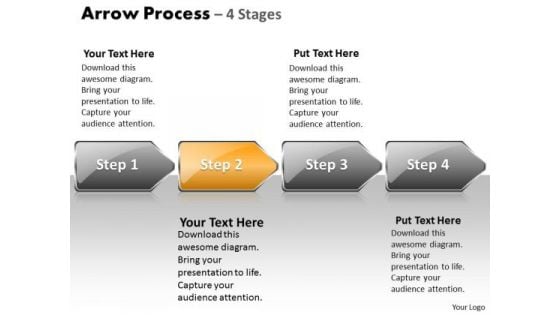
Strategy Ppt Template Arrow Process 4 Stages Style 1 Business PowerPoint 3 Design
We present our strategy PPT template arrow Process 4 stages style 1 business PowerPoint 3 design. Use our Arrows PowerPoint Templates because, At times, however, there is a crucial aspect that requires extra attention. Use our Business PowerPoint Templates because, Expound on how you plan to gain their confidence and assure them of continued and consistent excellence in quality of service. Use our Shapes PowerPoint Templates because; Show them how to churn out fresh ideas. Use our Background PowerPoint Templates because; illustrate these thoughts with this slide. Use our Finance PowerPoint Templates because, are the tools that helped most of us evolve. Use these PowerPoint slides for presentations relating to 3d, arrow, background, bullet, business, chart, checkmark, chevron, diagram, eps10, financial, five, glass, graphic, icon, illustration, isometric, management, perspective, placeholder, point, process, project, reflection, set, shadow, silver, stage, text, transparency, vector, white. The prominent colors used in the PowerPoint template are Orange, Gray, and Black Be an outperforming market competititor with our Strategy Ppt Template Arrow Process 4 Stages Style 1 Business PowerPoint 3 Design. They will make you look good.
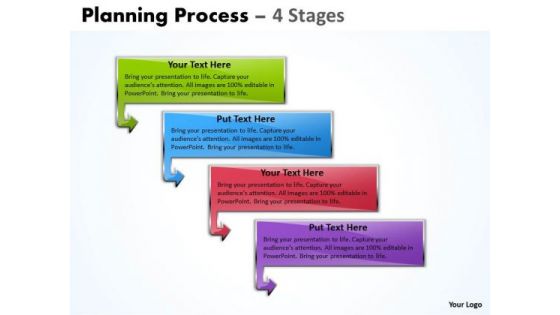
Usa Ppt Template Grouping Of 4 Process Operations Management PowerPoint 1 Design
We present our USA PPT template grouping of 4 process operations management power point 1 design. Use our Business PowerPoint Templates because; transmit your passion via our creative templates. Use our Design PowerPoint Templates because, Master them all and you have it made. Use our Arrows PowerPoint Templates because, Display your ideas and highlight their ability to accelerate the growth of your company and you. Use our Marketing PowerPoint Templates because, the pyramid is a symbol of the desire to reach the top in a steady manner. Use our Success PowerPoint Templates because, the color coding of our templates are specifically designed to highlight you points. Use these PowerPoint slides for presentations relating to abstract, action, analysis, business, chart, clipart, commerce, concept, corporate, design, diagram, goals, guidelines, icon, management, marketing, opportunity, organization, performance, plans, process, project, resource, strategy, success. The prominent colors used in the PowerPoint template are Green, Blue, and Red Increase efficiency with our Usa Ppt Template Grouping Of 4 Process Operations Management PowerPoint 1 Design. Download without worries with our money back guaranteee.
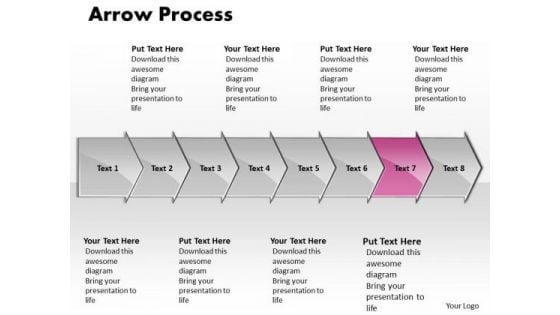
Process Ppt Arrow Change Management Representation Resources 8 Stages Design
We present our process PPT arrow change management representation resources 8 stages design. Use our Metaphor PowerPoint Templates because, illustrate your ideas and imprint them in the minds of your team with this template. Use our Symbol PowerPoint Templates because, It has inspired a whole new world of medical endeavor. Use our Arrows PowerPoint Templates because, Inspired by the indelible Olympic logo this graphic exemplifies the benefits of teamwork. Use our Business PowerPoint Templates because, A healthy is the essence of a sense of happiness. Use our Process and Flows PowerPoint Templates because; inform them of the various means they have to achieve them. Use these PowerPoint slides for presentations relating to Arrow, Background, Business, Chart, Diagram, Financial, Graphic, Gray, Icon, Illustration, Management, Orange, Perspective, Planning, Process, Process, Stages, Steps, Text. The prominent colors used in the PowerPoint template are Magenta, Gray, and Black Be a fighter with our Process Ppt Arrow Change Management Representation Resources 8 Stages Design. You will come out on top.
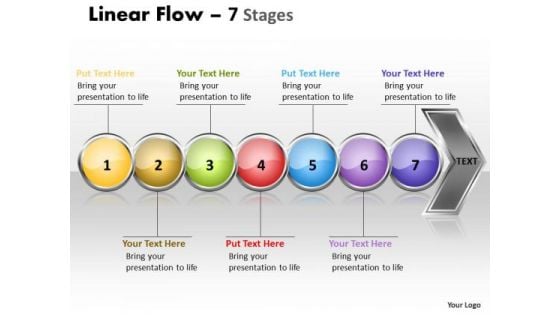
Business Ppt Background Non Linear PowerPoint Examples Demonstration Of 7 Concepts 1 Design
We present our Business PPT Background nonlinear PowerPoint examples Demonstration of 7 concepts 1 design. Use our Spheres PowerPoint Templates because; Take it up to a higher level with your thoughts. Use our Business PowerPoint Templates because, you have the plans ready for them to absorb and understand. Use our Arrows PowerPoint Templates because; demonstrate how they all combine to form the final product. Use our Symbol PowerPoint Templates because, develop your marketing strategy and communicate your enthusiasm and motivation to raise the bar. Use our Process and Flows PowerPoint Templates because, the color coding of our templates are specifically designed to highlight you points. Use these PowerPoint slides for presentations relating to Arrow, Background, Business, Chart, Diagram, Financial, Flow, Graphic, Gray, Icon, Illustration, Linear, Management, Orange, Perspective, Process, Reflection, Spheres, Stage, Text. The prominent colors used in the PowerPoint template are Purple, Blue, and Red We've helped thoudands deliver successful presentations with our Business Ppt Background Non Linear PowerPoint Examples Demonstration Of 7 Concepts 1 Design. You'll always stay ahead of the game.
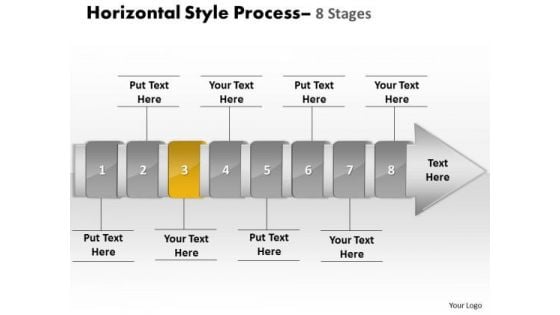
Ppt Template Linear Demonstration Of 8 Practice The PowerPoint Macro Steps Procedure 4 Design
We present our PPT template linear Demonstration of 8 practices the PowerPoint macro steps procedure 4 designs. Use our Leadership PowerPoint Templates because, have always been a source of inspiration for us all. Use our Business PowerPoint Templates because, Marketing Strategy Business Template:- Maximizing sales of your product is the intended destination. Use our Process and Flows PowerPoint Templates because, the alphabetical order is a time honored concept. Use our Arrows PowerPoint Templates because, are truly some of the wonders of our life. Use our Symbol PowerPoint Templates because, Like your thoughts arrows are inherently precise and true. Use these PowerPoint slides for presentations relating to Abstract, Arrow, Blank, Business, Chart, Circular, Circulation, Concept, Conceptual, Design, Diagram, Executive, Icon, Idea, Illustration, Linear, Stages, Management, Model, Numbers, Organization, Procedure, Process, Progression, Resource, Sequence, Sequential, Stages, Steps, Strategy. The prominent colors used in the PowerPoint template are Yellow, Gray, and White Enact plans with our Ppt Template Linear Demonstration Of 8 Practice The PowerPoint Macro Steps Procedure 4 Design. Download without worries with our money back guaranteee.
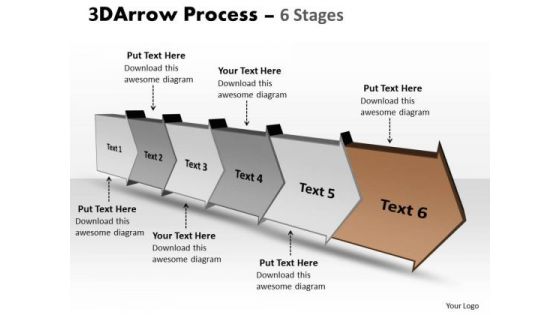
Ppt 3d Illustration Of Six Step Arrow Forging Procedure PowerPoint Slides 7 Image
We present our PPT 3d illustration of six step arrow forging procedure PowerPoint slides 7 Image. Use our Arrows PowerPoint Templates because, You have some hits, you had some misses. Use our Business PowerPoint Templates because; Draw on its universal impact to highlight the similarities with your organizational structure and plans. Use our Leadership PowerPoint Templates because, However you are aware of some pitfalls ahead where you need to be cautious not to overran and avoid a stall. Use our Symbol PowerPoint Templates because; Amplify your thoughts via our appropriate templates. Use our Process and Flows PowerPoint Templates because, It is also a time to bond with family, friends, colleagues and any other group of your choice. Use these PowerPoint slides for presentations relating to Arrow, Background, Business, Chart, Diagram, Financial, Flow, Graphic, Gray, Icon, Illustration, Linear, Management, Orange, Perspective, Process, Reflection, Spheres, Stage, Text. The prominent colors used in the PowerPoint template are Brown, Gray, Black Discerning clients can be very demanding. But even they will findour Ppt 3d Illustration Of Six Step Arrow Forging Procedure PowerPoint Slides 7 Image exceptional.
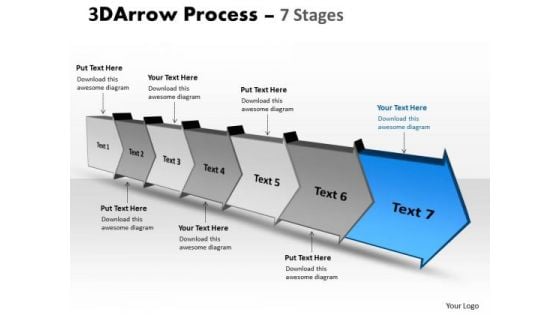
Ppt Template 3d Illustration Of Arrow Method 7 Stages Trade Strategy PowerPoint 8 Design
We present our PPT template 3d illustration of arrow method 7 stages trade strategy PowerPoint 8 design. Use our Arrows PowerPoint Templates because, Use our templates to emphasize your views. Use our Symbol PowerPoint Templates because, you have churned your mind and come up with effective ways and means to further refine it. Use our Leadership PowerPoint Templates because, you have made significant headway in this field. Use our Business PowerPoint Templates because, Marketing Strategy Business Template:- Maximizing sales of your product is the intended destination. Use our Process and Flows PowerPoint Templates because; decorate it with your well wrapped ideas and colorful thoughts. Use these PowerPoint slides for presentations relating to Arrow, Background, Business, Chart, Diagram, Financial, Graphic, Gray, Icon, Illustration, Management, Perspective, Planning, Process, Stages, Steps, Text. The prominent colors used in the PowerPoint template are Blue, Gray, and Black Our Ppt Template 3d Illustration Of Arrow Method 7 Stages Trade Strategy PowerPoint 8 Design don't delve in fiction. They believe in factual experiments.
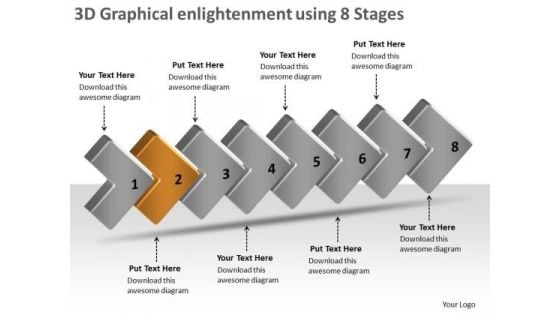
3d Graphical Enlightenment Using 8 Stages Business Tech Support PowerPoint Templates
We present our 3d graphical enlightenment using 8 stages business tech support PowerPoint templates. Use our Marketing PowerPoint Templates because, At times, however, there is a crucial aspect that requires extra attention. Use our Shapes PowerPoint Templates because, however you are aware of some pitfalls ahead where you need to be cautious not to overran and avoid a stall. Use our Business PowerPoint Templates because, Marketing Strategy Business Template:- Maximizing sales of your product is the intended destination. Use our Process and Flows PowerPoint Templates because, Amplify on your plans to have dedicated sub groups working on related but distinct tasks. Use our Arrows PowerPoint Templates because, you know your business and have a vision for it. Use these PowerPoint slides for presentations relating to 3d, arrow, background, bullet, business, chart, checkmark, chevron, diagram, drop, financial, five, glass, graphic, gray, icon, illustration, management, point, process, project, reflection, set, shadow, stage, text, transparency, vector, white. The prominent colors used in the PowerPoint template are Brown, White, and Gray Consult experts with our 3d Graphical Enlightenment Using 8 Stages Business Tech Support PowerPoint Templates. Download without worries with our money back guaranteee.
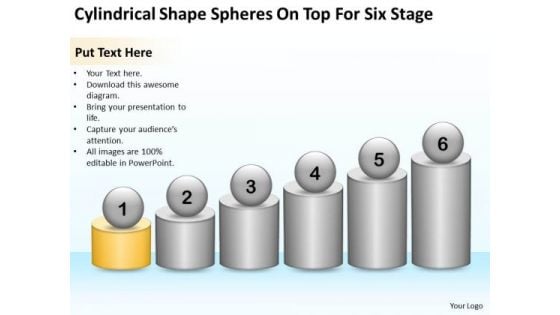
Cylindrical Shape Spheres On Top For Six Stage Ppt Linear Flow PowerPoint Slides
We present our cylindrical shape spheres on top for six stage ppt linear flow PowerPoint Slides.Download our Success PowerPoint Templates because Our PowerPoint Templates and Slides will weave a web of your great ideas. They are gauranteed to attract even the most critical of your colleagues. Download and present our Cylinders PowerPoint Templates because It will mark the footprints of your journey. Illustrate how they will lead you to your desired destination. Download our Shapes PowerPoint Templates because Our PowerPoint Templates and Slides are innately eco-friendly. Their high recall value negate the need for paper handouts. Download and present our Spheres PowerPoint Templates because Our PowerPoint Templates and Slides are effectively colour coded to prioritise your plans They automatically highlight the sequence of events you desire. Download our Leadership PowerPoint Templates because Our PowerPoint Templates and Slides will Activate the energies of your audience. Get their creative juices flowing with your words.Use these PowerPoint slides for presentations relating to 3d, abstract, advertise, advertisement, bar, business, button, chart, circle, collection, column, communication, cube, development, diagram, dice, economic, figure, finance, graph, icon, idea, illustration, infograph, infographic, internet, management, marketing, pieces, presentation, project, rising, row, set, sign, sphere, square, statistic, strategy, structure, success, symbol, system, template, vector. The prominent colors used in the PowerPoint template are Yellow, Gray, White. Our content has been profitable for millions. Join the party with our Cylindrical Shape Spheres On Top For Six Stage Ppt Linear Flow PowerPoint Slides. You'll always stay ahead of the game.
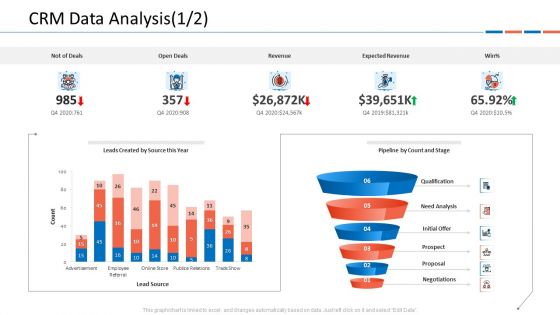
Customer Relationship Management Dashboard CRM Data Analysis Deals Ideas PDF
This graph or chart is linked to excel, and changes automatically based on data. Just left click on it and select Edit Data.Deliver and pitch your topic in the best possible manner with this customer relationship management dashboard crm data analysis deals ideas pdf. Use them to share invaluable insights on v and impress your audience. This template can be altered and modified as per your expectations. So, grab it now.
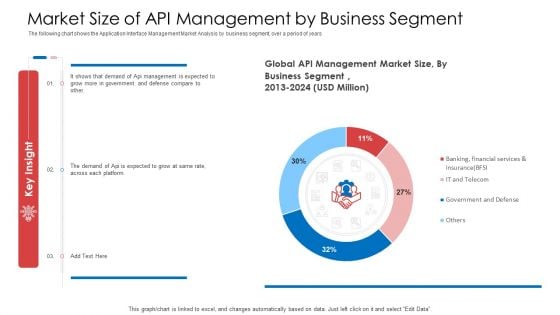
API Administration Solution Market Size Of API Management By Business Segment Sample PDF
The following chart shows the Application Interface Management Market Analysis by business segment, over a period of years. Deliver and pitch your topic in the best possible manner with this api administration solution market size of api management by business segment sample pdf. Use them to share invaluable insights on management, market, business, segment and impress your audience. This template can be altered and modified as per your expectations. So, grab it now.
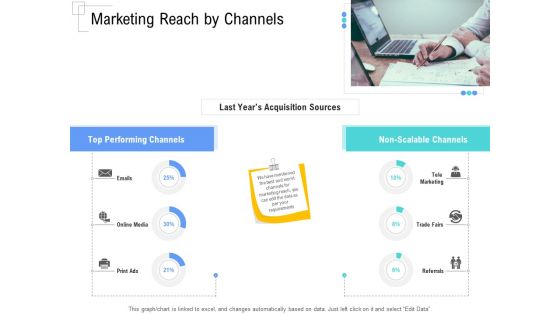
Managing Customer Experience Marketing Reach By Channels Elements PDF
This graph or chart is linked to excel, and changes automatically based on data. Just left click on it and select Edit Data.Deliver and pitch your topic in the best possible manner with this managing customer experience marketing reach by channels elements pdf. Use them to share invaluable insights on last years acquisition sources, top performing channels, non scalable channels and impress your audience. This template can be altered and modified as per your expectations. So, grab it now.

Employee Grievance Handling Process Customer Complaining About Topics PDF
This slide covers the pie chart representing the un-solved queries regarding mortgage, money transfer, bank and account service, credit reporting etc. Deliver and pitch your topic in the best possible manner with this employee grievance handling process customer complaining about topics pdf. Use them to share invaluable insights on management system, communication skills, debt collection and impress your audience. This template can be altered and modified as per your expectations. So, grab it now.
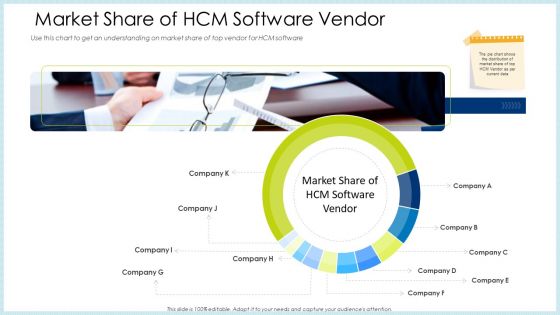
Technology Innovation Human Resource System Market Share Of HCM Software Vendor Ppt Inspiration Deck PDF
Use this chart to get an understanding on market share of top vendor for HCM software. Deliver and pitch your topic in the best possible manner with this technology innovation human resource system market share of hcm software vendor ppt inspiration deck pdf. Use them to share invaluable insights on market share of hcm software vendor and impress your audience. This template can be altered and modified as per your expectations. So, grab it now.
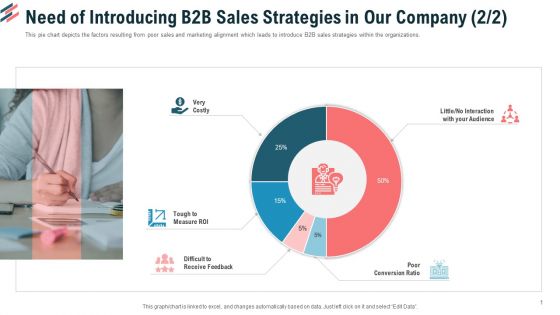
Need Of Introducing B2B Sales Strategies In Our Company Poor Ppt Model Smartart PDF
This pie chart depicts the factors resulting from poor sales and marketing alignment which leads to introduce B2B sales strategies within the organizations.Deliver and pitch your topic in the best possible manner with this need of introducing b2b sales strategies in our company poor ppt model smartart pdf. Use them to share invaluable insights on very costly, tough to measure roi, poor conversion ratio and impress your audience. This template can be altered and modified as per your expectations. So, grab it now.
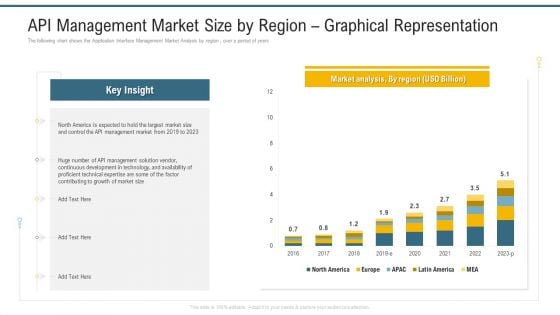
API Management Market Size By Region Graphical Representation Ppt Layouts Visuals PDF
The following chart shows the Application Interface Management Market Analysis by region , over a period of years. Deliver and pitch your topic in the best possible manner with this api management market size by region graphical representation ppt layouts visuals pdf. Use them to share invaluable insights on development in technology, growth of market size, management market and impress your audience. This template can be altered and modified as per your expectations. So, grab it now.
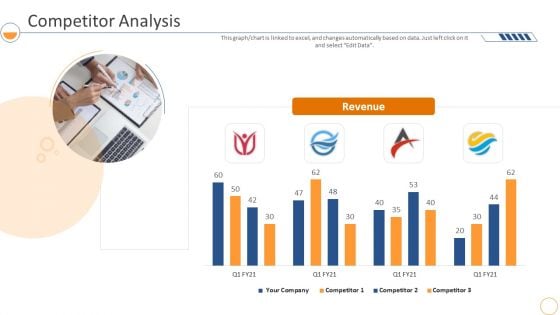
Monthly Company Performance Analysiscompetitor Analysis Pictures PDF
This graph or chart is linked to excel, and changes automatically based on data. Just left click on it and select Edit Data. Deliver and pitch your topic in the best possible manner with this monthly company performance analysiscompetitor analysis pictures pdf. Use them to share invaluable insights on revenue, competitor analysis and impress your audience. This template can be altered and modified as per your expectations. So, grab it now.
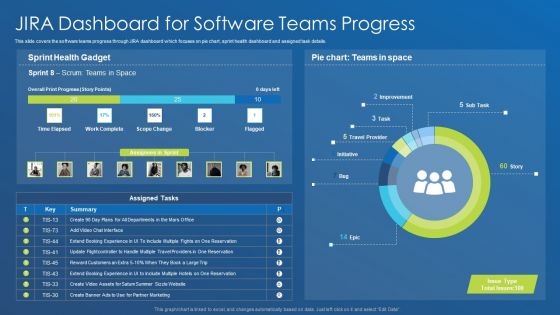
Application Development Best Practice Tools And Templates Jira Dashboard For Software Teams Progress Microsoft PDF
This slide covers the software teams progress through JIRA dashboard which focuses on pie chart, sprint health dashboard and assigned task details. Deliver and pitch your topic in the best possible manner with this application development best practice tools and templates jira dashboard for software teams progress microsoft pdf. Use them to share invaluable insights on improvement, travel provider, initiative, task and impress your audience. This template can be altered and modified as per your expectations. So, grab it now.
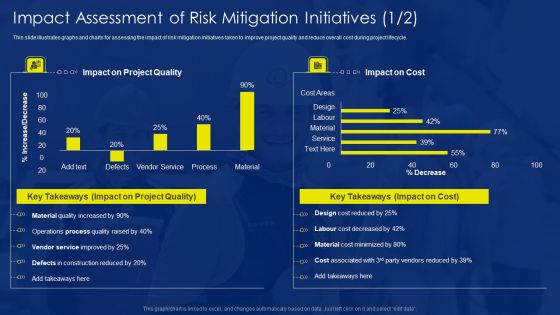
Impact Assessment Of Risk Mitigation Initiatives 2 2 Infographics PDF
This slide illustrates graphs and charts for assessing the impact of risk mitigation initiatives taken to improve project quality and reduce overall cost during project lifecycle. Deliver and pitch your topic in the best possible manner with this impact assessment of risk mitigation initiatives 2 2 infographics pdf. Use them to share invaluable insights on retention, satisfaction, engagement and impress your audience. This template can be altered and modified as per your expectations. So, grab it now.
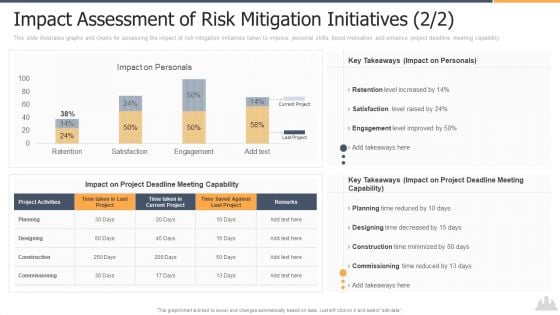
Risk Assessment Methods Real Estate Development Project Impact Assessment Mockup PDF
This slide illustrates graphs and charts for assessing the impact of risk mitigation initiatives taken to improve personal skills, boost motivation and enhance project deadline meeting capability. Deliver and pitch your topic in the best possible manner with this risk assessment methods real estate development project impact assessment mockup pdf. Use them to share invaluable insights on impact assessment of risk mitigation initiatives and impress your audience. This template can be altered and modified as per your expectations. So, grab it now.
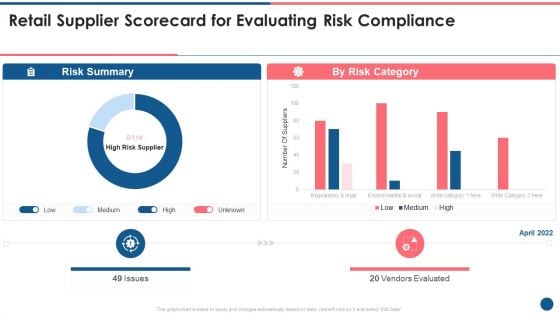
Supplier Scorecard Retail Supplier Scorecard For Evaluating Risk Compliance Clipart PDF
This graph or chart is linked to excel, and changes automatically based on data. Just left click on it and select Edit Data. Deliver and pitch your topic in the best possible manner with this supplier scorecard retail supplier scorecard for evaluating risk compliance clipart pdf. Use them to share invaluable insights on risk summary, risk category, vendors evaluated, low, medium, high and impress your audience. This template can be altered and modified as per your expectations. So, grab it now.
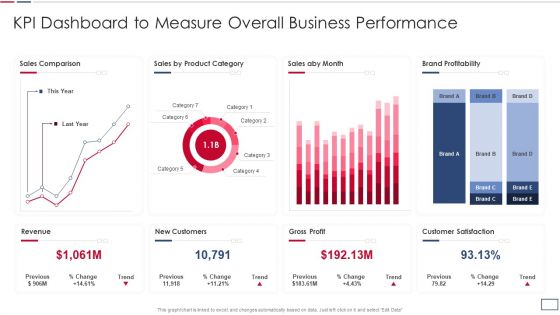
Software Developer Playbook Kpi Dashboard To Measure Overall Business Performance Topics PDF
This graph or chart is linked to excel, and changes automatically based on data. Just left click on it and select Edit Data. Deliver and pitch your topic in the best possible manner with this software developer playbook kpi dashboard to measure overall business performance topics pdf. Use them to share invaluable insights on revenue new customers, gross profit, customer satisfaction, sales comparison and impress your audience. This template can be altered and modified as per your expectations. So, grab it now.
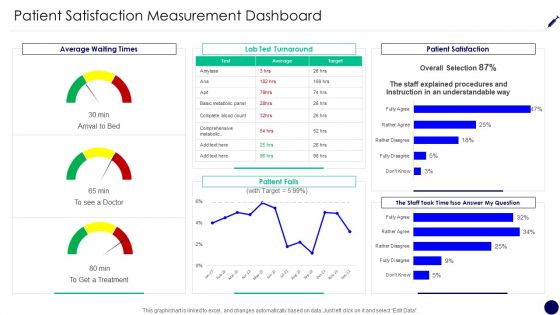
Consumer Retention Techniques Patient Satisfaction Measurement Dashboard Rules PDF
This graph or chart is linked to excel, and changes automatically based on data. Just left click on it and select Edit Data. Deliver and pitch your topic in the best possible manner with this consumer retention techniques patient satisfaction measurement dashboard rules pdf. Use them to share invaluable insights on average waiting times, lab test turnaround, patient satisfaction, patient falls and impress your audience. This template can be altered and modified as per your expectations. So, grab it now.
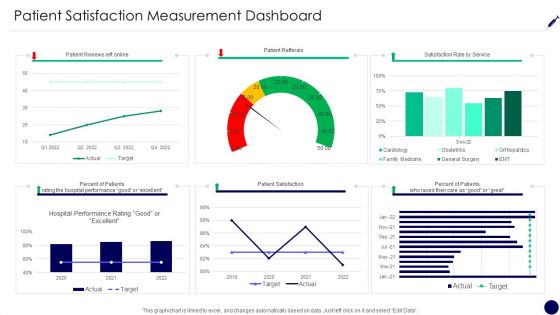
Patient Satisfaction Measurement Dashboard Consumer Retention Techniques Summary PDF
This graph or chart is linked to excel, and changes automatically based on data. Just left click on it and select Edit Data. Deliver and pitch your topic in the best possible manner with this patient satisfaction measurement dashboard consumer retention techniques summary pdf. Use them to share invaluable insights on patient reviews left online, patient refferals, satisfaction rate service, percent patients and impress your audience. This template can be altered and modified as per your expectations. So, grab it now.
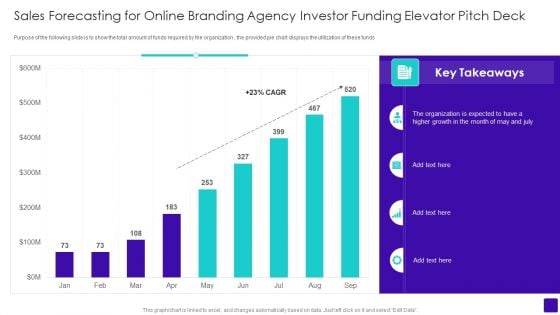
Sales Forecasting For Online Branding Agency Investor Funding Elevator Pitch Deck Rules PDF
Purpose of the following slide is to show the total amount of funds required by the organization , the provided pie chart displays the utilization of these funds. Deliver and pitch your topic in the best possible manner with this sales forecasting for online branding agency investor funding elevator pitch deck rules pdf. Use them to share invaluable insights on growth, organization and impress your audience. This template can be altered and modified as per your expectations. So, grab it now.
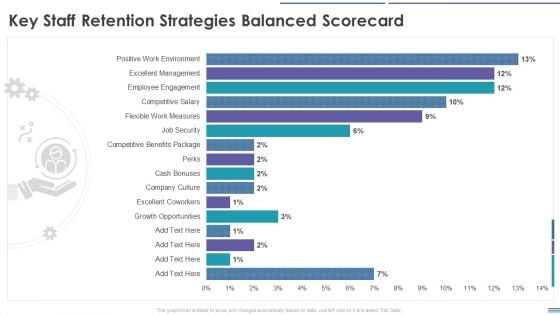
Staff Retention Balanced Scorecard Key Staff Retention Strategies Balanced Scorecard Rules PDF
This graph or chart is linked to excel, and changes automatically based on data. Just left click on it and select Edit Data. Deliver and pitch your topic in the best possible manner with this Staff Retention Balanced Scorecard Key Staff Retention Strategies Balanced Scorecard Rules PDF. Use them to share invaluable insights on Growth Opportunities, Excellent Coworkers, Company Culture, Excellent Management and impress your audience. This template can be altered and modified as per your expectations. So, grab it now.
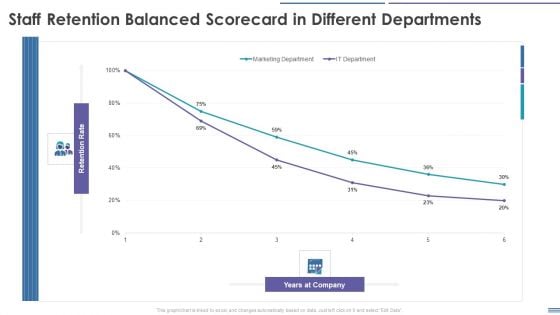
Staff Retention Balanced Scorecard Staff Retention Balanced Scorecard In Different Departments Template PDF
This graph or chart is linked to excel, and changes automatically based on data. Just left click on it and select Edit Data. Deliver and pitch your topic in the best possible manner with this Staff Retention Balanced Scorecard Staff Retention Balanced Scorecard In Different Departments Template PDF. Use them to share invaluable insights on Marketing Department, IT Department and impress your audience. This template can be altered and modified as per your expectations. So, grab it now.
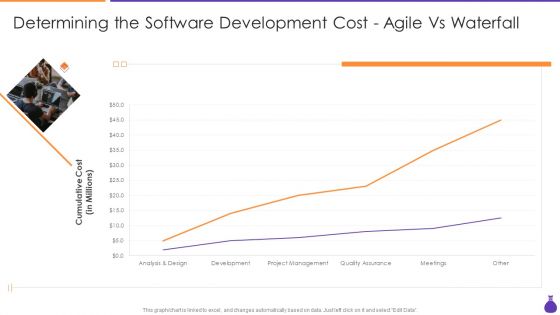
Why Is Agile Cost Effective IT Determining The Software Development Cost Agile Demonstration PDF
This graph or chart is linked to excel, and changes automatically based on data. Just left click on it and select Edit Data. Deliver and pitch your topic in the best possible manner with this Why Is Agile Cost Effective IT Determining The Software Development Cost Agile Demonstration PDF. Use them to share invaluable insights on Analysis And Design, Development, Project Management, Quality Assurance and impress your audience. This template can be altered and modified as per your expectations. So, grab it now.
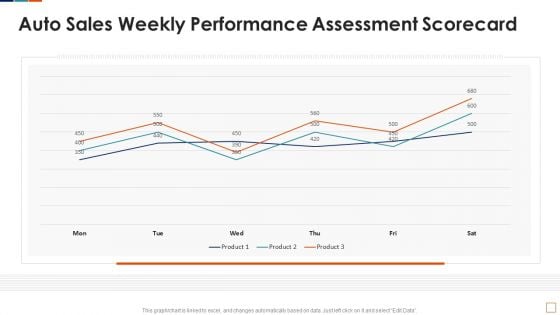
Auto Sales Weekly Performance Assessment Scorecard Background PDF
This graph or chart is linked to excel, and changes automatically based on data. Just left click on it and select Edit Data. Deliver and pitch your topic in the best possible manner with this Auto Sales Weekly Performance Assessment Scorecard Background PDF. Use them to share invaluable insights on Auto Sales Weekly, Performance Assessment Scorecard and impress your audience. This template can be altered and modified as per your expectations. So, grab it now.
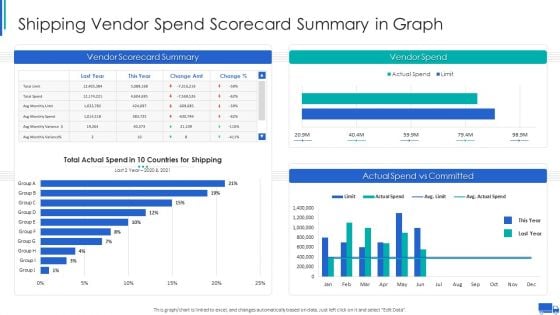
Shipping Vendor Spend Scorecard Summary In Graph Ppt Pictures Introduction PDF
This graph or chart is linked to excel, and changes automatically based on data. Just left click on it and select Edit Data. Deliver and pitch your topic in the best possible manner with this Shipping Vendor Spend Scorecard Summary In Graph Ppt Pictures Introduction PDF. Use them to share invaluable insights on Vendor Scorecard Summary, Vendor Spend Shipping, Actual Spend Vs and impress your audience. This template can be altered and modified as per your expectations. So, grab it now.
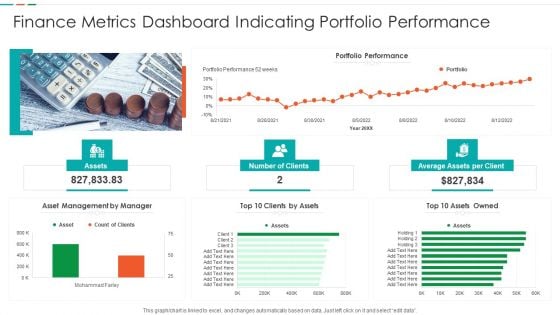
Finance Metrics Dashboard Indicating Portfolio Performance Microsoft PDF
This graph or chart is linked to excel, and changes automatically based on data. Just left click on it and select edit data. Pitch your topic with ease and precision using this Finance Metrics Dashboard Indicating Portfolio Performance Microsoft PDF. This layout presents information on Portfolio Performance Portfolio, Asset Management Manager, Top 10 Assets. It is also available for immediate download and adjustment. So, changes can be made in the color, design, graphics or any other component to create a unique layout.
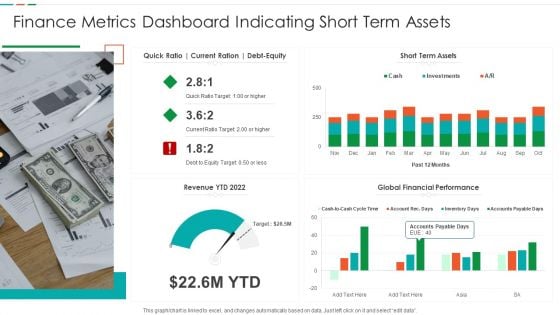
Finance Metrics Dashboard Indicating Short Term Assets Download PDF
This graph or chart is linked to excel, and changes automatically based on data. Just left click on it and select edit data. Pitch your topic with ease and precision using this Finance Metrics Dashboard Indicating Short Term Assets Download PDF. This layout presents information on Short Term Assets, Global Financial Performance, Revenue YTD 2022. It is also available for immediate download and adjustment. So, changes can be made in the color, design, graphics or any other component to create a unique layout.
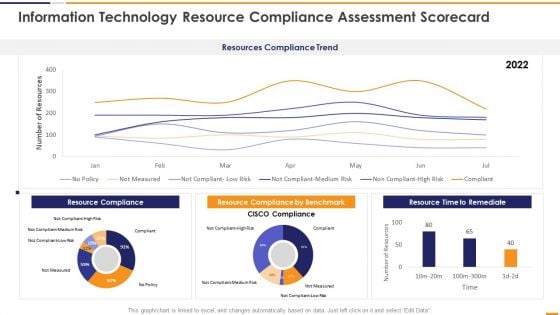
IT Security Evaluation Scorecard Information Technology Resource Compliance Background PDF
This graph or chart is linked to excel, and changes automatically based on data. Just left click on it and select Edit Data. Deliver and pitch your topic in the best possible manner with this IT Security Evaluation Scorecard Information Technology Resource Compliance Background PDF. Use them to share invaluable insights on Resources Compliance Trend, Resource Compliance 2022, Resource Compliance Benchmark, Resource Time Remediate and impress your audience. This template can be altered and modified as per your expectations. So, grab it now.
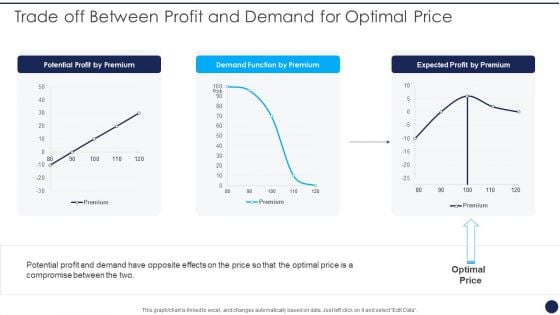
Product Pricing Strategies Analysis Trade Off Between Profit And Demand For Optimal Price Portrait PDF
This graph or chart is linked to excel, and changes automatically based on data. Just left click on it and select Edit Data. Deliver and pitch your topic in the best possible manner with this Product Pricing Strategies Analysis Trade Off Between Profit And Demand For Optimal Price Portrait PDF. Use them to share invaluable insights on Potential Profit Premium, Demand Function Premium and impress your audience. This template can be altered and modified as per your expectations. So, grab it now.
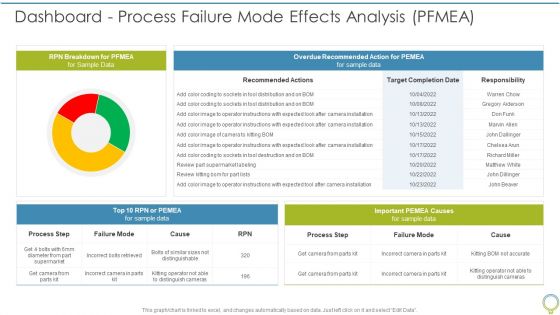
FMEA To Determine Potential Dashboard Process Failure Mode Effects Analysis PFMEA Elements PDF
This graph or chart is linked to excel, and changes automatically based on data. Just left click on it and select Edit Data. Deliver and pitch your topic in the best possible manner with this FMEA To Determine Potential Dashboard Process Failure Mode Effects Analysis PFMEA Elements PDF. Use them to share invaluable insights on RPN Breakdown, Overdue Recommended, Process Step and impress your audience. This template can be altered and modified as per your expectations. So, grab it now.
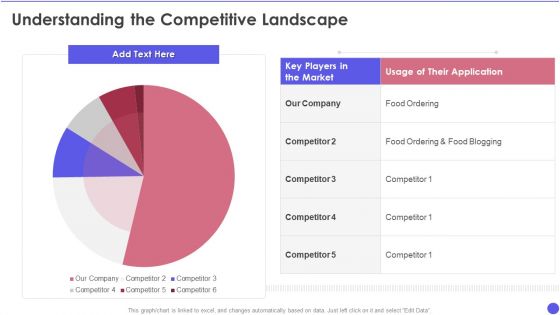
Openfin Capital Raising Understanding The Competitive Landscape Ppt Portfolio Layouts PDF
This graph or chart is linked to excel, and changes automatically based on data. Just left click on it and select Edit Data. Deliver and pitch your topic in the best possible manner with this Openfin Capital Raising Understanding The Competitive Landscape Ppt Portfolio Layouts PDF. Use them to share invaluable insights on Usage Application, Food Ordering, Food Blogging and impress your audience. This template can be altered and modified as per your expectations. So, grab it now.
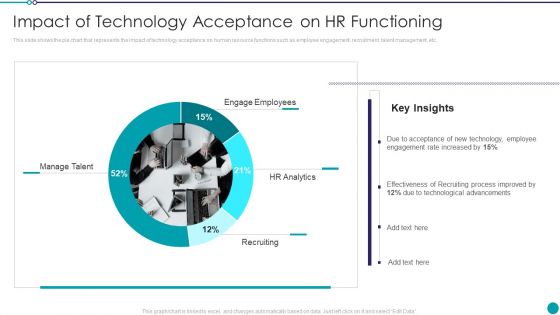
Automating Key Activities Of HR Manager Impact Of Technology Acceptance On HR Functioning Slides PDF
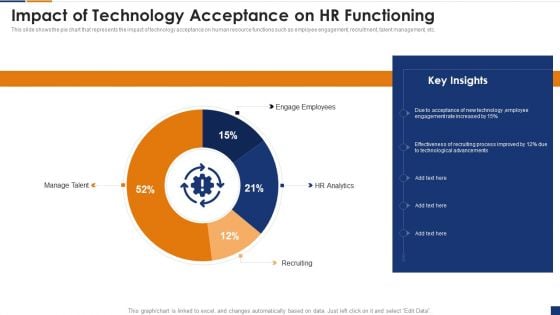
This slide shows the pie chart that represents the impact of technology acceptance on human resource functions such as employee engagement, recruitment, talent management, etc.Deliver and pitch your topic in the best possible manner with this Automating Key Activities Of HR Manager Impact Of Technology Acceptance On HR Functioning Slides PDF Use them to share invaluable insights on Acceptance Technology, Employee Engagement, Effectiveness Recruiting and impress your audience. This template can be altered and modified as per your expectations. So, grab it now.
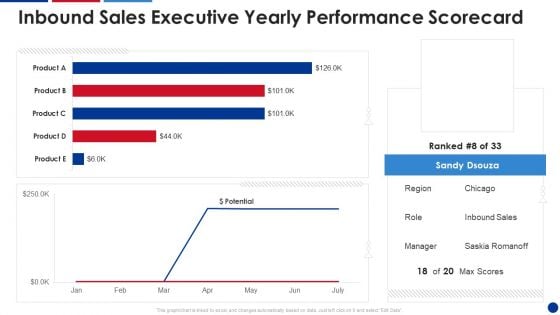
Inbound Sales Executive Yearly Performance Scorecard Information PDF
This graph or chart is linked to excel, and changes automatically based on data. Just left click on it and select Edit Data. Deliver and pitch your topic in the best possible manner with this Inbound Sales Executive Yearly Performance Scorecard Information PDF. Use them to share invaluable insights on Inbound Sales, Executive Yearly, Performance Scorecard and impress your audience. This template can be altered and modified as per your expectations. So, grab it now.
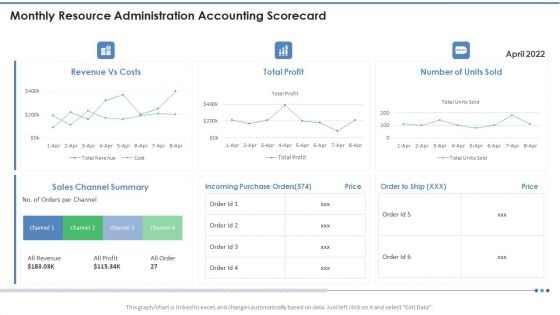
Monthly Resource Administration Accounting Scorecard Template PDF
This graph or chart is linked to excel, and changes automatically based on data. Just left click on it and select Edit Data. Deliver and pitch your topic in the best possible manner with this Monthly Resource Administration Accounting Scorecard Template PDF. Use them to share invaluable insights on Revenue Vs Costs, Total Profit, Number Units Sold and impress your audience. This template can be altered and modified as per your expectations. So, grab it now.
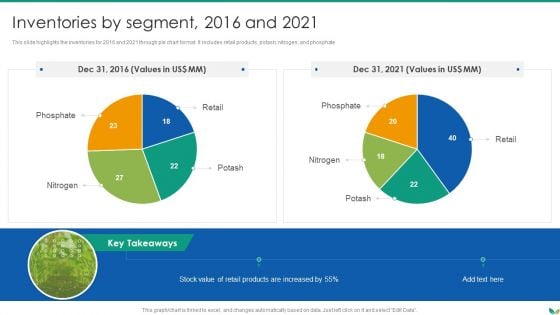
Agricultural Business Company Profile Inventories By Segment 2016 And 2021 Sample PDF
This slide highlights the inventories for 2016 and 2021 through pie chart format. It includes retail products, potash, nitrogen, and phosphate.Deliver and pitch your topic in the best possible manner with this Agricultural Business Company Profile Inventories By Segment 2016 And 2021 Sample PDF Use them to share invaluable insights on Retail Products, Phosphate, Retail and impress your audience. This template can be altered and modified as per your expectations. So, grab it now.
Human Resource Digital Transformation Impact Of Technology Acceptance On HR Download PDF
This slide shows the pie chart that represents the impact of technology acceptance on human resource functions such as employee engagement, recruitment, talent management, etc. Deliver and pitch your topic in the best possible manner with this Human Resource Digital Transformation Impact Of Technology Acceptance On HR Download PDF. Use them to share invaluable insights on Engage Employees, HR Analytics, Manage Talent and impress your audience. This template can be altered and modified as per your expectations. So, grab it now.
Strategic Human Resource Retention Management Employee Survey Results Template PDF
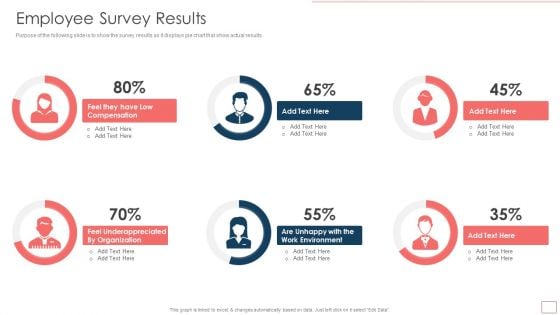
Purpose of the following slide is to show the survey results as it displays pie chart that show actual results. Deliver and pitch your topic in the best possible manner with this Strategic Human Resource Retention Management Employee Survey Results Template PDF. Use them to share invaluable insights on Compensation, Underappreciated, Work Environment and impress your audience. This template can be altered and modified as per your expectations. So, grab it now.


 Continue with Email

 Home
Home


