List With Icons
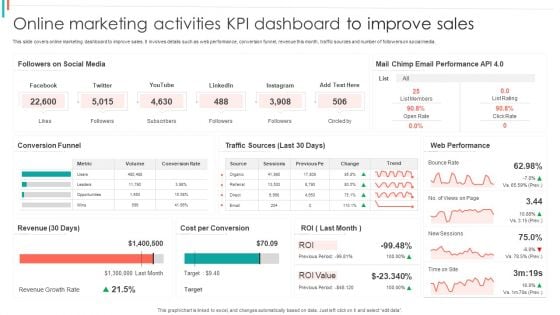
Online Marketing Activities KPI Dashboard To Improve Sales Ideas PDF
This slide covers online marketing dashboard to improve sales. It involves details such as web performance, conversion funnel, revenue this month, traffic sources and number of followers on social media.Pitch your topic with ease and precision using this Online Marketing Activities KPI Dashboard To Improve Sales Ideas PDF. This layout presents information on Email Performance, Web Performance, Cost Conversion. It is also available for immediate download and adjustment. So, changes can be made in the color, design, graphics or any other component to create a unique layout.
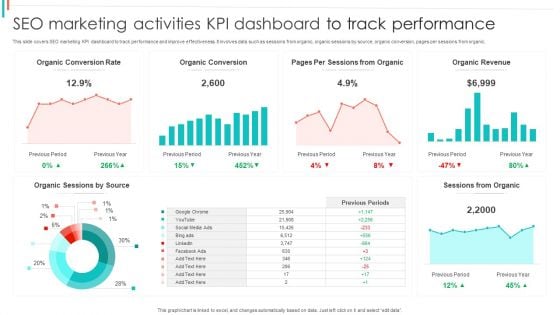
SEO Marketing Activities KPI Dashboard To Track Performance Brochure PDF
This slide covers SEO marketing KPI dashboard to track performance and improve effectiveness. It involves data such as sessions from organic, organic sessions by source, organic conversion, pages per sessions from organic.Pitch your topic with ease and precision using this SEO Marketing Activities KPI Dashboard To Track Performance Brochure PDF. This layout presents information on Organic Conversion, Sessions Organic, Organic Revenue. It is also available for immediate download and adjustment. So, changes can be made in the color, design, graphics or any other component to create a unique layout.
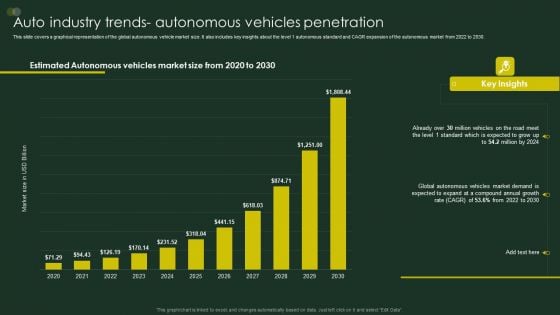
Global Automobile Sector Overview Auto Industry Trends Autonomous Vehicles Penetration Structure PDF
This slide covers a graphical representation of the global autonomous vehicle market size. It also includes key insights about the level 1 autonomous standard and CAGR expansion of the autonomous market from 2022 to 2030. Deliver and pitch your topic in the best possible manner with this Global Automobile Sector Overview Auto Industry Trends Autonomous Vehicles Penetration Structure PDF. Use them to share invaluable insights on Estimated Autonomous, Vehicles Market, Global Autonomes and impress your audience. This template can be altered and modified as per your expectations. So, grab it now.
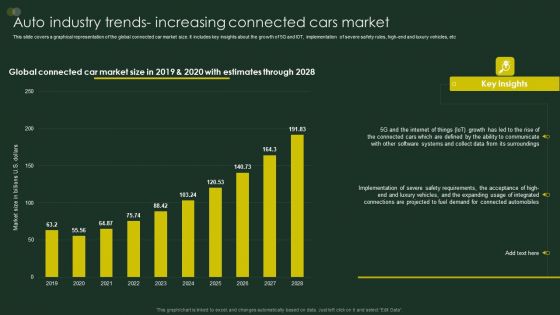
Global Automobile Sector Overview Auto Industry Trends Increasing Connected Cars Market Professional PDF
This slide covers a graphical representation of the global connected car market size. It includes key insights about the growth of 5G and IOT, implementation of severe safety rules, high-end and luxury vehicles, etc.Deliver and pitch your topic in the best possible manner with this Global Automobile Sector Overview Auto Industry Trends Increasing Connected Cars Market Professional PDF. Use them to share invaluable insights on Global Connected, Estimates Through, Demand Connected and impress your audience. This template can be altered and modified as per your expectations. So, grab it now.
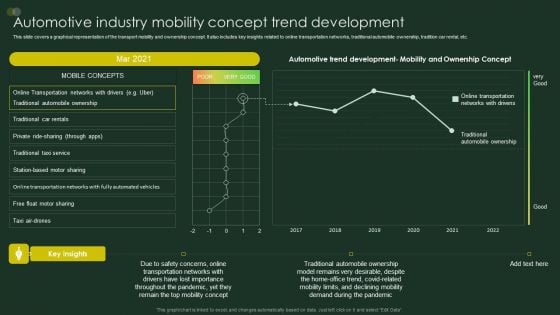
Global Automobile Sector Overview Automotive Industry Mobility Concept Trend Development Elements PDF
This slide covers a graphical representation of the transport mobility and ownership concept. It also includes key insights related to online transportation networks, traditional automobile ownership, tradition car rental, etc. Deliver and pitch your topic in the best possible manner with this Global Automobile Sector Overview Automotive Industry Mobility Concept Trend Development Elements PDF. Use them to share invaluable insights on Transportation Networks, Throughout Pandemic, Traditional Automobile and impress your audience. This template can be altered and modified as per your expectations. So, grab it now.
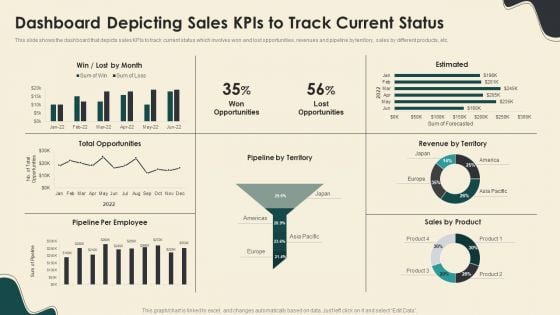
Dashboard Depicting Sales Kpis To Track Current Status Structure PDF
This slide shows the dashboard that depicts sales KPIs to track current status which involves won and lost opportunities, revenues and pipeline by territory, sales by different products, etc. Deliver and pitch your topic in the best possible manner with this Dashboard Depicting Sales Kpis To Track Current Status Structure PDF. Use them to share invaluable insights on Total Opportunities, Revenue By Territory, Sales By Product and impress your audience. This template can be altered and modified as per your expectations. So, grab it now.
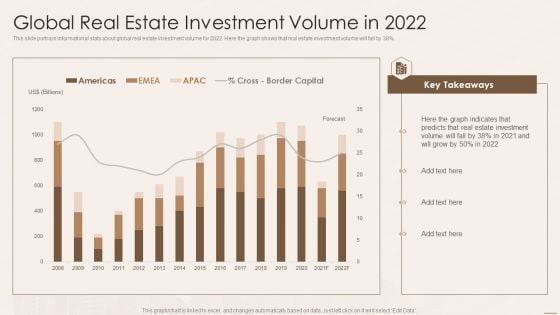
Real Estate Developers Funding Alternatives Global Real Estate Investment Volume In 2022 Brochure PDF
This slide portrays informational stats about global real estate investment volume for 2022. Here the graph shows that real estate investment volume will fall by 38 percentage. Deliver and pitch your topic in the best possible manner with this Real Estate Developers Funding Alternatives Global Real Estate Investment Volume In 2022 Brochure PDF. Use them to share invaluable insights on Real Estate Investment, Border Capital and impress your audience. This template can be altered and modified as per your expectations. So, grab it now.
Customer Relationship Management Software CRM Dashboard For Tracking Sales Pipeline Background PDF
This slide covers the CRM KPI dashboard for monitoring lead status in the sales funnel. It includes metrics such as open pipeline value, open pipeline by product package, pipeline value forecast, etc. Deliver and pitch your topic in the best possible manner with this Customer Relationship Management Software CRM Dashboard For Tracking Sales Pipeline Background PDF. Use them to share invaluable insights on Product Package, Pipeline Value, Value Forecast and impress your audience. This template can be altered and modified as per your expectations. So, grab it now.
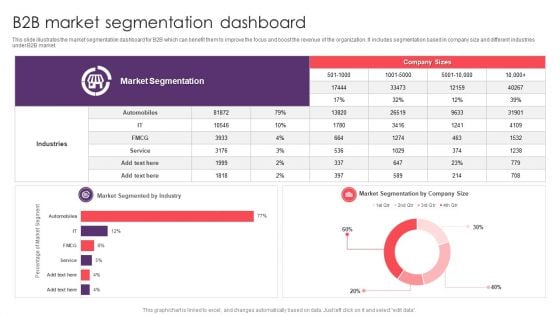
B2B Market Segmentation Dashboard Microsoft PDF
This slide illustrates the market segmentation dashboard for B2B which can benefit them to improve the focus and boost the revenue of the organization. It includes segmentation based in company size and different industries under B2B market. Pitch your topic with ease and precision using this B2B Market Segmentation Dashboard Microsoft PDF. This layout presents information on Industries, Market Segmentation, Service. It is also available for immediate download and adjustment. So, changes can be made in the color, design, graphics or any other component to create a unique layout.
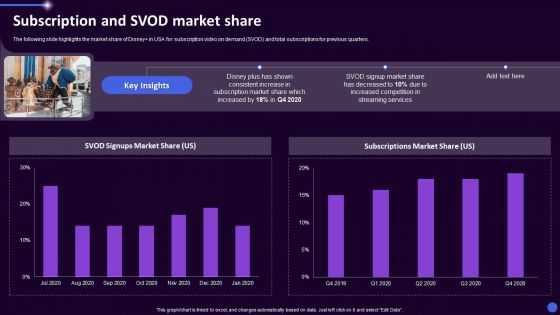
Disney Plus OTT Platform Company Summary Subscription And Svod Market Share Portrait PDF
The following slide highlights the market share of Disney in USA for subscription video on demand SVOD and total subscriptions for previous quarters. Deliver and pitch your topic in the best possible manner with this Disney Plus OTT Platform Company Summary Subscription And Svod Market Share Portrait PDF. Use them to share invaluable insights on SVOD Signups Market Share, Subscriptions Market Share, 2019 To 2022 and impress your audience. This template can be altered and modified as per your expectations. So, grab it now.
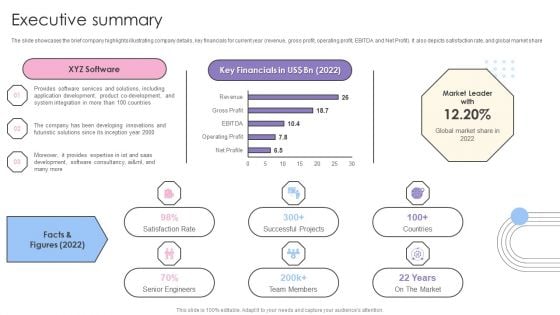
Software Products And Solutions Firm Details Executive Summary Clipart PDF
The slide showcases the brief company highlights illustrating company details, key financials for current year revenue, gross profit, operating profit, EBITDA and Net Profit. It also depicts satisfaction rate, and global market share. Deliver and pitch your topic in the best possible manner with this Software Products And Solutions Firm Details Executive Summary Clipart PDF. Use them to share invaluable insights on XYZ Software, Key Financials, Market Leader and impress your audience. This template can be altered and modified as per your expectations. So, grab it now.
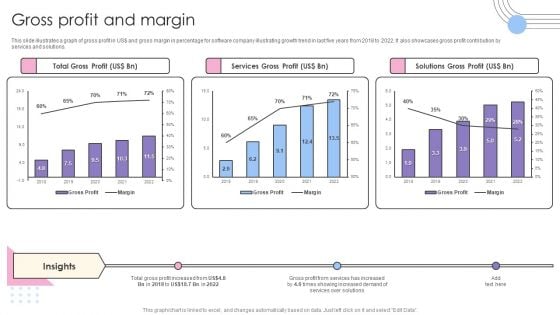
Software Products And Solutions Firm Details Gross Profit And Margin Pictures PDF
This slide illustrates a graph of gross profit in US dollar and gross margin in percentage for software company illustrating growth trend in last five years from 2018 to 2022. It also showcases gross profit contribution by services and solutions. Deliver and pitch your topic in the best possible manner with this Software Products And Solutions Firm Details Gross Profit And Margin Pictures PDF. Use them to share invaluable insights on Total Gross Profit, Services Gross Profit, Solutions Gross Profit and impress your audience. This template can be altered and modified as per your expectations. So, grab it now.
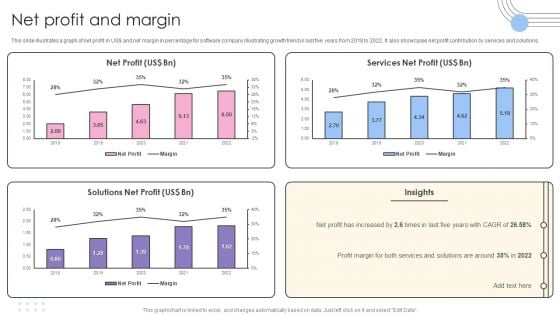
Software Products And Solutions Firm Details Net Profit And Margin Information PDF
This slide illustrates a graph of net profit in US dollar and net margin in percentage for software company illustrating growth trend in last five years from 2018 to 2022. It also showcases net profit contribution by services and solutions. Deliver and pitch your topic in the best possible manner with this Software Products And Solutions Firm Details Net Profit And Margin Information PDF. Use them to share invaluable insights on Net Profit, Services Net Profit, Solutions Net Profit and impress your audience. This template can be altered and modified as per your expectations. So, grab it now.
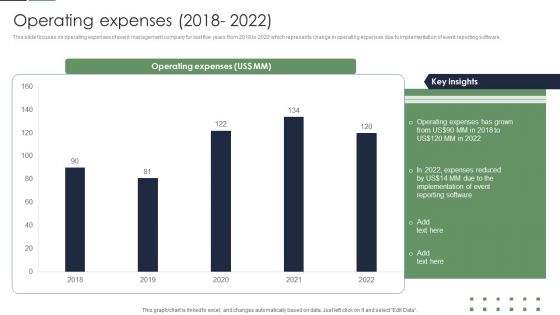
Event Planner Company Profile Operating Expenses 2018 To 2022 Professional PDF
This slide focuses on operating expenses of event management company for last five years from 2018 to 2022 which represents change in operating expenses due to implementation of event reporting software. Deliver and pitch your topic in the best possible manner with this Event Planner Company Profile Operating Expenses 2018 To 2022 Professional PDF. Use them to share invaluable insights on Operating Expenses, Implementation, Expenses Reduced and impress your audience. This template can be altered and modified as per your expectations. So, grab it now.
CRM System Implementation Stages CRM Dashboard For Tracking Sales Pipeline Background PDF
This slide covers the CRM KPI dashboard for monitoring lead status in the sales funnel. It includes metrics such as open pipeline value, open pipeline by product package, pipeline value forecast, etc. Deliver and pitch your topic in the best possible manner with this CRM System Implementation Stages CRM Dashboard For Tracking Sales Pipeline Background PDF. Use them to share invaluable insights on Pipeline Value, Value Forecast, Sales Opportunities and impress your audience. This template can be altered and modified as per your expectations. So, grab it now.
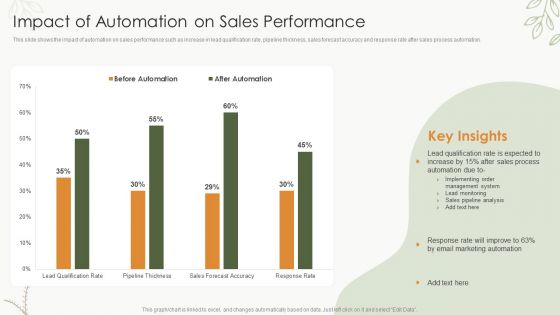
Sales Procedure Automation To Enhance Sales Impact Of Automation On Sales Performance Microsoft PDF
This slide shows the impact of automation on sales performance such as increase in lead qualification rate, pipeline thickness, sales forecast accuracy and response rate after sales process automation.Deliver and pitch your topic in the best possible manner with this Sales Procedure Automation To Enhance Sales Impact Of Automation On Sales Performance Microsoft PDF. Use them to share invaluable insights on Implementing Order, Management System, Lead Monitoring and impress your audience. This template can be altered and modified as per your expectations. So, grab it now.
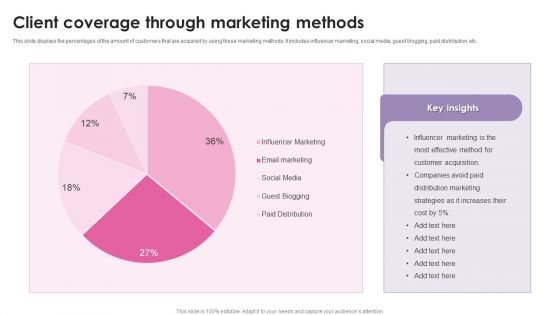
Client Coverage Through Marketing Methods Ppt Inspiration Maker PDF
This slide displays the percentages of the amount of customers that are acquired by using these marketing methods. It includes influencer marketing, social media, guest blogging, paid distribution, etc. Pitch your topic with ease and precision using this Client Coverage Through Marketing Methods Ppt Inspiration Maker PDF. This layout presents information on Influencer Marketing, Paid Distribution, Social Media. It is also available for immediate download and adjustment. So, changes can be made in the color, design, graphics or any other component to create a unique layout.
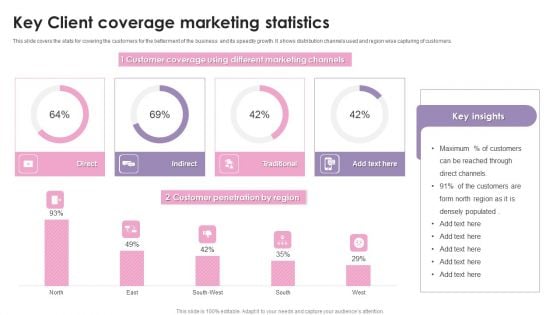
Key Client Coverage Marketing Statistics Ppt Inspiration Design Inspiration PDF
This slide covers the stats for covering the customers for the betterment of the business and its speedily growth. It shows distribution channels used and region wise capturing of customers. Pitch your topic with ease and precision using this Key Client Coverage Marketing Statistics Ppt Inspiration Design Inspiration PDF. This layout presents information on Customer Penetration, Traditional, Indirect, Direct. It is also available for immediate download and adjustment. So, changes can be made in the color, design, graphics or any other component to create a unique layout.
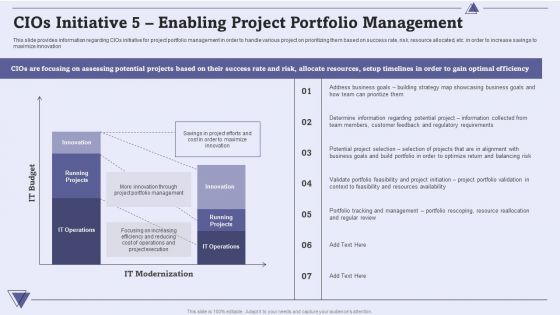
CIO For IT Cost Optimization Techniques Cios Initiative 5 Enabling Project Portfolio Management Designs PDF
This slide provides information regarding CIOs initiative for project portfolio management in order to handle various project on prioritizing them based on success rate, risk, resource allocated, etc. in order to increase savings to maximize innovation. Deliver and pitch your topic in the best possible manner with this CIO For IT Cost Optimization Techniques Cios Initiative 5 Enabling Project Portfolio Management Designs PDF. Use them to share invaluable insights on Innovation, Assessing Potential Projects, Determine Information and impress your audience. This template can be altered and modified as per your expectations. So, grab it now.
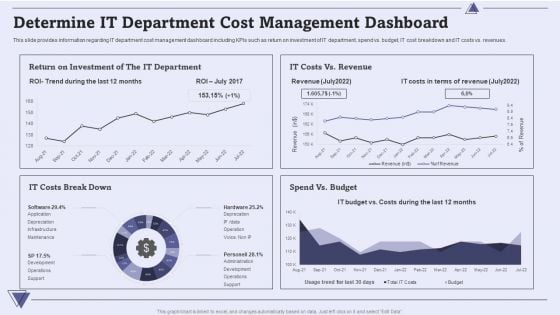
CIO For IT Cost Optimization Techniques Determine IT Department Cost Management Dashboard Introduction PDF
This slide provides information regarding IT department cost management dashboard including KPIs such as return on investment of IT department, spend vs. budget, IT cost breakdown and IT costs vs. revenues. Deliver and pitch your topic in the best possible manner with this CIO For IT Cost Optimization Techniques Determine IT Department Cost Management Dashboard Introduction PDF. Use them to share invaluable insights on Costs, Budget, Revenue and impress your audience. This template can be altered and modified as per your expectations. So, grab it now.
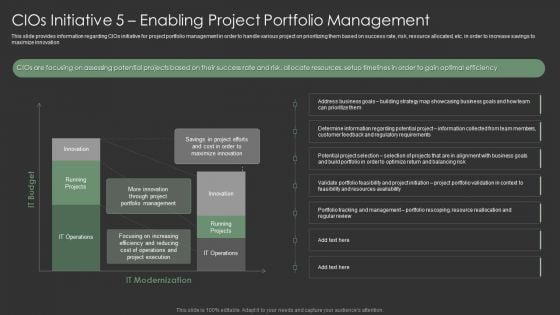
Cios Initiative 5 Enabling Project Portfolio Management Microsoft PDF
This slide provides information regarding CIOs initiative for project portfolio management in order to handle various project on prioritizing them based on success rate, risk, resource allocated, etc. in order to increase savings to maximize innovation. Deliver and pitch your topic in the best possible manner with this Cios Initiative 5 Enabling Project Portfolio Management Microsoft PDF. Use them to share invaluable insights on Maximize Innovation, Portfolio Tracking, Resources and impress your audience. This template can be altered and modified as per your expectations. So, grab it now.
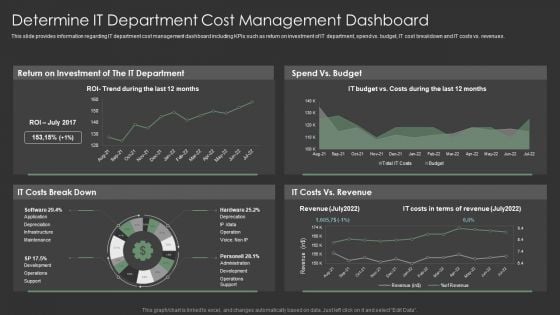
IT Spend Management Priorities By Cios Determine IT Department Cost Management Dashboard Pictures PDF
This slide provides information regarding IT department cost management dashboard including KPIs such as return on investment of IT department, spend vs. budget, IT cost breakdown and IT costs vs. revenues. Deliver and pitch your topic in the best possible manner with this IT Spend Management Priorities By Cios Determine IT Department Cost Management Dashboard Pictures PDF. Use them to share invaluable insights on Revenue, Costs, Budget and impress your audience. This template can be altered and modified as per your expectations. So, grab it now.
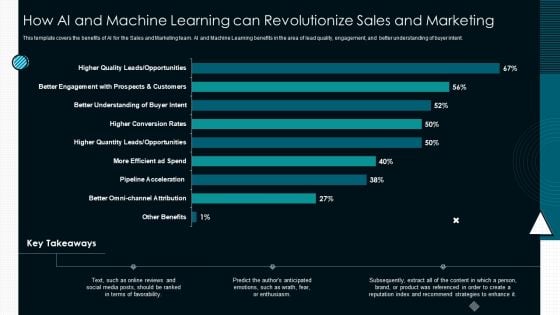
How AI And Machine Learning Can Revolutionize Sales And Marketing Download PDF
This template covers the benefits of AI for the Sales and Marketing team. AI and Machine Learning benefits in the area of lead quality, engagement, and better understanding of buyer intent.Deliver and pitch your topic in the best possible manner with this How AI And Machine Learning Can Revolutionize Sales And Marketing Download PDF. Use them to share invaluable insights on Terms Favorability, Fear Enthusiasm, Recommend Strategies and impress your audience. This template can be altered and modified as per your expectations. So, grab it now.
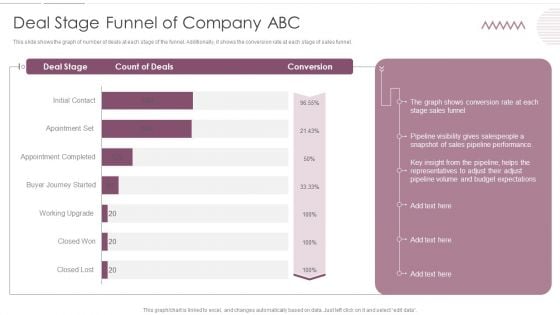
Sales Management Pipeline For Effective Lead Generation Deal Stage Funnel Of Company ABC Inspiration PDF
This slide shows the graph of number of deals at each stage of the funnel. Additionally, it shows the conversion rate at each stage of sales funnel. Deliver and pitch your topic in the best possible manner with this Sales Management Pipeline For Effective Lead Generation Deal Stage Funnel Of Company ABC Inspiration PDF. Use them to share invaluable insights on Pipeline Performance, Sales Funnel, Budget Expectations and impress your audience. This template can be altered and modified as per your expectations. So, grab it now.
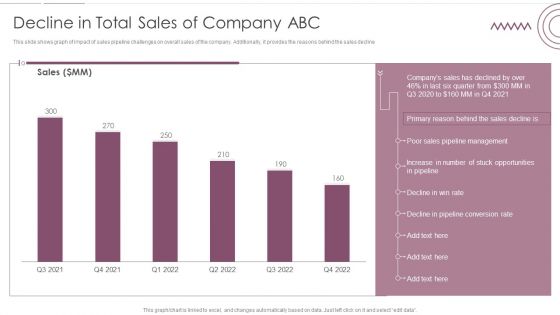
Sales Management Pipeline For Effective Lead Generation Decline In Total Sales Of Company ABC Structure PDF
This slide shows graph of impact of sales pipeline challenges on overall sales of the company. Additionally, it provides the reasons behind the sales decline. Deliver and pitch your topic in the best possible manner with this Sales Management Pipeline For Effective Lead Generation Decline In Total Sales Of Company ABC Structure PDF. Use them to share invaluable insights on Sales Pipeline Management, Opportunities, Pipeline Conversion Rate and impress your audience. This template can be altered and modified as per your expectations. So, grab it now.
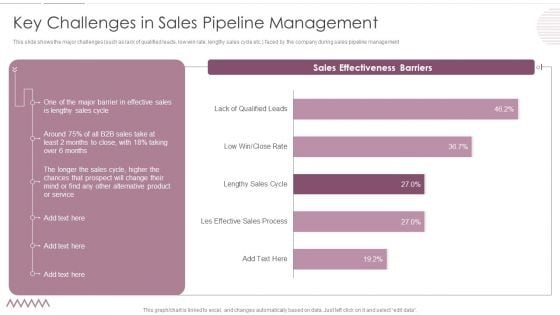
Sales Management Pipeline For Effective Lead Generation Key Challenges In Sales Pipeline Management Brochure PDF
This slide shows the major challenges such as lack of qualified leads, low win rate, lengthy sales cycle etc. faced by the company during sales pipeline management. Deliver and pitch your topic in the best possible manner with this Sales Management Pipeline For Effective Lead Generation Key Challenges In Sales Pipeline Management Brochure PDF. Use them to share invaluable insights on Sales Cycle, Product Or Service and impress your audience. This template can be altered and modified as per your expectations. So, grab it now.
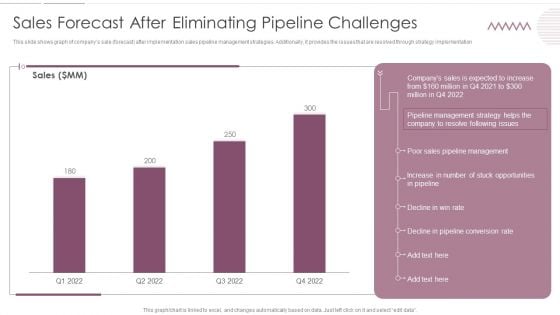
Sales Management Pipeline For Effective Lead Generation Sales Forecast After Eliminating Pipeline Challenges Inspiration PDF
This slide shows graph of companys sale forecast after implementation sales pipeline management strategies. Additionally, it provides the issues that are resolved through strategy implementation. Deliver and pitch your topic in the best possible manner with this Sales Management Pipeline For Effective Lead Generation Sales Forecast After Eliminating Pipeline Challenges Inspiration PDF. Use them to share invaluable insights on Sales Pipeline Management, Opportunities, Pipeline Conversion Rate and impress your audience. This template can be altered and modified as per your expectations. So, grab it now.
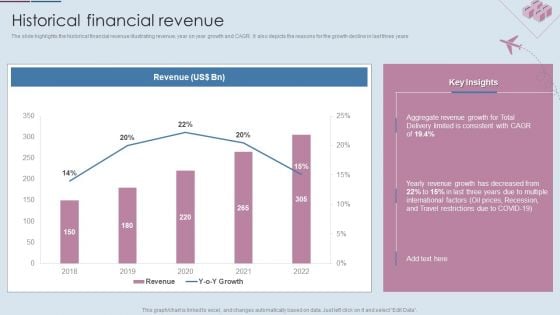
Logistics Shipment Company Profile Historical Financial Revenue Ppt Gallery Templates PDF
The slide highlights the historical financial revenue illustrating revenue, year on year growth and CAGR. It also depicts the reasons for the growth decline in last three years. Deliver and pitch your topic in the best possible manner with this Logistics Shipment Company Profile Historical Financial Revenue Ppt Gallery Templates PDF. Use them to share invaluable insights on Revenue, 2018 To 2022, Aggregate Revenue Growth and impress your audience. This template can be altered and modified as per your expectations. So, grab it now.

Logistics Shipment Company Profile Net Profit And Margin Ppt Show Model PDF
The slide showcases the net profit and margin for transport company. It depicts change in net profit and profit margin for last five financial years form 2018 to 2022. Deliver and pitch your topic in the best possible manner with this Logistics Shipment Company Profile Net Profit And Margin Ppt Show Model PDF. Use them to share invaluable insights on Net Profit, Profit Margin, 2018 To 2022 and impress your audience. This template can be altered and modified as per your expectations. So, grab it now.
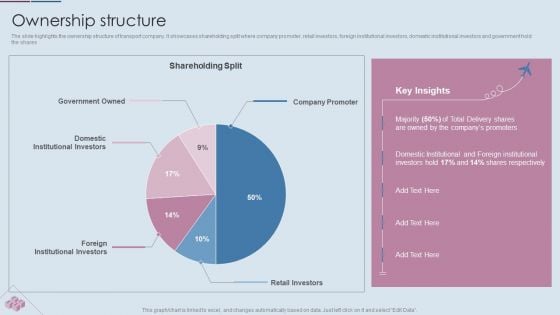
Logistics Shipment Company Profile Ownership Structure Ppt Pictures Show PDF
The slide highlights the ownership structure of transport company. It showcases shareholding split where company promoter, retail investors, foreign institutional investors, domestic institutional investors and government hold the shares. Deliver and pitch your topic in the best possible manner with this Logistics Shipment Company Profile Ownership Structure Ppt Pictures Show PDF. Use them to share invaluable insights on Shareholding Split, Company Promoter, Government Owned, Retail Investors and impress your audience. This template can be altered and modified as per your expectations. So, grab it now.
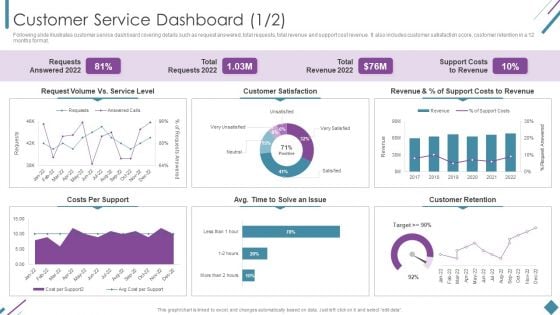
Metrics To Measure Business Performance Customer Service Dashboard Sample PDF
Following slide illustrates customer service dashboard covering details such as request answered, total requests, total revenue and support cost revenue. It also includes customer satisfaction score, customer retention in a 12 months format. Deliver and pitch your topic in the best possible manner with this Metrics To Measure Business Performance Customer Service Dashboard Sample PDF. Use them to share invaluable insights on Requests Answered 2022, Total Requests 2022, Total Revenue 2022 and impress your audience. This template can be altered and modified as per your expectations. So, grab it now.
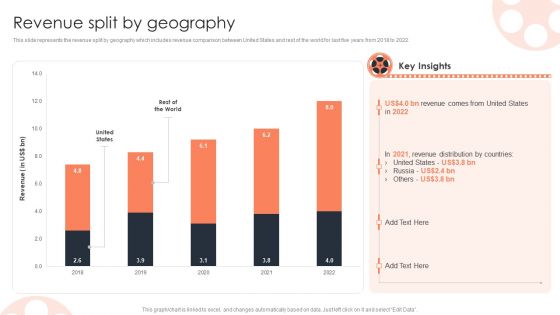
Revenue Split By Geography Film Media Company Profile Ppt PowerPoint Presentation Infographics Infographics PDF
This slide represents the financial highlights of our film production house which includes revenue and net profits for last five years from 2018 to 2022 that shows highest revenue in 2022.Deliver and pitch your topic in the best possible manner with this Revenue Split By Geography Film Media Company Profile Ppt PowerPoint Presentation Infographics Infographics PDF. Use them to share invaluable insights on United States, Revenue Distribution, Key Insights and impress your audience. This template can be altered and modified as per your expectations. So, grab it now.
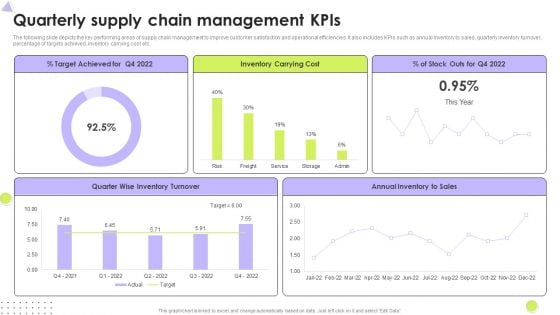
Quarterly Supply Chain Management Kpis Mockup PDF
The following slide depicts the key performing areas of supply chain management to improve customer satisfaction and operational efficiencies. It also includes KPIs such as annual inventory to sales, quarterly inventory turnover, percentage of targets achieved, inventory carrying cost etc. Pitch your topic with ease and precision using this Quarterly Supply Chain Management Kpis Mockup PDF. This layout presents information on Inventory Turnover, Inventory Carrying Cost, Target Achieved. It is also available for immediate download and adjustment. So, changes can be made in the color, design, graphics or any other component to create a unique layout.
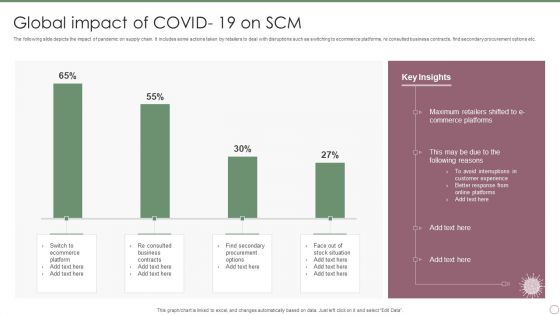
Global Impact Of COVID 19 On SCM Ppt PowerPoint Presentation File Sample PDF
The following slide depicts the impact of pandemic on supply chain. It includes some actions taken by retailers to deal with disruptions such as switching to ecommerce platforms, re consulted business contracts, find secondary procurement options etc. Showcasing this set of slides titled Global Impact Of COVID 19 On SCM Ppt PowerPoint Presentation File Sample PDF. The topics addressed in these templates are Maximum Retailers Shifted, Commerce Platforms, Customer Experience. All the content presented in this PPT design is completely editable. Download it and make adjustments in color, background, font etc. as per your unique business setting.
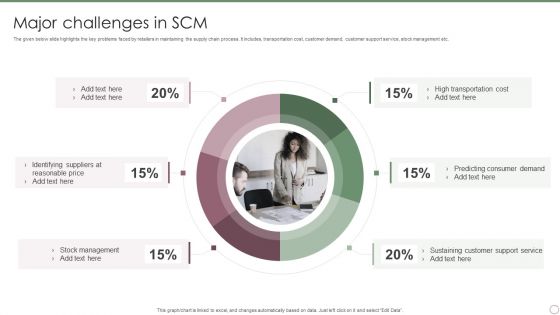
Major Challenges In SCM Ppt PowerPoint Presentation Gallery Pictures PDF
The given below slide highlights the key problems faced by retailers in maintaining the supply chain process. It includes, transportation cost, customer demand, customer support service, stock management etc. Pitch your topic with ease and precision using this Major Challenges In SCM Ppt PowerPoint Presentation Gallery Pictures PDF. This layout presents information on High Transportation Cost, Predicting Consumer Demand, Sustaining Customer, Support Service. It is also available for immediate download and adjustment. So, changes can be made in the color, design, graphics or any other component to create a unique layout.
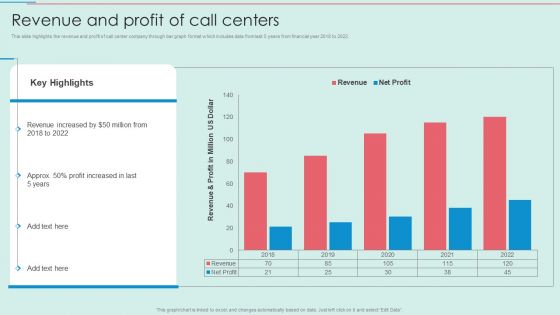
BPO Call Center Company Profile Revenue And Profit Of Call Centers Template PDF
This slide highlights the revenue and profit of call center company through bar graph format which includes data from last 5 years from financial year 2018 to 2022.Deliver and pitch your topic in the best possible manner with this BPO Call Center Company Profile Revenue And Profit Of Call Centers Template PDF. Use them to share invaluable insights on Revenue Increased, Profit Increased, Profit Million and impress your audience. This template can be altered and modified as per your expectations. So, grab it now.

Positive Impact Post Successful Implementation Of Social Media Engagement Strategy Slides PDF
This slide shows major impact post implementing social media strategy for improved engagement. It provides information about organic reach, lead generation, average share per post, new page likes and followers, etc. Deliver and pitch your topic in the best possible manner with this Positive Impact Post Successful Implementation Of Social Media Engagement Strategy Slides PDF . Use them to share invaluable insights on Average, Organic Reach, Awareness and impress your audience. This template can be altered and modified as per your expectations. So, grab it now.
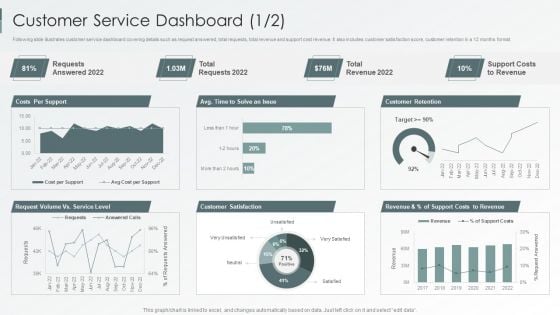
Enterprise Sustainability Performance Metrics Customer Service Dashboard Professional PDF
Following slide illustrates customer service dashboard covering details such as request answered, total requests, total revenue and support cost revenue. It also includes customer satisfaction score, customer retention in a 12 months format.Deliver and pitch your topic in the best possible manner with this Enterprise Sustainability Performance Metrics Customer Service Dashboard Professional PDF. Use them to share invaluable insights on Customer Satisfaction, Customer Retention, Support Revenue and impress your audience. This template can be altered and modified as per your expectations. So, grab it now.
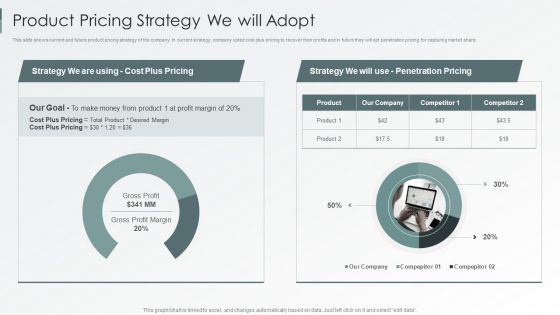
Enterprise Sustainability Performance Metrics Product Pricing Strategy We Will Adopt Brochure PDF
This slide shows current and future product pricing strategy of the company. In current strategy, company opted cost plus pricing to recover their profits and in future they will opt penetration pricing for capturing market share.Deliver and pitch your topic in the best possible manner with this Enterprise Sustainability Performance Metrics Product Pricing Strategy We Will Adopt Brochure PDF. Use them to share invaluable insights on Competitor, Desired Margin, Money Product and impress your audience. This template can be altered and modified as per your expectations. So, grab it now.
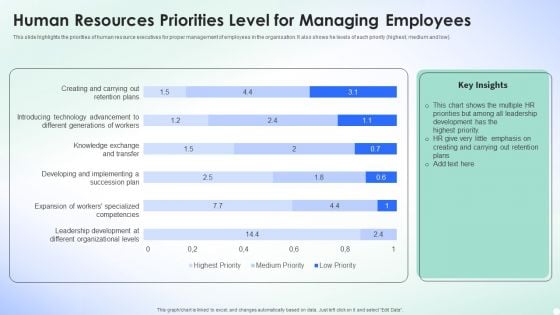
Human Resources Priorities Level For Managing Employees Template PDF
This slide highlights the priorities of human resource executives for proper management of employees in the organisation. It also shows he levels of each priority highest, medium and low. Pitch your topic with ease and precision using this Human Resources Priorities Level For Managing Employees Template PDF. This layout presents information on Leadership Development, Organizational Levels, Implementing. It is also available for immediate download and adjustment. So, changes can be made in the color, design, graphics or any other component to create a unique layout.
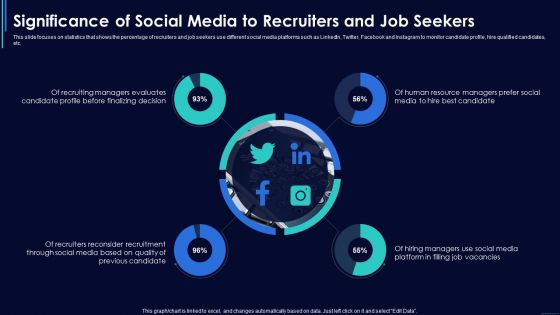
Social Media Hiring Strategic Procedure Significance Of Social Media To Recruiters And Job Seekers Designs PDF
This slide focuses on statistics that shows the percentage of recruiters and job seekers use different social media platforms such as LinkedIn, Twitter, Facebook and Instagram to monitor candidate profile, hire qualified candidates, etc. Deliver and pitch your topic in the best possible manner with this Social Media Hiring Strategic Procedure Significance Of Social Media To Recruiters And Job Seekers Designs PDF. Use them to share invaluable insights on Recruiting Managers Evaluates, Human Resource, Social Media and impress your audience. This template can be altered and modified as per your expectations. So, grab it now.
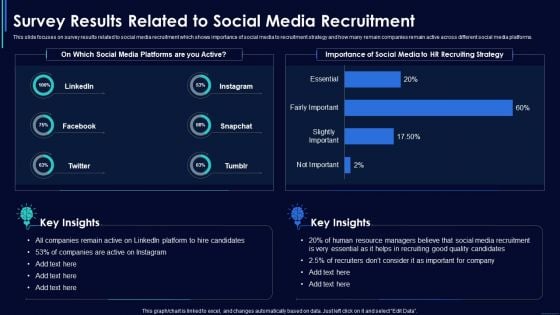
Social Media Hiring Strategic Procedure Survey Results Related To Social Media Recruitment Inspiration PDF
This slide focuses on survey results related to social media recruitment which shows importance of social media to recruitment strategy and how many remain companies remain active across different social media platforms. Deliver and pitch your topic in the best possible manner with this Social Media Hiring Strategic Procedure Survey Results Related To Social Media Recruitment Inspiration PDF. Use them to share invaluable insights on Human Resource, Social Media Recruitment, Quality Candidates and impress your audience. This template can be altered and modified as per your expectations. So, grab it now.
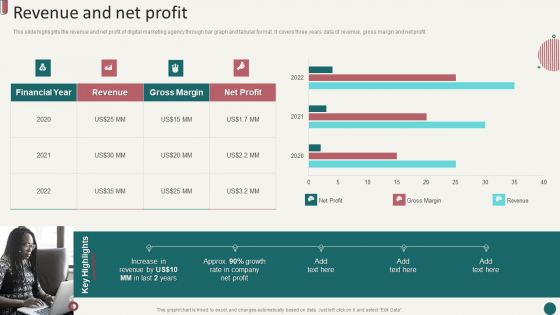
Social Media Marketing Company Profile Revenue And Net Profit Ppt Summary Gallery PDF
This slide highlights the revenue and net profit of digital marketing agency through bar graph and tabular format. It covers three years data of revenue, gross margin and net profit. Deliver and pitch your topic in the best possible manner with this Social Media Marketing Company Profile Revenue And Net Profit Ppt Summary Gallery PDF. Use them to share invaluable insights on Financial Year, Revenue, Gross Margin and impress your audience. This template can be altered and modified as per your expectations. So, grab it now.
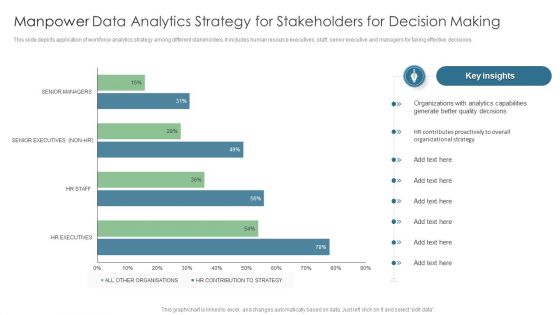
Manpower Data Analytics Strategy For Stakeholders For Decision Making Summary PDF
This slide depicts application of workforce analytics strategy among different stakeholders. It includes human resource executives, staff, senior executive and managers for taking effective decisions. Pitch your topic with ease and precision using this Manpower Data Analytics Strategy For Stakeholders For Decision Making Summary PDF. This layout presents information on Organizations, Analytics Capabilities, Generate Better Quality. It is also available for immediate download and adjustment. So, changes can be made in the color, design, graphics or any other component to create a unique layout.
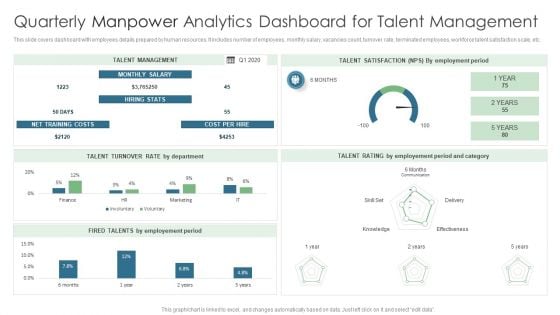
Quarterly Manpower Analytics Dashboard For Talent Management Infographics PDF
This slide covers dashboard with employees details prepared by human resources. It includes number of employees, monthly salary, vacancies count, turnover rate, terminated employees, workforce talent satisfaction scale, etc. Showcasing this set of slides titled Quarterly Manpower Analytics Dashboard For Talent Management Infographics PDF. The topics addressed in these templates are Talent Management, Cost Per Hire, Net Training Costs. All the content presented in this PPT design is completely editable. Download it and make adjustments in color, background, font etc. as per your unique business setting.
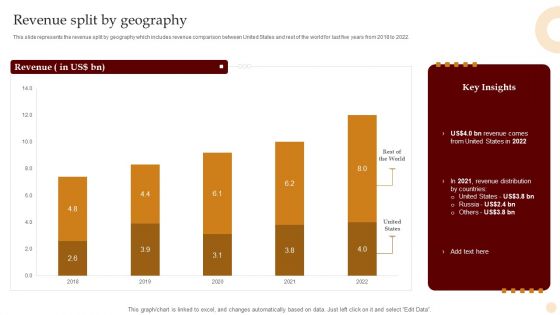
Motion Pictures Production Company Profile Revenue Split By Geography Brochure PDF
This slide represents the revenue split by geography which includes revenue comparison between United States and rest of the world for last five years from 2018 to 2022. Deliver and pitch your topic in the best possible manner with this Motion Pictures Production Company Profile Revenue Split By Geography Brochure PDF. Use them to share invaluable insights on Rest World, United States, 2018 To 2022 and impress your audience. This template can be altered and modified as per your expectations. So, grab it now.
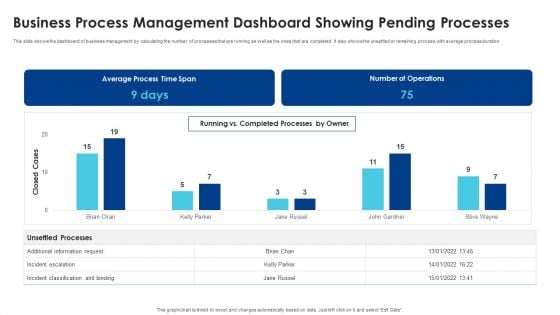
Business Process Management Dashboard Showing Pending Processes Graphics PDF
This slide shows the dashboard of business management by calculating the number of processes that are running as well as the ones that are completed. It also shows the unsettled or remaining process with average process duration. Showcasing this set of slides titled Business Process Management Dashboard Showing Pending Processes Graphics PDF. The topics addressed in these templates are Average Process, Time Span, Number Operations. All the content presented in this PPT design is completely editable. Download it and make adjustments in color, background, font etc. as per your unique business setting.
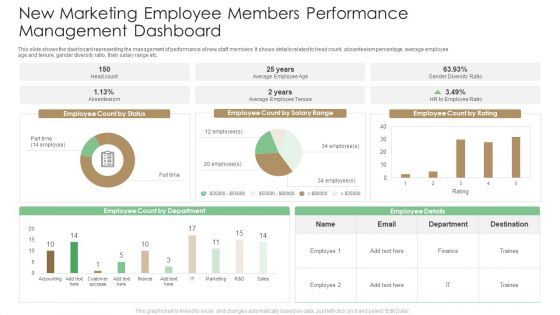
New Marketing Employee Members Performance Management Dashboard Summary PDF
This slide shows the dashboard representing the management of performance of new staff members. It shows details related to head count, absenteeism percentage, average employee age and tenure, gender diversity ratio, their salary range etc. Pitch your topic with ease and precision using this New Marketing Employee Members Performance Management Dashboard Summary PDF. This layout presents information on Employee Ratio, Average Employee Tenure. It is also available for immediate download and adjustment. So, changes can be made in the color, design, graphics or any other component to create a unique layout.
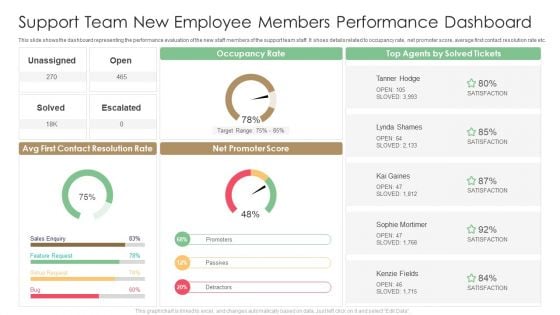
Support Team New Employee Members Performance Dashboard Designs PDF
This slide shows the dashboard representing the performance evaluation of the new staff members of the support team staff. It shoes details related to occupancy rate, net promoter score, average first contact resolution rate etc. Pitch your topic with ease and precision using this Support Team New Employee Members Performance Dashboard Designs PDF. This layout presents information on Target Range, Occupancy Rate, Contact Resolution Rate. It is also available for immediate download and adjustment. So, changes can be made in the color, design, graphics or any other component to create a unique layout.
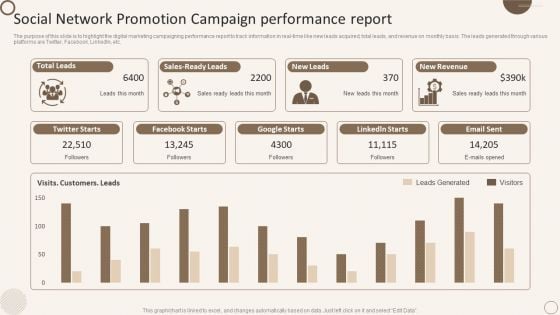
Social Network Promotion Campaign Performance Report Demonstration PDF
The purpose of this slide is to highlight the digital marketing campaigning performance report to track information in real-time like new leads acquired, total leads, and revenue on monthly basis. The leads generated through various platforms are Twitter, Facebook, LinkedIn, etc. Pitch your topic with ease and precision using this Social Network Promotion Campaign Performance Report Demonstration PDF. This layout presents information on Sales Ready Leads, New Leads, New Revenue. It is also available for immediate download and adjustment. So, changes can be made in the color, design, graphics or any other component to create a unique layout.
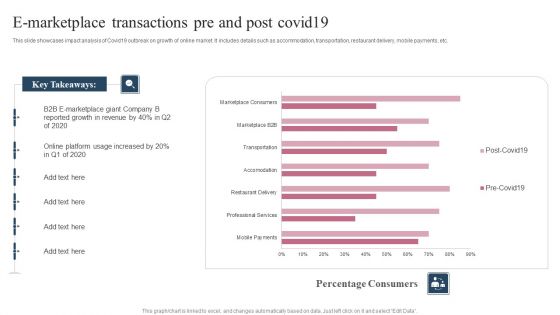
E Marketplace Transactions Pre And Post Covid19 Ppt Pictures Files PDF
This slide showcases impact analysis of Covid19 outbreak on growth of online market. It includes details such as accommodation, transportation, restaurant delivery, mobile payments, etc. Pitch your topic with ease and precision using this E Marketplace Transactions Pre And Post Covid19 Ppt Pictures Files PDF. This layout presents information on Key Takeaways, B2B E Marketplace, Online Platform. It is also available for immediate download and adjustment. So, changes can be made in the color, design, graphics or any other component to create a unique layout.
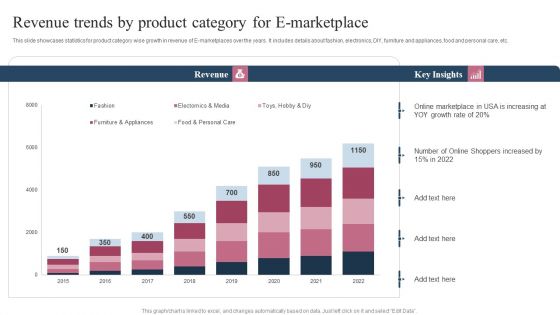
Revenue Trends By Product Category For E Marketplace Ppt Pictures Slide Portrait PDF
This slide showcases statistics for product category wise growth in revenue of E-marketplaces over the years. It includes details about fashion, electronics, DIY, furniture and appliances, food and personal care, etc. Pitch your topic with ease and precision using this Revenue Trends By Product Category For E Marketplace Ppt Pictures Slide Portrait PDF. This layout presents information on Revenue, Online Marketplace, Number Online, Shoppers Increased, 2015 To 2022. It is also available for immediate download and adjustment. So, changes can be made in the color, design, graphics or any other component to create a unique layout.
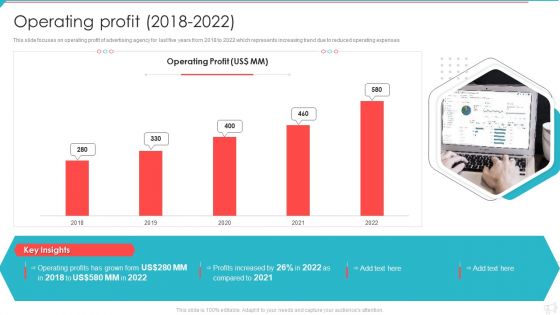
Advertisement And Marketing Agency Company Profile Operating Profit 2018 To 2022 Infographics PDF
This slide focuses on operating profit of advertising agency for last five years from 2018 to 2022 which represents increasing trend due to reduced operating expenses. Deliver and pitch your topic in the best possible manner with this Advertisement And Marketing Agency Company Profile Operating Profit 2018 To 2022 Infographics PDF. Use them to share invaluable insights on Operating Profit, Profits Increased, 2018 To 2022 and impress your audience. This template can be altered and modified as per your expectations. So, grab it now.
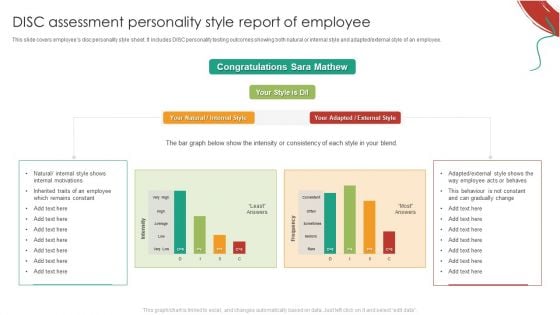
DISC Assessment Personality Style Report Of Employee Sample PDF
This slide covers employees disc personality style sheet. It includes DISC personality testing outcomes showing both natural or internal style and adapted or external style of an employee. Pitch your topic with ease and precision using this DISC Assessment Personality Style Report Of Employee Sample PDF. This layout presents information on Congratulations Sara Mathew, Internal Motivations, Remains Constant. It is also available for immediate download and adjustment. So, changes can be made in the color, design, graphics or any other component to create a unique layout.
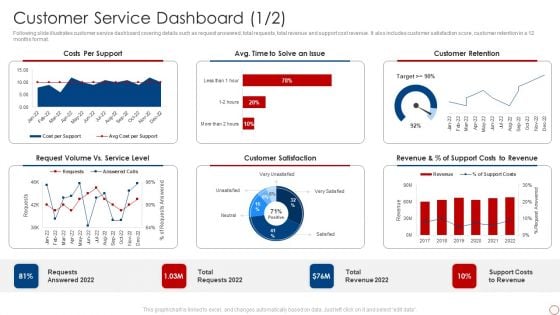
Kpis For Evaluating Business Sustainability Customer Service Dashboard Designs PDF
Following slide illustrates customer service dashboard covering details such as request answered, total requests, total revenue and support cost revenue. It also includes customer satisfaction score, customer retention in a 12 months format. Deliver and pitch your topic in the best possible manner with this Kpis For Evaluating Business Sustainability Customer Service Dashboard Designs PDF. Use them to share invaluable insights on Costs Per Support, Customer Retention, Customer Satisfaction and impress your audience. This template can be altered and modified as per your expectations. So, grab it now.
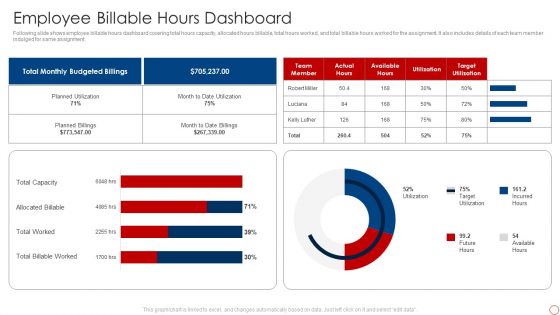
Kpis For Evaluating Business Sustainability Employee Billable Hours Dashboard Professional PDF
Following slide shows employee billable hours dashboard covering total hours capacity, allocated hours billable, total hours worked, and total billable hours worked for the assignment. It also includes details of each team member indulged for same assignment. Deliver and pitch your topic in the best possible manner with this Kpis For Evaluating Business Sustainability Employee Billable Hours Dashboard Professional PDF. Use them to share invaluable insights on Total Billable Worked, Total Worked, Allocated Billable, Total Capacity and impress your audience. This template can be altered and modified as per your expectations. So, grab it now.
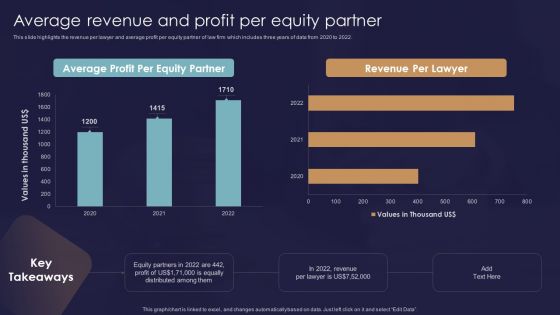
Legal And Law Assistance LLP Business Average Revenue And Profit Per Equity Brochure PDF
This slide highlights the revenue per lawyer and average profit per equity partner of law firm which includes three years of data from 2020 to 2022. Deliver and pitch your topic in the best possible manner with this Legal And Law Assistance LLP Business Average Revenue And Profit Per Equity Brochure PDF. Use them to share invaluable insights on Average Profit, Per Equity Partner, Revenue Per Lawyer and impress your audience. This template can be altered and modified as per your expectations. So, grab it now.
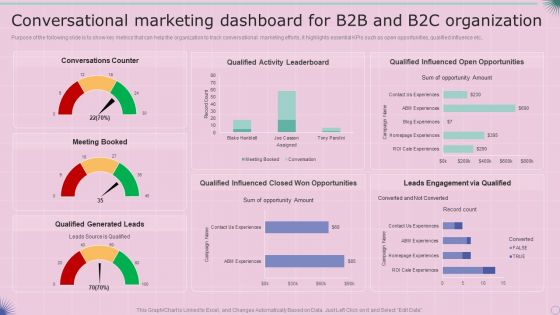
Conversational Marketing Dashboard For B2B And B2C Organization Sample PDF
Purpose of the following slide is to show key metrics that can help the organization to track conversational marketing efforts, it highlights essential KPIs such as open opportunities, qualified influence etc. Deliver and pitch your topic in the best possible manner with this Conversational Marketing Dashboard For B2B And B2C Organization Sample PDF. Use them to share invaluable insights on Conversational Marketing Dashboard, B2c Organization and impress your audience. This template can be altered and modified as per your expectations. So, grab it now.
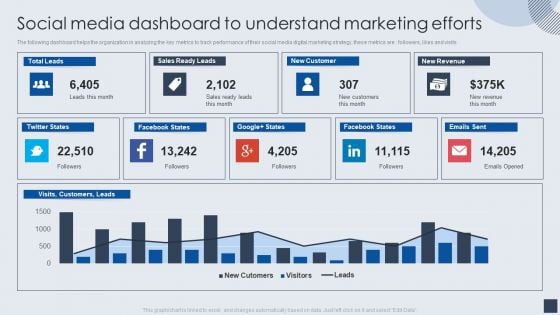
Implementing Marketing Mix Strategy To Enhance Overall Performance Social Media Dashboard To Understand Marketing Efforts Guidelines PDF
The following dashboard helps the organization in analyzing the key metrics to track performance of their social media digital marketing strategy, these metrics are followers, likes and visits. Deliver and pitch your topic in the best possible manner with this Implementing Marketing Mix Strategy To Enhance Overall Performance Social Media Dashboard To Understand Marketing Efforts Guidelines PDF. Use them to share invaluable insights on Sales, New Customer, New Revenue and impress your audience. This template can be altered and modified as per your expectations. So, grab it now.
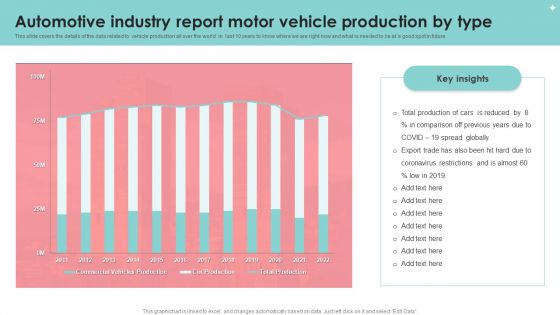
Automotive Industry Report Motor Vehicle Production By Type Portrait PDF
This slide covers the details of the data related to vehicle production all over the world in last 10 years to know where we are right now and what is needed to be at a good spot in future. Pitch your topic with ease and precision using this Automotive Industry Report Motor Vehicle Production By Type Portrait PDF. This layout presents information on Automotive Industry Report, Motor Vehicle Production. It is also available for immediate download and adjustment. So, changes can be made in the color, design, graphics or any other component to create a unique layout.


 Continue with Email

 Home
Home


