Location Icon
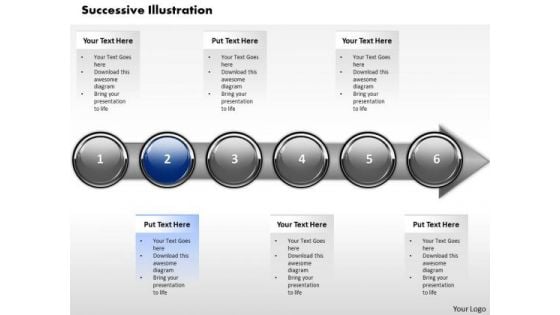
Ppt Sequential Illustration Of Financial PowerPoint Presentation Process Step 2 Templates
PPT sequential illustration of financial powerpoint presentation process step 2 Templates-This diagram helps to determine your targets and you can sequence them as per your priorities. Educate your listeners on the relevance and importance of each one as per your plan.-PPT sequential illustration of financial powerpoint presentation process step 2 Templates-Abstract, Achievement, Aim, Arrow, Background, Business, Chart, Communication, Company, Competition, Concept, Design, Development, Diagram, Direction, Finance, Financial, Forecast, Forward, Goal, Graph, Graphic, Growth, Icon, Illustration, Increase, Investment, Leader, Leadership, Marketing, Motion, Moving, Orange, Path, Price, Process, Profit, Progress, Shape, Sign, Success, Symbol, Target, Team, Teamwork, Up, Upwards Enumerate your ideas with our Ppt Sequential Illustration Of Financial PowerPoint Presentation Process Step 2 Templates. Prioritize them as per your wish.
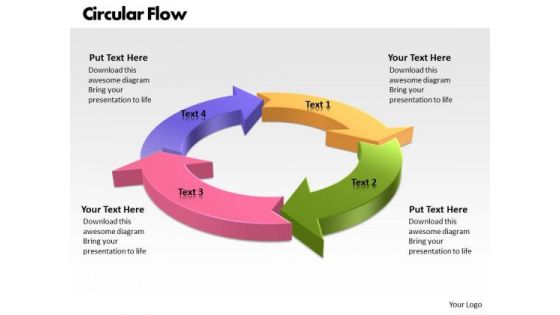
Ppt Circular Flow Free PowerPoint Template 4 State Templates
PPT circular flow free powerpoint template 4 state Templates-The above template displays a circular flow diagram is in the shape of a circle because all of the components work together and without one it would not function. Our beautiful image makes your presentations simpler showing that you care about even the smallest details.-PPT circular flow free powerpoint template 4 state Templates-Arrow, Chart, Circle, Circular, Circulation, Collection, Concept, Connection, Continuity, Cursor, Cycle, Cyclic, Diagram, Direction, Flow, Flowchart, Graph, Graphic, Group, Icon, Motion, Movement, Process, Progress, Recycle, Recycling, Refresh, Reload, Renew, Repetition, Return, Reuse, Ring, Rotation, Round, Sign, Six, Symbol Feel free to air your views. Get that allowance with our Ppt Circular Flow Free PowerPoint Template 4 State Templates.
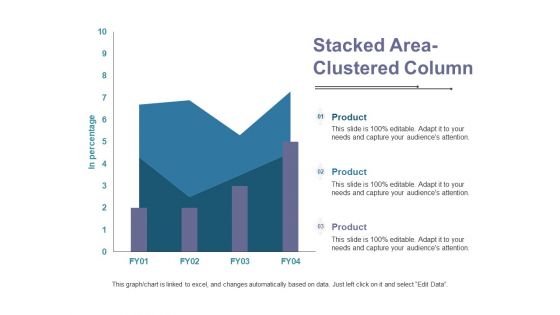
Stacked Area Clustered Column Ppt PowerPoint Presentation Outline Diagrams
This is a stacked area clustered column ppt powerpoint presentation outline diagrams. This is a three stage process. The stages in this process are product, in percentage, area chart.
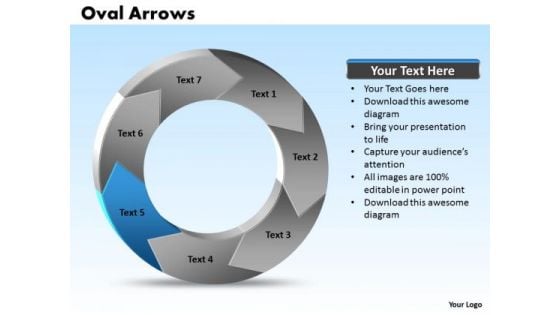
Ppt Oval Shapes Arrows PowerPoint 7 Key Points Templates
PPT oval shapes arrows powerpoint 7 key points Templates-This PowerPoint slide is a circle-chart can be used to display stages of a process. The vision of being the market leader is clear to you. Transmit your thoughts via our slide and prod your team to action-PPT oval shapes arrows powerpoint 7 key points Templates-Arrow, Background, Beautiful, Blue, Business, Button, Chart, Circle, Circular, Concept, Continous, Continuity, Continuous, Cycle, Diagram, Directional, Divisions, Graph, Icon, Illustration, Isolated, Modern, Multicolored, Presentation, Process, Profit, Progress, Recycle, Red, Research, Round, Segments, Sequence, Set, Sphere, Strategy, Success, Text, Trendy, Wheel Teach your team with our Ppt Oval Shapes Arrows PowerPoint 7 Key Points Templates. Download without worries with our money back guaranteee.
Ppt Oval Arrows Download PowerPoint Layouts 7 Points Templates
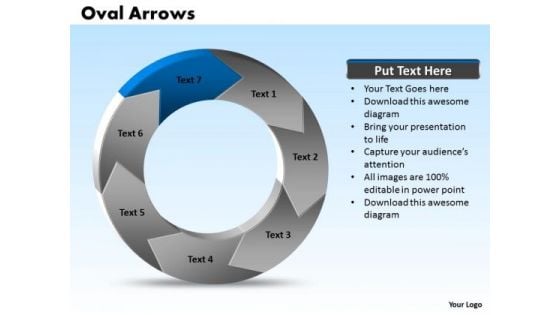
PPT oval arrows download powerpoint layouts 7 points Templates-Impress your audience with these professional and pre-designed 3D PowerPoint graphics showing various segmented in Circle shape you only have to insert your texts. Accentuate a special element of a process by inserting the respective content.-PPT oval arrows download powerpoint layouts 7 points Templates-Arrow, Background, Beautiful, Blue, Business, Button, Chart, Circle, Circular, Concept, Continous, Continuity, Continuous, Cycle, Diagram, Directional, Divisions, Graph, Icon, Illustration, Isolated, Modern, Multicolored, Presentation, Process, Profit, Progress, Recycle, Red, Research, Round, Segments, Sequence, Set, Sphere, Strategy, Success, Text, Trendy, Wheel Take on the banter with our Ppt Oval Arrows Download PowerPoint Layouts 7 Points Templates. They give you the advantage in any argument.
Market Area Analysis Regional Market Potential Growth Analysis Diagrams PDF
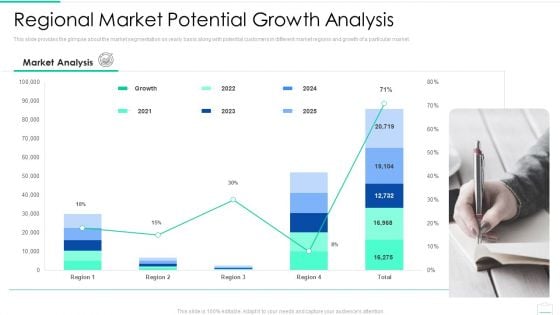
This slide provides the glimpse about the market segmentation on yearly basis along with potential customers in different market regions and growth of a particular market. Deliver and pitch your topic in the best possible manner with this market area analysis regional market potential growth analysis diagrams pdf. Use them to share invaluable insights on regional market potential growth analysis and impress your audience. This template can be altered and modified as per your expectations. So, grab it now.
Ppt Continual Flow Of Octagonal Curved Arrows PowerPoint 2010 7 Stages Templates
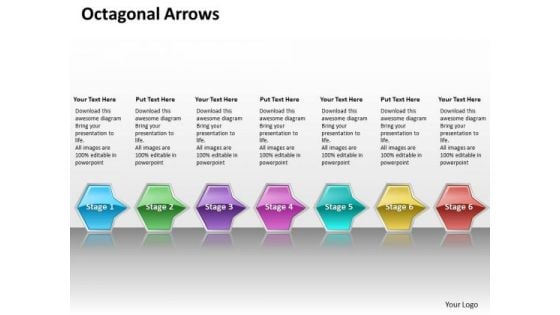
PPT continual flow of octagonal curved arrows powerpoint 2010 7 stages Templates-This PowerPoint Diagram shows you the Successive Representation of Management Procedures using octagonal arrows. It consists of seven colorful stages or approaches or factors or components.-PPT continual flow of octagonal curved arrows powerpoint 2010 7 stages Templates-Shapes, Designs, Arrows, Badge, Balloon, Bar, Blank, Blue, Bright, Bubbles, Buttons, Circle, Color, Cross, Design, Drop, Elements, Glossy, Glowing, Graphic, Hexagon, Icon, Illustration, Navigation, Octagon, Plus, Polygon, Rectangles, Round, Seals, Set, Shadow, Shiny, Sign, Speech, Squares, Stars, Stickers, Submit, Symbol Bring in your thoughts to meet our Ppt Continual Flow Of Octagonal Curved Arrows PowerPoint 2010 7 Stages Templates. Go back with a definite direction to go along.
Ppt Yellow Factor Hexagon Cause And Effect Diagram PowerPoint Template Editable Templates
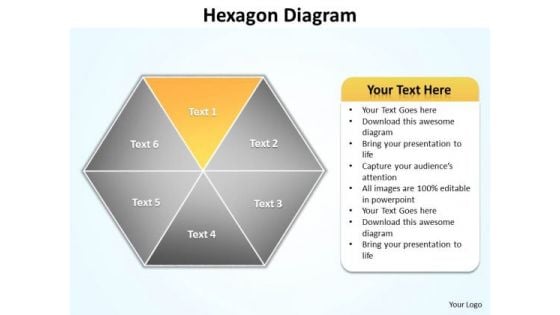
PPT yellow factor hexagon cause and effect diagram PowerPoint template editable Templates-Create visually stimulating Microsoft office PPT Presentations with our above Diagram. This image has been professionally designed to emphasize the concept of interrelated issues, Approaches or Methods. This Business Diagram can be used in Marketing, Banking, and Management etc. This Diagram explains the Yellow Component.-PPT yellow factor hexagon cause and effect diagram PowerPoint template editable Templates-attached, backgrounds, blue, cell, color, component, connect, connection, diagram, elements, geometric, graphic, group, hexagon, honeycomb, icon, illustration, intricacy, lines, link, map, mesh, model, network, science, shape, shiny, strategy, structure, symbol, teamwork, technology Watch your plans fall into place. Our Ppt Yellow Factor Hexagon Cause And Effect Diagram PowerPoint Template Editable Templates aid in completion.
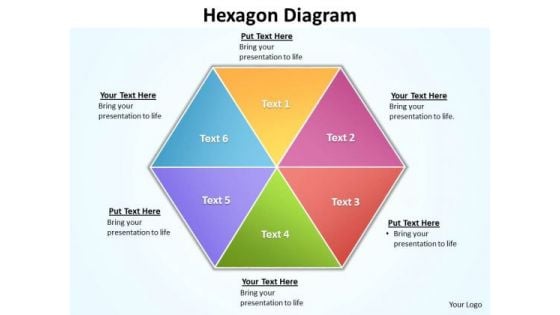
Ppt 6 Factors Hexagon Angles Free Fishbone Diagram PowerPoint Template Editable Templates
PPT 6 factors hexagon angles free fishbone diagram PowerPoint template editable Templates-Visually support your Microsoft office PPT Presentation with our above Diagram illustrating six factors combined in the form of Hexagon. This image identifies the concept of Inter-related issues to be explained together. Adjust the above image in your PPT presentations to visually support your content in your Business PPT slideshows -PPT 6 factors hexagon angles free fishbone diagram PowerPoint template editable Templates-attached, backgrounds, blue, cell, color, component, connect, connection, diagram, elements, geometric, graphic, group, hexagon, honeycomb, icon, illustration, intricacy, lines, link, map, mesh, model, network, science, shape, shiny, strategy, structure, symbol, teamwork, technology Our Ppt 6 Factors Hexagon Angles Free Fishbone Diagram PowerPoint Template Editable Templates will fetch it for you. They will bring audience adulation to your doorstep.
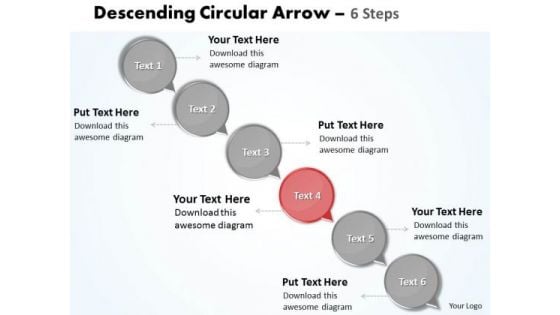
Ppt Highlight Text PowerPoint 2007 Circles Passed Down Arrow 6 Steps Business Templates
PPT highlight text powerpoint 2007 circles passed down arrow 6 steps Business Templates-The above diagram displays a Picture of a Seven colorful stages represented by circles combined to form an arrow pointing in east direction. This image Portrays the concept of Process completion with great heights and Success. You can apply other 3D Styles and shapes to the slide to enhance your presentations.-PPT highlight text powerpoint 2007 circles passed down arrow 6 steps Business Templates-Add, Aqua, Arrows, Badges, Bar, Blend, Blue, Bright, Bubbles, Buttons, Caution, Circle, Drop, Elements, Glossy, Glowing, Graphic, Heart, Help, Icons, Idea, Illustration, Navigation, Oblong, Plus, Round, Service, Shadow, Shiny, Sign, Speech, Squares Walk your team through your plans using our Ppt Highlight Text PowerPoint 2007 Circles Passed Down Arrow 6 Steps Business Templates. See them getting energized.
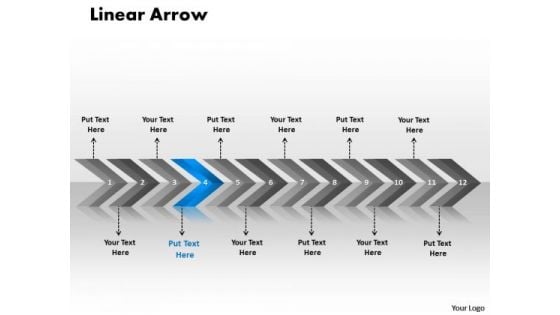
Business Ppt Linear Arrows 12 Power Point Stages Management PowerPoint 5 Image
Business PPT linear arrows 12 power point stages management powerpoint 5 Image-Use this diagram to arrange steps in such a manner that the preceding phase must be cleared before moving to next phase. Expound on better diagnostic processes for a more accurate analysis and control of the ailment to increase chances of a permanent cure.-Business PPT linear arrows 12 power point stages management powerpoint 5 Image-Aim, Angle, Arrow, Arrowheads, Badge, Banner, Connection, Curve, Design, Direction, Download, Element, Fuchsia, Icon, Illustration, Indicator, Internet, Label, Link, Magenta, Mark, Marker, Next, Object, Orange, Orientation, Pointer, Shadow, Shape, Signs Symbol Execute plans with our Business Ppt Linear Arrows 12 Power Point Stages Management PowerPoint 5 Image. Download without worries with our money back guaranteee.
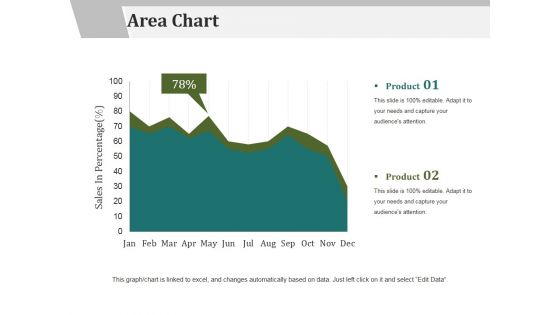
Area Chart Ppt PowerPoint Presentation Infographics Graphics Tutorials
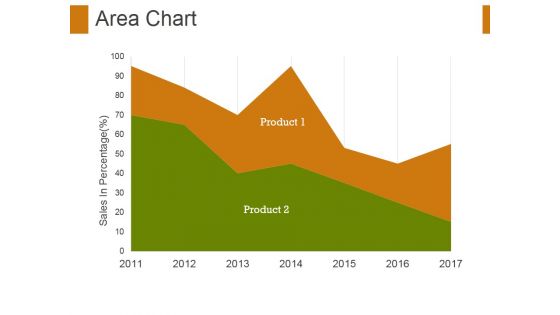
This is a area chart ppt powerpoint presentation infographics graphics tutorials. This is a two stage process. The stages in this process are product, area chart, sales in percentage.
Area Chart Ppt PowerPoint Presentation Visual Aids Example 2015
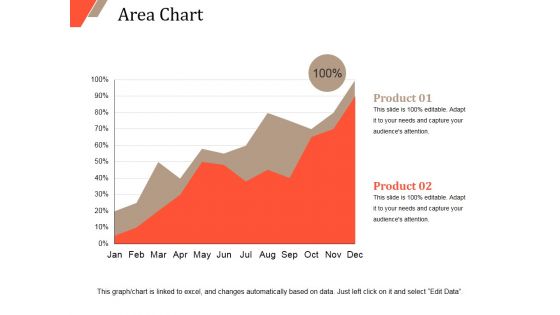
This is a area chart ppt powerpoint presentation visual aids example 2015. This is a two stage process. The stages in this process are area chart, finance, marketing, strategy, business.
Area Chart Ppt PowerPoint Presentation Inspiration Clipart Images
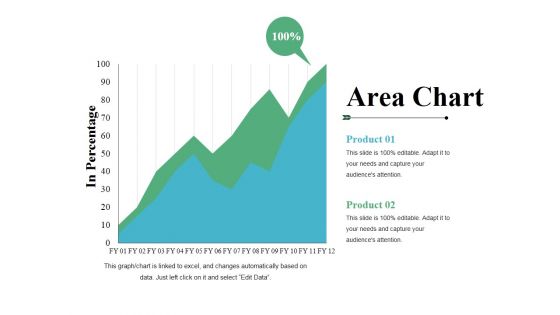
This is a area chart ppt powerpoint presentation inspiration clipart images. This is a two stage process. The stages in this process are area chart, growth, finance, business, strategy.
Area Chart Ppt PowerPoint Presentation Infographics Visual Aids
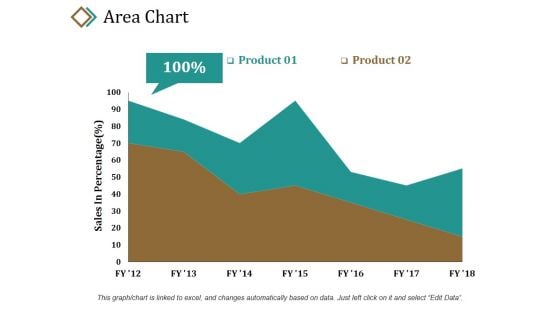
This is a area chart ppt powerpoint presentation infographics visual aids. This is a two stage process. The stages in this process are product, area chart, in percentage, growth, success.

Area Chart Ppt PowerPoint Presentation Infographic Template Layout
This is a area chart ppt powerpoint presentation infographic template layout. This is a two stage process. The stages in this process are product, profit, area chart, growth, success.
Area Chart Ppt PowerPoint Presentation Summary Example Introduction
This is a area chart ppt powerpoint presentation summary example introduction. This is a two stage process. The stages in this process are product, sales in percentage, percentage, area chart, business.
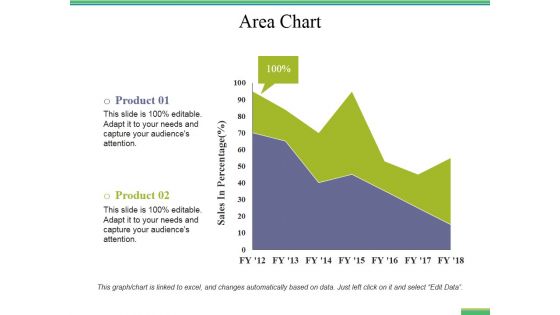
Area Chart Ppt PowerPoint Presentation Portfolio Graphics Template
This is a area chart ppt powerpoint presentation portfolio graphics template. This is a two stage process. The stages in this process are area chart, finance, analysis, business, marketing.
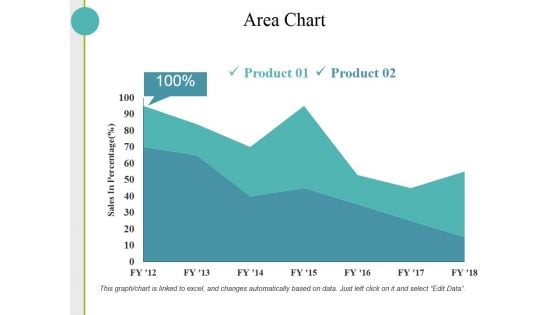
Area Chart Ppt PowerPoint Presentation Slides Visual Aids
This is a area chart ppt powerpoint presentation slides visual aids. This is a two stage process. The stages in this process are area chart, finance, marketing, strategy, business.
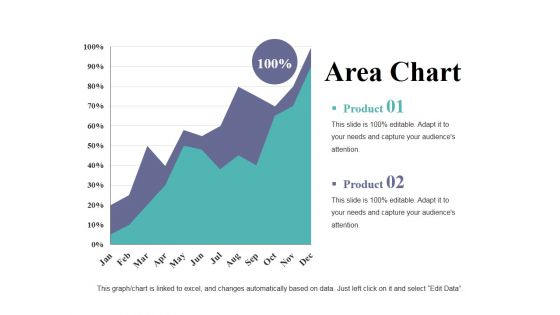
Area Chart Ppt PowerPoint Presentation Professional Graphic Images
This is a area chart ppt powerpoint presentation professional graphic images. This is a two stage process. The stages in this process are area chart, growth, strategy, business, finance, analysis.
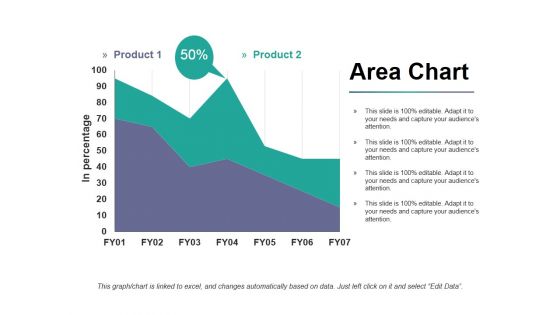
Area Chart Ppt PowerPoint Presentation Styles Graphics Download
This is a area chart ppt powerpoint presentation styles graphics download. This is a two stage process. The stages in this process are product, in percentage, area chart, business, marketing.
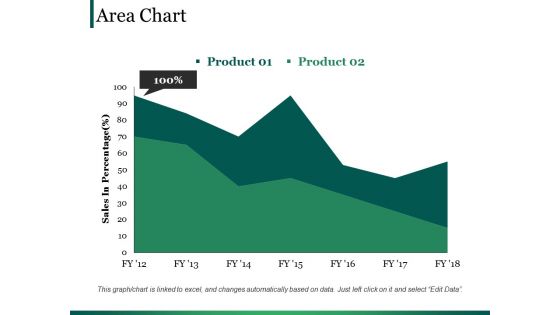
Area Chart Ppt PowerPoint Presentation Portfolio Background Image
This is a area chart ppt powerpoint presentation portfolio background image. This is a two stage process. The stages in this process are business, marketing, finance, planning, area chart.
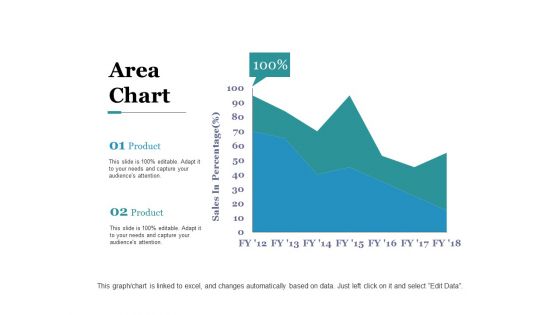
Area Chart Ppt PowerPoint Presentation Outline Graphic Tips
This is a area chart ppt powerpoint presentation outline graphic tips. This is a two stage process. The stages in this process are business, sales in percentage, area chart, percentage, marketing.
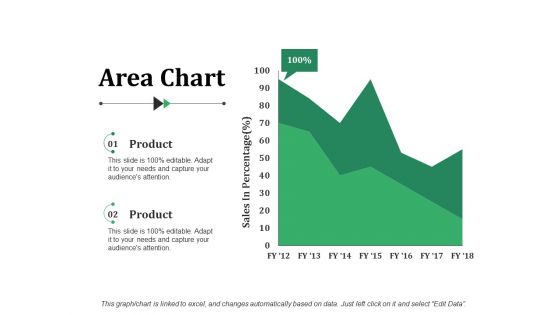
Area Chart Ppt PowerPoint Presentation Visual Aids Gallery
This is a area chart ppt powerpoint presentation visual aids gallery. This is a two stage process. The stages in this process are area chart, finance, marketing, analysis, business.
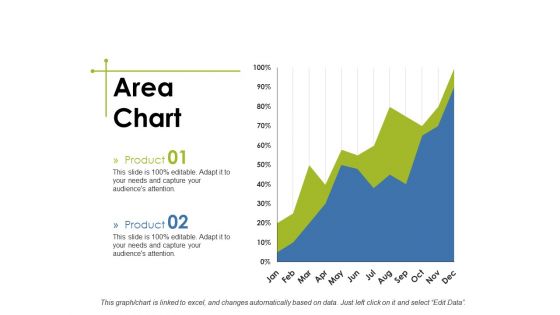
Area Chart Ppt PowerPoint Presentation Slides Master Slide
This is a area chart ppt powerpoint presentation slides master slide. This is a two stage process. The stages in this process are business, marketing, area chart, finance, strategy.
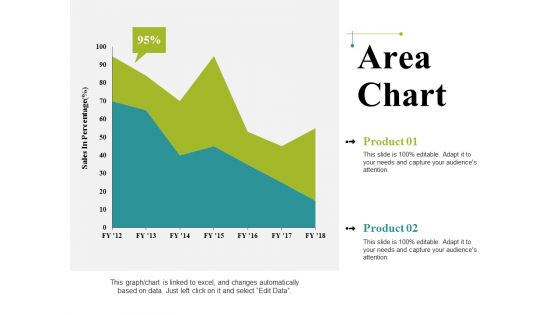
Area Chart Ppt PowerPoint Presentation Infographics Graphics Pictures
This is a area chart ppt powerpoint presentation infographics graphics pictures. This is a two stage process. The stages in this process are business, sales in percentage, area chart, marketing, graph.
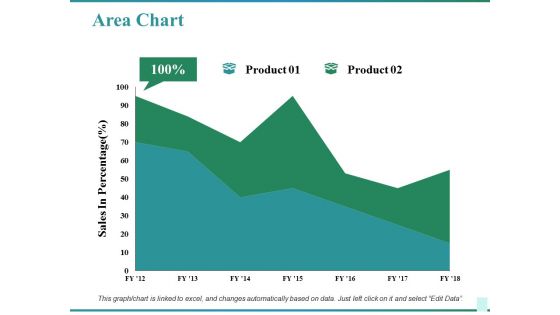
Area Chart Ppt PowerPoint Presentation Inspiration Background Designs
This is a area chart ppt powerpoint presentation inspiration background designs. This is a two stage process. The stages in this process are business, sales in percentage, area chart, marketing, finance.
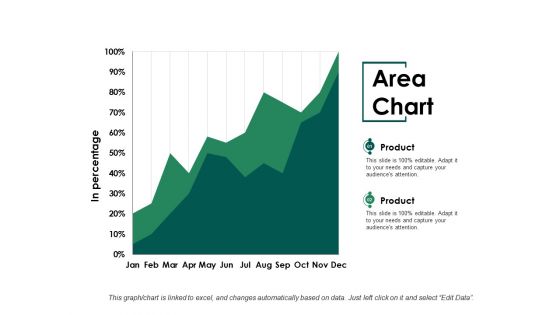
Area Chart Ppt PowerPoint Presentation File Format Ideas
This is a area chart ppt powerpoint presentation file format ideas. This is a two stage process. The stages in this process are area chart, marketing, planning, finance, strategy.
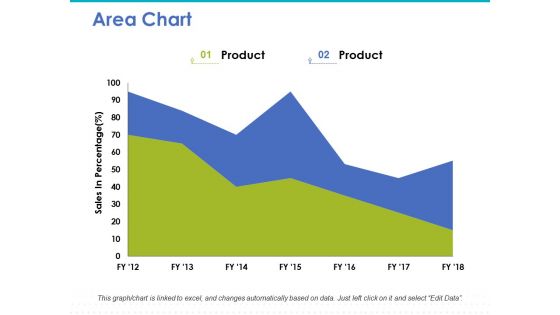
Area Chart Ppt PowerPoint Presentation Infographic Template Inspiration
This is a area chart ppt powerpoint presentation infographic template inspiration. This is a two stage process. The stages in this process are area chart, marketing, strategy, finance, planning.
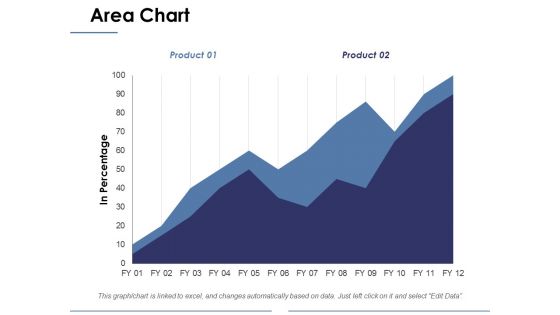
Area Chart Ppt PowerPoint Presentation Layouts Background Designs
This is a area chart ppt powerpoint presentation layouts background designs. This is a two stage process. The stages in this process are business, marketing, in percentage, area chart, finance.

Area Chart Ppt PowerPoint Presentation Styles Design Templates
This is a area chart ppt powerpoint presentation styles design templates. This is a two stage process. The stages in this process are area chart, analysis, business, marketing, strategy.

Area Chart Ppt PowerPoint Presentation Infographic Template Designs
This is a area chart ppt powerpoint presentation infographic template designs. This is a two stage process. The stages in this process are area chart, finance, marketing, strategy, business.

Area Chart Finance Ppt PowerPoint Presentation Infographics Layouts
This is a area chart finance ppt powerpoint presentation infographics layouts. This is a one stages process. The stages in this process are area chart, financial, marketing, planning, business.
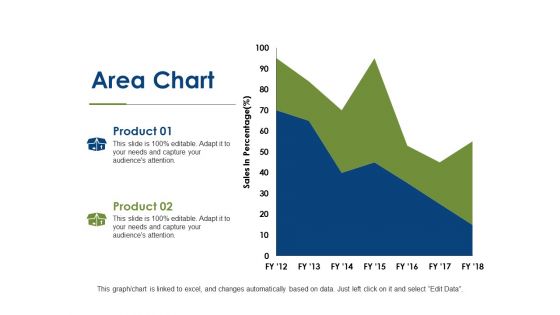
Area Chart Finance Ppt PowerPoint Presentation Show Visual Aids
This is a area chart finance ppt powerpoint presentation show visual aids. This is a two stage process. The stages in this process are area chart, business, finance, investment, strategy.

Area Chart Finance Ppt PowerPoint Presentation Show Brochure
This is a area chart finance ppt powerpoint presentation show brochure. This is a two stage process. The stages in this process are area chart, finance, marketing, management, investment.
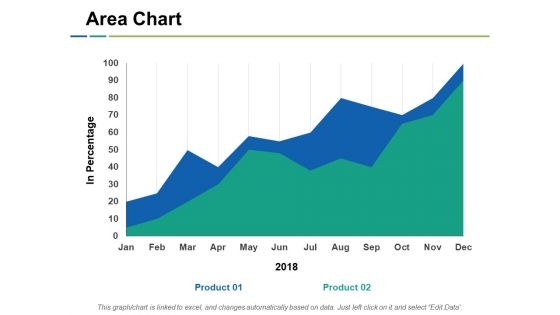
Area Chart Ppt PowerPoint Presentation Model Slide Portrait
This is a area chart ppt powerpoint presentation model slide portrait. This is a two stage process. The stages in this process are area chart, financial, business, marketing, planning, strategy.

Area Chart Investment Ppt PowerPoint Presentation Styles Topics
This is a area chart investment ppt powerpoint presentation styles topics. This is a three stage process. The stages in this process are area chart, finance, marketing, analysis, investment.
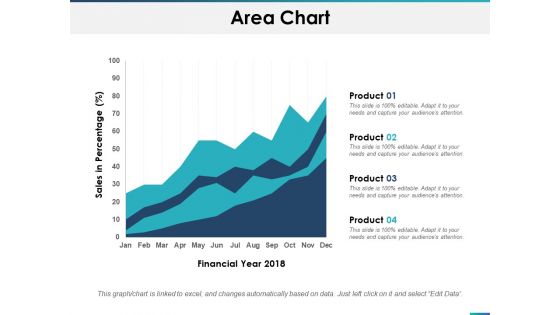
Area Chart Finance Ppt PowerPoint Presentation Outline Brochure
This is a area chart finance ppt powerpoint presentation outline brochure. This is a four stage process. The stages in this process are area chart, finance, marketing, analysis, investment.
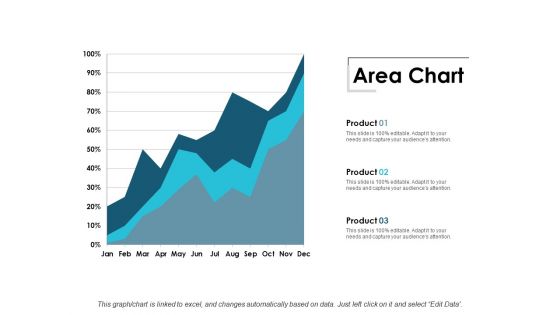
Area Chart Finance Ppt Powerpoint Presentation Slides Picture
This is a area chart finance ppt powerpoint presentation slides picture. This is a three stage process. The stages in this process are area chart, finance, marketing, management, investment.
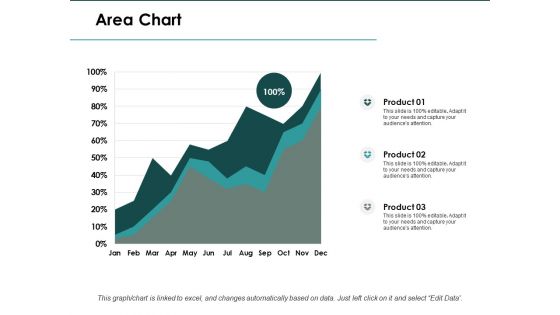
Area Chart Finance Ppt PowerPoint Presentation Infographics Slide
This is a area chart finance ppt powerpoint presentation infographics slide. This is a three stage process. The stages in this process are area chart, finance, marketing, analysis, investment.
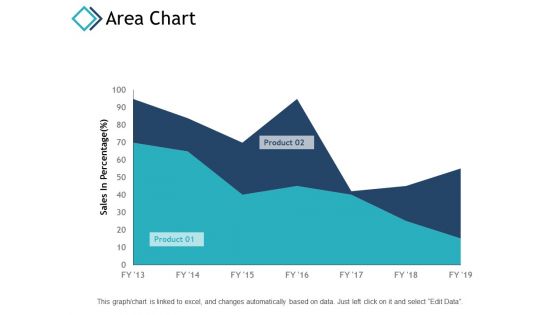
Area Chart Marketing Planning Ppt PowerPoint Presentation Ideas Maker
This is a area chart marketing planning ppt powerpoint presentation ideas maker. This is a two stage process. The stages in this process are area chart, finance, marketing, analysis, investment.
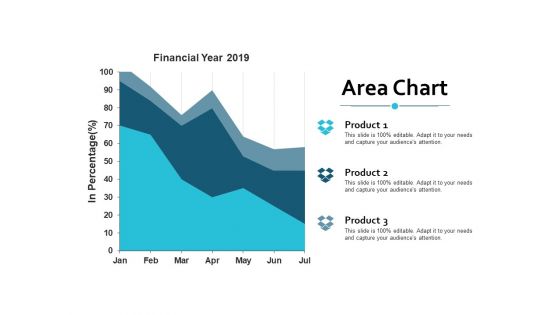
Area Chart Finance Ppt Powerpoint Presentation Inspiration Example
This is a area chart finance ppt powerpoint presentation inspiration example. This is a three stage process. The stages in this process are area chart, finance, marketing, management, investment.
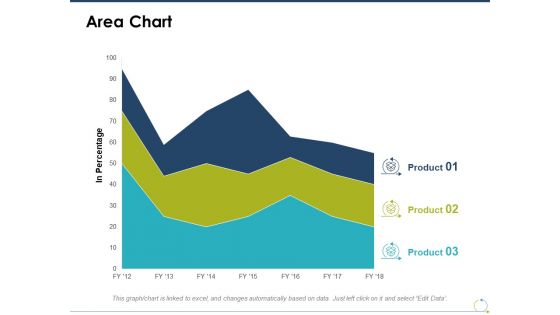
Area Chart Investment Ppt PowerPoint Presentation Gallery Example Introduction
This is a area chart investment ppt powerpoint presentation gallery example introduction. This is a three stage process. The stages in this process are area chart, finance, marketing, management, investment.

Area Chart Product Percentage Ppt PowerPoint Presentation Infographic Template Slide
This is a area chart product percentage ppt powerpoint presentation infographic template slide. This is a four stage process. The stages in this process are area chart, finance, marketing, management, investment.

Area Chart Percentage Ppt PowerPoint Presentation Portfolio Pictures
This is a area chart percentage ppt powerpoint presentation portfolio pictures. This is a three stage process. The stages in this process are area chart, finance, marketing, management, investment.
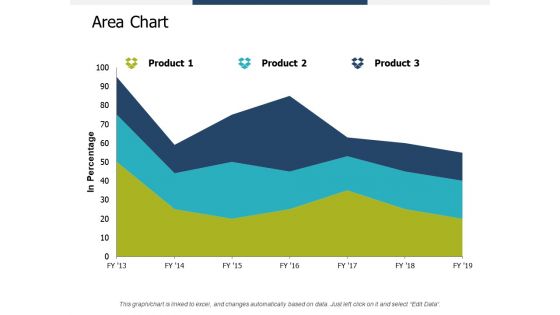
Area Chart Finance Marketing Ppt PowerPoint Presentation Gallery Styles
This is a area chart finance marketing ppt powerpoint presentation gallery styles. This is a three stage process. The stages in this process are area chart, finance, marketing, analysis, investment.
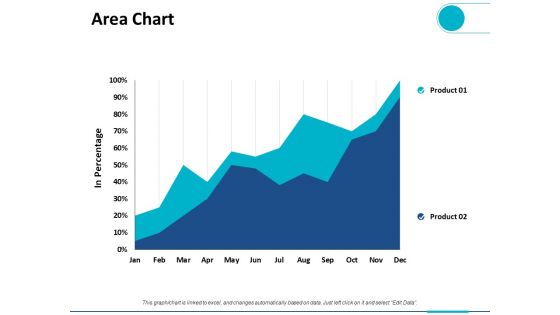
Area Chart Finance Ppt PowerPoint Presentation Pictures Clipart
This is a area chart finance ppt powerpoint presentation pictures clipart. This is a two stage process. The stages in this process are area chart, finance, marketing, analysis, investment.
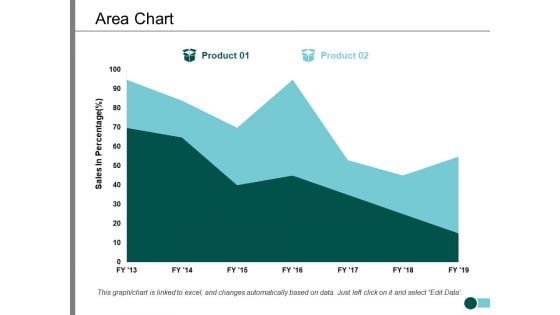
Area Chart Percentage Product Ppt PowerPoint Presentation Infographic Template Slide
This is a area chart percentage product ppt powerpoint presentation infographic template slide. This is a two stage process. The stages in this process are area chart, finance, marketing, management, investment.
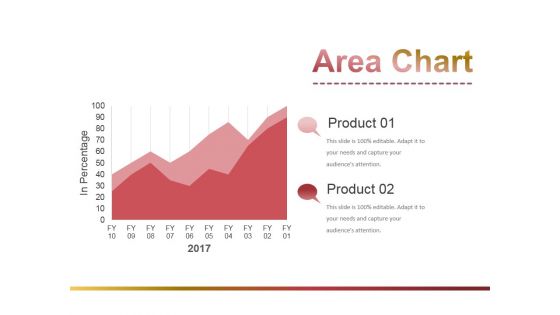
Area Chart Ppt PowerPoint Presentation Show Slide Portrait
This is a area chart ppt powerpoint presentation show slide portrait. This is a two stage process. The stages in this process are business, strategy, marketing, analysis, area chart.

Area Chart Ppt PowerPoint Presentation Visual Aids Show
This is a area chart ppt powerpoint presentation visual aids show. This is a two stage process. The stages in this process are area chart, growth, strategy, finance, business.
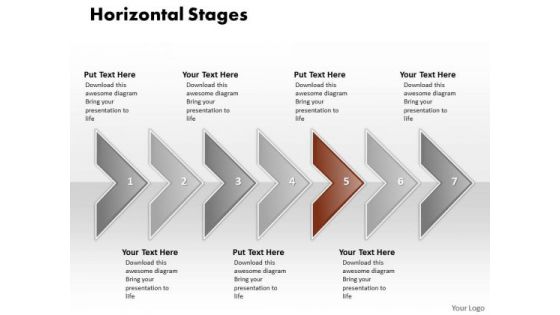
Ppt Correlated Arrows In Horizontal Create PowerPoint Macro 7 State Diagram Templates
PPT correlated arrows in horizontal create powerpoint macro 7 state diagram Templates-This Diagram is used to illustrate how information will move between interrelated systems in the accomplishment of a given function, task or process. The visual description of this information flow with each given level showing how data is fed into a given process step and subsequently passed along at the completion of that step.-PPT correlated arrows in horizontal create powerpoint macro 7 state diagram Templates-Aim, Arrow, Badge, Border, Color, Connection, Curve, Design, Direction, Download, Icon, Illustration, Indicator, Internet, Label, Link, Magenta, Mark, Next, Object, Orientation, Paper, Peeling, Pointer, Rounded, Set, Shadow, Shape, Sign Our Ppt Correlated Arrows In Horizontal Create PowerPoint Macro 7 State Diagram Templates are exceptionally adaptive. They will blend in with any scenario.
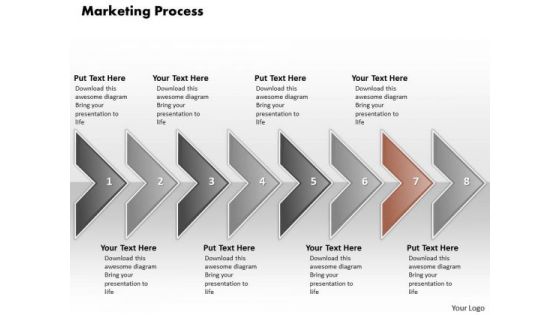
Ppt Illustration Of Marketing Process Using 8 State Diagram PowerPoint Templates
PPT illustration of marketing process using 8 state diagram PowerPoint Templates-This Diagram is used to illustrate how information will move between interrelated systems in the accomplishment of a given function, task or process. The visual description of this information flow with each given level showing how data is fed into a given process step and subsequently passed along at the completion of that step.-PPT illustration of marketing process using 8 state diagram PowerPoint Templates-Aim, Arrow, Badge, Border, Color, Connection, Curve, Design, Direction, Download, Icon, Illustration, Indicator, Internet, Label, Link, Magenta, Mark, Next, Object, Orientation, Paper, Peeling, Pointer, Rounded, Set, Shadow, Shape, Sign Have an exhilirating event with our Ppt Illustration Of Marketing Process Using 8 State Diagram PowerPoint Templates. Feel a surge of excitement in you.
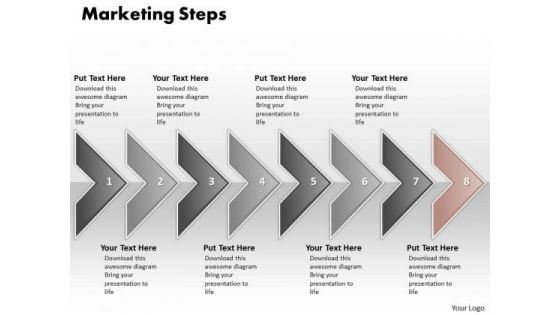
Ppt PowerPoint Slide Numbers Of Marketing Process Using 8 State Diagram Templates
PPT powerpoint slide numbers of marketing process using 8 state diagram Templates-Our compelling template consists of a design of arrow in straight line. This Diagram is used to illustrate how information will move between interrelated systems in the accomplishment of a given function, task or process. The visual description of this information flow with each given level showing how data is fed into a given process step and subsequently passed along at the completion of that step.-PPT powerpoint slide numbers of marketing process using 8 state diagram Templates-Aim, Arrow, Badge, Border, Color, Connection, Curve, Design, Direction, Download, Icon, Illustration, Indicator, Internet, Label, Link, Magenta, Mark, Next, Object, Orientation, Paper, Peeling, Pointer, Rounded, Set, Shadow, Shape, Sign Put in our Ppt PowerPoint Slide Numbers Of Marketing Process Using 8 State Diagram Templates as the catalyst. Churn out new equations with your ideas.
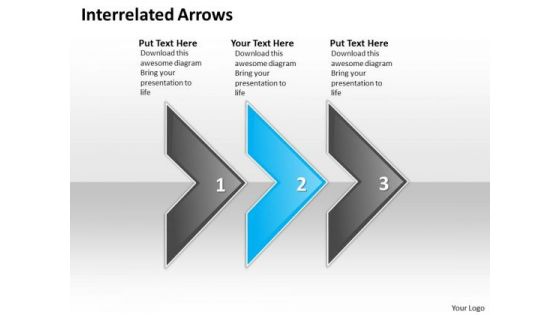
Ppt Interrelated Circular Arrows PowerPoint 2010 3 State Diagram Business Templates
PPT interrelated circular arrows powerpoint 2010 3 state diagram Business Templates-Most events and in every aspect of life are invariably interlinked. Use this graphic to outline your thoughts and their inherent interdependence to achieve the final outcome. Expand on your plans to overcome such obstacles and reassure the team that they shall continue to roll along merrily.-PPT interrelated circular arrows powerpoint 2010 3 state diagram Business Templates-Aim, Arrow, Arrowheads, Badge, Border, Click, Connection, Curve, Design, Direction, Download, Element, Fuchsia, Icon, Illustration, Indicator, Internet, Magenta, Mark, Object, Orientation, Pointer, Shadow, Shape, Sign Influence decision makers with our Ppt Interrelated Circular Arrows PowerPoint 2010 3 State Diagram Business Templates. Make sure your presentation gets the attention it deserves.
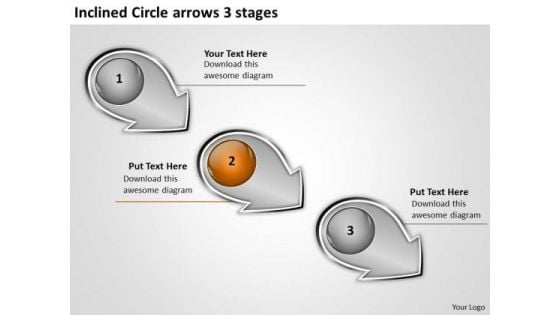
Inclined Circle Arrows 3 Stages Ppt Flowcharts Vision PowerPoint Slides
We present our inclined circle arrows 3 stages ppt flowcharts vision PowerPoint Slides. Use our Finance PowerPoint Templates because, this one depicts the popular chart. Use our Process and Flows PowerPoint Templates because, Now use this slide to bullet point your views. Use our Business PowerPoint Templates because, Marketing Strategy Business Template:- Maximizing sales of your product is the intended destination. Use our Circle Charts PowerPoint Templates because, you have it all down to a T. Use our Shapes PowerPoint Templates because, Different people with differing ideas and priorities perform together to score. Use these PowerPoint slides for presentations relating to Arrow, business, circle, circular, collection, connection, cursor, decoration, design, dimensional, direction, element, icon, illustration, information, modern, motion, perspective, process, recycle, recycling, reflective, shape, shiny, sign, symbol, technology. The prominent colors used in the PowerPoint template are Orange, White, and Black Breathe easy with our Inclined Circle Arrows 3 Stages Ppt Flowcharts Vision PowerPoint Slides. Maintain a steady rate of thought.
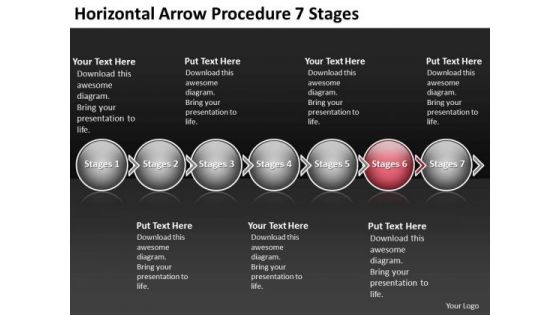
Horizontal Arrow Procedure 7 Stages Ppt Flowchart Creator PowerPoint Templates
We present our horizontal arrow procedure 7 stages ppt flowchart creator PowerPoint templates. Use our Leadership PowerPoint Templates because; transmit this concern to your staff using our helpful slides. Use our Arrows PowerPoint Templates because; adorn them with your ideas and thoughts. Use our Circle Charts PowerPoint Templates because, designed to help bullet-point your views and thoughts. Use our Process and Flows PowerPoint Templates because, designed to attract the attention of your audience. Use our Business PowerPoint Templates because; Show them how you can save the day. Use these PowerPoint slides for presentations relating to Arrow, business, circle, circular, collection, connection, cursor, decoration, design, dimensional, direction, element, icon, illustration, information, modern, motion, perspective, pointing, process, recycle, recycling, reflective, shape, shiny, sign, symbol, technology. The prominent colors used in the PowerPoint template are Red, Gray, and White Our Horizontal Arrow Procedure 7 Stages Ppt Flowchart Creator PowerPoint Templates will ensure you get your point across. You will be glad you tried us out.
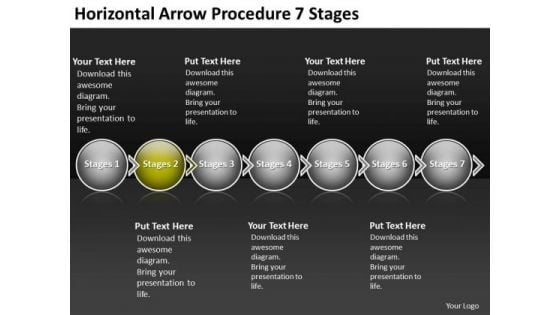
Horizontal Arrow Procedure 7 Stages Wire Schematic PowerPoint Templates
We present our horizontal arrow procedure 7 stages wire schematic PowerPoint templates. Use our Leadership PowerPoint Templates because; Raise your Company stocks at the Opening Bell. Use our Arrows PowerPoint Templates because; demonstrate how you think out of the box. Use our Circle Charts PowerPoint Templates because, they help to lay the base of your trend of thought. Use our Process and Flows PowerPoint Templates because, they highlight the depth of your thought process. Use our Business PowerPoint Templates because; Lay down the fundamentals to build upon. Use these PowerPoint slides for presentations relating to Arrow, business, circle, circular, collection, connection, cursor, decoration, design, dimensional, direction, element, icon, illustration, information, modern, motion, perspective, pointing, process, recycle, recycling, reflective, shape, shiny, sign, symbol, technology. The prominent colors used in the PowerPoint template are Green, White, and Gray Examine the causes with our Horizontal Arrow Procedure 7 Stages Wire Schematic PowerPoint Templates. Let everyone know what's behind it all.
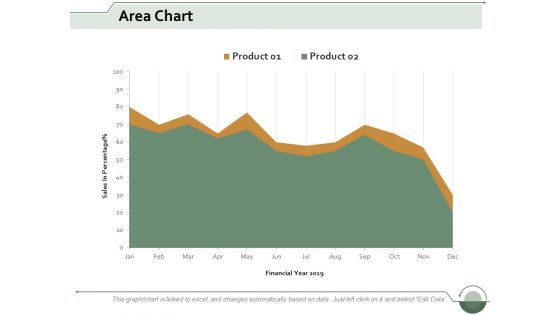
Area Chart Finance Ppt Powerpoint Presentation Infographic Template Clipart Images
This is a area chart finance ppt powerpoint presentation infographic template clipart images. This is a two stage process. The stages in this process are area bar, finance, marketing, management, analysis.
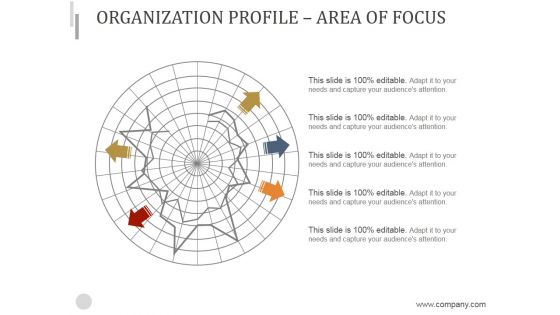
Organization Profile Area Of Focus Ppt PowerPoint Presentation Slides
This is a organization profile area of focus ppt powerpoint presentation slides. This is a five stage process. The stages in this process are organization, structure, business, marketing, strategy, success.

Revenue Incorporation Projection Report Review Themes Pdf
This slide depicts incorporation analysis which help manager to identifies recent sales numbers, financial outcomes and business performance. It include pointers such as area, product, budget for current year, actual sales and budget for future period. Pitch your topic with ease and precision using this Revenue Incorporation Projection Report Review Themes Pdf This layout presents information on Sales Budget, Budget For Current, California It is also available for immediate download and adjustment. So, changes can be made in the color, design, graphics or any other component to create a unique layout. This slide depicts incorporation analysis which help manager to identifies recent sales numbers, financial outcomes and business performance. It include pointers such as area, product, budget for current year, actual sales and budget for future period.


 Continue with Email

 Home
Home


