Machine Learning Algorithm
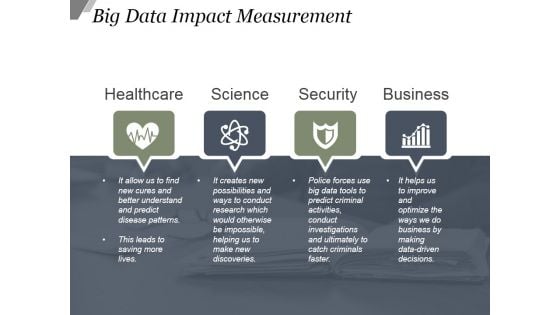
Big Data Impact Measurement Ppt PowerPoint Presentation Visuals
This is a big data impact measurement ppt powerpoint presentation visuals. This is a four stage process. The stages in this process are healthcare, science, security, business.
Big Data Analytics Vector Icon Ppt PowerPoint Presentation Layouts Show
Presenting this set of slides with name big data analytics vector icon ppt powerpoint presentation layouts show. This is a three stage process. The stages in this process are marketing, management, measuring results. This is a completely editable PowerPoint presentation and is available for immediate download. Download now and impress your audience.
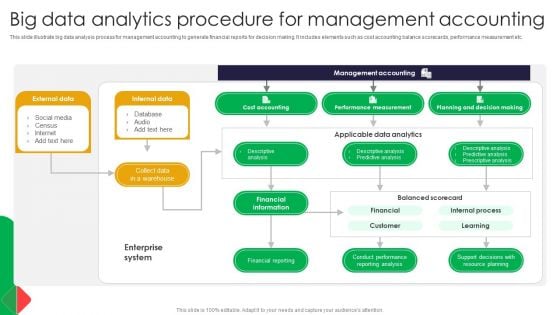
Big Data Analytics Procedure For Management Accounting Formats PDF
This slide illustrate big data analysis process for management accounting to generate financial reports for decision making. It includes elements such as cost accounting balance scorecards, performance measurement etc. Showcasing this set of slides titled Big Data Analytics Procedure For Management Accounting Formats PDF. The topics addressed in these templates are Accounting, Internal Data, Social Media. All the content presented in this PPT design is completely editable. Download it and make adjustments in color, background, font etc. as per your unique business setting.
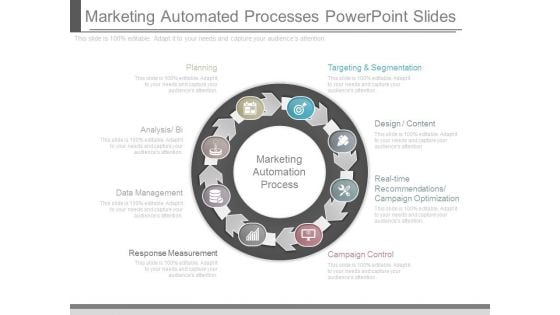
Marketing Automated Processes Powerpoint Slides
This is a marketing automated processes powerpoint slides. This is a eight stage process. The stages in this process are marketing automation process, targeting and segmentation, design content, real time recommendations campaign optimization, campaign control, response measurement, data management, analysis bi, planning.

Regression Model For Predictive Analytics Forward Looking Analysis IT Topics PDF
This slide represents the regression model of predictive analytics that is most commonly used in statistical analysis. This model is used to identify patterns in large amounts of data and works by calculating a formula. Presenting this PowerPoint presentation, titled Regression Model For Predictive Analytics Forward Looking Analysis IT Topics PDF, with topics curated by our researchers after extensive research. This editable presentation is available for immediate download and provides attractive features when used. Download now and captivate your audience. Presenting this Regression Model For Predictive Analytics Forward Looking Analysis IT Topics PDF. Our researchers have carefully researched and created these slides with all aspects taken into consideration. This is a completely customizable Regression Model For Predictive Analytics Forward Looking Analysis IT Topics PDF that is available for immediate downloading. Download now and make an impact on your audience. Highlight the attractive features available with our PPTs.
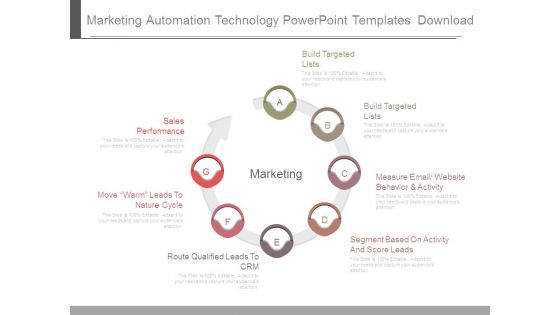
Marketing Automation Technology Powerpoint Templates Download
This is a marketing automation technology powerpoint templates download. This is a seven stage process. The stages in this process are build targeted lists, build targeted lists, measure email website behavior and activity, segment based on activity and score leads, sales performance, move warm leads to nature cycle, route qualified leads to crm, marketing.
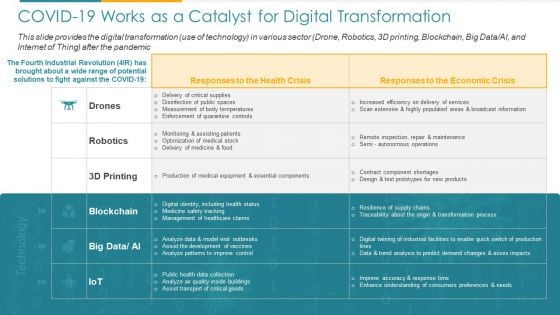
COVID Business COVID 19 Works As A Catalyst For Digital Transformation Ppt Professional Designs PDF
This slide provides the digital transformation use of technology in various sector Drone, Robotics, 3D printing, Blockchain, Big Data AI, and Internet of Thing after the pandemic. Deliver an awe inspiring pitch with this creative covid business covid 19 works as a catalyst for digital transformation ppt professional designs pdf bundle. Topics like services, measurement, stock, optimization can be discussed with this completely editable template. It is available for immediate download depending on the needs and requirements of the user.
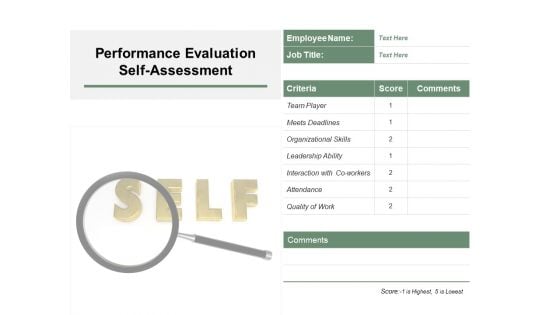
Performance Evaluation Self Assessment Ppt PowerPoint Presentation Show Elements
Presenting this set of slides with name performance evaluation self assessment ppt powerpoint presentation show elements. This is a one stage process. The stages in this process are self assessment, performance evaluation process, measure employee performance. This is a completely editable PowerPoint presentation and is available for immediate download. Download now and impress your audience.
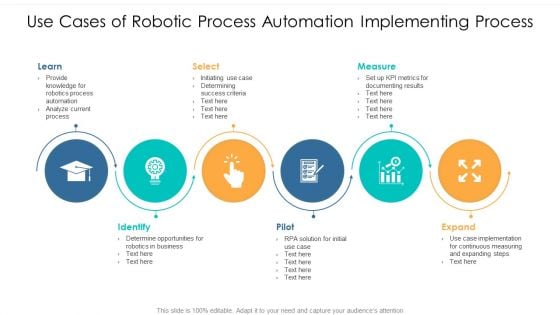
Use Cases Of Robotic Process Automation Implementing Process Ppt PowerPoint Presentation File Example Topics PDF
Persuade your audience using this use cases of robotic process automation implementing process ppt powerpoint presentation file example topics pdf. This PPT design covers six stages, thus making it a great tool to use. It also caters to a variety of topics including pilot, expand, measure. Download this PPT design now to present a convincing pitch that not only emphasizes the topic but also showcases your presentation skills.
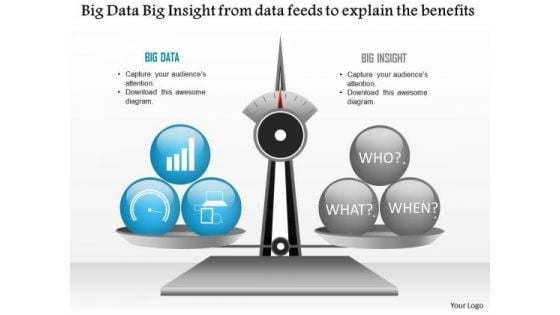
Business Diagram Big Data Big Insight From Data Feeds To Explain The Benefits Ppt Slide
Explain the benefits of big data analysis and data feeds with this technology diagram. This slide contains the graphic of scale with big data and big insight. Use this slide your data information and measurement related presentations.
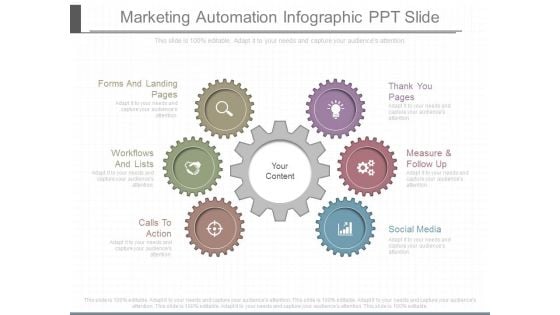
Marketing Automation Infographic Ppt Slide
This is a marketing automation infographic ppt slide. This is a six stage process. The stages in this process are forms and landing pages, workflows and lists, calls to action, social media, measure and follow up, thank you pages, your content.
Benefits Of Automated HR Service Delivery Solutions Icons PDF
This slide shows the benefits of implementing automated HR service delivery to the organization such as increased HR productivity, improved efficiency, improved organizations analytics and measurements etc. Create an editable Benefits Of Automated HR Service Delivery Solutions Icons PDF that communicates your idea and engages your audience. Whether youre presenting a business or an educational presentation, pre designed presentation templates help save time. Benefits Of Automated HR Service Delivery Solutions Icons PDF is highly customizable and very easy to edit, covering many different styles from creative to business presentations. Slidegeeks has creative team members who have crafted amazing templates. So, go and get them without any delay.
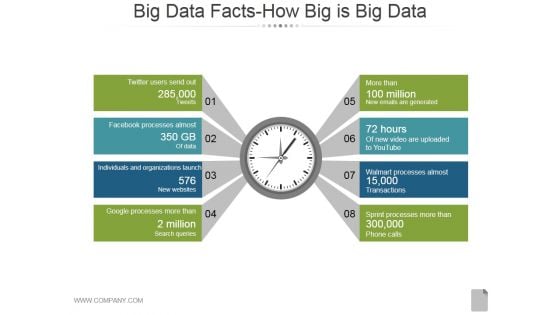
Big Data Facts How Big Is Big Data Ppt PowerPoint Presentation Microsoft
This is a big data facts how big is big data ppt powerpoint presentation microsoft. This is a eight stage process. The stages in this process are business, management, strategy, measure, marketing, success.
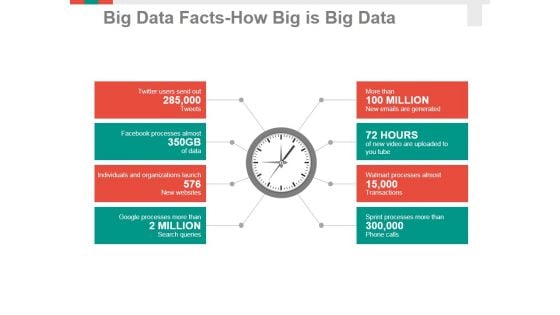
Big Data Facts How Big Is Big Data Ppt PowerPoint Presentation Professional Information
This is a big data facts how big is big data ppt powerpoint presentation professional information. This is a eight stage process. The stages in this process are business, management, strategy, measure, analysis.
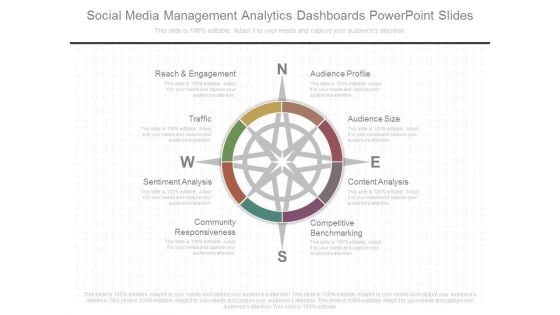
Social Media Management Analytics Dashboards Powerpoint Slides
This is a social media management analytics dashboards powerpoint slides. This is a four stage process. The stages in this process are reach and engagement, audience profile, traffic, audience size, sentiment analysis, content analysis, competitive benchmarking, community responsiveness.\n\n\n\n\n\n
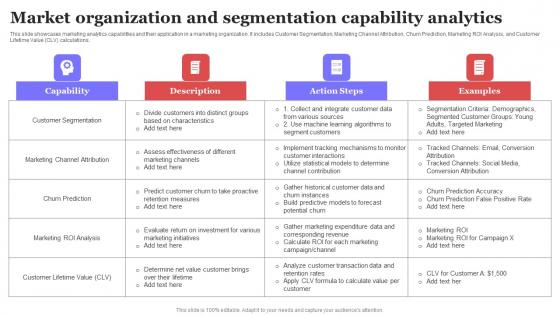
Market Organization And Segmentation Capability Analytics Ppt Example PDF
This slide showcases marketing analytics capabilities and their application in a marketing organization. It includes Customer Segmentation, Marketing Channel Attribution, Churn Prediction, Marketing ROI Analysis, and Customer Lifetime Value CLV calculations. Pitch your topic with ease and precision using this Market Organization And Segmentation Capability Analytics Ppt Example PDF. This layout presents information on Capability, Action Steps, Examples. It is also available for immediate download and adjustment. So, changes can be made in the color, design, graphics or any other component to create a unique layout. This slide showcases marketing analytics capabilities and their application in a marketing organization. It includes Customer Segmentation, Marketing Channel Attribution, Churn Prediction, Marketing ROI Analysis, and Customer Lifetime Value CLV calculations.
Product Launch Time Analytics And Monitoring Dashboard Icon Inspiration PDF
Presenting Product Launch Time Analytics And Monitoring Dashboard Icon Inspiration PDF to dispense important information. This template comprises three stages. It also presents valuable insights into the topics including Product Launch Time, Analytics, And Monitoring, Dashboard Icon. This is a completely customizable PowerPoint theme that can be put to use immediately. So, download it and address the topic impactfully.
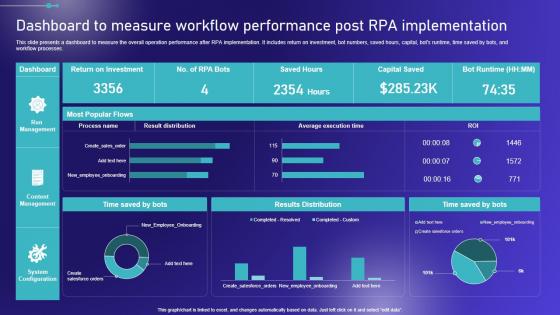
Dashboard To Measure Workflow Performance Post Embracing Robotic Process Portrait PDF
This slide presents a dashboard to measure the overall operation performance after RPA implementation. It includes return on investment, bot numbers, saved hours, capital, bots runtime, time saved by bots, and workflow processes. Are you in need of a template that can accommodate all of your creative concepts This one is crafted professionally and can be altered to fit any style. Use it with Google Slides or PowerPoint. Include striking photographs, symbols, depictions, and other visuals. Fill, move around, or remove text boxes as desired. Test out color palettes and font mixtures. Edit and save your work, or work with colleagues. Download Dashboard To Measure Workflow Performance Post Embracing Robotic Process Portrait PDF and observe how to make your presentation outstanding. Give an impeccable presentation to your group and make your presentation unforgettable. This slide presents a dashboard to measure the overall operation performance after RPA implementation. It includes return on investment, bot numbers, saved hours, capital, bots runtime, time saved by bots, and workflow processes.
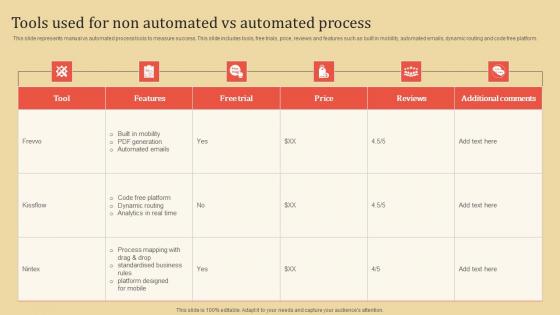
Tools Used For Non Automated Vs Automated Process Portrait PDF
This slide represents manual vs automated process tools to measure success. This slide includes tools, free trials, price, reviews and features such as built in mobility, automated emails, dynamic routing and code free platform.Pitch your topic with ease and precision using this Tools Used For Non Automated Vs Automated Process Portrait PDF This layout presents information on Standardised Business, Process Mapping, Built Mobility It is also available for immediate download and adjustment. So, changes can be made in the color, design, graphics or any other component to create a unique layout. This slide represents manual vs automated process tools to measure success. This slide includes tools, free trials, price, reviews and features such as built in mobility, automated emails, dynamic routing and code free platform.
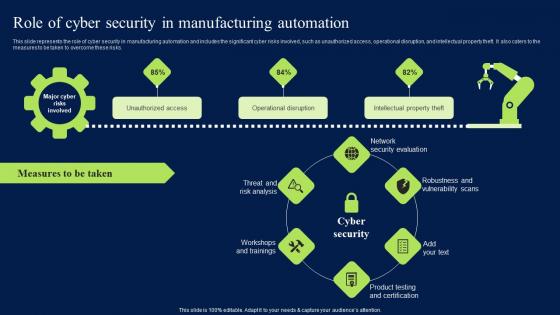
Role Of Cyber Security In Manufacturing Automation Clipart PDF
This slide represents the role of cyber security in manufacturing automation and includes the significant cyber risks involved, such as unauthorized access, operational disruption, and intellectual property theft. It also caters to the measures to be taken to overcome these risks. Find highly impressive Role Of Cyber Security In Manufacturing Automation Clipart PDF on Slidegeeks to deliver a meaningful presentation. You can save an ample amount of time using these presentation templates. No need to worry to prepare everything from scratch because Slidegeeks experts have already done a huge research and work for you. You need to download Role Of Cyber Security In Manufacturing Automation Clipart PDF for your upcoming presentation. All the presentation templates are 100 percent editable and you can change the color and personalize the content accordingly. Download now This slide represents the role of cyber security in manufacturing automation and includes the significant cyber risks involved, such as unauthorized access, operational disruption, and intellectual property theft. It also caters to the measures to be taken to overcome these risks.
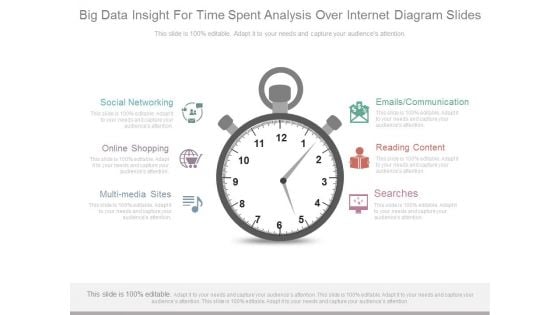
Big Data Insight For Time Spent Analysis Over Internet Diagram Slides
This is a big data insight for time spent analysis over internet diagram slides. This is a one stage process. The stages in this process are social networking, online shopping, multimedia sites, searches, reading content, emails communication.
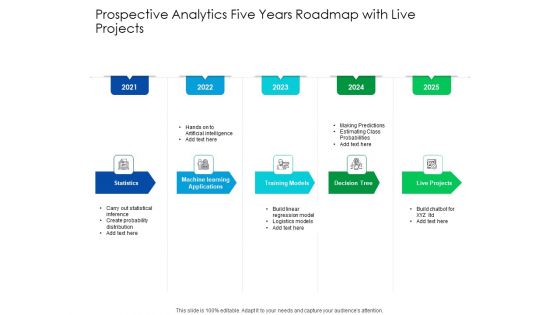
Predictive Analytics Five Years Roadmap With Live Projects Mockup
Presenting our innovatively structured predictive analytics five years roadmap with live projects mockup Template. Showcase your roadmap process in different formats like PDF, PNG, and JPG by clicking the download button below. This PPT design is available in both Standard Screen and Widescreen aspect ratios. It can also be easily personalized and presented with modified font size, font type, color, and shapes to measure your progress in a clear way.
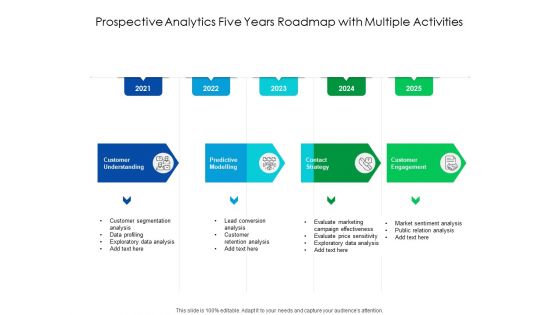
Predictive Analytics Five Years Roadmap With Multiple Activities Ideas
Introducing our predictive analytics five years roadmap with multiple activities ideas. This PPT presentation is Google Slides compatible, therefore, you can share it easily with the collaborators for measuring the progress. Also, the presentation is available in both standard screen and widescreen aspect ratios. So edit the template design by modifying the font size, font type, color, and shapes as per your requirements. As this PPT design is fully editable it can be presented in PDF, JPG and PNG formats.
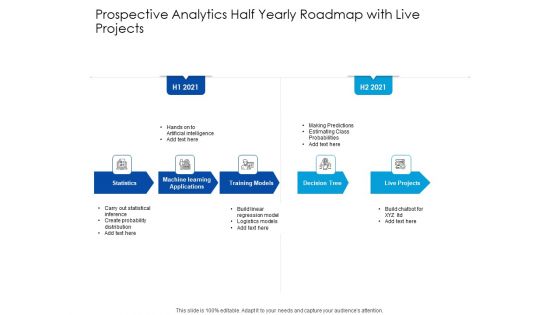
Predictive Analytics Half Yearly Roadmap With Live Projects Diagrams
Presenting our innovatively structured predictive analytics half yearly roadmap with live projects diagrams Template. Showcase your roadmap process in different formats like PDF, PNG, and JPG by clicking the download button below. This PPT design is available in both Standard Screen and Widescreen aspect ratios. It can also be easily personalized and presented with modified font size, font type, color, and shapes to measure your progress in a clear way.
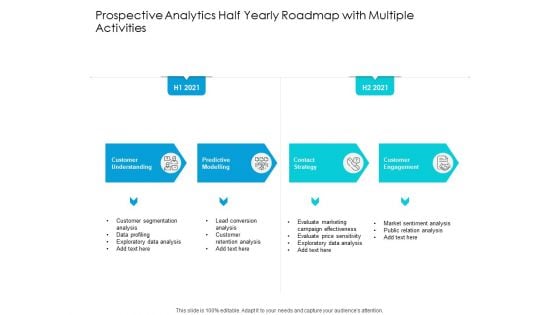
Predictive Analytics Half Yearly Roadmap With Multiple Activities Formats
Introducing our predictive analytics half yearly roadmap with multiple activities formats. This PPT presentation is Google Slides compatible, therefore, you can share it easily with the collaborators for measuring the progress. Also, the presentation is available in both standard screen and widescreen aspect ratios. So edit the template design by modifying the font size, font type, color, and shapes as per your requirements. As this PPT design is fully editable it can be presented in PDF, JPG and PNG formats.
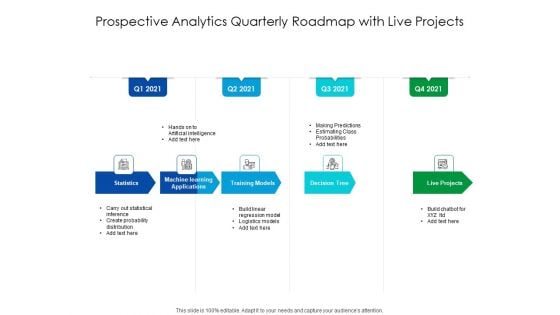
Predictive Analytics Quarterly Roadmap With Live Projects Microsoft
Presenting our innovatively structured predictive analytics quarterly roadmap with live projects microsoft Template. Showcase your roadmap process in different formats like PDF, PNG, and JPG by clicking the download button below. This PPT design is available in both Standard Screen and Widescreen aspect ratios. It can also be easily personalized and presented with modified font size, font type, color, and shapes to measure your progress in a clear way.
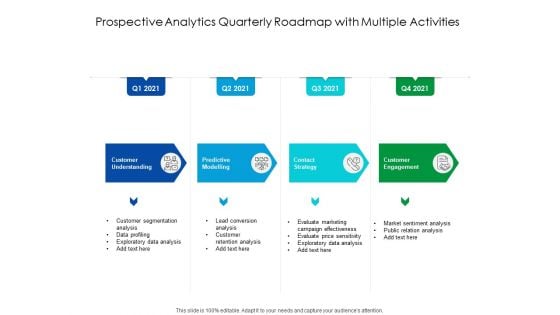
Predictive Analytics Quarterly Roadmap With Multiple Activities Ideas
Introducing our predictive analytics quarterly roadmap with multiple activities ideas. This PPT presentation is Google Slides compatible, therefore, you can share it easily with the collaborators for measuring the progress. Also, the presentation is available in both standard screen and widescreen aspect ratios. So edit the template design by modifying the font size, font type, color, and shapes as per your requirements. As this PPT design is fully editable it can be presented in PDF, JPG and PNG formats.
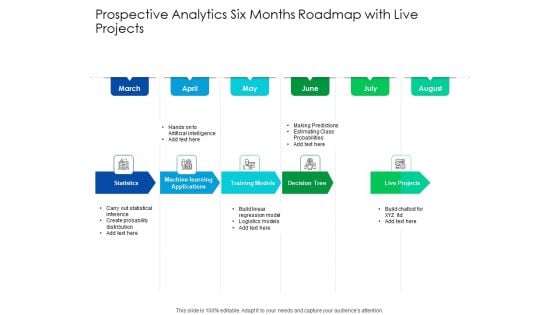
Predictive Analytics Six Months Roadmap With Live Projects Professional
Presenting our innovatively structured predictive analytics six months roadmap with live projects professional Template. Showcase your roadmap process in different formats like PDF, PNG, and JPG by clicking the download button below. This PPT design is available in both Standard Screen and Widescreen aspect ratios. It can also be easily personalized and presented with modified font size, font type, color, and shapes to measure your progress in a clear way.
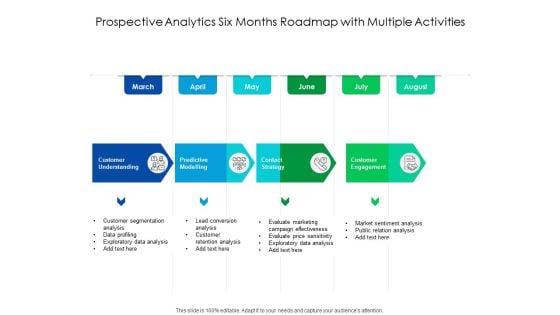
Predictive Analytics Six Months Roadmap With Multiple Activities Topics
Introducing our predictive analytics six months roadmap with multiple activities topics. This PPT presentation is Google Slides compatible, therefore, you can share it easily with the collaborators for measuring the progress. Also, the presentation is available in both standard screen and widescreen aspect ratios. So edit the template design by modifying the font size, font type, color, and shapes as per your requirements. As this PPT design is fully editable it can be presented in PDF, JPG and PNG formats.
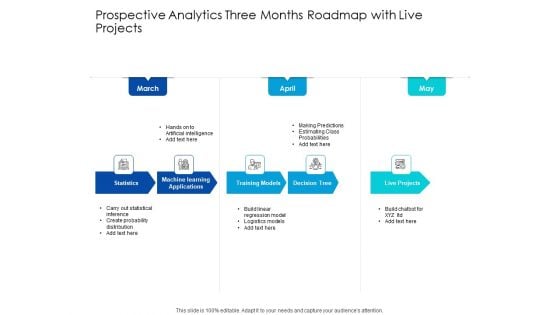
Predictive Analytics Three Months Roadmap With Live Projects Sample
Presenting our innovatively structured predictive analytics three months roadmap with live projects sample Template. Showcase your roadmap process in different formats like PDF, PNG, and JPG by clicking the download button below. This PPT design is available in both Standard Screen and Widescreen aspect ratios. It can also be easily personalized and presented with modified font size, font type, color, and shapes to measure your progress in a clear way.

Predictive Analytics Three Months Roadmap With Multiple Activities Elements
Introducing our predictive analytics three months roadmap with multiple activities elements. This PPT presentation is Google Slides compatible, therefore, you can share it easily with the collaborators for measuring the progress. Also, the presentation is available in both standard screen and widescreen aspect ratios. So edit the template design by modifying the font size, font type, color, and shapes as per your requirements. As this PPT design is fully editable it can be presented in PDF, JPG and PNG formats.
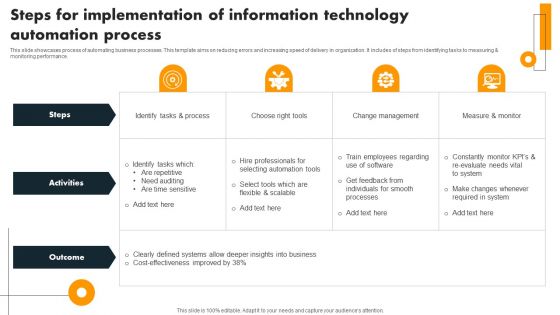
Steps For Implementation Of Information Technology Automation Process Mockup PDF
This slide showcases process of automating business processes. This template aims on reducing errors and increasing speed of delivery in organization. It includes of steps from identifying tasks to measuring and monitoring performance. Persuade your audience using this Steps For Implementation Of Information Technology Automation Process Mockup PDF. This PPT design covers three stages, thus making it a great tool to use. It also caters to a variety of topics including Steps, Activities, Outcome. Download this PPT design now to present a convincing pitch that not only emphasizes the topic but also showcases your presentation skills.
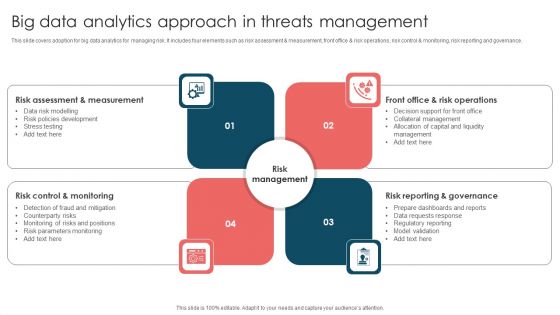
Big Data Analytics Approach In Threats Management Ppt Slides Guidelines PDF
This slide covers adoption for big data analytics for managing risk. It includes four elements such as risk assessment and measurement, front office and risk operations, risk control and monitoring, risk reporting and governance. Persuade your audience using this Big Data Analytics Approach In Threats Management Ppt Slides Guidelines PDF. This PPT design covers four stages, thus making it a great tool to use. It also caters to a variety of topics including Risk Control, Risk Management, Front Office, Risk Operations. Download this PPT design now to present a convincing pitch that not only emphasizes the topic but also showcases your presentation skills.
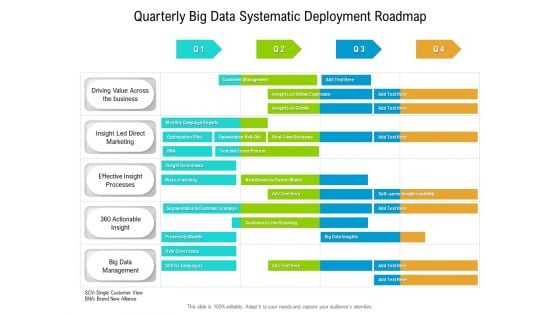
Quarterly Big Data Systematic Deployment Roadmap Diagrams
Presenting our innovatively-structured quarterly big data systematic deployment roadmap diagrams Template. Showcase your roadmap process in different formats like PDF, PNG, and JPG by clicking the download button below. This PPT design is available in both Standard Screen and Widescreen aspect ratios. It can also be easily personalized and presented with modified font size, font type, color, and shapes to measure your progress in a clear way.
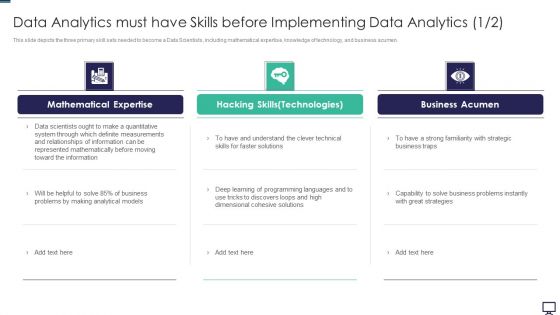
Data Analytics Must Have Skills Before Implementing Data Analytics Ppt Ideas PDF
This slide depicts the three primary skill sets needed to become a Data Scientists, including mathematical expertise, knowledge of technology, and business acumen. Deliver an awe inspiring pitch with this creative data analytics must have skills before implementing data analytics ppt ideas pdf bundle. Topics like business, system, measurements, information can be discussed with this completely editable template. It is available for immediate download depending on the needs and requirements of the user.
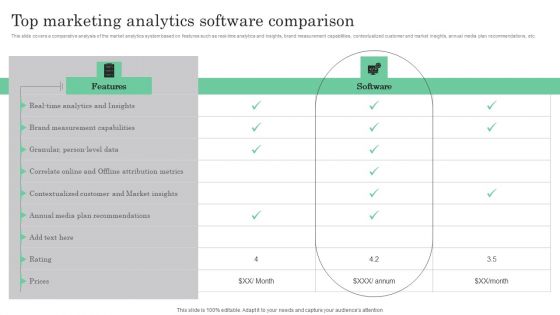
Online Marketing Analytics To Enhance Business Growth Top Marketing Analytics Software Comparison Inspiration PDF
This slide covers a comparative analysis of the market analytics system based on features such as real-time analytics and insights, brand measurement capabilities, contextualized customer and market insights, annual media plan recommendations, etc. Find highly impressive Online Marketing Analytics To Enhance Business Growth Top Marketing Analytics Software Comparison Inspiration PDF on Slidegeeks to deliver a meaningful presentation. You can save an ample amount of time using these presentation templates. No need to worry to prepare everything from scratch because Slidegeeks experts have already done a huge research and work for you. You need to download Online Marketing Analytics To Enhance Business Growth Top Marketing Analytics Software Comparison Inspiration PDF for your upcoming presentation. All the presentation templates are 100 percent editable and you can change the color and personalize the content accordingly. Download now.
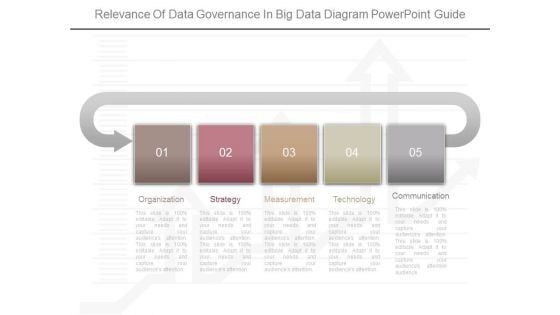
Relevance Of Data Governance In Big Data Diagram Powerpoint Guide
This is a relevance of data governance in big data diagram powerpoint guide. This is a five stage process. The stages in this process are organization, strategy, measurement, technology, communication.
Determine Essential Services Rendered By Agriculture Firm Agribusiness Microsoft PDF
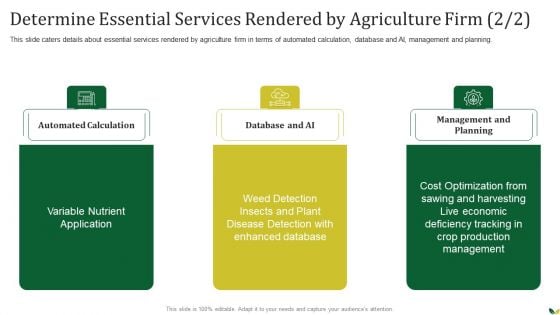
This slide caters details about essential services rendered by agriculture firm in terms of automated calculation, database and AI, management and planning. Presenting Determine Essential Services Rendered By Agriculture Firm Agribusiness Microsoft PDF to provide visual cues and insights. Share and navigate important information on three stages that need your due attention. This template can be used to pitch topics like Automated Calculation, Database And AI, Management And Planning. In addtion, this PPT design contains high resolution images, graphics, etc, that are easily editable and available for immediate download.
Performance Improvement Plan Strategic Measures To Boost Employee Efficienc Background Pdf
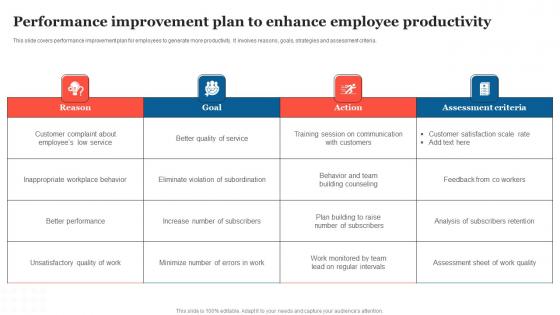
This slide covers performance improvement plan for employees to generate more productivity. It involves reasons, goals, strategies and assessment criteria. Are you in need of a template that can accommodate all of your creative concepts This one is crafted professionally and can be altered to fit any style. Use it with Google Slides or PowerPoint. Include striking photographs, symbols, depictions, and other visuals. Fill, move around, or remove text boxes as desired. Test out color palettes and font mixtures. Edit and save your work, or work with colleagues. Download Performance Improvement Plan Strategic Measures To Boost Employee Efficienc Background Pdf and observe how to make your presentation outstanding. Give an impeccable presentation to your group and make your presentation unforgettable. This slide covers performance improvement plan for employees to generate more productivity. It involves reasons, goals, strategies and assessment criteria.

Big Data Interpretation Evaluation In Risk Management Lifecycle Designs PDF
This slide demonstrates the four phases of big data analytics assessment in risk management lifecycle. It includes four phases such as risk assessment and measurement, front office and risk operations, risk control, monitoring, reporting and governance. Persuade your audience using this Big Data Interpretation Evaluation In Risk Management Lifecycle Designs PDF. This PPT design covers four stages, thus making it a great tool to use. It also caters to a variety of topics including Risk Assessment And Measurement, Risk Control And Monitoring , Risk Reporting And Governance. Download this PPT design now to present a convincing pitch that not only emphasizes the topic but also showcases your presentation skills.
Risk Recognition Automation Calculating Network Device Velocity Sizing Ppt Gallery Background Designs PDF
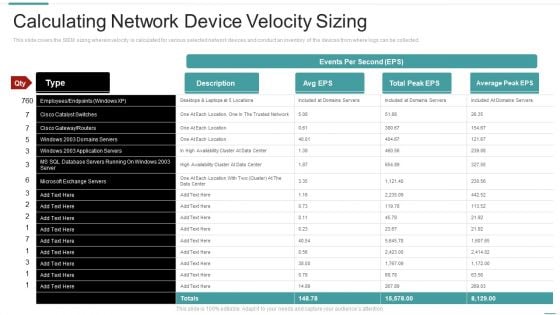
This slide covers the SIEM sizing wherein velocity is calculated for various selected network devices and conduct an inventory of the devices from where logs can be collected. Deliver an awe inspiring pitch with this creative risk recognition automation calculating network device velocity sizing ppt gallery background designs pdf bundle. Topics like calculating network device velocity sizing can be discussed with this completely editable template. It is available for immediate download depending on the needs and requirements of the user.
Why Should Organizations Invest In Cobots Cobot Safety Measures And Risk Formats PDF
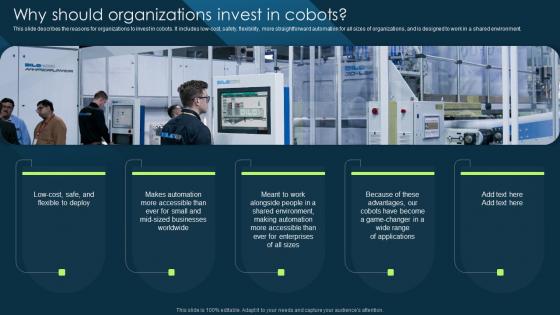
This slide describes the reasons for organizations to invest in cobots. It includes low-cost, safety, flexibility, more straightforward automation for all sizes of organizations, and is designed to work in a shared environment. This Why Should Organizations Invest In Cobots Cobot Safety Measures And Risk Formats PDF from Slidegeeks makes it easy to present information on your topic with precision. It provides customization options, so you can make changes to the colors, design, graphics, or any other component to create a unique layout. It is also available for immediate download, so you can begin using it right away. Slidegeeks has done good research to ensure that you have everything you need to make your presentation stand out. Make a name out there for a brilliant performance. This slide describes the reasons for organizations to invest in cobots. It includes low-cost, safety, flexibility, more straightforward automation for all sizes of organizations, and is designed to work in a shared environment.
Supplier Action Plan Tracking And Reporting Dashboard Graphics PDF
This slide covers procurement reporting and analytics dashboard for tracking the effectiveness of new supplier strategy. It include metrics such as spend, transactions, PO, PR and invoice count, invoices information, due dates, spend by payment terms, supplier payment terms, etc. Showcasing this set of slides titled supplier action plan tracking and reporting dashboard graphics pdf. The topics addressed in these templates are supplier action plan tracking and reporting dashboard. All the content presented in this PPT design is completely editable. Download it and make adjustments in color, background, font etc. as per your unique business setting.
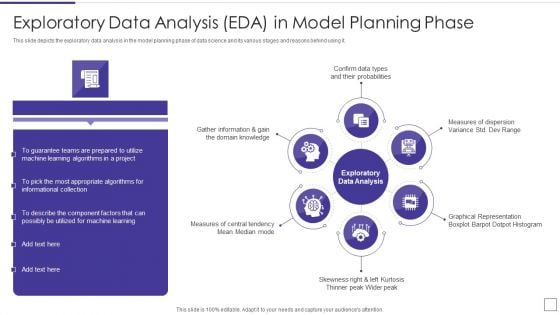
Data Mining Implementation Exploratory Data Analysis EDA In Model Planning Phase Infographics PDF
This slide depicts the exploratory data analysis in the model planning phase of data science and its various stages and reasons behind using it.This is a data mining implementation exploratory data analysis eda in model planning phase infographics pdf template with various stages. Focus and dispense information on six stages using this creative set, that comes with editable features. It contains large content boxes to add your information on topics like confirm data types and their probabilities, domain knowledge, measures of central tendency You can also showcase facts, figures, and other relevant content using this PPT layout. Grab it now.
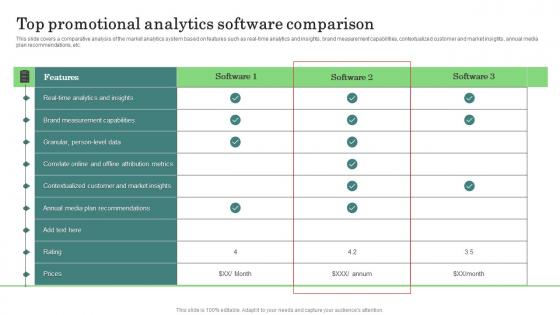
Top Promotional Analytics Major Promotional Analytics Future Trends Diagrams Pdf
This slide covers a comparative analysis of the market analytics system based on features such as real time analytics and insights, brand measurement capabilities, contextualized customer and market insights, annual media plan recommendations, etc. Do you know about Slidesgeeks Top Promotional Analytics Major Promotional Analytics Future Trends Diagrams Pdf These are perfect for delivering any kind od presentation. Using it, create PowerPoint presentations that communicate your ideas and engage audiences. Save time and effort by using our pre designed presentation templates that are perfect for a wide range of topic. Our vast selection of designs covers a range of styles, from creative to business, and are all highly customizable and easy to edit. Download as a PowerPoint template or use them as Google Slides themes. This slide covers a comparative analysis of the market analytics system based on features such as real time analytics and insights, brand measurement capabilities, contextualized customer and market insights, annual media plan recommendations, etc.
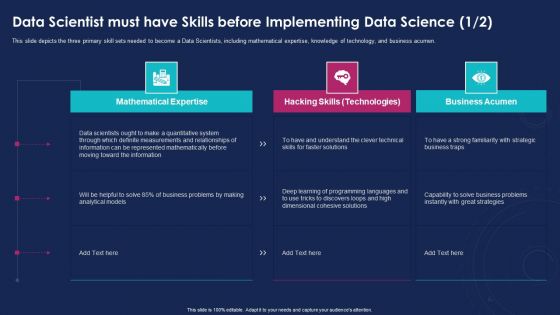
Data Analytics IT Data Scientist Must Have Skills Before Implementing Ppt Inspiration Tips PDF
This slide depicts the three primary skill sets needed to become a Data Scientists, including mathematical expertise, knowledge of technology, and business acumen. Deliver an awe inspiring pitch with this creative data analytics it data scientist must have skills before implementing ppt inspiration tips pdf bundle. Topics like mathematical expertise, knowledge of technology, business acumen can be discussed with this completely editable template. It is available for immediate download depending on the needs and requirements of the user.
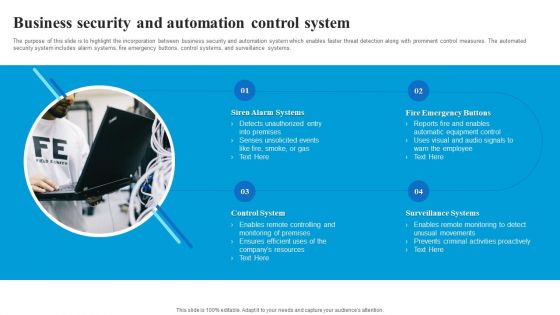
Business Security And Automation Control System Demonstration PDF
The purpose of this slide is to highlight the incorporation between business security and automation system which enables faster threat detection along with prominent control measures. The automated security system includes alarm systems, fire emergency buttons, control systems, and surveillance systems. Persuade your audience using this Business Security And Automation Control System Demonstration PDF. This PPT design covers four stages, thus making it a great tool to use. It also caters to a variety of topics including Siren Alarm Systems, Fire Emergency Buttons, Surveillance Systems, Control System. Download this PPT design now to present a convincing pitch that not only emphasizes the topic but also showcases your presentation skills.
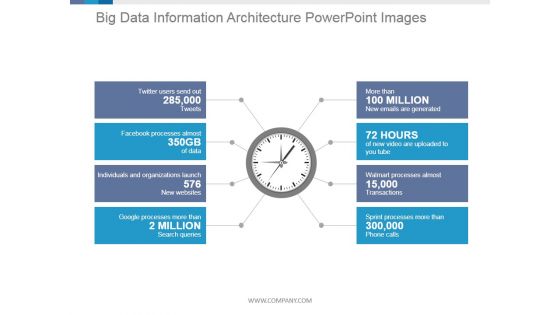
Big Data Information Architecture Ppt PowerPoint Presentation Graphics
This is a big data information architecture ppt powerpoint presentation graphics. This is a eight stage process. The stages in this process are clock, measurement, business, marketing, management.
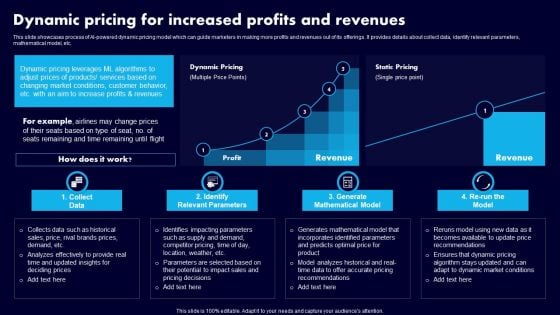
Dynamic Pricing For Increased Profits And Revenues Ppt Portfolio Picture PDF
This slide showcases process of AI-powered dynamic pricing model which can guide marketers in making more profits and revenues out of its offerings. It provides details about collect data, identify relevant parameters, mathematical model, etc. Want to ace your presentation in front of a live audience Our Dynamic Pricing For Increased Profits And Revenues Ppt Portfolio Picture PDF can help you do that by engaging all the users towards you.. Slidegeeks experts have put their efforts and expertise into creating these impeccable powerpoint presentations so that you can communicate your ideas clearly. Moreover, all the templates are customizable, and easy-to-edit and downloadable. Use these for both personal and commercial use.
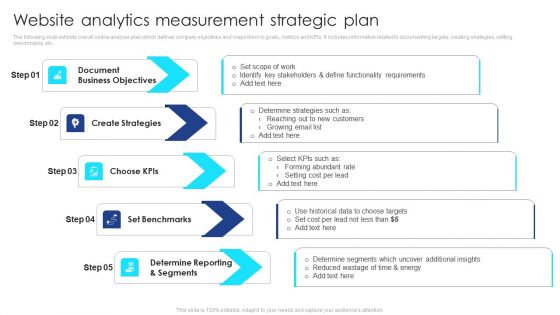
Website Analytics Measurement Strategic Plan Diagrams PDF
The following slide exhibits overall online analysis plan which defines company objectives and maps them to goals, metrics and KPIs. It includes information related to documenting targets, creating strategies, setting benchmarks, etc. Presenting Website Analytics Measurement Strategic Plan Diagrams PDF to dispense important information. This template comprises five stages. It also presents valuable insights into the topics including Document Business Objectives, Create Strategies, Choose Kpis, Set Benchmarks, Determine Reporting And Segments. This is a completely customizable PowerPoint theme that can be put to use immediately. So, download it and address the topic impactfully.
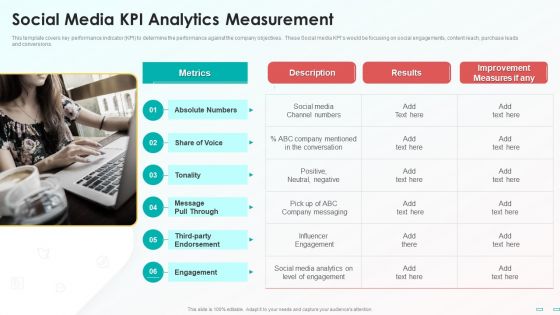
Social Media Kpi Analytics Measurement Demonstration PDF
This template covers key performance indicator KPI to determine the performance against the company objectives. These Social media KPIs would be focusing on social engagements, content reach, purchase leads and conversions. Presenting Social Media Kpi Analytics Measurement Demonstration PDF to provide visual cues and insights. Share and navigate important information on one stages that need your due attention. This template can be used to pitch topics like Metrics, Social Media, Improvement Measures. In addtion, this PPT design contains high resolution images, graphics, etc, that are easily editable and available for immediate download.
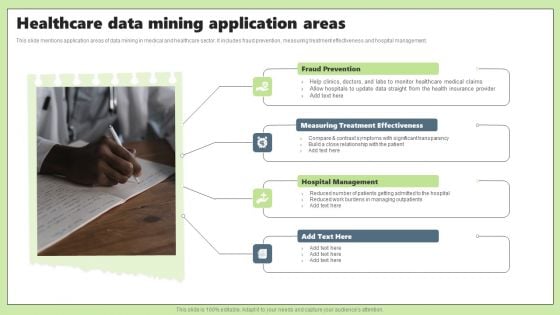
Healthcare Data Mining Application Areas Ppt PowerPoint Presentation Professional Slide Portrait PDF
This slide mentions application areas of data mining in medical and healthcare sector. It includes fraud prevention, measuring treatment effectiveness and hospital management.Persuade your audience using this Healthcare Data Mining Application Areas Ppt PowerPoint Presentation Professional Slide Portrait PDF. This PPT design covers four stages, thus making it a great tool to use. It also caters to a variety of topics including Fraud Prevention, Measuring Treatment, Hospital Management. Download this PPT design now to present a convincing pitch that not only emphasizes the topic but also showcases your presentation skills.
Data Interpretation Icon To Measure Business Growth Background Pdf
This slide depicts the project management streamline of data analytics on daily basis by setting different target days.Pitch your topic with ease and precision using this Data Interpretation Icon To Measure Business Growth Background Pdf This layout presents information on Data Interpretation, Project Management, Gantt Chart It is also available for immediate download and adjustment. So, changes can be made in the color, design, graphics or any other component to create a unique layout. This slide depicts the project management streamline of data analytics on daily basis by setting different target days.
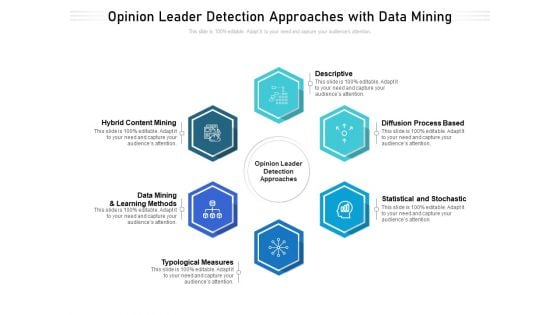
Opinion Leader Detection Approaches With Data Mining Ppt PowerPoint Presentation Gallery Background Image PDF
Presenting opinion leader detection approaches with data mining ppt powerpoint presentation gallery background image pdf to dispense important information. This template comprises six stages. It also presents valuable insights into the topics including descriptive, typological measures, statistical and stochastic. This is a completely customizable PowerPoint theme that can be put to use immediately. So, download it and address the topic impactfully.
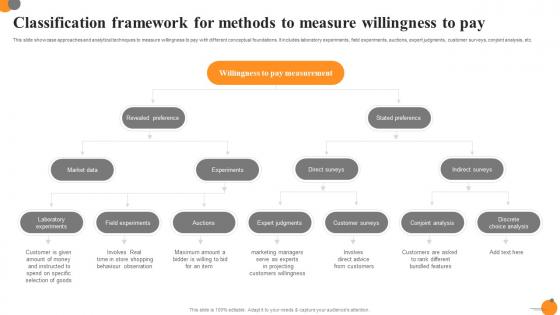
Classification Framework For Methods To Measure Willingness To Pay Ppt Layouts Demonstration Pdf
This slide showcase approaches and analytical techniques to measure willingness to pay with different conceptual foundations. It includes laboratory experiments, field experiments, auctions, expert judgments, customer surveys, conjoint analysis, etc. Showcasing this set of slides titled Classification Framework For Methods To Measure Willingness To Pay Ppt Layouts Demonstration Pdf. The topics addressed in these templates are Field Experiments, Auctions, Expert Judgments. All the content presented in this PPT design is completely editable. Download it and make adjustments in color, background, font etc. as per your unique business setting. This slide showcase approaches and analytical techniques to measure willingness to pay with different conceptual foundations. It includes laboratory experiments, field experiments, auctions, expert judgments, customer surveys, conjoint analysis, etc.
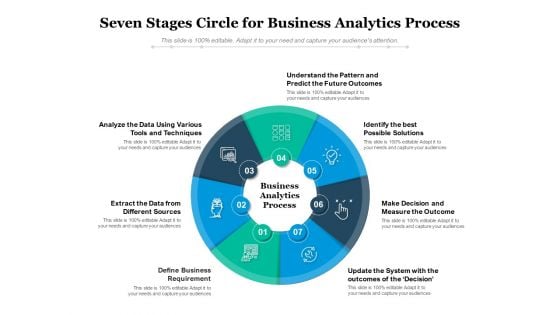
Seven Stages Circle For Business Analytics Process Ppt PowerPoint Presentation Ideas Example PDF
Presenting this set of slides with name seven stages circle for business analytics process ppt powerpoint presentation ideas example pdf. This is a seven stage process. The stages in this process are understand the pattern and predict the future outcomes, identify the best possible solutions, make decision and measure the outcome, update the system with the outcomes of the decision, define business requirement, extract the data from different sources, analyze the data using various tools and techniques. This is a completely editable PowerPoint presentation and is available for immediate download. Download now and impress your audience.
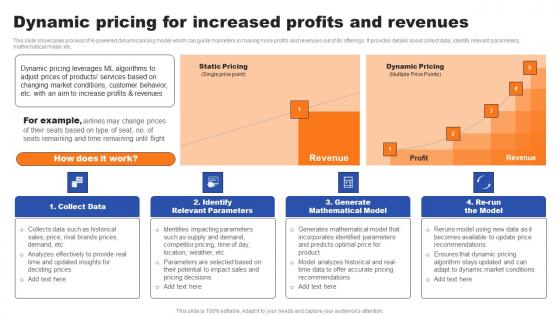
Dynamic Pricing For Increased Profits And Revenues Ppt Gallery Show Pdf
This slide showcases process of AI-powered dynamic pricing model which can guide marketers in making more profits and revenues out of its offerings. It provides details about collect data, identify relevant parameters, mathematical model, etc. Want to ace your presentation in front of a live audience Our Dynamic Pricing For Increased Profits And Revenues Ppt Gallery Show Pdf can help you do that by engaging all the users towards you.. Slidegeeks experts have put their efforts and expertise into creating these impeccable powerpoint presentations so that you can communicate your ideas clearly. Moreover, all the templates are customizable, and easy-to-edit and downloadable. Use these for both personal and commercial use. This slide showcases process of AI-powered dynamic pricing model which can guide marketers in making more profits and revenues out of its offerings. It provides details about collect data, identify relevant parameters, mathematical model, etc.
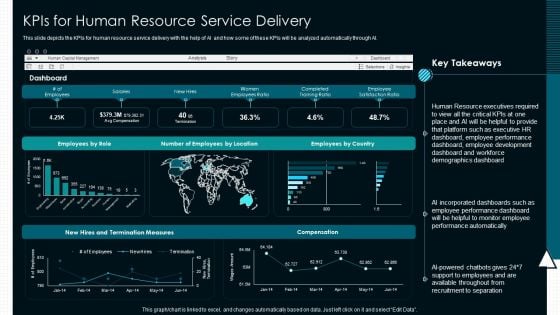
Optimize Service Delivery With Enhanced Kpis For Human Resource Service Delivery Pictures PDF
This slide depicts the KPIs for human resource service delivery with the help of AI and how some of these KPIs will be analyzed automatically through AI.Deliver and pitch your topic in the best possible manner with this Optimize Service Delivery With Enhanced Kpis For Human Resource Service Delivery Pictures PDF. Use them to share invaluable insights on Termination Measures, Employees Location, Women Employees and impress your audience. This template can be altered and modified as per your expectations. So, grab it now.
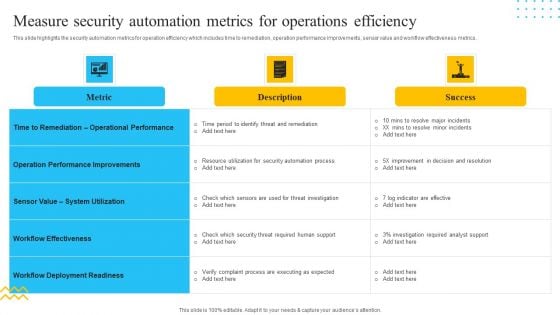
IT Security Automation Tools Integration Measure Security Automation Metrics For Operations Template PDF
This slide highlights the security automation metrics for operation efficiency which includes time to remediation, operation performance improvements, sensor value and workflow effectiveness metrics. Deliver and pitch your topic in the best possible manner with this IT Security Automation Tools Integration Measure Security Automation Metrics For Operations Template PDF. Use them to share invaluable insights on Metric, Operation Performance Improvements, Success and impress your audience. This template can be altered and modified as per your expectations. So, grab it now.
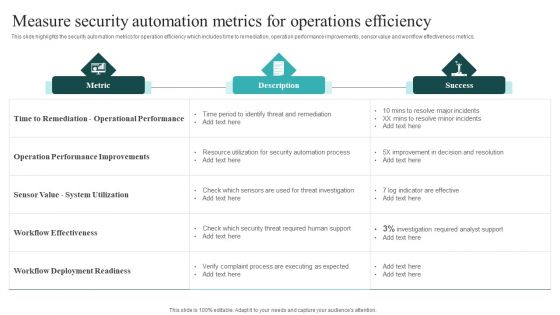
IT Security Automation Systems Guide Measure Security Automation Metrics For Operations Efficiency Mockup PDF
This slide highlights the security automation metrics for operation efficiency which includes time to remediation, operation performance improvements, sensor value and workflow effectiveness metrics. Crafting an eye catching presentation has never been more straightforward. Let your presentation shine with this tasteful yet straightforward IT Security Automation Systems Guide Measure Security Automation Metrics For Operations Efficiency Mockup PDF template. It offers a minimalistic and classy look that is great for making a statement. The colors have been employed intelligently to add a bit of playfulness while still remaining professional. Construct the ideal IT Security Automation Systems Guide Measure Security Automation Metrics For Operations Efficiency Mockup PDF that effortlessly grabs the attention of your audience Begin now and be certain to wow your customers.

 Home
Home