Manufacturing Icon
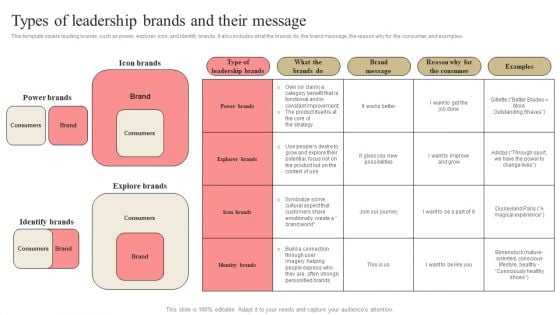
Developing Market Leading Businesses Types Of Leadership Brands And Their Message Guidelines PDF
This template covers leading brands, such as power, explorer, icon, and identify brands. It also includes what the brands do, the brand message, the reason why for the consumer, and examples. This Developing Market Leading Businesses Types Of Leadership Brands And Their Message Guidelines PDF is perfect for any presentation, be it in front of clients or colleagues. It is a versatile and stylish solution for organizing your meetings. The product features a modern design for your presentation meetings. The adjustable and customizable slides provide unlimited possibilities for acing up your presentation. Slidegeeks has done all the homework before launching the product for you. So, do not wait, grab the presentation templates today
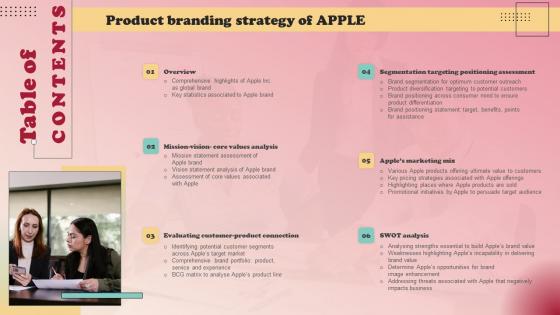
Table Of Contents Product Branding Strategy Of Apple Themes Pdf
From laying roadmaps to briefing everything in detail, our templates are perfect for you. You can set the stage with your presentation slides. All you have to do is download these easy-to-edit and customizable templates. Table Of Contents Product Branding Strategy Of Apple Themes Pdf will help you deliver an outstanding performance that everyone would remember and praise you for. Do download this presentation today. Our Table Of Contents Product Branding Strategy Of Apple Themes Pdf are topically designed to provide an attractive backdrop to any subject. Use them to look like a presentation pro.
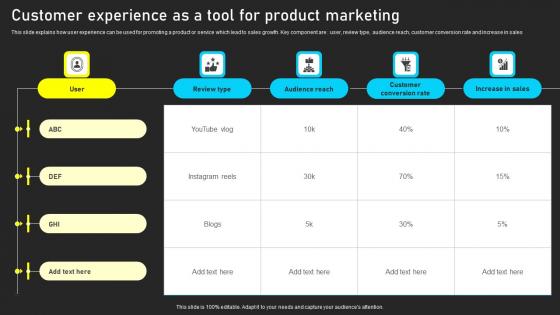
Customer Experience As A Tool For Product Marketing Themes Pdf
This slide explains how user experience can be used for promoting a product or service which lead to sales growth. Key component are user, review type, audience reach, customer conversion rate and increase in sales Showcasing this set of slides titled Customer Experience As A Tool For Product Marketing Themes Pdf. The topics addressed in these templates are Audience Reach, Customer Conversion Rate, Increase In Sales. All the content presented in this PPT design is completely editable. Download it and make adjustments in color, background, font etc. as per your unique business setting. This slide explains how user experience can be used for promoting a product or service which lead to sales growth. Key component are user, review type, audience reach, customer conversion rate and increase in sales

Event Advertising Plan Calendar For Product Launch Themes Pdf
This slide presents an event promotion planning calendar to schedule all necessary tasks to effectively advertise organization products and services. It includes promotional channels such as email marketing, public relations, website, facebook, twitter, etc. Pitch your topic with ease and precision using this Event Advertising Plan Calendar For Product Launch Themes Pdf. This layout presents information on Email Marketing, Public Relations, Event Promotion Plan. It is also available for immediate download and adjustment. So, changes can be made in the color, design, graphics or any other component to create a unique layout. This slide presents an event promotion planning calendar to schedule all necessary tasks to effectively advertise organization products and services. It includes promotional channels such as email marketing, public relations, website, facebook, twitter, etc.
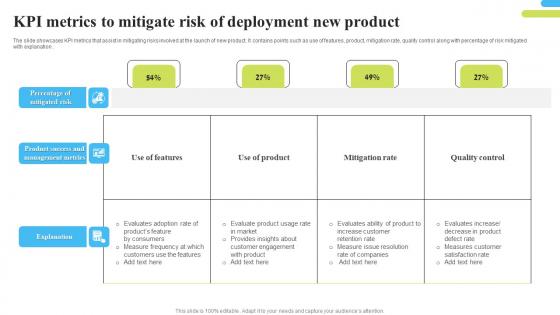
Kpi Metrics To Mitigate Risk Of Deployment New Product Themes Pdf
The slide showcases KPI metrics that assist in mitigating risks involved at the launch of new product. It contains points such as use of features, product, mitigation rate, quality control along with percentage of risk mitigated with explanation. Showcasing this set of slides titled Kpi Metrics To Mitigate Risk Of Deployment New Product Themes Pdf. The topics addressed in these templates are KPI Metrics To Mitigate Risk, Deployment New Product, Quality Control. All the content presented in this PPT design is completely editable. Download it and make adjustments in color, background, font etc. as per your unique business setting. The slide showcases KPI metrics that assist in mitigating risks involved at the launch of new product. It contains points such as use of features, product, mitigation rate, quality control along with percentage of risk mitigated with explanation.
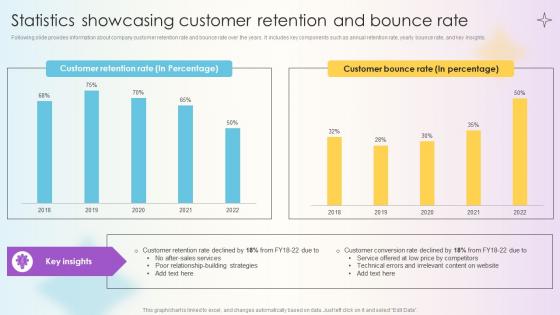
Managing Technical And Non Technical Statistics Showcasing Customer Retention
Following slide provides information about company customer retention rate and bounce rate over the years. It includes key components such as annual retention rate, yearly bounce rate, and key insights. If your project calls for a presentation, then Slidegeeks is your go-to partner because we have professionally designed, easy-to-edit templates that are perfect for any presentation. After downloading, you can easily edit Managing Technical And Non Technical Statistics Showcasing Customer Retention and make the changes accordingly. You can rearrange slides or fill them with different images. Check out all the handy templates Following slide provides information about company customer retention rate and bounce rate over the years. It includes key components such as annual retention rate, yearly bounce rate, and key insights.
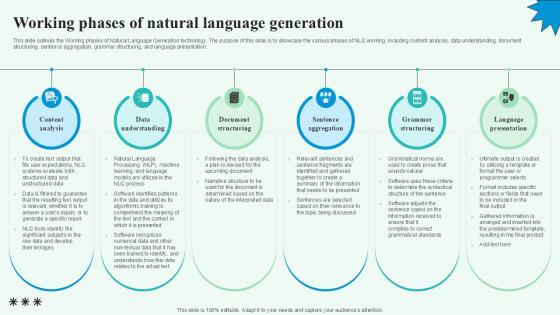
Working Phases Of Natural Automated Content Generation PPT Sample
This slide outlines the Working phases of Natural Language Generation technology. The purpose of this slide is to showcase the various phases of NLG working, including content analysis, data understanding, document structuring, sentence aggregation, grammar structuring, and language presentation. The best PPT templates are a great way to save time, energy, and resources. Slidegeeks have 100 percent editable powerpoint slides making them incredibly versatile. With these quality presentation templates, you can create a captivating and memorable presentation by combining visually appealing slides and effectively communicating your message. Download Working Phases Of Natural Automated Content Generation PPT Sample from Slidegeeks and deliver a wonderful presentation. This slide outlines the Working phases of Natural Language Generation technology. The purpose of this slide is to showcase the various phases of NLG working, including content analysis, data understanding, document structuring, sentence aggregation, grammar structuring, and language presentation.
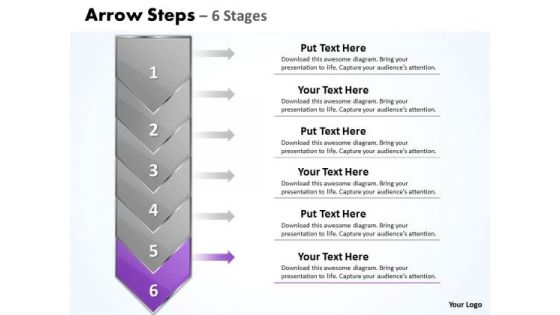
Business Ppt Theme Arrow 6 Phase Diagram 1 Project Management PowerPoint 7 Graphic
We present our Business PPT Theme arrow 6 phase diagram 1 project management PowerPoint 7 Graphic. Use our Arrows PowerPoint Templates because, you have the moves to sway the market. Use our Process and Flows PowerPoint Templates because, you know your business and have a vision for it. Use our Business PowerPoint Templates because, Marketing Strategy Business Template: - Maximizing sales of your product is the intended destination. Use our Marketing PowerPoint Templates because; Highlight the various ways in which we can maintain its efficiency. Use our Shapes PowerPoint Templates because, you understand the illness and its causes. Use these PowerPoint slides for presentations relating to Arrow, Background, Business, Chart, Diagram, Financial, Graphic, Gray, Icon, Illustration, Management, Orange, Perspective, Process, Reflection, Stage, Steps, Text, Transparency. The prominent colors used in the PowerPoint template are Purple, Gray, and White Our Business Ppt Theme Arrow 6 Phase Diagram 1 Project Management PowerPoint 7 Graphic are definitely new age. Ring in overdue changes with your ideas.
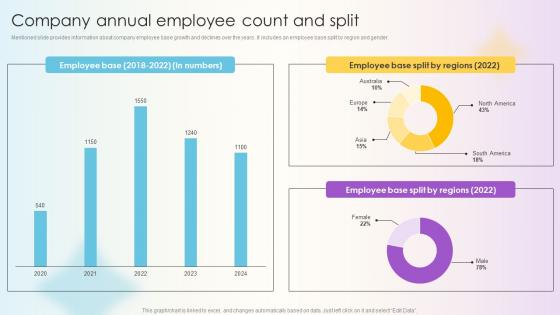
Managing Technical And Non Company Annual Employee Count And Split
Mentioned slide provides information about company employee base growth and declines over the years. It includes an employee base split by region and gender. Whether you have daily or monthly meetings, a brilliant presentation is necessary. Managing Technical And Non Company Annual Employee Count And Split can be your best option for delivering a presentation. Represent everything in detail using Managing Technical And Non Company Annual Employee Count And Split and make yourself stand out in meetings. The template is versatile and follows a structure that will cater to your requirements. All the templates prepared by Slidegeeks are easy to download and edit. Our research experts have taken care of the corporate themes as well. So, give it a try and see the results. Mentioned slide provides information about company employee base growth and declines over the years. It includes an employee base split by region and gender.
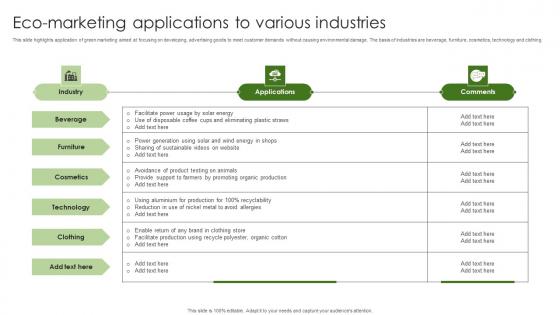
Eco Marketing Applications To Various Industries Themes Pdf
This slide highlights application of green marketing aimed at focusing on developing, advertising goods to meet customer demands without causing environmental damage. The basis of industries are beverage, furniture, cosmetics, technology and clothing. Pitch your topic with ease and precision using this Eco Marketing Applications To Various Industries Themes Pdf. This layout presents information on Industry, Applications, Comments. It is also available for immediate download and adjustment. So, changes can be made in the color, design, graphics or any other component to create a unique layout. This slide highlights application of green marketing aimed at focusing on developing, advertising goods to meet customer demands without causing environmental damage. The basis of industries are beverage, furniture, cosmetics, technology and clothing.
Ppt Circular Application Of 5 Create PowerPoint Macro Involved Procedure Templates
PPT circular application of 5 create powerpoint macro involved procedure Templates-This chart visualize the process steps, reoccurrences and components or of your company structure or product features. These premium graphics are especially suitable for chronologies, sequences.-PPT circular application of 5 create powerpoint macro involved procedure Templates-Abstract, Art, Artistic, Backdrop, Background, Bend, Black, Business, Circle, Copy-Space, Create, Design, Dot, Dotted, Draw, Element, Flower, Gradient, Grid, Icon, Illustration, Leaf, Leaves, Logo, Mold, Motif, Nature, Pattern, Petal, Radiate, Retro, Round Our Ppt Circular Application Of 5 Create PowerPoint Macro Involved Procedure Templates team exert themselves. They put in all the effort for you.
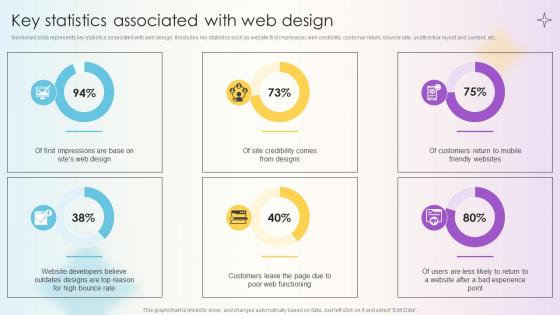
Managing Technical And Non Technical Key Statistics Associated With Web Design
Mentioned slide represents key statistics associated with web design. It includes key statistics such as website first impression, web credibility, customer return, bounce rate, unattractive layout and content, etc. Find highly impressive Managing Technical And Non Technical Key Statistics Associated With Web Design on Slidegeeks to deliver a meaningful presentation. You can save an ample amount of time using these presentation templates. No need to worry to prepare everything from scratch because Slidegeeks experts have already done a huge research and work for you. You need to download Managing Technical And Non Technical Key Statistics Associated With Web Design for your upcoming presentation. All the presentation templates are 100 percent editable and you can change the color and personalize the content accordingly. Download now Mentioned slide represents key statistics associated with web design. It includes key statistics such as website first impression, web credibility, customer return, bounce rate, unattractive layout and content, etc.
PowerPoint Arrow Shapes Comparison Process Ppt Templates Backgrounds For Slides
3d, accounting, arrow, art, bar, blue, business, calculation, chart, collection, company, design elements, diagram, directive, expense, finance, firm, forecast, future, gain, graph, grow, growth, icon, illustration, income, line, market, measure, objects, office, profit, progress, rate, set, statistic, stock, success, two, up, vector, yellow Get on the list of audience favourites. Experience adulation with our PowerPoint Arrow Shapes Comparison Process Ppt Templates Backgrounds For Slides.
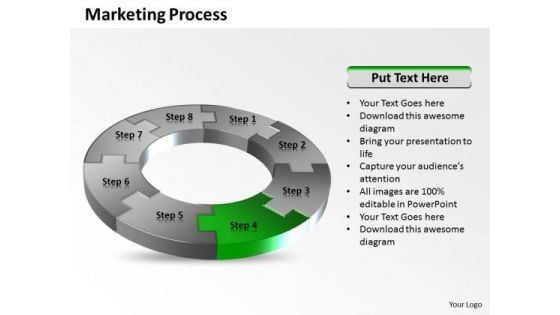
Ppt Important Eight PowerPoint Slide Numbers Of Marketing Process Templates
PPT important eight powerpoint slide numbers of marketing process Templates-Maximizing sales of your product is the intended destination. Evolve the strategy to take you down the required path with appropriate, efficient and effective marketing along the way.Activate the minds of your team with your ideas. -PPT important eight powerpoint slide numbers of marketing process Templates-Arrows, Background, Business, Chart, Circle, Circular, Financial, Flow, Graphic, Gray, Icon, Illustration, Isometric, Perspective, Process, Recycle, Round, Shape, Flow, Marketing, Leadership, Steps Cultivate the audience with our Ppt Important Eight PowerPoint Slide Numbers Of Marketing Process Templates. The bond between you will grow.
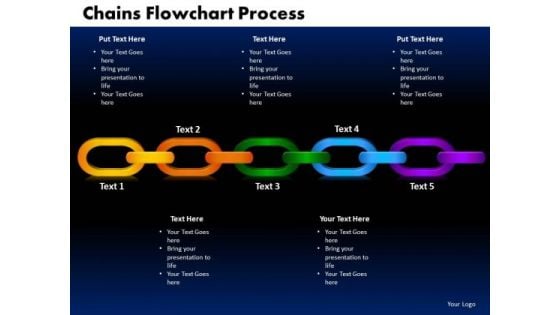
PowerPoint Design Chains Flowchart Process Success Ppt Slide Designs
PowerPoint Design Chains Flowchart Process Success PPT Slide Designs-Most events and in every aspect of life are invariably interlinked. Use this chains graphic to outline your thoughts and their inherent interdependance to acheive the final outcome. Highlight the strength and durability of your thoughts, ideas and products-PowerPoint Design Chains Flowchart Process Success PPT Slide Designs-This ppt can be used for presentations relating to-3d, Abstract, Arms, Background, Border, Boundary, Chain, Chrome, Circle, Circular, Concept, Connect, Connection, Copy-Space, Design, Element, Emblem, Empty, Frame, Heraldic, Icon, Illustration, Image, Industry Laugh in the face of difficulty with our PowerPoint Design Chains Flowchart Process Success Ppt Slide Designs. They help you take on any adversity.
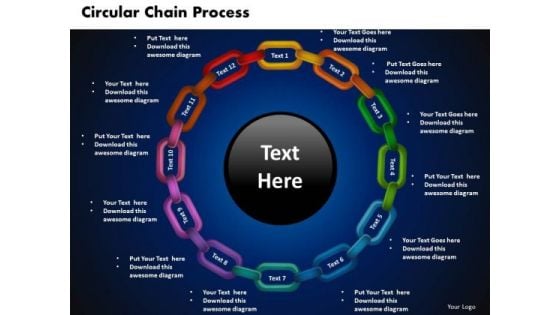
PowerPoint Design Circular Chain Process Teamwork Ppt Designs
PowerPoint Design Circular Chain Process Teamwork PPT Designs-Most events and in every aspect of life are invariably interlinked. Use this chains graphic to outline your thoughts and their inherent interdependance to acheive the final outcome. Highlight the strength and durability of your thoughts, ideas and products-PowerPoint Design Circular Chain Process Teamwork PPT Designs-This ppt can be used for presentations relating to-3d, Abstract, Arms, Background, Border, Boundary, Chain, Chrome, Circle, Circular, Concept, Connect, Connection, Copy-Space, Design, Element, Emblem, Empty, Frame, Heraldic, Icon, Illustration, Image, Industry Exceed estimates with our PowerPoint Design Circular Chain Process Teamwork Ppt Designs. Your ideas will deliver a breakthrough.
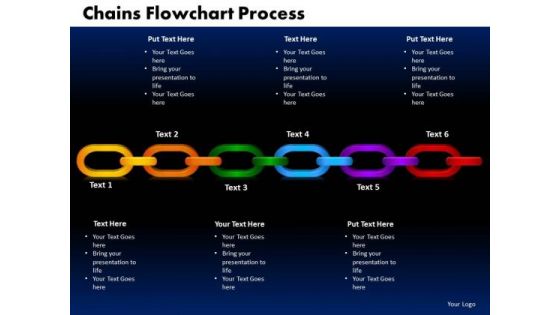
PowerPoint Designs Chains Flowchart Process Business Ppt Slides
PowerPoint Designs Chains Flowchart Process Business PPT Slides-Most events and in every aspect of life are invariably interlinked. Use this chains graphic to outline your thoughts and their inherent interdependance to acheive the final outcome. Highlight the strength and durability of your thoughts, ideas and products-PowerPoint Designs Chains Flowchart Process Business PPT Slides-This ppt can be used for presentations relating to-3d, Abstract, Arms, Background, Border, Boundary, Chain, Chrome, Circle, Circular, Concept, Connect, Connection, Copy-Space, Design, Element, Emblem, Empty, Frame, Heraldic, Icon, Illustration, Image, Industry Expand the envelope with our PowerPoint Designs Chains Flowchart Process Business Ppt Slides. Aspire and achieve with your ideas.
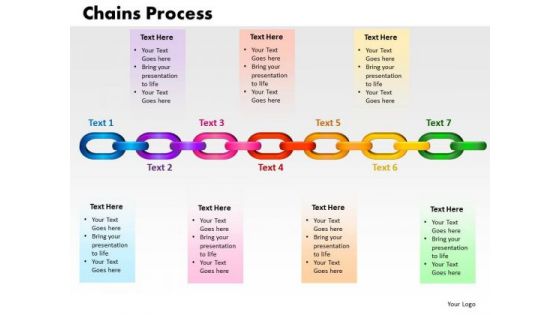
PowerPoint Designs Chains Process Teamwork Ppt Slides
PowerPoint Designs Chains Process Teamwork PPT Slides-Most events and in every aspect of life are invariably interlinked. Use this chains graphic to outline your thoughts and their inherent interdependance to acheive the final outcome. Highlight the strength and durability of your thoughts, ideas and products-PowerPoint Designs Chains Process Teamwork PPT Slides-This ppt can be used for presentations relating to-3d, Abstract, Arms, Background, Border, Boundary, Chain, Chrome, Circle, Circular, Concept, Connect, Connection, Copy-Space, Design, Element, Emblem, Empty, Frame, Heraldic, Icon, Illustration, Image, Industry Bet a quid on our PowerPoint Designs Chains Process Teamwork Ppt Slides. You will end up a 49er.
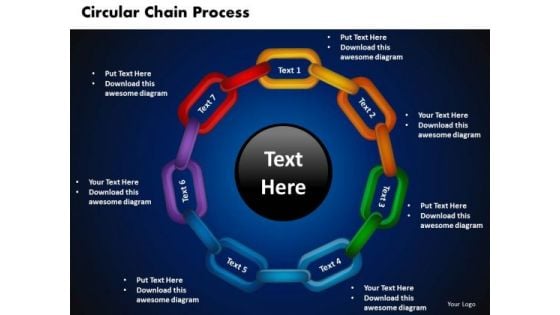
PowerPoint Slide Designs Circular Chain Flowchart Process
PowerPoint Slide Designs Circular Chain Flowchart Process-Most events and in every aspect of life are invariably interlinked. Use this chains graphic to outline your thoughts and their inherent interdependance to acheive the final outcome. Highlight the strength and durability of your thoughts, ideas and products-PowerPoint Slide Designs Circular Chain Flowchart Process-This ppt can be used for presentations relating to-3d, Abstract, Arms, Background, Border, Boundary, Chain, Chrome, Circle, Circular, Concept, Connect, Connection, Copy-Space, Design, Element, Emblem, Empty, Frame, Heraldic, Icon, Illustration, Image, Industry Your ideas will start a new epoch in your field. Take the first steps with our PowerPoint Slide Designs Circular Chain Flowchart Process.
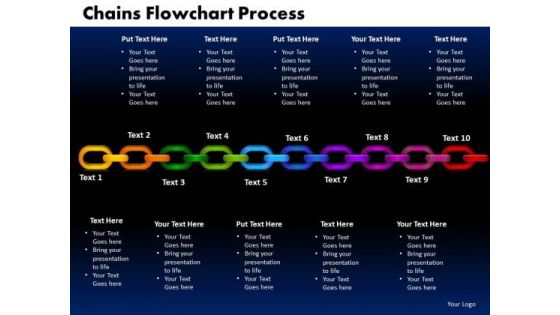
PowerPoint Templates Chains Flowchart Process Success Ppt Presentation
PowerPoint Templates Chains Flowchart Process Success PPT Presentation-Most events and in every aspect of life are invariably interlinked. Use this chains graphic to outline your thoughts and their inherent interdependance to acheive the final outcome. Highlight the strength and durability of your thoughts, ideas and products-PowerPoint Templates Chains Flowchart Process Success PPT Presentation-This ppt can be used for presentations relating to-3d, Abstract, Arms, Background, Border, Boundary, Chain, Chrome, Circle, Circular, Concept, Connect, Connection, Copy-Space, Design, Element, Emblem, Empty, Frame, Heraldic, Icon, Illustration, Image, Industry Challenge old thoughts with our PowerPoint Templates Chains Flowchart Process Success Ppt Presentation. You will come out on top.
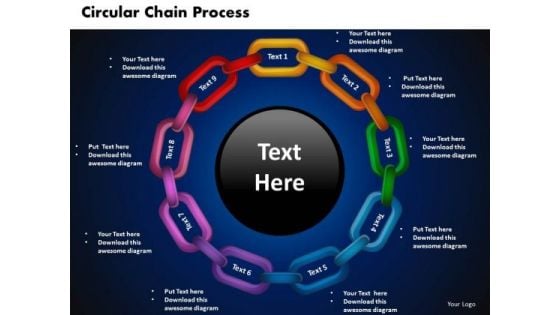
PowerPoint Templates Circular Chain Process Leadership Ppt Slides
PowerPoint Templates Circular Chain Process Leadership PPT Slides-Most events and in every aspect of life are invariably interlinked. Use this chains graphic to outline your thoughts and their inherent interdependance to acheive the final outcome. Highlight the strength and durability of your thoughts, ideas and products-PowerPoint Templates Circular Chain Process Leadership PPT Slides-This ppt can be used for presentations relating to-3d, Abstract, Arms, Background, Border, Boundary, Chain, Chrome, Circle, Circular, Concept, Connect, Connection, Copy-Space, Design, Element, Emblem, Empty, Frame, Heraldic, Icon, Illustration, Image, Industry Our PowerPoint Templates Circular Chain Process Leadership Ppt Slides are pretty fancy. Their color combinations are fairly charming.

SEO Strategic Plan For Healthcare Industry Training Ppt
Presenting SEO Strategic Plan for Healthcare Industry. These slides are 100 percentage made in PowerPoint and are compatible with all screen types and monitors. They also support Google Slides. Premium Customer Support is available. Suitable for use by managers, employees, and organizations. These slides are easily customizable. Our PowerPoint experts have included all the necessary templates, designs, icons, graphs, and other essential material in the PPT deck.
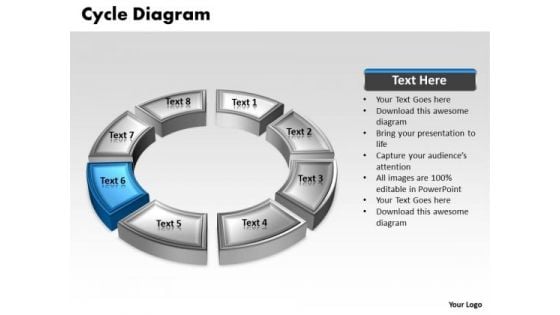
Ppt Navy Blue Animated Text Cycle Diagram PowerPoint Slide Templates
PPT navy blue animated text cycle diagram powerpoint slide Templates-This PowerPoint Diagram will let you express the views about capital and labor, commercialism, market, merchandising, production and distribution, racket, sales, selling, trading, traffic, transaction, undertaking through this blue text cycle.-PPT navy blue animated text cycle diagram powerpoint slide Templates-Abstract, Blank, Business, Chart, Circular, Circulation, Cycle, Design, Diagram, Empty, Executive, Icon, Illustration, Management, Model, Numbers, Organization, Procedure, Process Our Ppt Navy Blue Animated Text Cycle Diagram PowerPoint Slide Templates will fill the bill. They allow you to cover for it all.
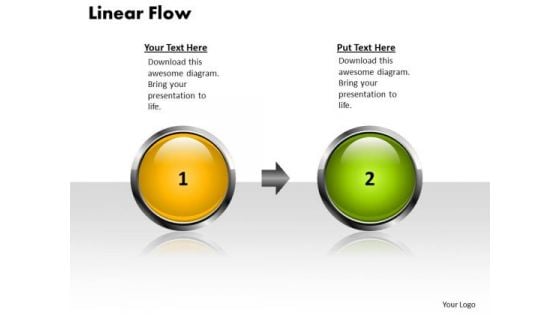
Editable Ppt Theme Linear Flow 2 States Diagram Project Management PowerPoint 1 Image
editable PPT Theme linear flow 2 states diagram project management powerpoint 1 Image-This PowerPoint diagram can be used for product comparison. You can easily edit the size, position, text, color and change any other background style. Create captivating presentations to deliver comparative and weighted arguments.-editable PPT Theme linear flow 2 states diagram project management powerpoint 1 Image-Aim, Arrow, Arrowheads, Badge, Border, Click, Connection, Curve, Design, Direction, Download, Element, Fuchsia, Icon, Illustration, Indicator, Internet, Magenta, Mark, Object, Orientation, Pointer, Shadow, Shape, Sign Our Editable Ppt Theme Linear Flow 2 States Diagram Project Management PowerPoint 1 Image are very falcon like. They keep a sharp eye on the target.
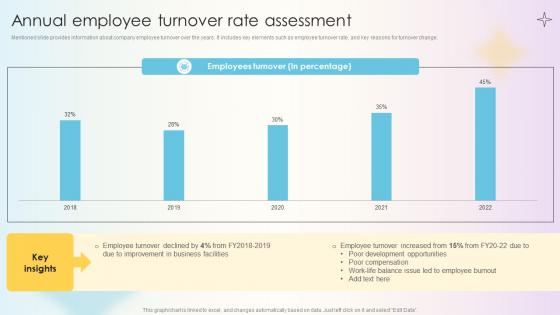
Managing Technical And Non Annual Employee Turnover Rate Assessment
Mentioned slide provides information about company employee turnover over the years. It includes key elements such as employee turnover rate, and key reasons for turnover change. Get a simple yet stunning designed Managing Technical And Non Annual Employee Turnover Rate Assessment. It is the best one to establish the tone in your meetings. It is an excellent way to make your presentations highly effective. So, download this PPT today from Slidegeeks and see the positive impacts. Our easy-to-edit Managing Technical And Non Annual Employee Turnover Rate Assessment can be your go-to option for all upcoming conferences and meetings. So, what are you waiting for Grab this template today. Mentioned slide provides information about company employee turnover over the years. It includes key elements such as employee turnover rate, and key reasons for turnover change.

Managing Technical And Non Customer Engagement And Conversion Rate Evaluation
Mentioned slide provides information business annual customer conversion and engagement rate. It includes key components such as conversion rate, engagement rate, and key insights. Crafting an eye-catching presentation has never been more straightforward. Let your presentation shine with this tasteful yet straightforward Managing Technical And Non Customer Engagement And Conversion Rate Evaluation template. It offers a minimalistic and classy look that is great for making a statement. The colors have been employed intelligently to add a bit of playfulness while still remaining professional. Construct the ideal Managing Technical And Non Customer Engagement And Conversion Rate Evaluation that effortlessly grabs the attention of your audience Begin now and be certain to wow your customers Mentioned slide provides information business annual customer conversion and engagement rate. It includes key components such as conversion rate, engagement rate, and key insights.
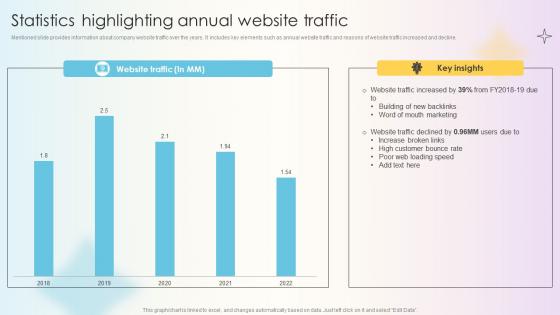
Managing Technical And Non Statistics Highlighting Annual Website Traffic
Mentioned slide provides information about company website traffic over the years. It includes key elements such as annual website traffic and reasons of website traffic increased and decline. Get a simple yet stunning designed Managing Technical And Non Statistics Highlighting Annual Website Traffic. It is the best one to establish the tone in your meetings. It is an excellent way to make your presentations highly effective. So, download this PPT today from Slidegeeks and see the positive impacts. Our easy-to-edit Managing Technical And Non Statistics Highlighting Annual Website Traffic can be your go-to option for all upcoming conferences and meetings. So, what are you waiting for Grab this template today. Mentioned slide provides information about company website traffic over the years. It includes key elements such as annual website traffic and reasons of website traffic increased and decline.
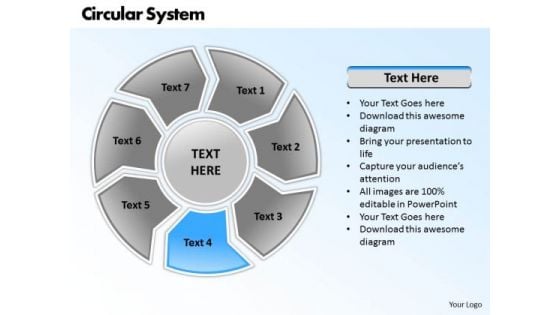
Ppt Circular PowerPoint Menu Template System 7 State Diagram Templates
PPT circular powerpoint menu template system 7 state diagram Templates- This continuous implementation diagram is a graphic representation of all the major steps of a process. This correlative seven stages diagram is a tool that can help your team work productively and successfully. -PPT circular powerpoint menu template system 7 state diagram Templates-Arrow, Art, Blue, Business, Button, Circular, Clip, Design, Diagram, Drop, Element, Glowing, Graph, Graphic, Icon, Illustration, Isolated, Process, Round, Set, Shadow, Sphere, Symbol Balance it out with our Ppt Circular PowerPoint Menu Template System 7 State Diagram Templates. Your suggestions will maintain the equilibrium.
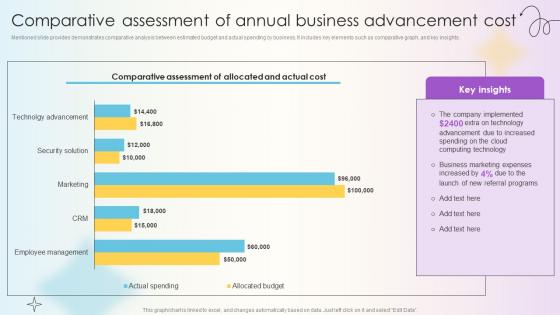
Managing Technical And Non Comparative Assessment Of Annual Business Advancement
Mentioned slide provides demonstrates comparative analysis between estimated budget and actual spending by business. It includes key elements such as comparative graph, and key insights. If your project calls for a presentation, then Slidegeeks is your go-to partner because we have professionally designed, easy-to-edit templates that are perfect for any presentation. After downloading, you can easily edit Managing Technical And Non Comparative Assessment Of Annual Business Advancement and make the changes accordingly. You can rearrange slides or fill them with different images. Check out all the handy templates Mentioned slide provides demonstrates comparative analysis between estimated budget and actual spending by business. It includes key elements such as comparative graph, and key insights.
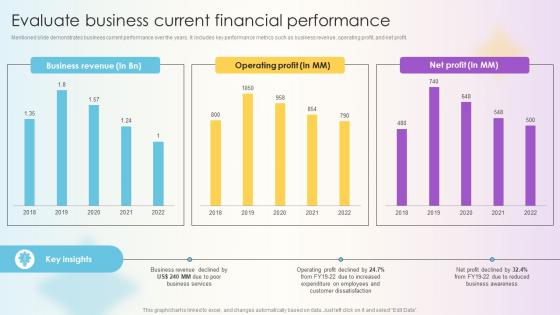
Managing Technical And Non Evaluate Business Current Financial Performance
Mentioned slide demonstrates business current performance over the years. It includes key performance metrics such as business revenue, operating profit, and net profit. The best PPT templates are a great way to save time, energy, and resources. Slidegeeks have 100 percent editable powerpoint slides making them incredibly versatile. With these quality presentation templates, you can create a captivating and memorable presentation by combining visually appealing slides and effectively communicating your message. Download Managing Technical And Non Evaluate Business Current Financial Performance from Slidegeeks and deliver a wonderful presentation. Mentioned slide demonstrates business current performance over the years. It includes key performance metrics such as business revenue, operating profit, and net profit.
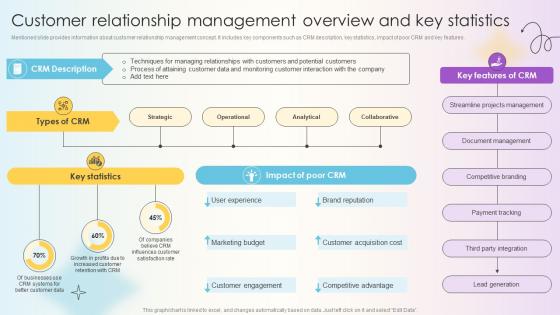
Managing Technical And Non Customer Relationship Management Overview And Key
Mentioned slide provides information about customer relationship management concept. It includes key components such as CRM description, key statistics, impact of poor CRM and key features. Make sure to capture your audiences attention in your business displays with our gratis customizable Managing Technical And Non Customer Relationship Management Overview And Key. These are great for business strategies, office conferences, capital raising or task suggestions. If you desire to acquire more customers for your tech business and ensure they stay satisfied, create your own sales presentation with these plain slides. Mentioned slide provides information about customer relationship management concept. It includes key components such as CRM description, key statistics, impact of poor CRM and key features.
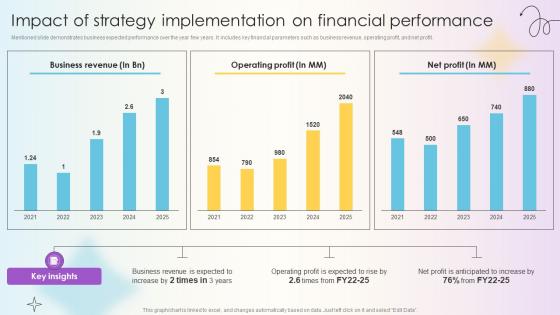
Managing Technical And Non Impact Of Strategy Implementation On Financial
Mentioned slide demonstrates business expected performance over the year few years. It includes key financial parameters such as business revenue, operating profit, and net profit. Slidegeeks has constructed Managing Technical And Non Impact Of Strategy Implementation On Financial after conducting extensive research and examination. These presentation templates are constantly being generated and modified based on user preferences and critiques from editors. Here, you will find the most attractive templates for a range of purposes while taking into account ratings and remarks from users regarding the content. This is an excellent jumping-off point to explore our content and will give new users an insight into our top-notch PowerPoint Templates. Mentioned slide demonstrates business expected performance over the year few years. It includes key financial parameters such as business revenue, operating profit, and net profit.
Managing Technical And Non Various Kpis For Tracking Business Performance
Mentioned slide provide insights into various key performance indicators to determine business performance. It includes KPIs such as business financials, website traffic, customer case, customer engagement, conversion rate, customer retention, customer bounce rate, employee turnover, etc. Make sure to capture your audiences attention in your business displays with our gratis customizable Managing Technical And Non Various Kpis For Tracking Business Performance. These are great for business strategies, office conferences, capital raising or task suggestions. If you desire to acquire more customers for your tech business and ensure they stay satisfied, create your own sales presentation with these plain slides. Mentioned slide provide insights into various key performance indicators to determine business performance. It includes KPIs such as business financials, website traffic, customer case, customer engagement, conversion rate, customer retention, customer bounce rate, employee turnover, etc.
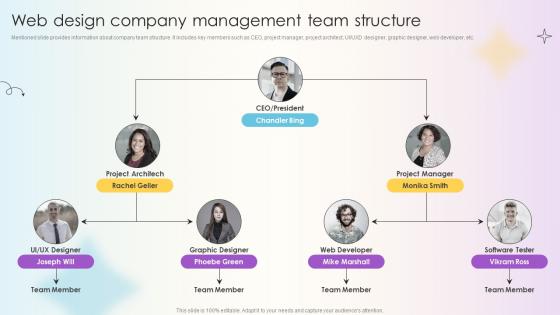
Managing Technical And Non Web Design Company Management Team Structure
Mentioned slide provides information about company team structure. It includes key members such as CEO, project manager, project architect, UI or UXD designer, graphic designer, web developer, etc. Coming up with a presentation necessitates that the majority of the effort goes into the content and the message you intend to convey. The visuals of a PowerPoint presentation can only be effective if it supplements and supports the story that is being told. Keeping this in mind our experts created Managing Technical And Non Web Design Company Management Team Structure to reduce the time that goes into designing the presentation. This way, you can concentrate on the message while our designers take care of providing you with the right template for the situation. Mentioned slide provides information about company team structure. It includes key members such as CEO, project manager, project architect, UI or UXD designer, graphic designer, web developer, etc.
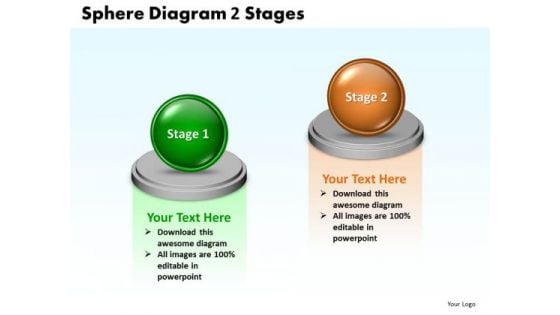
Ppt Sphere Cause And Effect Diagram PowerPoint Template 2 State Templates
PPT sphere cause and effect diagram powerpoint template 2 state Templates-This PPT slide can be used to compare two approaches and evaluate the effectiveness. You can easily insert text to this slide as per your requirement.-PPT sphere cause and effect diagram powerpoint template 2 state Templates-Around, Background, Ball, Big, Blue, Business, Circle, Competition, Competitive, Concept, Contrast, Design, Development, Diagram, Group, Icon, Illustration, Individual, Individuality, Isolated, Leadership, Partnership, Ring, Shapes, Sign, Sphere, Success, Symbol, Team, Teamwork, Wheel Compare products and services with our Ppt Sphere Cause And Effect Diagram PowerPoint Template 2 State Templates. You will come out on top.
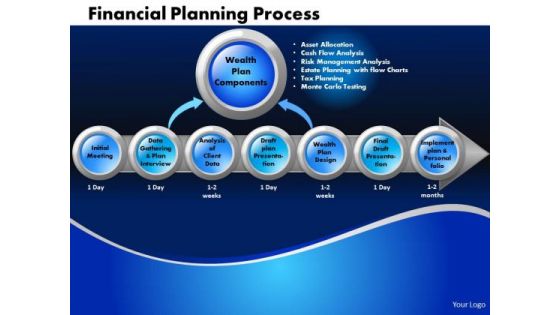
Business Circle Charts PowerPoint Templates Marketing Financial Planning Process Ppt Slides
Business Circle Charts PowerPoint Templates Marketing Financial Planning Process PPT Slides-This circle chart can be used in business, education and economic presentations to help the audience visualize the content better, or to find flaws in a financial planning process.-Business Circle Charts PowerPoint Templates Marketing Financial Planning Process PPT Slides-This template can be used for presentations relating to Abstract, Action, Business, Chart, Commerce, Competitor, Components, Concept, Conceptual, Design, Diagram, Executive, Financial, Goals, Guide, Guidelines, Hierarchy, Icon, Idea, Illustration, Manage, Management, Marketing, Mind, Mission, Model, Operations, Organization, Performance, Plan, Planning, Process Our Business Circle Charts PowerPoint Templates Marketing Financial Planning Process Ppt Slides team are good at their craft. They have chiselled out designer products.
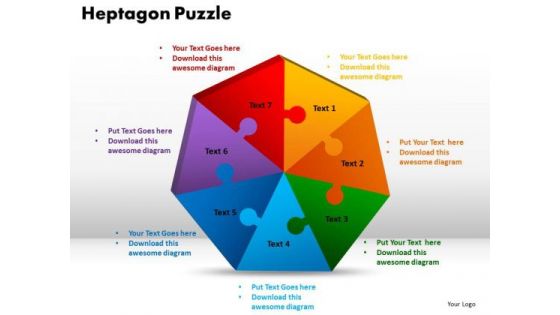
PowerPoint Template Hexagon Puzzle Business Ppt Themes
PowerPoint Template Hexagon Puzzle Business PPT Themes-The business process network are responsible for the total worth of services and products. This Hexagon Puzzle diagarm best describes a value business process network.-PowerPoint Template Hexagon Puzzle Business PPT Themes-Abstract, Black, Business, Puzzle,Process,Chrome, Company, Convex, Design, Distinct, Element, Emblem, Five, Futuristic, Glossy, Grey, Heptagon, Icon, Internet, Metallic, Modern, Name, Pentagon, Perspective, Pictogram, Protuberant, Reflection, Salient, Septangle, Seven, Shadow, Style, Symbol, Vector Dont be a one man team. Make use of our professionals with our PowerPoint Template Hexagon Puzzle Business Ppt Themes. You will be at the top of your game.
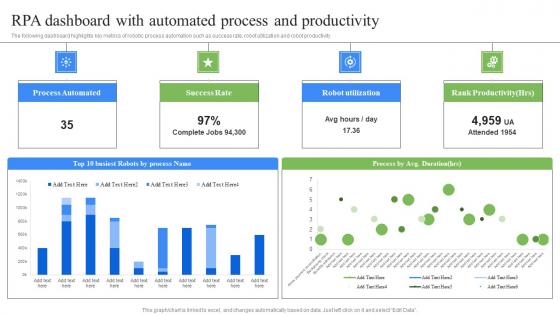
RPA Dashboard With Automated Process RPA Influence On Industries Pictures Pdf
The following dashboard highlights key metrics of robotic process automation such as success rate, robot utilization and robot productivity. Boost your pitch with our creative RPA Dashboard With Automated Process RPA Influence On Industries Pictures Pdf. Deliver an awe-inspiring pitch that will mesmerize everyone. Using these presentation templates you will surely catch everyones attention. You can browse the ppts collection on our website. We have researchers who are experts at creating the right content for the templates. So you do not have to invest time in any additional work. Just grab the template now and use them. The following dashboard highlights key metrics of robotic process automation such as success rate, robot utilization and robot productivity.
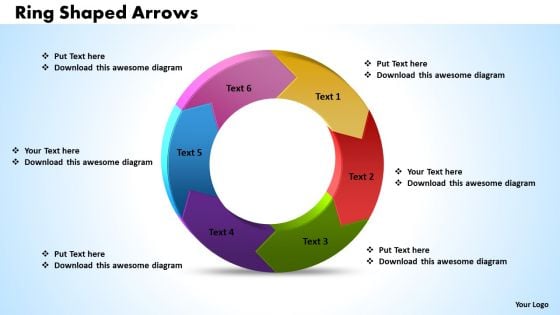
Ppt Power Point Org Chart Shaped Curved Arrows PowerPoint 2010 6 Parts Templates
PPT power point org chart shaped curved arrows powerpoint 2010 6 parts Templates- The above template contains a graphic of Organizational chart that makes employees more productive, helping them understand company strategy and structure.-PPT power point org chart shaped curved arrows powerpoint 2010 6 parts Templates-Abstract, Around, Arrow, Arrow Circles, Chart, Circle, Circular, Circular Arrows, Circular Flow, Circulation, Cycle, Cyclic, Direction, Element, Flow, Icon, Illustration, Isolated, Motion, Movement, Refresh, Ring, Rotation, Round, Section, Set, Shape, Sign, Symbol See your audience react before your very eyes. Our Ppt Power Point Org Chart Shaped Curved Arrows PowerPoint 2010 6 Parts Templates extract positive delight.
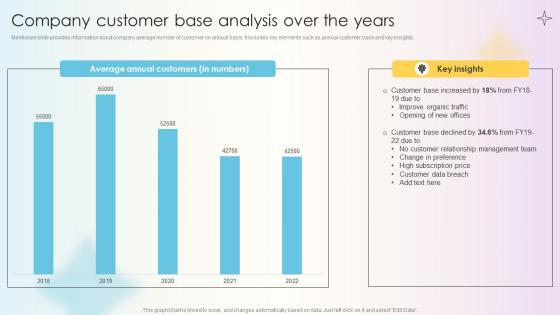
Managing Technical And Non Company Customer Base Analysis Over The Years
Mentioned slide provides information about company average number of customer on annual basis. It includes key elements such as annual customer base and key insights. Find highly impressive Managing Technical And Non Company Customer Base Analysis Over The Years on Slidegeeks to deliver a meaningful presentation. You can save an ample amount of time using these presentation templates. No need to worry to prepare everything from scratch because Slidegeeks experts have already done a huge research and work for you. You need to download Managing Technical And Non Company Customer Base Analysis Over The Years for your upcoming presentation. All the presentation templates are 100 percent editable and you can change the color and personalize the content accordingly. Download now Mentioned slide provides information about company average number of customer on annual basis. It includes key elements such as annual customer base and key insights.
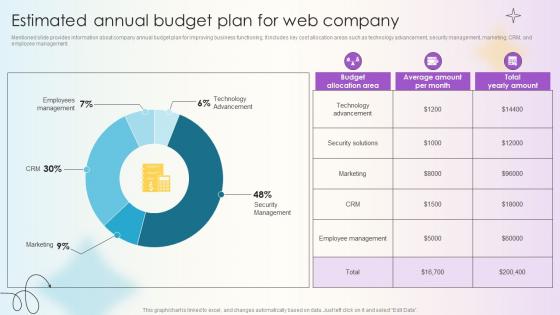
Managing Technical And Non Estimated Annual Budget Plan For Web Company
Mentioned slide provides information about company annual budget plan for improving business functioning. It includes key cost allocation areas such as technology advancement, security management, marketing, CRM, and employee management. Explore a selection of the finest Managing Technical And Non Estimated Annual Budget Plan For Web Company here. With a plethora of professionally designed and pre-made slide templates, you can quickly and easily find the right one for your upcoming presentation. You can use our Managing Technical And Non Estimated Annual Budget Plan For Web Company to effectively convey your message to a wider audience. Slidegeeks has done a lot of research before preparing these presentation templates. The content can be personalized and the slides are highly editable. Grab templates today from Slidegeeks. Mentioned slide provides information about company annual budget plan for improving business functioning. It includes key cost allocation areas such as technology advancement, security management, marketing, CRM, and employee management.
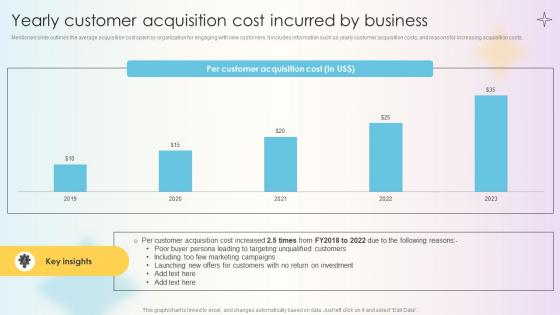
Managing Technical And Non Yearly Customer Acquisition Cost Incurred By Business
Mentioned slide outlines the average acquisition cost spent by organization for engaging with new customers. It includes information such as yearly customer acquisition costs, and reasons for increasing acquisition costs. Explore a selection of the finest Managing Technical And Non Yearly Customer Acquisition Cost Incurred By Business here. With a plethora of professionally designed and pre-made slide templates, you can quickly and easily find the right one for your upcoming presentation. You can use our Managing Technical And Non Yearly Customer Acquisition Cost Incurred By Business to effectively convey your message to a wider audience. Slidegeeks has done a lot of research before preparing these presentation templates. The content can be personalized and the slides are highly editable. Grab templates today from Slidegeeks. Mentioned slide outlines the average acquisition cost spent by organization for engaging with new customers. It includes information such as yearly customer acquisition costs, and reasons for increasing acquisition costs.

Multi Phase Product Launch Strategy Roadmap Download Pdf
This slide shows product launch strategy in different phases to track performance towards organizational goals. It includes three phases with time periods such as 4 months, 3 months, 1 month, 3 weeks, 1 week, launch week , after launch etc. Pitch your topic with ease and precision using this Multi Phase Product Launch Strategy Roadmap Download Pdf. This layout presents information on Months, Weeks, Launch Week. It is also available for immediate download and adjustment. So, changes can be made in the color, design, graphics or any other component to create a unique layout. This slide shows product launch strategy in different phases to track performance towards organizational goals. It includes three phases with time periods such as 4 months, 3 months, 1 month, 3 weeks, 1 week, launch week , after launch etc.
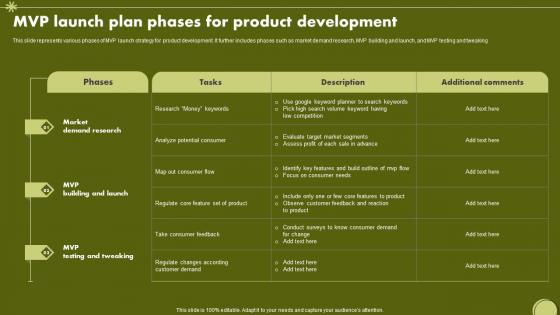
MVP Launch Plan Phases For Product Development Pictures Pdf
This slide represents various phases of MVP launch strategy for product development. It further includes phases such as market demand research, MVP building and launch, and MVP testing and tweaking Pitch your topic with ease and precision using this MVP Launch Plan Phases For Product Development Pictures Pdf. This layout presents information on Market Demand Research, MVP Building And Launch, MVP Testing And Tweaking. It is also available for immediate download and adjustment. So, changes can be made in the color, design, graphics or any other component to create a unique layout. This slide represents various phases of MVP launch strategy for product development. It further includes phases such as market demand research, MVP building and launch, and MVP testing and tweaking
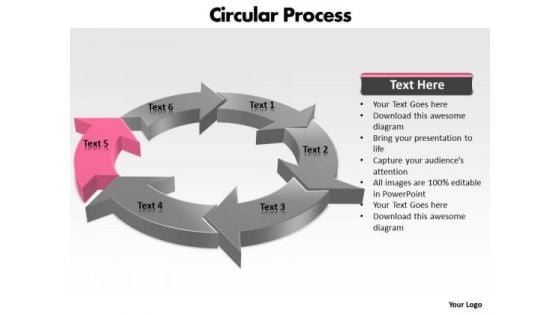
Ppt Components Of Circular Process Layout PowerPoint Templates
PPT components of circular process layout PowerPoint Templates-You can use this circular flow diagram as basic economic model which describes the flow of money and products throughout the economy in a very simplified way. Use this graphics as key element in streamlining your economic plans-PPT components of circular process layout PowerPoint Templates-Arrow, Chart, Circular, Color, Colorful, Connect, Connection, Design, Diagram, Finance, Graphic, Group, Growth, Icon, Illustration, Marketing, Pieces, Process, Recycle, Recycling, Round, Set, Strategy, Symbol, Wheel Take the plunge with our Ppt Components Of Circular Process Layout PowerPoint Templates. Success will surely ensue.
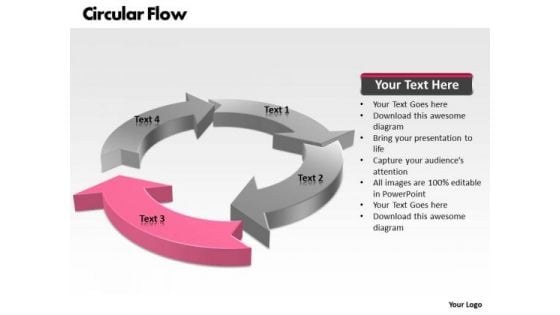
Ppt Circular Flow Process Layout 4 Power Point Stage PowerPoint Templates
PPT circular flow process layout 4 power point stage PowerPoint Templates-This circular layout can be used to represent any process or product development cycle, communication cycle, delivering assessment cycle, coercive cycle, quality cycle etc. It enhances the essence of your viable ideas-PPT circular flow process layout 4 power point stage PowerPoint Templates-Arrow, Chart, Circle, Circular, Circulation, Collection, Concept, Connection, Continuity, Cursor, Cycle, Cyclic, Diagram, Direction, Flow, Flowchart, Graph, Graphic, Group, Icon, Motion, Movement, Process, Progress, Recycle, Recycling, Refresh, Reload, Renew, Repetition, Return, Reuse, Ring, Rotation, Round, Sign, Six, Symbol Achieve aggressive turnaround leadership with our Ppt Circular Flow Process Layout 4 Power Point Stage PowerPoint Templates. They will make you look good.
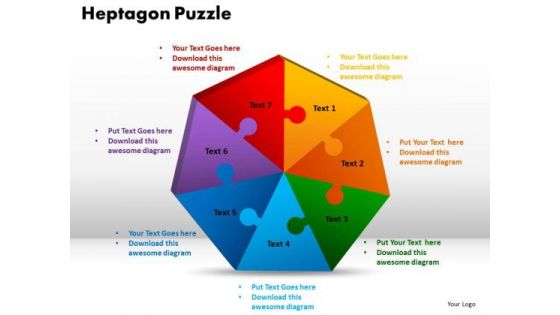
PowerPoint Design Heptagon Puzzle Business Ppt Template
PowerPoint Design Heptagon Puzzle Business PPT Template-The business process network are responsible for the total worth of services and products. This Heptogon Puzzle diagarm best describes a value business process network.-PowerPoint Design Heptagon Puzzle Business PPT Template-3d, Abstract, Art, Artistic, Background, Black, Blue, Bright, Business, Cell, Circle, Collection, Color, Colorful, Concept, Connection, Creative, Decoration, Decorative, Design, Digital, Element, Geometric, Graphic, Green, Group, Hexagon, Honeycomb, Icon, Illustration, Image, Isolated, Light, Pattern, Puzzle, Red, Render, Round, Sample, Shape, Space, Structure, Style, Success, Symbol, Technology, Wheel, White Relieve anxiety with our PowerPoint Design Heptagon Puzzle Business Ppt Template. Your thoughts will flow smoothly with ease.
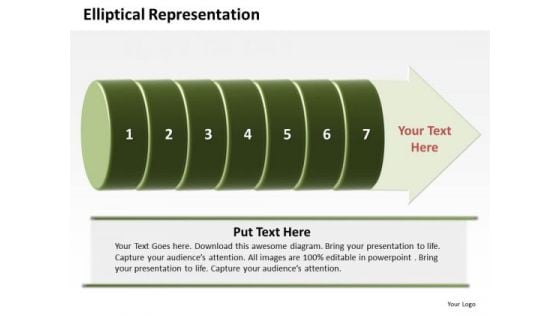
Ppt Elliptical Illustration Of 7 Steps Involved Procedure PowerPoint Templates
PPT elliptical illustration of 7 steps involved procedure PowerPoint Templates-Begin your process with this design template. It is arranged in a circular shape with up to seven slices for steps in the process.-PPT elliptical illustration of 7 steps involved procedure PowerPoint Templates-Arrow, Background, Banner, Brochure, Business, Choice, Creative, Description, Design, Icon, Illustration, Label, Number, Option, Order, Paper, Product, Profit, Progress, Promotion, Red, Reflection, Rounded, Sequence, Simple, Solution, Special, Statistic, Step, Success, Symbol, Template With our Ppt Elliptical Illustration Of 7 Steps Involved Procedure PowerPoint Templates you will never be fearful. Accept any challenge that may crop up.
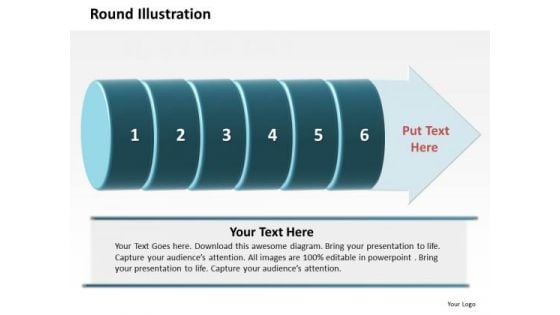
Ppt Round Description Of 6 Steps Involved Procedure PowerPoint Templates
PPT round description of 6 steps involved procedure PowerPoint Templates-Begin your process with this design template. It is arranged in a circular shape with up to six slices for steps in the process.-PPT round description of 6 steps involved procedure PowerPoint Templates-Arrow, Background, Banner, Brochure, Business, Choice, Creative, Description, Design, Icon, Illustration, Label, Number, Option, Order, Paper, Product, Profit, Progress, Promotion, Red, Reflection, Rounded, Sequence, Simple, Solution, Special, Statistic, Step, Success, Symbol, Template Feel free to air your views. Get that allowance with our Ppt Round Description Of 6 Steps Involved Procedure PowerPoint Templates.
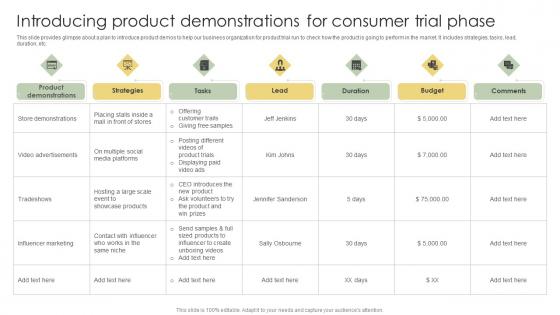
Introducing Product Demonstrations For Consumer Trial Phase Analyzing Customer Elements Pdf
This slide provides glimpse about a plan to introduce product demos to help our business organization for product trial run to check how the product is going to perform in the market. It includes strategies, tasks, lead, duration, etc.If your project calls for a presentation, then Slidegeeks is your go-to partner because we have professionally designed, easy-to-edit templates that are perfect for any presentation. After downloading, you can easily edit Introducing Product Demonstrations For Consumer Trial Phase Analyzing Customer Elements Pdf and make the changes accordingly. You can rearrange slides or fill them with different images. Check out all the handy templates This slide provides glimpse about a plan to introduce product demos to help our business organization for product trial run to check how the product is going to perform in the market. It includes strategies, tasks, lead, duration, etc.
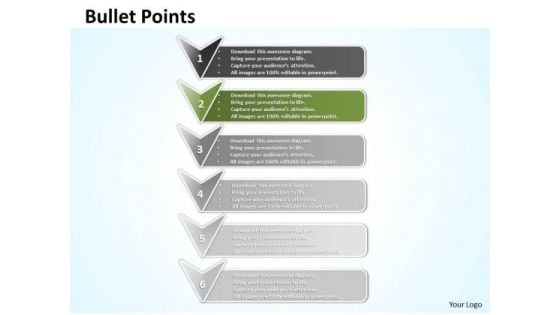
Ppt Arrows PowerPoint 2010 Pointing Vertical Downwards Templates
PPT arrows powerpoint 2010 pointing vertical downwards Templates-Arrows PowerPoint Diagram is nice for financial PowerPoint Diagram presentations as well as other analysis or business PowerPoint diagram needs. Use this graphical approach to represent global business issues such as financial data, stock market Exchange, increase in sales, corporate presentations and more.-PPT arrows powerpoint 2010 pointing vertical downwards Templates-advertising, arrow, bend, black, blue, bookmark, business, collection, control, corner, curl, customer, design, down, element, gold, green, icon, illustration, label, mark, marketing, message, new, origami, paper, product, service, set, shadow, shiny, shop, sign, site, sticker, symbol, tag Take care of your organizationwith our Ppt Arrows PowerPoint 2010 Pointing Vertical Downwards Templates. You'll deliver your best presentation yet.
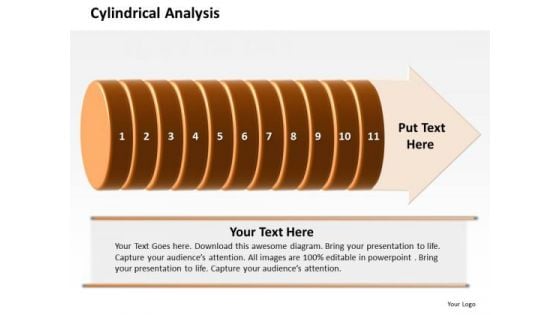
Ppt Cylindrical Analysis Of 11 Steps Involved Process PowerPoint Templates
PPT cylindrical analysis of 11 steps involved process PowerPoint Templates-This PowerPoint Diagram shows the cylindrical implementation of steps which might be involved in any type of development. Use this PowerPoint Diagram to show your abilities and make your Presentation attractive.-PPT cylindrical analysis of 11 steps involved process PowerPoint Templates-Arrow, Background, Banner, Brochure, Business, Choice, Creative, Description, Design, Icon, Illustration, Label, Number, Option, Order, Paper, Product, Profit, Progress, Promotion, Red, Reflection, Rounded, Sequence, Simple, Solution, Special, Statistic, Step, Success, Symbol, Template Deal with the matter in an even handed way. Continue to be cool with our Ppt Cylindrical Analysis Of 11 Steps Involved Process PowerPoint Templates.
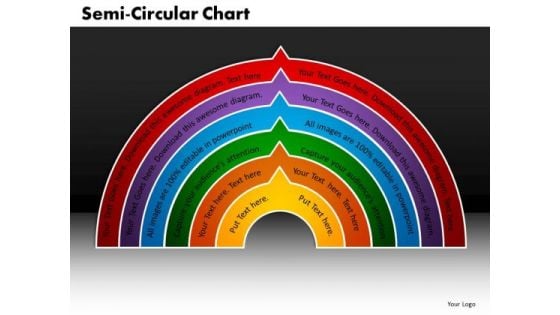
Business Cycle Process PowerPoint Templates Business Semi Circular Ppt Slides
Business Cycle Process PowerPoint Templates Business Semi Circular PPT Slides-This business semi circular chart can be used for any topic that have a progressive order including business management positions, products sold, business locations, etc.-Business Cycle Process PowerPoint Templates Business Semi Circular PPT Slides-This template can be used for presentations relating to Achievement, Active, Banner, Boss, Boy, Business, Buy, Caucasian, Chain, College, Concept, Couple, Coworkers, Crowd, Diversity, Figure, Group, Icon, Idea, Joy, Large, Manager, Many,Number, Organization, People, Portrait, Reflections, Semicircle, Sign, Stage, Stand, Student, Success, Symbol See your plans begin to crystallize. Our Business Cycle Process PowerPoint Templates Business Semi Circular Ppt Slides make it feasible.
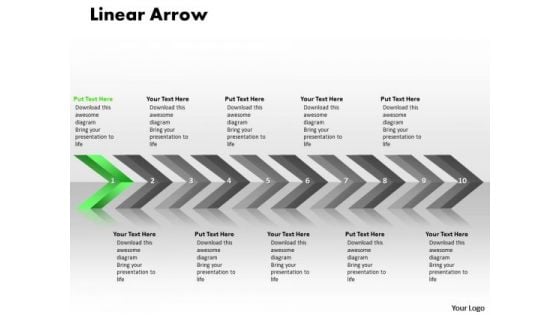
Marketing Ppt Theme Linear Arrows 10 Phase Diagram Business Management PowerPoint 2 Image
marketing PPT Theme linear arrows 10 phase diagram business management powerpoint 2 Image-This Linear Arrows diagram is ideal choice for demonstrations of relations between processes in production, commercial activity or in marketing sphere. Could be use as universal tools for various presentations in a various topics.-marketing PPT Theme linear arrows 10 phase diagram business management powerpoint 2 Image-Aim, Angle, Arrow, Arrowheads, Badge, Banner, Connection, Curve, Design, Direction, Download, Element, Fuchsia, Icon, Illustration, Indicator, Internet, Label, Link, Magenta, Mark, Marker, Next, Object, Orange, Orientation, Pointer, Shadow, Shape, Signs Symbol Structure your thoughts with our Marketing Ppt Theme Linear Arrows 10 Phase Diagram Business Management PowerPoint 2 Image. Download without worries with our money back guaranteee.
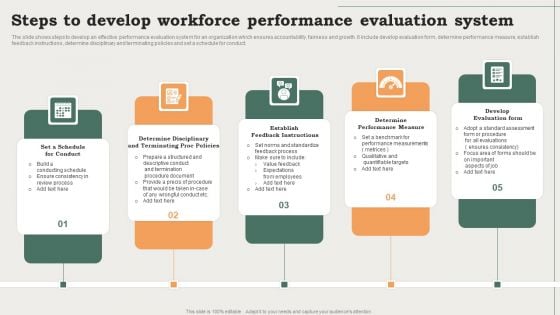
Steps To Develop Workforce Performance Evaluation System Ppt PowerPoint Presentation Infographic Template Visual Aids PDF
The slide shows steps to develop an effective performance evaluation system for an organization which ensures accountability, fairness and growth. It include develop evaluation form, determine performance measure, establish feedback instructions, determine disciplinary and terminating policies and set a schedule for conduct.Presenting Steps To Develop Workforce Performance Evaluation System Ppt PowerPoint Presentation Infographic Template Visual Aids PDF to dispense important information. This template comprises five stages. It also presents valuable insights into the topics including Workforce Evaluation, Productivity, Improvement Icon. This is a completely customizable PowerPoint theme that can be put to use immediately. So, download it and address the topic impactfully.
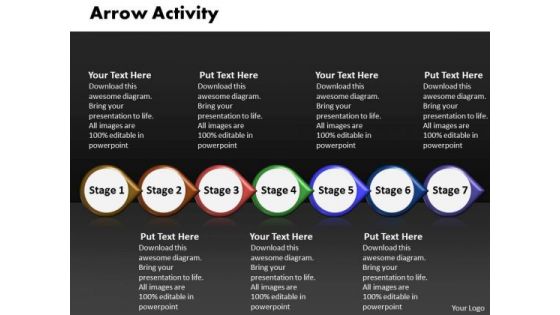
Ppt Arrow Illustration Of Activity Using 7 Phase Diagram PowerPoint Templates
PPT arrow illustration of activity using 7 phase diagram PowerPoint Templates-This PowerPoint Diagram represents controls and mechanisms. Use it to illustrate a stepwise process or a phase structure.-PPT arrow illustration of activity using 7 phase diagram PowerPoint Templates-3d, Abstract, Advertisement, Aim, Arrow, Business, Circular, Cursor, Direction, Down, Environment, Form, Glossy, Graphic, Icon, Illustration, Information, Mark, Motion, Perspective, Point, Sale, Shadow, Shape, Shiny, Sign Increase the output of your factory. Explore avenues available with our Ppt Arrow Illustration Of Activity Using 7 Phase Diagram PowerPoint Templates.
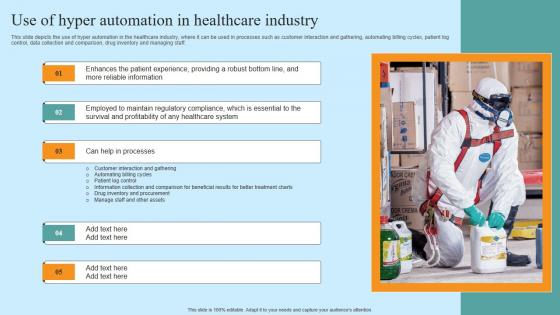
Use Of Hyper Automation In Healthcare Industry Hyper Automation Solutions Diagrams PDF
This slide depicts the use of hyper automation in the healthcare industry, where it can be used in processes such as customer interaction and gathering, automating billing cycles, patient log control, data collection and comparison, drug inventory and managing staff. Do you have to make sure that everyone on your team knows about any specific topic I yes, then you should give Use Of Hyper Automation In Healthcare Industry Hyper Automation Solutions Diagrams PDF a try. Our experts have put a lot of knowledge and effort into creating this impeccable Use Of Hyper Automation In Healthcare Industry Hyper Automation Solutions Diagrams PDF. You can use this template for your upcoming presentations, as the slides are perfect to represent even the tiniest detail. You can download these templates from the Slidegeeks website and these are easy to edit. So grab these today This slide depicts the use of hyper automation in the healthcare industry, where it can be used in processes such as customer interaction and gathering, automating billing cycles, patient log control, data collection and comparison, drug inventory and managing staff.
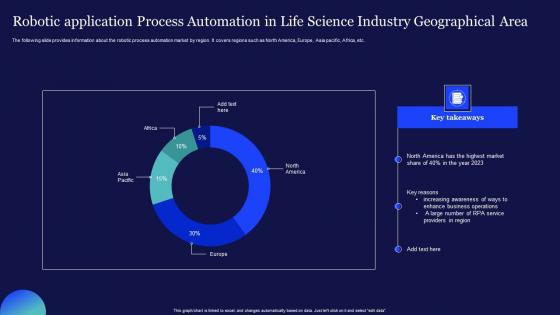
Robotic Process Automation In Life Science Industry Geographical Area Brochure Pdf
The following slide provides information about the robotic process automation market by region. It covers regions such as North America, Europe, Asia pacific, Africa, etc. Showcasing this set of slides titled Robotic Process Automation In Life Science Industry Geographical Area Brochure Pdf. The topics addressed in these templates are Robotic Application Process, Science Industry Geographical. All the content presented in this PPT design is completely editable. Download it and make adjustments in color, background, font etc. as per your unique business setting. The following slide provides information about the robotic process automation market by region. It covers regions such as North America, Europe, Asia pacific, Africa, etc.
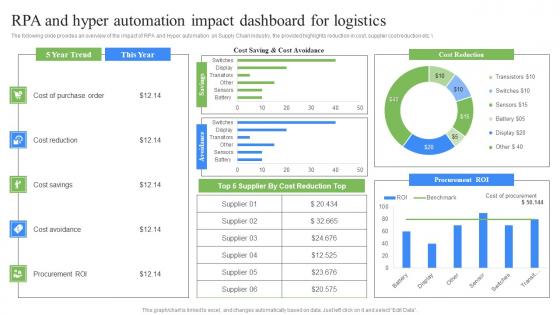
RPA Influence On Industries RPA And Hyper Automation Impact Dashboard Microsoft Pdf
The following slide provides an overview of the impact of RPA and Hyper automation on Supply Chain Industry, the provided highlights reduction in cost, supplier cost reduction etc. Slidegeeks has constructed RPA Influence On Industries RPA And Hyper Automation Impact Dashboard Microsoft Pdf after conducting extensive research and examination. These presentation templates are constantly being generated and modified based on user preferences and critiques from editors. Here, you will find the most attractive templates for a range of purposes while taking into account ratings and remarks from users regarding the content. This is an excellent jumping-off point to explore our content and will give new users an insight into our top-notch PowerPoint Templates. The following slide provides an overview of the impact of RPA and Hyper automation on Supply Chain Industry, the provided highlights reduction in cost, supplier cost reduction etc.
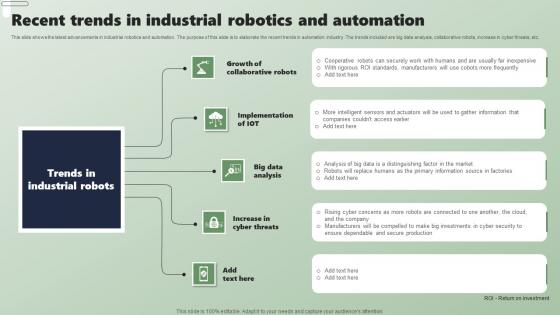
Recent Trends In Industrial Robotics And Automation Applications Of Industrial Robots Diagrams Pdf
This slide shows the latest advancements in industrial robotics and automation. The purpose of this slide is to elaborate the recent trends in automation industry. The trends included are big data analysis, collaborative robots, increase in cyber threats, etc. This Recent Trends In Industrial Robotics And Automation Applications Of Industrial Robots Diagrams Pdf from Slidegeeks makes it easy to present information on your topic with precision. It provides customization options, so you can make changes to the colors, design, graphics, or any other component to create a unique layout. It is also available for immediate download, so you can begin using it right away. Slidegeeks has done good research to ensure that you have everything you need to make your presentation stand out. Make a name out there for a brilliant performance. This slide shows the latest advancements in industrial robotics and automation. The purpose of this slide is to elaborate the recent trends in automation industry. The trends included are big data analysis, collaborative robots, increase in cyber threats, etc.


 Continue with Email

 Home
Home


