Manufacturing Icon

When To Use Waterfall Model Phases Of Software Development Procedure Background PDF
This slide represents the conditions when we can implement V-model, including consistent product definition, clear and precise prerequisites, and small projects.If your project calls for a presentation, then Slidegeeks is your go-to partner because we have professionally designed, easy-to-edit templates that are perfect for any presentation. After downloading, you can easily edit When To Use Waterfall Model Phases Of Software Development Procedure Background PDF and make the changes accordingly. You can rearrange slides or fill them with different images. Check out all the handy templates.
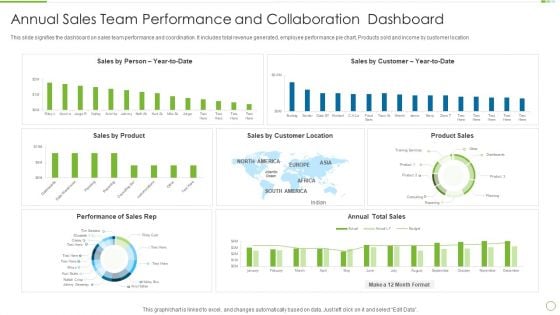
Annual Sales Team Performance And Collaboration Dashboard Themes PDF
This slide signifies the dashboard on sales team performance and coordination. It includes total revenue generated, employee performance pie chart, Products sold and income by customer location Showcasing this set of slides titled Annual Sales Team Performance And Collaboration Dashboard Themes PDF The topics addressed in these templates are Annual Sales, Team Performance, Collaboration Dashboard All the content presented in this PPT design is completely editable. Download it and make adjustments in color, background, font etc. as per your unique business setting.
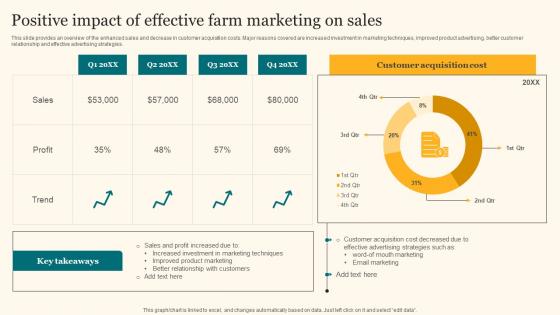
Positive Impact Of Effective Farm Marketing On Agricultural Product Promotion Demonstration Pdf
This slide provides an overview of the enhanced sales and decrease in customer acquisition costs. Major reasons covered are increased investment in marketing techniques, improved product advertising, better customer relationship and effective advertising strategies. Create an editable Positive Impact Of Effective Farm Marketing On Agricultural Product Promotion Demonstration Pdf that communicates your idea and engages your audience. Whether you are presenting a business or an educational presentation, pre-designed presentation templates help save time. Positive Impact Of Effective Farm Marketing On Agricultural Product Promotion Demonstration Pdf is highly customizable and very easy to edit, covering many different styles from creative to business presentations. Slidegeeks has creative team members who have crafted amazing templates. So, go and get them without any delay. This slide provides an overview of the enhanced sales and decrease in customer acquisition costs. Major reasons covered are increased investment in marketing techniques, improved product advertising, better customer relationship and effective advertising strategies.
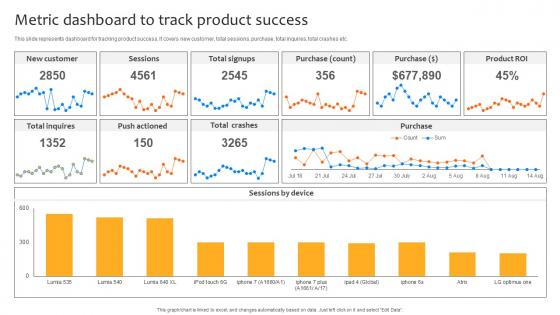
Deploying Strategies For Business Metric Dashboard To Track Product Success Strategy SS V
This slide represents dashboard for tracking product success. It covers new customer, total sessions, purchase, total inquires, total crashes etc. Explore a selection of the finest Deploying Strategies For Business Metric Dashboard To Track Product Success Strategy SS V here. With a plethora of professionally designed and pre-made slide templates, you can quickly and easily find the right one for your upcoming presentation. You can use our Deploying Strategies For Business Metric Dashboard To Track Product Success Strategy SS V to effectively convey your message to a wider audience. Slidegeeks has done a lot of research before preparing these presentation templates. The content can be personalized and the slides are highly editable. Grab templates today from Slidegeeks. This slide represents dashboard for tracking product success. It covers new customer, total sessions, purchase, total inquires, total crashes etc.
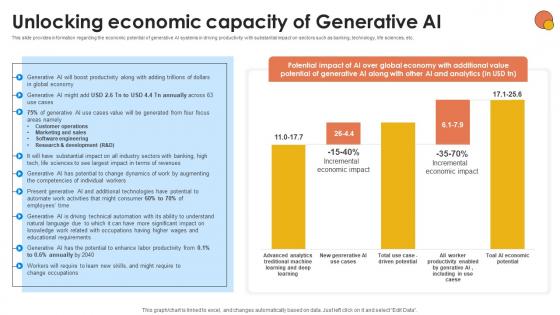
Unlocking Economic Capacity Of Generative AI For Better Productivity AI SS V
This slide provides information regarding the economic potential of generative AI systems in driving productivity with substantial impact on sectors such as banking, technology, life sciences, etc. Explore a selection of the finest Unlocking Economic Capacity Of Generative AI For Better Productivity AI SS V here. With a plethora of professionally designed and pre-made slide templates, you can quickly and easily find the right one for your upcoming presentation. You can use our Unlocking Economic Capacity Of Generative AI For Better Productivity AI SS V to effectively convey your message to a wider audience. Slidegeeks has done a lot of research before preparing these presentation templates. The content can be personalized and the slides are highly editable. Grab templates today from Slidegeeks. This slide provides information regarding the economic potential of generative AI systems in driving productivity with substantial impact on sectors such as banking, technology, life sciences, etc.
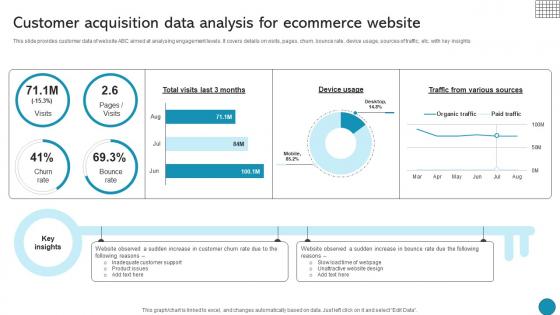
Customer Acquisition Data Analysis For Ecommerce Website Driving Business Success Integrating Product
This slide provides customer data of website ABC aimed at analysing engagement levels. It covers details on visits, pages, churn, bounce rate, device usage, sources of traffic, etc. with key insights If you are looking for a format to display your unique thoughts, then the professionally designed Customer Acquisition Data Analysis For Ecommerce Website Driving Business Success Integrating Product is the one for you. You can use it as a Google Slides template or a PowerPoint template. Incorporate impressive visuals, symbols, images, and other charts. Modify or reorganize the text boxes as you desire. Experiment with shade schemes and font pairings. Alter, share or cooperate with other people on your work. Download Customer Acquisition Data Analysis For Ecommerce Website Driving Business Success Integrating Product and find out how to give a successful presentation. Present a perfect display to your team and make your presentation unforgettable. This slide provides customer data of website ABC aimed at analysing engagement levels. It covers details on visits, pages, churn, bounce rate, device usage, sources of traffic, etc. with key insights
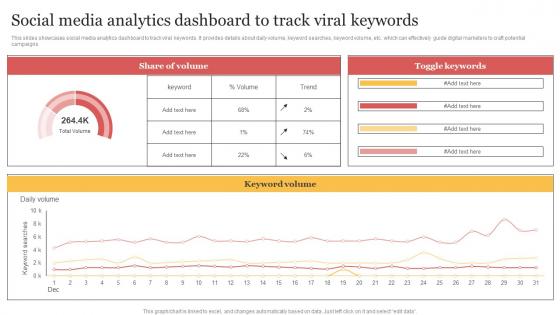
Social Media Analytics Dashboard To Track Viral Keywords Organizing Buzzworthy Social Themes Pdf
This slides showcases social media analytics dashboard to track viral keywords. It provides details about daily volume, keyword searches, keyword volume, etc. which can effectively guide digital marketers to craft potential campaigns. The Social Media Analytics Dashboard To Track Viral Keywords Organizing Buzzworthy Social Themes Pdf is a compilation of the most recent design trends as a series of slides. It is suitable for any subject or industry presentation, containing attractive visuals and photo spots for businesses to clearly express their messages. This template contains a variety of slides for the user to input data, such as structures to contrast two elements, bullet points, and slides for written information. Slidegeeks is prepared to create an impression. This slides showcases social media analytics dashboard to track viral keywords. It provides details about daily volume, keyword searches, keyword volume, etc. which can effectively guide digital marketers to craft potential campaigns.
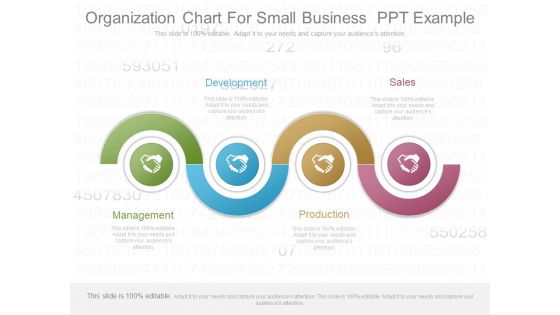
Organization Chart For Small Business Ppt Example
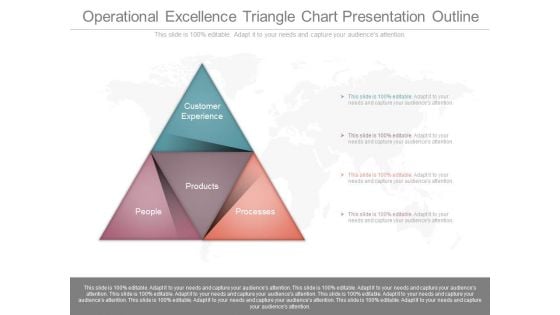
Operational Excellence Triangle Chart Presentation Outline
This is a operational excellence triangle chart presentation outline. This is a four stage process. The stages in this process are customer experience, products, processes, people.
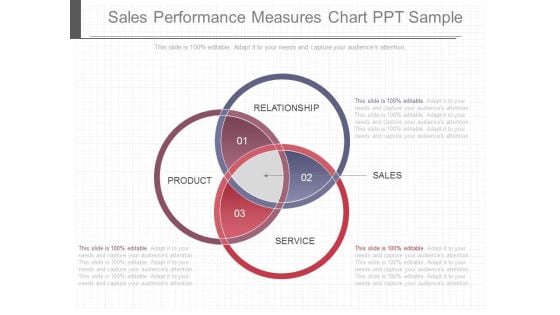
Sales Performance Measures Chart Ppt Sample
This is a sales performance measures chart ppt sample. This is a three stage process. The stages in this process are product, relationship, service, sales.
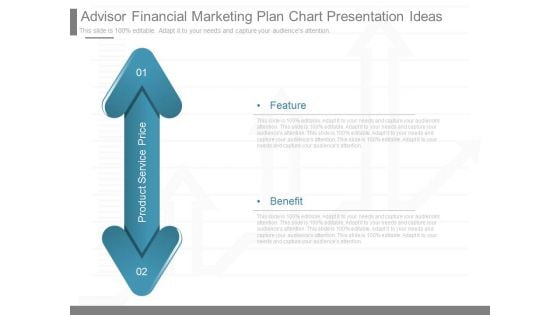
Advisor Financial Marketing Plan Chart Presentation Ideas
This is a advisor financial marketing plan chart presentation ideas. This is a two stage process. The stages in this process are product service price, feature, benefit.
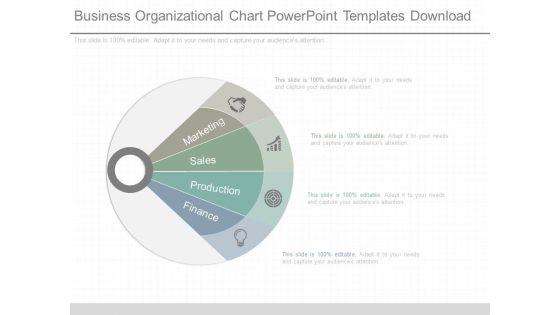
Business Organizational Chart Powerpoint Templates Download
This is a business organizational chart powerpoint templates download. This is a four stage process. The stages in this process are marketing, sales, production, finance.
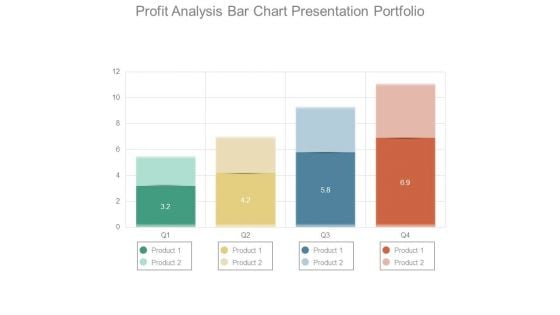
Profit Analysis Bar Chart Presentation Portfolio
This is a profit analysis bar chart presentation portfolio. This is a four stage process. The stages in this process are product.
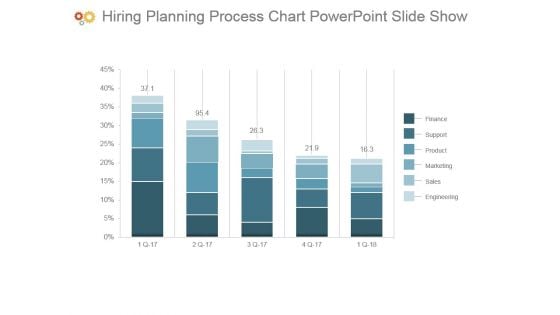
Hiring Planning Process Chart Powerpoint Slide Show
This is a hiring planning process chart powerpoint slide show. This is a five stage process. The stages in this process are finance, support, product, marketing, sales, engineering.
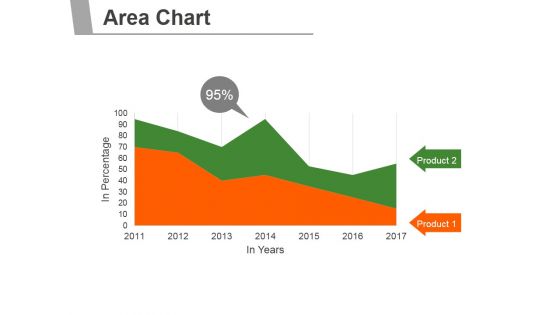
Area Chart Ppt PowerPoint Presentation Graphics
This is a area chart ppt powerpoint presentation graphics. This is a two stage process. The stages in this process are business, marketing, management, product, finance.
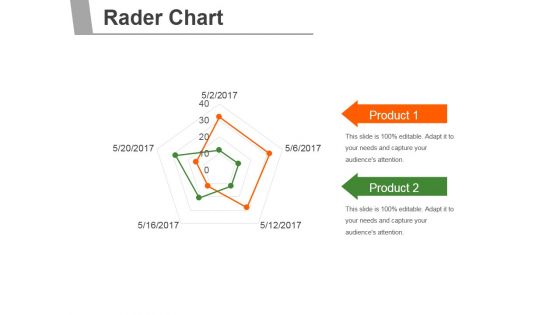
Rader Chart Ppt PowerPoint Presentation Good
This is a rader chart ppt powerpoint presentation good. This is a five stage process. The stages in this process are business, marketing, product, management, planning.
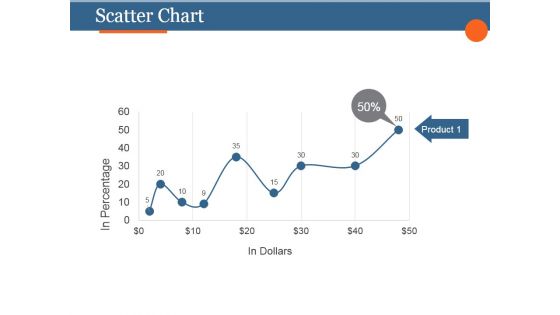
Scatter Chart Ppt PowerPoint Presentation Slides
This is a scatter chart ppt powerpoint presentation slides. This is a five stage process. The stages in this process are product, in dollars, in percentage.
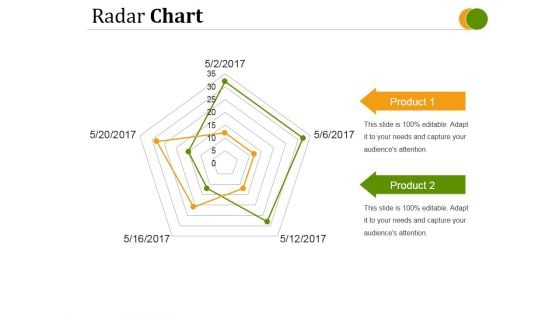
Radar Chart Ppt PowerPoint Presentation Pictures
This is a radar chart ppt powerpoint presentation pictures. This is a two stage process. The stages in this process are product, business, management, marketing, strategy.
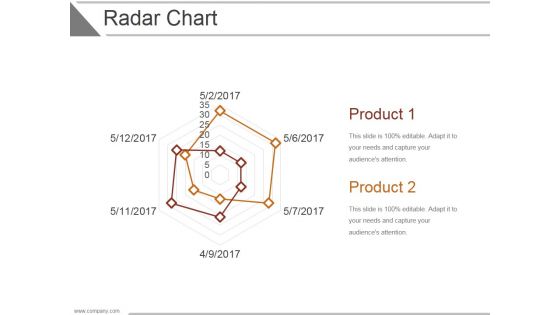
Radar Chart Ppt PowerPoint Presentation Slide Download
This is a radar chart ppt powerpoint presentation slide download. This is a two stage process. The stages in this process are product, strategy, business, marketing, management.
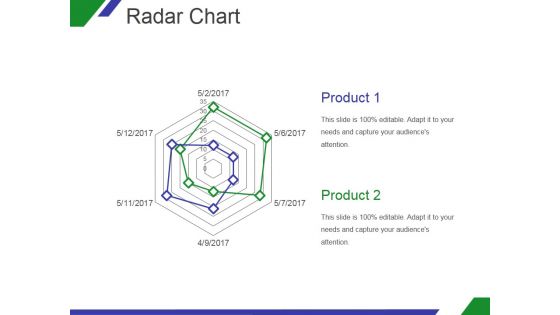
Radar Chart Ppt PowerPoint Presentation Template
This is a radar chart ppt powerpoint presentation template. This is a two stage process. The stages in this process are product, marketing, business, shape.
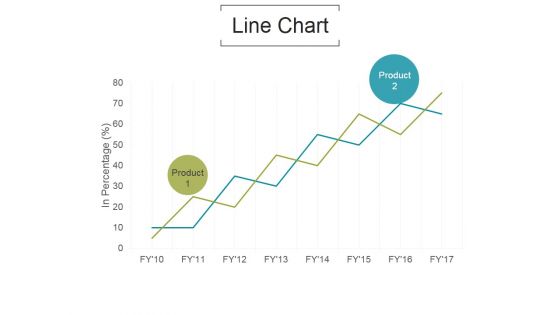
Line Chart Ppt PowerPoint Presentation Model
This is a line chart ppt powerpoint presentation model. This is a two stage process. The stages in this process are in percentage, product, business.
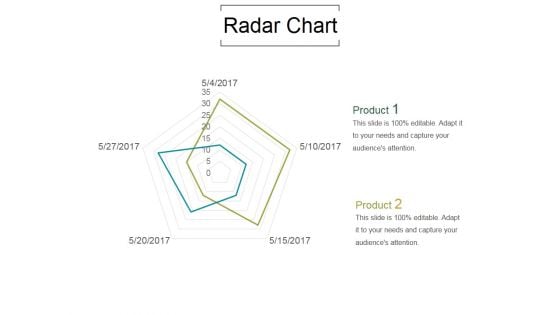
Radar Chart Ppt PowerPoint Presentation Samples
This is a radar chart ppt powerpoint presentation samples. This is a two stage process. The stages in this process are product, marketing, business.
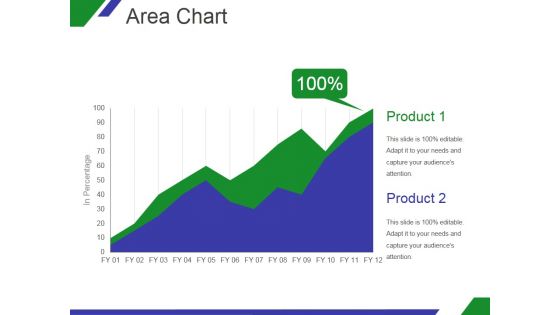
Area Chart Ppt PowerPoint Presentation Designs
This is a area chart ppt powerpoint presentation designs. This is a two stage process. The stages in this process are product, graph, in percentage, growth, business.
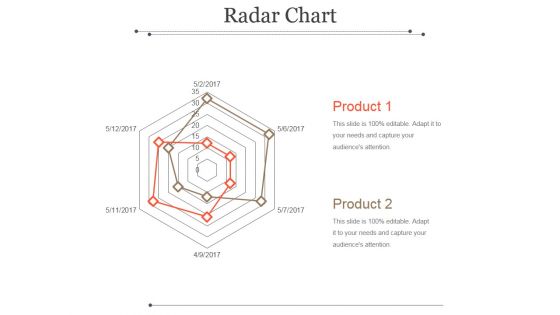
Radar Chart Ppt PowerPoint Presentation Show
This is a radar chart ppt powerpoint presentation show. This is a two stage process. The stages in this process are product, management, business, marketing.
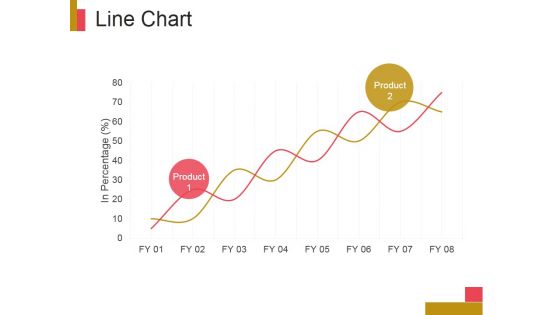
Line Chart Ppt PowerPoint Presentation Example
This is a line chart ppt powerpoint presentation example. This is a two stage process. The stages in this process are product, in percentage, business, marketing.
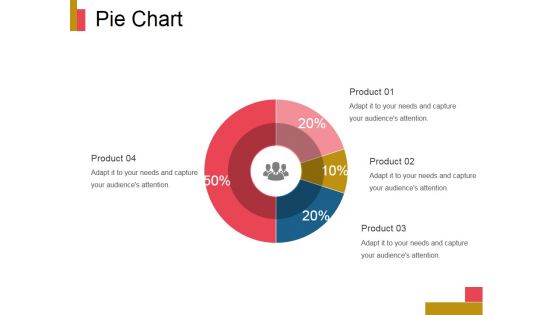
Pie Chart Ppt PowerPoint Presentation Design Ideas
This is a pie chart ppt powerpoint presentation design ideas. This is a four stage process. The stages in this process are product, finance, business, marketing, pie.
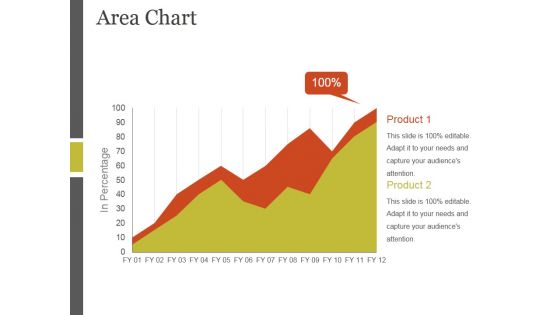
Area Chart Ppt PowerPoint Presentation Templates
This is a area chart ppt powerpoint presentation templates. This is a two stage process. The stages in this process are product, business, management, strategy, marketing, planning.
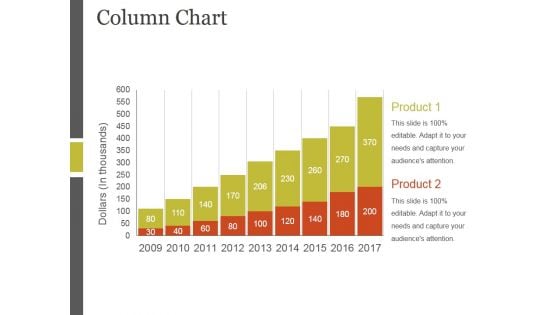
Column Chart Ppt PowerPoint Presentation Layout
This is a column chart ppt powerpoint presentation layout. This is a two stage process. The stages in this process are product, business, management, strategy, marketing, planning.
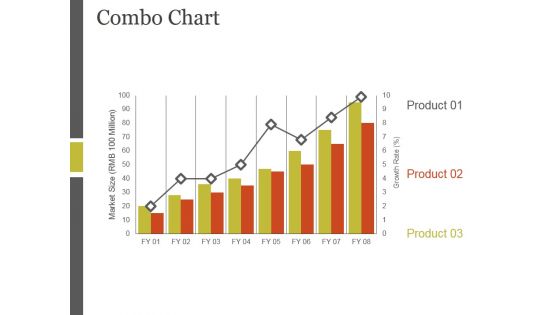
Combo Chart Ppt PowerPoint Presentation Professional
This is a combo chart ppt powerpoint presentation professional. This is a three stage process. The stages in this process are product, business, management, strategy, marketing, planning.
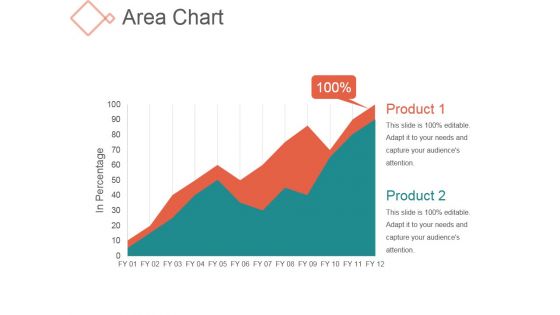
Area Chart Ppt PowerPoint Presentation Rules
This is a area chart ppt powerpoint presentation rules. This is a two stage process. The stages in this process are business, management, product, growth.
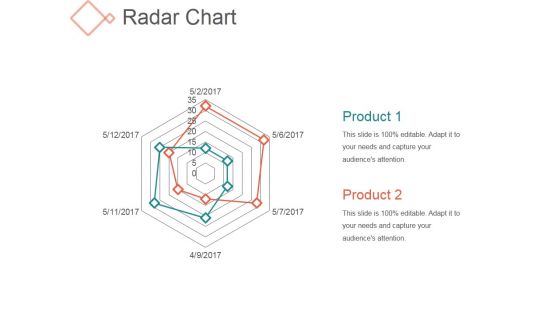
Radar Chart Ppt PowerPoint Presentation Influencers
This is a radar chart ppt powerpoint presentation influencers. This is a two stage process. The stages in this process are business, marketing, product, shapes.
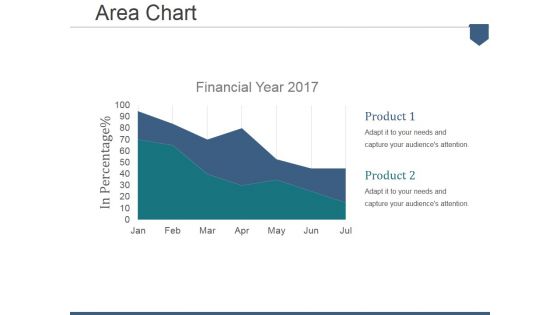
Area Chart Ppt PowerPoint Presentation Summary Example
This is a area chart ppt powerpoint presentation summary example. This is a two stage process. The stages in this process are financial year, in percentage, product.
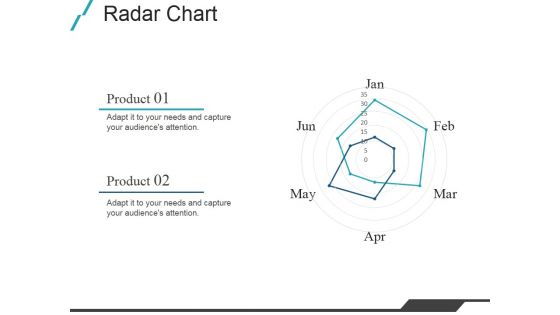
Radar Chart Ppt PowerPoint Presentation Show Sample
This is a radar chart ppt powerpoint presentation show sample. This is a five stage process. The stages in this process are product, business, marketing, shapes.
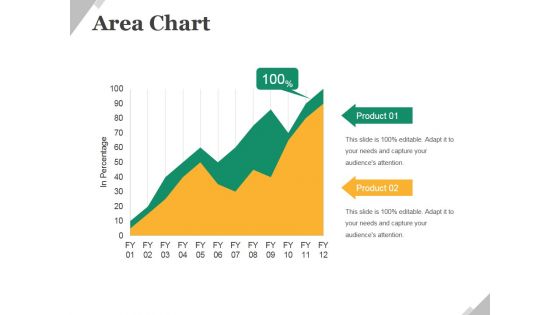
Area Chart Ppt PowerPoint Presentation Show Portfolio
This is a area chart ppt powerpoint presentation show portfolio. This is a two stage process. The stages in this process are business, product, finance, growth, management.
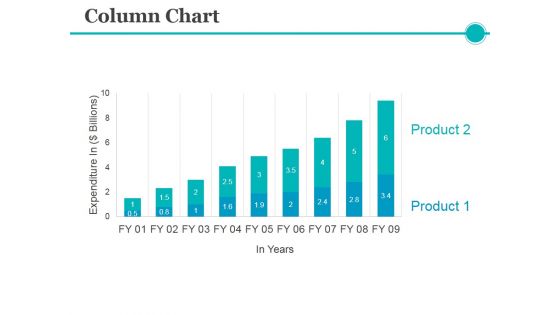
Column Chart Ppt PowerPoint Presentation Inspiration Visuals
This is a column chart ppt powerpoint presentation inspiration visuals. This is a nine stage process. The stages in this process are business, marketing, product, expenditure.
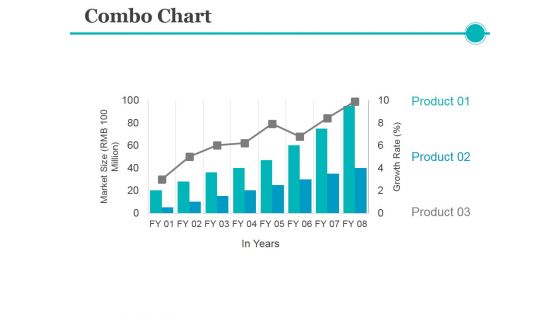
Combo Chart Ppt PowerPoint Presentation Pictures Layouts
This is a combo chart ppt powerpoint presentation pictures layouts. This is a eight stage process. The stages in this process are product, growth rate, market size, years.
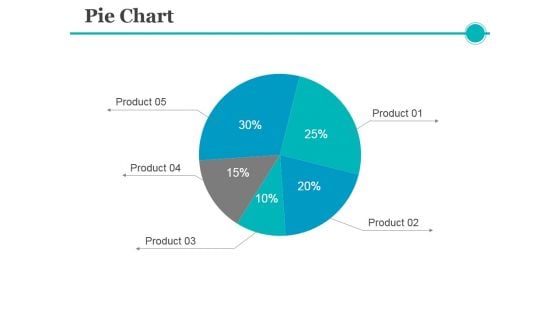
Pie Chart Ppt PowerPoint Presentation Professional Introduction
This is a pie chart ppt powerpoint presentation professional introduction. This is a five stage process. The stages in this process are product, finance, pie, process, business.
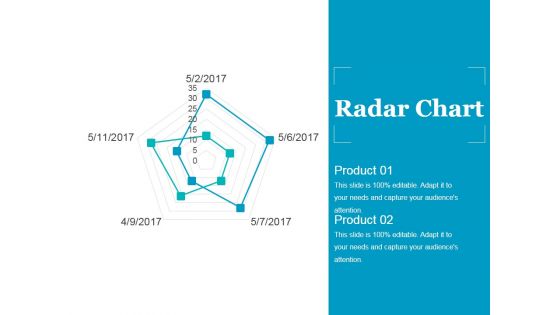
Radar Chart Ppt PowerPoint Presentation Model Tips
This is a radar chart ppt powerpoint presentation model tips. This is a five stage process. The stages in this process are product, business, marketing, shapes.
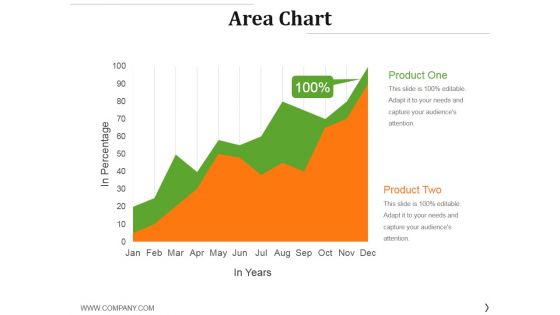
Area Chart Ppt PowerPoint Presentation Gallery Inspiration
This is a area chart ppt powerpoint presentation gallery inspiration. This is a two stage process. The stages in this process are product, growth, success, graph, finance.
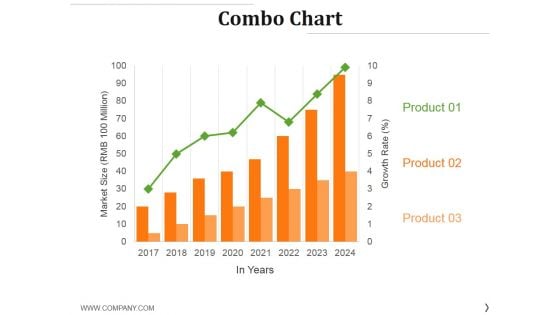
Combo Chart Ppt PowerPoint Presentation File Model
This is a combo chart ppt powerpoint presentation file model. This is a eight stage process. The stages in this process are product, year, market size, business, marketing.
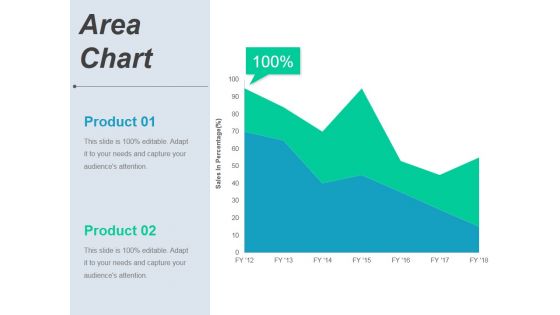
Area Chart Ppt PowerPoint Presentation Pictures Visuals
This is a area chart ppt powerpoint presentation pictures visuals. This is a two stage process. The stages in this process are product, business, finance, marketing.
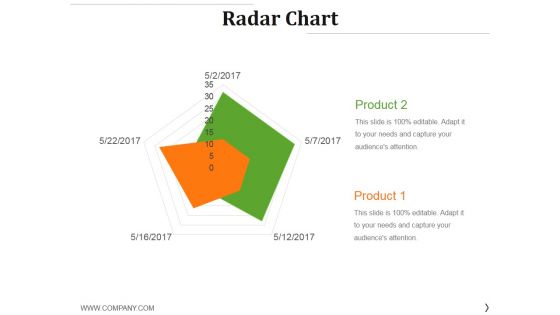
Radar Chart Ppt PowerPoint Presentation Slides Graphics
This is a radar chart ppt powerpoint presentation slides graphics. This is a two stage process. The stages in this process are product, shapes, management, business, marketing.
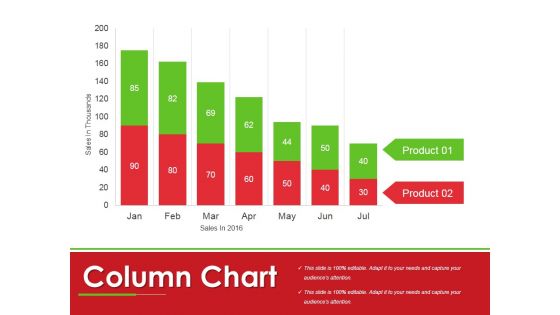
Column Chart Ppt PowerPoint Presentation Show Shapes
This is a column chart ppt powerpoint presentation show shapes. This is a two stage process. The stages in this process are sales, product, business, management, finance.
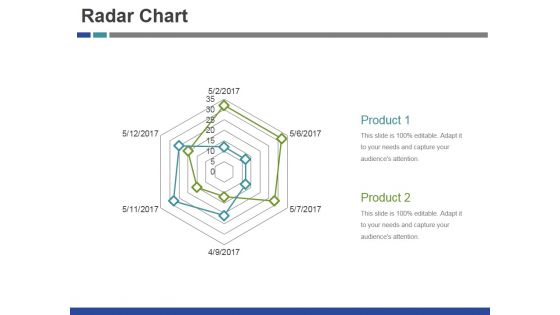
Radar Chart Ppt PowerPoint Presentation Outline Vector
This is a radar chart ppt powerpoint presentation outline vector. This is a six stage process. The stages in this process are product, business, marketing, shapes.
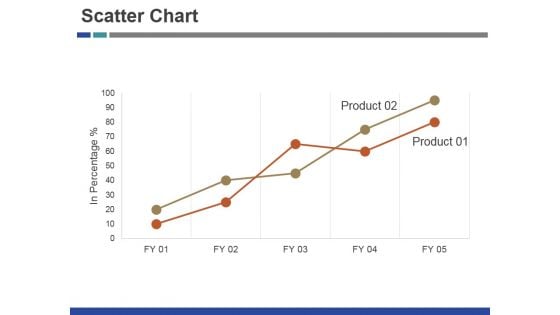
Scatter Chart Ppt PowerPoint Presentation Inspiration Brochure
This is a scatter chart ppt powerpoint presentation inspiration brochure. This is a two stage process. The stages in this process are product, growth, success, business.
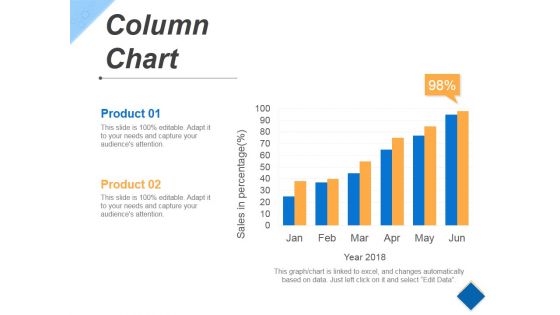
Column Chart Ppt PowerPoint Presentation Styles Vector
This is a column chart ppt powerpoint presentation styles vector. This is a six stage process. The stages in this process are growth, success, business, marketing, product.

Line Chart Ppt PowerPoint Presentation Pictures Maker
This is a line chart ppt powerpoint presentation pictures maker. This is a two stage process. The stages in this process are financial years, product, growth, success.
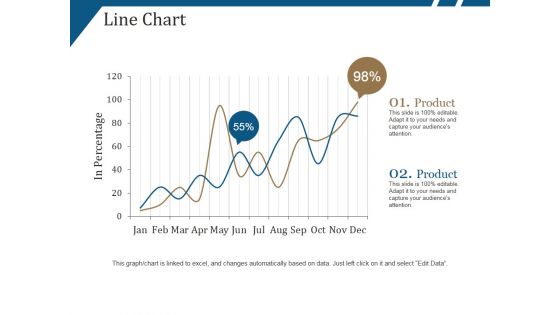
Line Chart Ppt PowerPoint Presentation Portfolio Show
This is a line chart ppt powerpoint presentation portfolio show. This is a two stage process. The stages in this process are product, in percentage, growth, success.
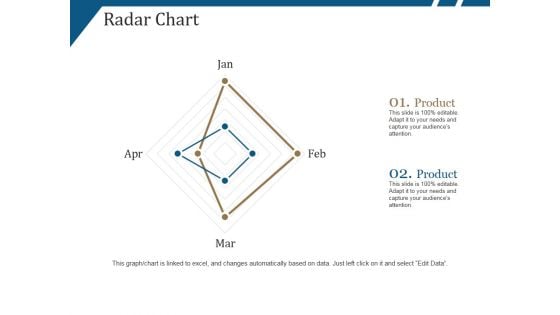
Radar Chart Ppt PowerPoint Presentation Layouts Summary
This is a radar chart ppt powerpoint presentation layouts summary. This is a four stage process. The stages in this process are product, business, marketing, shapes.
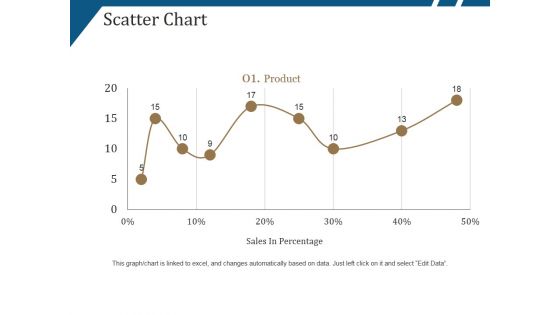
Scatter Chart Ppt PowerPoint Presentation Summary Deck
This is a scatter chart ppt powerpoint presentation summary deck. This is a nine stage process. The stages in this process are product, sales in percentage, growth, success.
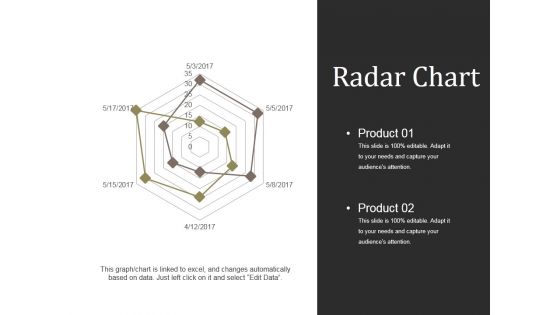
Radar Chart Ppt PowerPoint Presentation Model Picture
This is a radar chart ppt powerpoint presentation model picture. This is a six stage process. The stages in this process are product, finance marketing, business, management, analysis.
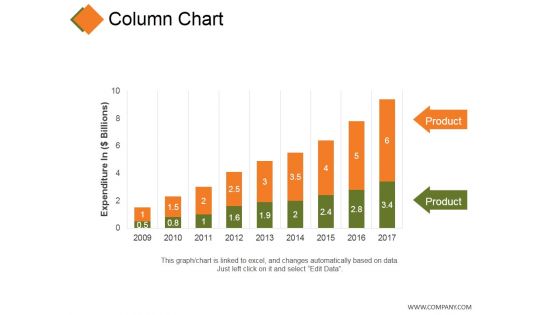
Column Chart Ppt PowerPoint Presentation Portfolio Background
This is a column chart ppt powerpoint presentation portfolio background. This is a nine stage process. The stages in this process are product, expenditure, growth, success, business.
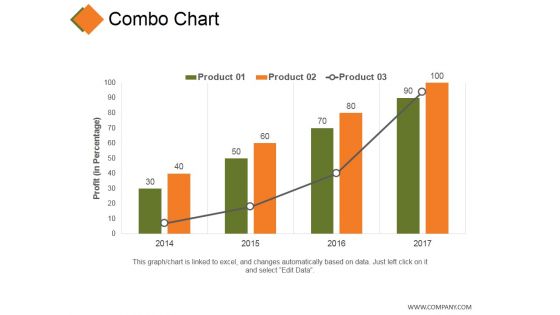
Combo Chart Ppt PowerPoint Presentation Ideas Brochure
This is a combo chart ppt powerpoint presentation ideas brochure. This is a four stage process. The stages in this process are product, profit, growth, success, business.
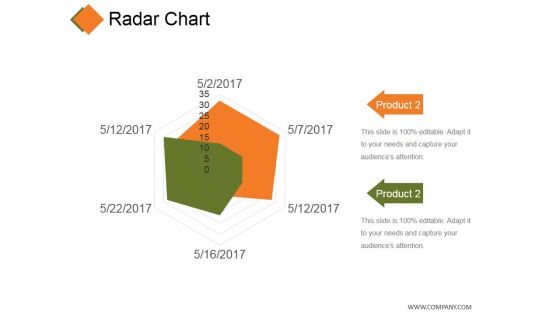
Radar Chart Ppt PowerPoint Presentation Show Demonstration
This is a radar chart ppt powerpoint presentation show demonstration. This is a two stage process. The stages in this process are product, shape, business, marketing.
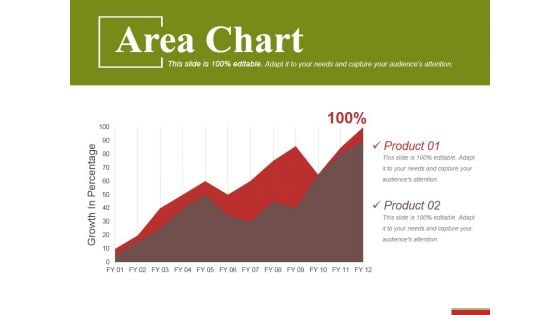
Area Chart Ppt PowerPoint Presentation Gallery Brochure
This is a area chart ppt powerpoint presentation gallery brochure. This is a two stage process. The stages in this process are product, growth in percentage, success, business.
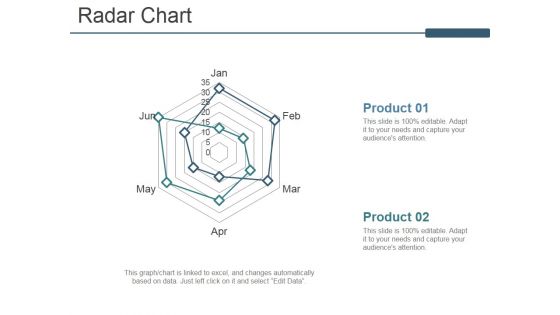
Radar Chart Ppt PowerPoint Presentation Model Graphics
This is a radar chart ppt powerpoint presentation model graphics. This is a two stage process. The stages in this process are product, business, marketing, process, success.
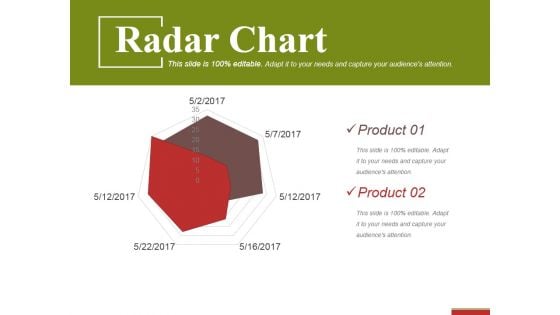
Radar Chart Ppt PowerPoint Presentation Summary Skills
This is a radar chart ppt powerpoint presentation summary skills. This is a two stage process. The stages in this process are product, shape, business, marketing.
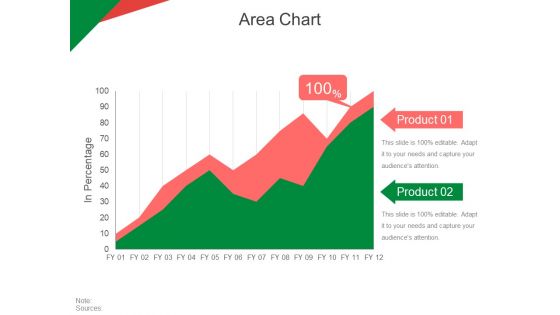
Area Chart Ppt PowerPoint Presentation Inspiration Aids
This is a area chart ppt powerpoint presentation inspiration aids. This is a two stage process. The stages in this process are in percentage, product, business, marketing, strategy.
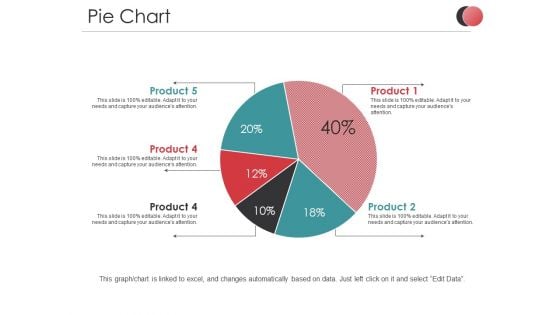
Pie Chart Ppt PowerPoint Presentation Slides Files
This is a pie chart ppt powerpoint presentation slides files. This is a five stage process. The stages in this process are product, percentage, business, marketing, process.
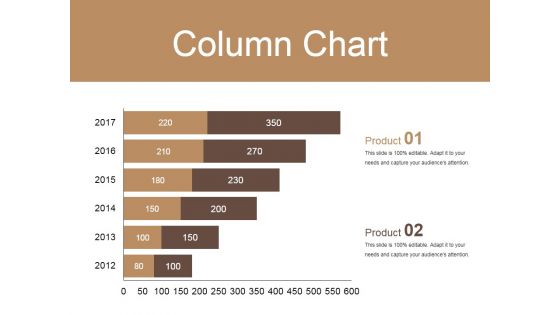
Column Chart Ppt PowerPoint Presentation Show Visuals
This is a column chart ppt powerpoint presentation show visuals. This is a two stage process. The stages in this process are product, year, success, step, business.


 Continue with Email

 Home
Home


