Manufacturing Icon
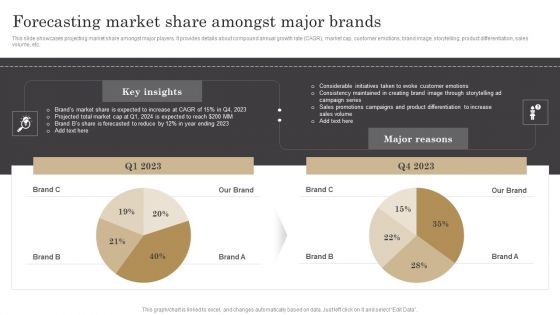
Forecasting Market Share Amongst Major Brands Ppt Show Visuals PDF
This slide showcases projecting market share amongst major players. It provides details about compound annual growth rate CAGR, market cap, customer emotions, brand image, storytelling, product differentiation, sales volume, etc. Explore a selection of the finest Forecasting Market Share Amongst Major Brands Ppt Show Visuals PDF here. With a plethora of professionally designed and pre made slide templates, you can quickly and easily find the right one for your upcoming presentation. You can use our Forecasting Market Share Amongst Major Brands Ppt Show Visuals PDF to effectively convey your message to a wider audience. Slidegeeks has done a lot of research before preparing these presentation templates. The content can be personalized and the slides are highly editable. Grab templates today from Slidegeeks.
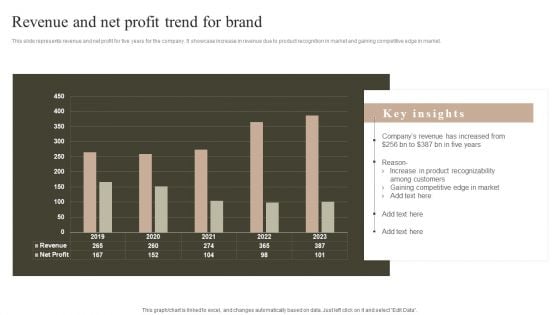
Revenue And Net Profit Trend For Brand Ideas PDF
This slide represents revenue and net profit for five years for the company. It showcase increase in revenue due to product recognition in market and gaining competitive edge in market. Formulating a presentation can take up a lot of effort and time, so the content and message should always be the primary focus. The visuals of the PowerPoint can enhance the presenters message, so our Revenue And Net Profit Trend For Brand Ideas PDF was created to help save time. Instead of worrying about the design, the presenter can concentrate on the message while our designers work on creating the ideal templates for whatever situation is needed. Slidegeeks has experts for everything from amazing designs to valuable content, we have put everything into Revenue And Net Profit Trend For Brand Ideas PDF.
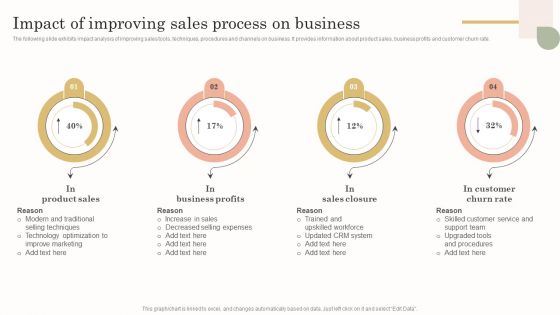
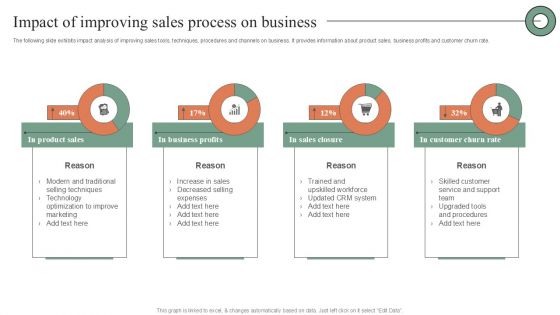
Impact Of Improving Sales Process On Business Microsoft PDF
The following slide exhibits impact analysis of improving sales tools, techniques, procedures and channels on business. It provides information about product sales, business profits and customer churn rate. Crafting an eye catching presentation has never been more straightforward. Let your presentation shine with this tasteful yet straightforward Impact Of Improving Sales Process On Business Microsoft PDF template. It offers a minimalistic and classy look that is great for making a statement. The colors have been employed intelligently to add a bit of playfulness while still remaining professional. Construct the ideal Impact Of Improving Sales Process On Business Microsoft PDF that effortlessly grabs the attention of your audience Begin now and be certain to wow your customers.
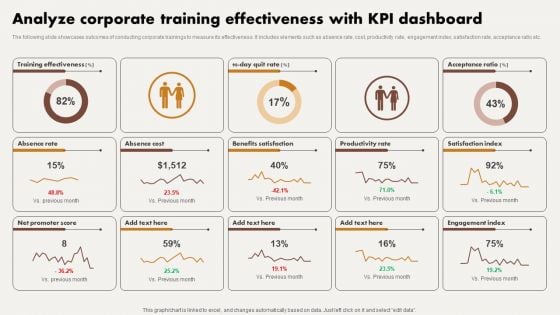
Analyze Corporate Training Effectiveness With KPI Dashboard Ppt Visual Aids Backgrounds PDF
The following slide showcases outcomes of conducting corporate trainings to measure its effectiveness. It includes elements such as absence rate, cost, productivity rate, engagement index, satisfaction rate, acceptance ratio etc. This Analyze Corporate Training Effectiveness With KPI Dashboard Ppt Visual Aids Backgrounds PDF from Slidegeeks makes it easy to present information on your topic with precision. It provides customization options, so you can make changes to the colors, design, graphics, or any other component to create a unique layout. It is also available for immediate download, so you can begin using it right away. Slidegeeks has done good research to ensure that you have everything you need to make your presentation stand out. Make a name out there for a brilliant performance.
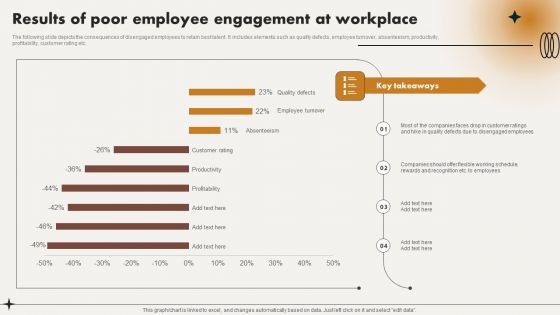
Results Of Poor Employee Engagement At Workplace Ppt File Demonstration PDF
The following slide depicts the consequences of disengaged employees to retain best talent. It includes elements such as quality defects, employee turnover, absenteeism, productivity, profitability, customer rating etc. Get a simple yet stunning designed Results Of Poor Employee Engagement At Workplace Ppt File Demonstration PDF. It is the best one to establish the tone in your meetings. It is an excellent way to make your presentations highly effective. So, download this PPT today from Slidegeeks and see the positive impacts. Our easy to edit Results Of Poor Employee Engagement At Workplace Ppt File Demonstration PDF can be your go to option for all upcoming conferences and meetings. So, what are you waiting for Grab this template today.
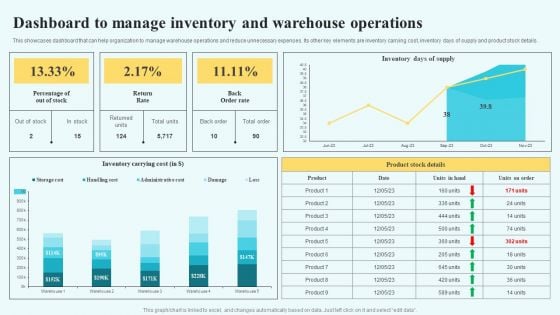
Adopting Multiple Tactics To Improve Inventory Optimization Dashboard To Manage Inventory And Warehouse Operations Guidelines PDF
This showcases dashboard that can help organization to manage warehouse operations and reduce unnecessary expenses. Its other key elements are inventory carrying cost, inventory days of supply and product stock details. Crafting an eye catching presentation has never been more straightforward. Let your presentation shine with this tasteful yet straightforward Adopting Multiple Tactics To Improve Inventory Optimization Dashboard To Manage Inventory And Warehouse Operations Guidelines PDF template. It offers a minimalistic and classy look that is great for making a statement. The colors have been employed intelligently to add a bit of playfulness while still remaining professional. Construct the ideal Adopting Multiple Tactics To Improve Inventory Optimization Dashboard To Manage Inventory And Warehouse Operations Guidelines PDF that effortlessly grabs the attention of your audience. Begin now and be certain to wow your customers.

Information Technology Solutions Company Outline Revenue From Operations From 2018 To 2022 Professional PDF
This slide showcases the revenue generated from operations for last five years from 2018 to 2022 such as consumer and enterprise platforms which shows increasing revenue year after year This Information Technology Solutions Company Outline Revenue From Operations From 2018 To 2022 Professional PDF is perfect for any presentation, be it in front of clients or colleagues. It is a versatile and stylish solution for organizing your meetings. The Information Technology Solutions Company Outline Revenue From Operations From 2018 To 2022 Professional PDF features a modern design for your presentation meetings. The adjustable and customizable slides provide unlimited possibilities for acing up your presentation. Slidegeeks has done all the homework before launching the product for you. So, do not wait, grab the presentation templates today
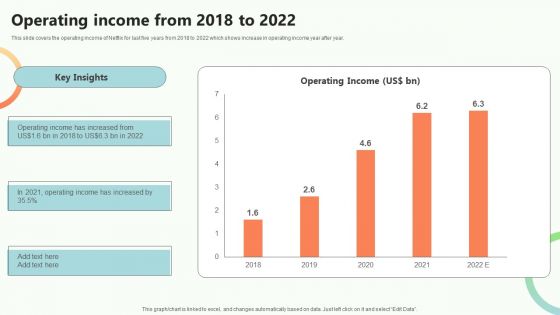
Online Video Content Provider Business Profile Operating Income From 2018 To 2022 Inspiration PDF
This slide covers the operating income of Netflix for last five years from 2018 to 2022 which shows increase in operating income year after year. This Online Video Content Provider Business Profile Operating Income From 2018 To 2022 Inspiration PDF is perfect for any presentation, be it in front of clients or colleagues. It is a versatile and stylish solution for organizing your meetings. The Online Video Content Provider Business Profile Operating Income From 2018 To 2022 Inspiration PDF features a modern design for your presentation meetings. The adjustable and customizable slides provide unlimited possibilities for acing up your presentation. Slidegeeks has done all the homework before launching the product for you. So, do not wait, grab the presentation templates today
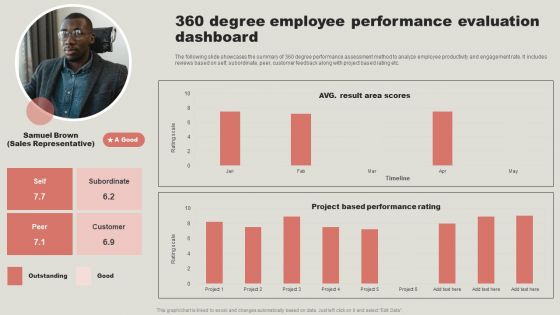
360 Degree Employee Performance Evaluation Dashboard Elements PDF
The following slide showcases the summary of 360 degree performance assessment method to analyze employee productivity and engagement rate. It includes reviews based on self, subordinate, peer, customer feedback along with project based rating etc. Presenting this PowerPoint presentation, titled 360 Degree Employee Performance Evaluation Dashboard Elements PDF, with topics curated by our researchers after extensive research. This editable presentation is available for immediate download and provides attractive features when used. Download now and captivate your audience. Presenting this 360 Degree Employee Performance Evaluation Dashboard Elements PDF. Our researchers have carefully researched and created these slides with all aspects taken into consideration. This is a completely customizable 360 Degree Employee Performance Evaluation Dashboard Elements PDF that is available for immediate downloading. Download now and make an impact on your audience. Highlight the attractive features available with our PPTs.

Customer Credit Reporting Company Outline Revenue And Dividend Per Share Pictures PDF
This slide highlights the Experian revenue and dividend per share which includes revenue, benchmark EBIT and EBIT margin, Benchmark earning per share and divided per share. This Customer Credit Reporting Company Outline Revenue And Dividend Per Share Pictures PDF is perfect for any presentation, be it in front of clients or colleagues. It is a versatile and stylish solution for organizing your meetings. The Customer Credit Reporting Company Outline Revenue And Dividend Per Share Pictures PDF features a modern design for your presentation meetings. The adjustable and customizable slides provide unlimited possibilities for acing up your presentation. Slidegeeks has done all the homework before launching the product for you. So, do not wait, grab the presentation templates today
Flexible Working Policies And Guidelines Impact Of Flexible Working On Employees Performance Topics PDF
Impact Of Improving Sales Process On Business Topics PDF
Overview Of Organizational Current Issues Introduction PDF
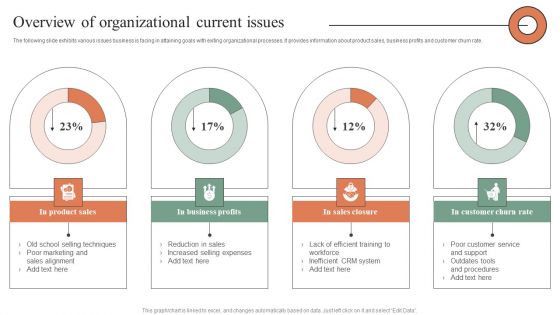
The following slide exhibits various issues business is facing in attaining goals with exiting organizational processes. It provides information about product sales, business profits and customer churn rate. Coming up with a presentation necessitates that the majority of the effort goes into the content and the message you intend to convey. The visuals of a PowerPoint presentation can only be effective if it supplements and supports the story that is being told. Keeping this in mind our experts created Overview Of Organizational Current Issues Introduction PDF to reduce the time that goes into designing the presentation. This way, you can concentrate on the message while our designers take care of providing you with the right template for the situation.
Deployment Of Omnichannel Banking Solutions Dashboard To Track Customers Account Statements Designs PDF
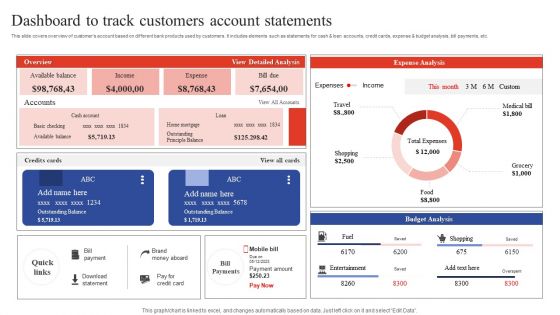
This slide covers overview of customers account based on different bank products used by customers. It includes elements such as statements for cash and loan accounts, credit cards, expense and budget analysis, bill payments, etc. Get a simple yet stunning designed Deployment Of Omnichannel Banking Solutions Dashboard To Track Customers Account Statements Designs PDF. It is the best one to establish the tone in your meetings. It is an excellent way to make your presentations highly effective. So, download this PPT today from Slidegeeks and see the positive impacts. Our easy to edit Deployment Of Omnichannel Banking Solutions Dashboard To Track Customers Account Statements Designs PDF can be your go to option for all upcoming conferences and meetings. So, what are you waiting for Grab this template today.
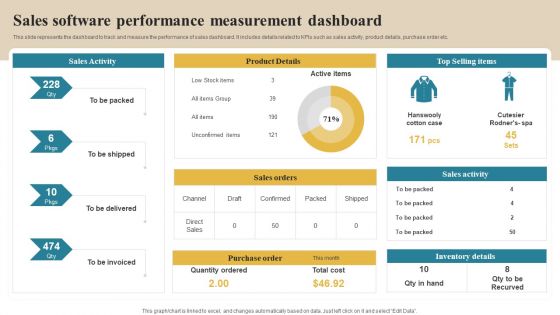
Software Implementation Technique Sales Software Performance Measurement Dashboard Slides PDF
This slide represents the dashboard to track and measure the performance of sales dashboard. It includes details related to KPIs such as sales activity, product details, purchase order etc. This modern and well arranged Software Implementation Technique Sales Software Performance Measurement Dashboard Slides PDF provides lots of creative possibilities. It is very simple to customize and edit with the Powerpoint Software. Just drag and drop your pictures into the shapes. All facets of this template can be edited with Powerpoint no extra software is necessary. Add your own material, put your images in the places assigned for them, adjust the colors, and then you can show your slides to the world, with an animated slide included.
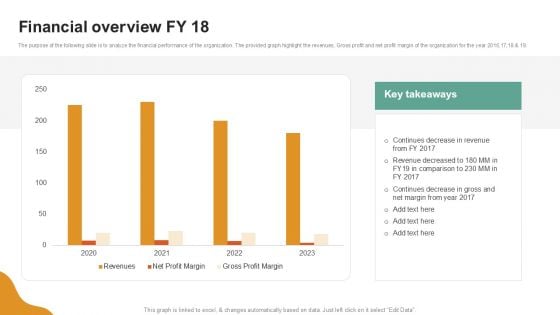
A LA Carte Business Strategy Financial Overview FY 18 Topics PDF
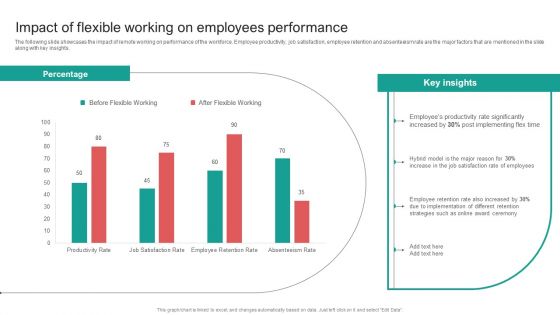
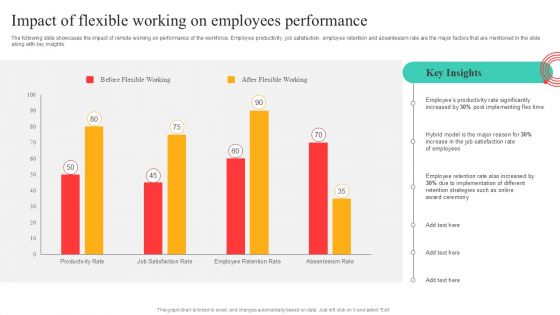
Organising Staff Flexible Job Arrangements Impact Of Flexible Working On Employees Performance Slides PDF
The following slide showcases the impact of remote working on performance of the workforce. Employee productivity, job satisfaction, employee retention and absenteeism rate are the major factors that are mentioned in the slide along with key insights. This Organising Staff Flexible Job Arrangements Impact Of Flexible Working On Employees Performance Slides PDF from Slidegeeks makes it easy to present information on your topic with precision. It provides customization options, so you can make changes to the colors, design, graphics, or any other component to create a unique layout. It is also available for immediate download, so you can begin using it right away. Slidegeeks has done good research to ensure that you have everything you need to make your presentation stand out. Make a name out there for a brilliant performance.
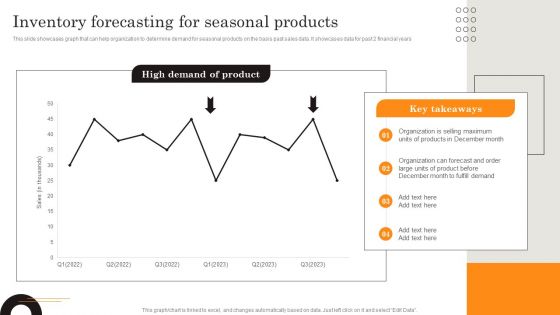
Procurement Strategies For Reducing Stock Wastage Inventory Forecasting For Seasonal Ideas PDF
This slide showcases graph that can help organization to determine demand for seasonal products on the basis past sales data. It showcases data for past 2 financial years. Do you have to make sure that everyone on your team knows about any specific topic I yes, then you should give Procurement Strategies For Reducing Stock Wastage Inventory Forecasting For Seasonal Ideas PDF a try. Our experts have put a lot of knowledge and effort into creating this impeccable Procurement Strategies For Reducing Stock Wastage Inventory Forecasting For Seasonal Ideas PDF. You can use this template for your upcoming presentations, as the slides are perfect to represent even the tiniest detail. You can download these templates from the Slidegeeks website and these are easy to edit. So grab these today.
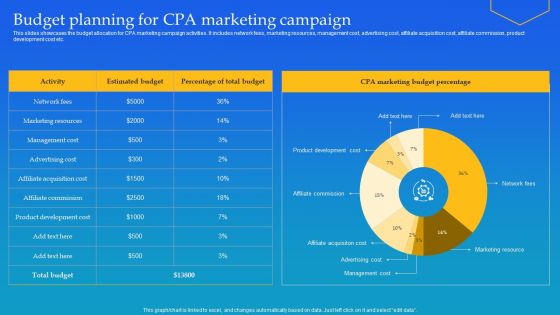
Budget Planning For CPA Marketing Campaign Ppt Professional Samples PDF
This slides showcases the budget allocation for CPA marketing campaign activities. It includes network fees, marketing resources, management cost, advertising cost, affiliate acquisition cost, affiliate commission, product development cost etc. Presenting this PowerPoint presentation, titled Budget Planning For CPA Marketing Campaign Ppt Professional Samples PDF, with topics curated by our researchers after extensive research. This editable presentation is available for immediate download and provides attractive features when used. Download now and captivate your audience. Presenting this Budget Planning For CPA Marketing Campaign Ppt Professional Samples PDF. Our researchers have carefully researched and created these slides with all aspects taken into consideration. This is a completely customizable Budget Planning For CPA Marketing Campaign Ppt Professional Samples PDF that is available for immediate downloading. Download now and make an impact on your audience. Highlight the attractive features available with our PPTs.
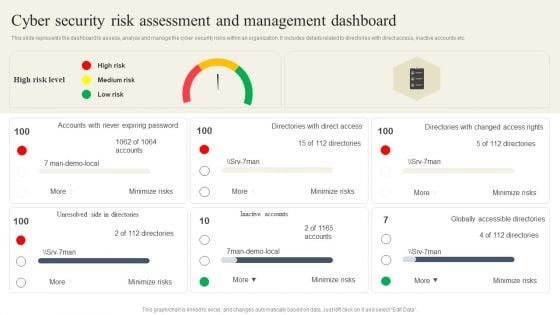
CYBER Security Breache Response Strategy Cyber Security Risk Assessment And Management Dashboard Summary PDF
This slide represents the dashboard to assess, analyze and manage the cyber security risks within an organization. It includes details related to directories with direct access, inactive accounts etc. This CYBER Security Breache Response Strategy Cyber Security Risk Assessment And Management Dashboard Summary PDF is perfect for any presentation, be it in front of clients or colleagues. It is a versatile and stylish solution for organizing your meetings. The CYBER Security Breache Response Strategy Cyber Security Risk Assessment And Management Dashboard Summary PDF features a modern design for your presentation meetings. The adjustable and customizable slides provide unlimited possibilities for acing up your presentation. Slidegeeks has done all the homework before launching the product for you. So, do not wait, grab the presentation templates today
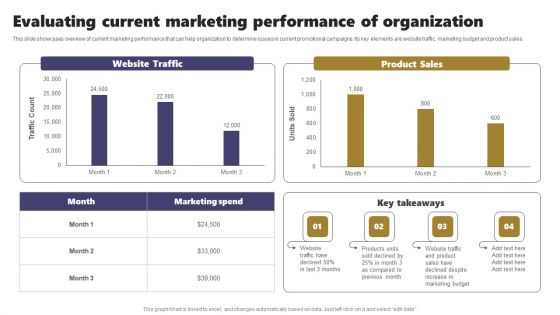
Acquiring Clients Through Search Engine And Native Ads Evaluating Current Marketing Performance Of Organization Brochure PDF
This slide showcases overview of current marketing performance that can help organization to determine issues in current promotional campaigns. Its key elements are website traffic, marketing budget and product sales. Find highly impressive Acquiring Clients Through Search Engine And Native Ads Evaluating Current Marketing Performance Of Organization Brochure PDF on Slidegeeks to deliver a meaningful presentation. You can save an ample amount of time using these presentation templates. No need to worry to prepare everything from scratch because Slidegeeks experts have already done a huge research and work for you. You need to download Acquiring Clients Through Search Engine And Native Ads Evaluating Current Marketing Performance Of Organization Brochure PDF for your upcoming presentation. All the presentation templates are 100 percent editable and you can change the color and personalize the content accordingly. Download now.
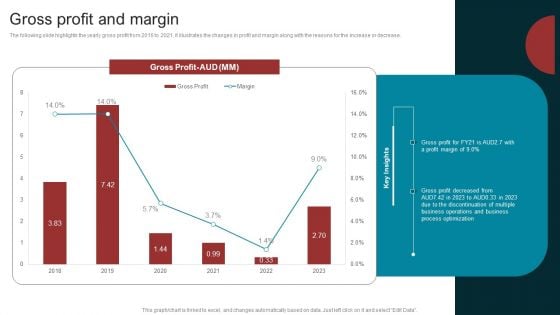
Marketing Agency Company Outline Gross Profit And Margin Guidelines PDF
The following slide highlights the yearly gross profit from 2016 to 2021. it illustrates the changes in profit and margin along with the reasons for the increase or decrease. This Marketing Agency Company Outline Gross Profit And Margin Guidelines PDF is perfect for any presentation, be it in front of clients or colleagues. It is a versatile and stylish solution for organizing your meetings. The Marketing Agency Company Outline Gross Profit And Margin Guidelines PDF features a modern design for your presentation meetings. The adjustable and customizable slides provide unlimited possibilities for acing up your presentation. Slidegeeks has done all the homework before launching the product for you. So, do not wait, grab the presentation templates today
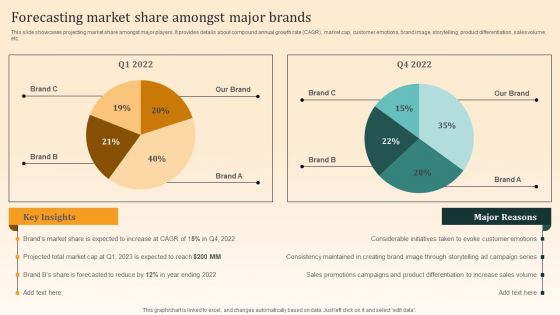
Nike Emotional Branding Strategy Forecasting Market Share Amongst Major Brands Microsoft PDF
This slide showcases projecting market share amongst major players. It provides details about compound annual growth rate CAGR, market cap, customer emotions, brand image, storytelling, product differentiation, sales volume, etc. Coming up with a presentation necessitates that the majority of the effort goes into the content and the message you intend to convey. The visuals of a PowerPoint presentation can only be effective if it supplements and supports the story that is being told. Keeping this in mind our experts created Nike Emotional Branding Strategy Forecasting Market Share Amongst Major Brands Microsoft PDF to reduce the time that goes into designing the presentation. This way, you can concentrate on the message while our designers take care of providing you with the right template for the situation.
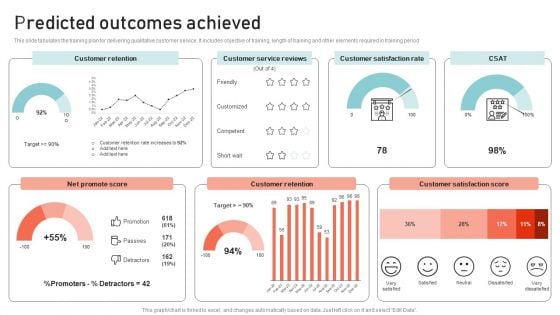
Optimizing Multichannel Strategy To Improve User Experience Predicted Outcomes Designs PDF
This slide tabulates the training plan for delivering qualitative customer service. It includes objective of training, length of training and other elements required in training period This Optimizing Multichannel Strategy To Improve User Experience Predicted Outcomes Designs PDF is perfect for any presentation, be it in front of clients or colleagues. It is a versatile and stylish solution for organizing your meetings. The Optimizing Multichannel Strategy To Improve User Experience Predicted Outcomes Designs PDF features a modern design for your presentation meetings. The adjustable and customizable slides provide unlimited possibilities for acing up your presentation. Slidegeeks has done all the homework before launching the product for you. So, do not wait, grab the presentation templates today
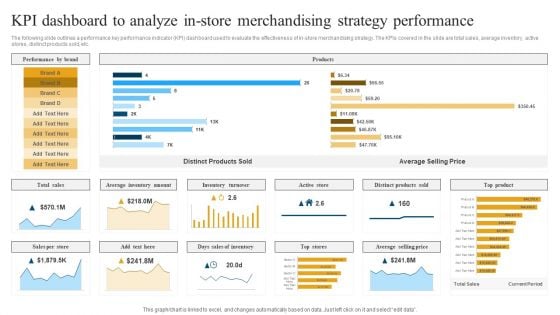
Retail Ecommerce Merchandising Tactics For Boosting Revenue KPI Dashboard To Analyze In Store Merchandising Rules PDF
The following slide outlines a performance key performance indicator KPI dashboard used to evaluate the effectiveness of in-store merchandising strategy. The KPIs covered in the slide are total sales, average inventory, active stores, distinct products sold, etc. Crafting an eye catching presentation has never been more straightforward. Let your presentation shine with this tasteful yet straightforward Retail Ecommerce Merchandising Tactics For Boosting Revenue KPI Dashboard To Analyze In Store Merchandising Rules PDF template. It offers a minimalistic and classy look that is great for making a statement. The colors have been employed intelligently to add a bit of playfulness while still remaining professional. Construct the ideal Retail Ecommerce Merchandising Tactics For Boosting Revenue KPI Dashboard To Analyze In Store Merchandising Rules PDF that effortlessly grabs the attention of your audience. Begin now and be certain to wow your customers.
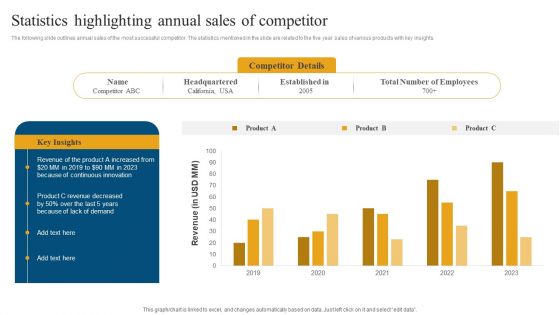
Retail Ecommerce Merchandising Tactics For Boosting Revenue Statistics Highlighting Annual Sales Of Competitor Brochure PDF
The following slide outlines annual sales of the most successful competitor. The statistics mentioned in the slide are related to the five year sales of various products with key insights. Presenting this PowerPoint presentation, titled Retail Ecommerce Merchandising Tactics For Boosting Revenue Statistics Highlighting Annual Sales Of Competitor Brochure PDF, with topics curated by our researchers after extensive research. This editable presentation is available for immediate download and provides attractive features when used. Download now and captivate your audience. Presenting this Retail Ecommerce Merchandising Tactics For Boosting Revenue Statistics Highlighting Annual Sales Of Competitor Brochure PDF. Our researchers have carefully researched and created these slides with all aspects taken into consideration. This is a completely customizable Retail Ecommerce Merchandising Tactics For Boosting Revenue Statistics Highlighting Annual Sales Of Competitor Brochure PDF that is available for immediate downloading. Download now and make an impact on your audience. Highlight the attractive features available with our PPTs.
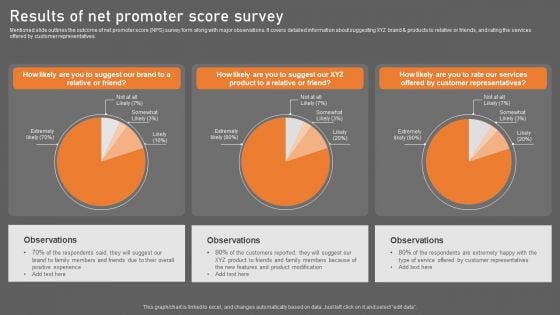
Results Of Net Promoter Building Consumer Loyalty By Reducing Churn Rate Pictures PDF
Mentioned slide outlines the outcome of net promoter score NPS survey form along with major observations. It covers detailed information about suggesting XYZ brand and products to relative or friends, and rating the services offered by customer representatives. Get a simple yet stunning designed Results Of Net Promoter Building Consumer Loyalty By Reducing Churn Rate Pictures PDF. It is the best one to establish the tone in your meetings. It is an excellent way to make your presentations highly effective. So, download this PPT today from Slidegeeks and see the positive impacts. Our easy to edit Results Of Net Promoter Building Consumer Loyalty By Reducing Churn Rate Pictures PDF can be your go to option for all upcoming conferences and meetings. So, what are you waiting for Grab this template today.
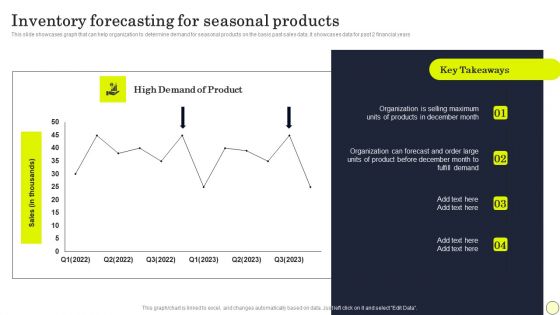
Strategies To Order And Manage Ideal Inventory Levels Inventory Forecasting Elements PDF
This slide showcases graph that can help organization to determine demand for seasonal products on the basis past sales data. It showcases data for past 2 financial years. Do you have to make sure that everyone on your team knows about any specific topic I yes, then you should give Strategies To Order And Manage Ideal Inventory Levels Inventory Forecasting Elements PDF a try. Our experts have put a lot of knowledge and effort into creating this impeccable Strategies To Order And Manage Ideal Inventory Levels Inventory Forecasting Elements PDF. You can use this template for your upcoming presentations, as the slides are perfect to represent even the tiniest detail. You can download these templates from the Slidegeeks website and these are easy to edit. So grab these today.
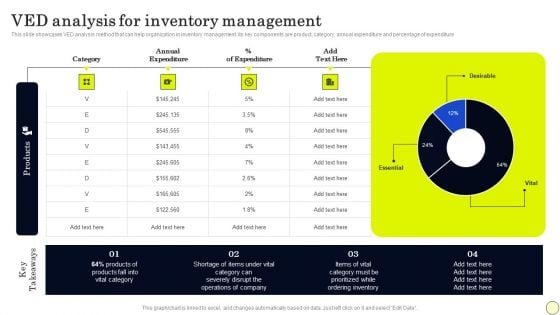
Strategies To Order And Manage Ideal Inventory Levels VED Analysis For Inventory Brochure PDF
This slide showcases VED analysis method that can help organization in inventory management. its key components are product, category, annual expenditure and percentage of expenditure. Present like a pro with Strategies To Order And Manage Ideal Inventory Levels VED Analysis For Inventory Brochure PDF Create beautiful presentations together with your team, using our easy to use presentation slides. Share your ideas in real time and make changes on the fly by downloading our templates. So whether you are in the office, on the go, or in a remote location, you can stay in sync with your team and present your ideas with confidence. With Slidegeeks presentation got a whole lot easier. Grab these presentations today.
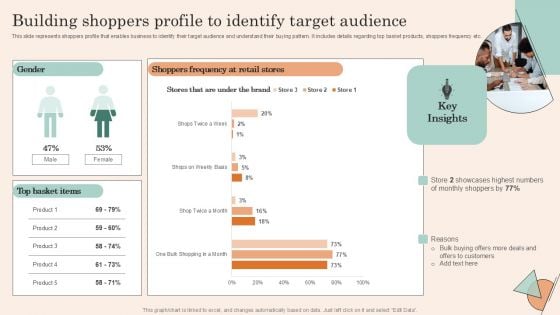
Retail Promotion Strategies To Elevate Shopper Building Shoppers Profile To Identify Target Background PDF
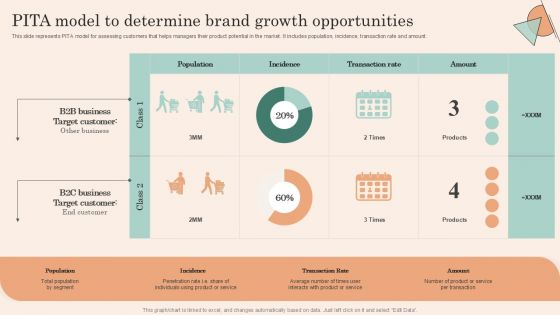
Retail Promotion Strategies To Elevate Shopper PITA Model To Determine Brand Growth Formats PDF
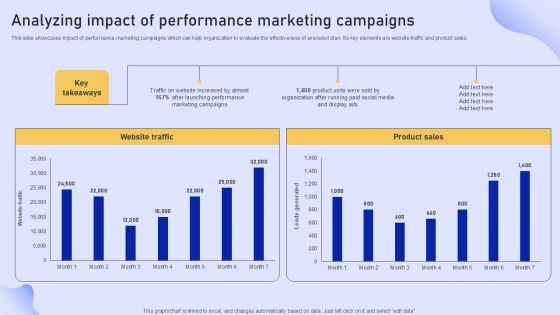
Online Marketing Strategy For Lead Generation Evaluating Current Marketing Performance Of Organization Slides PDF
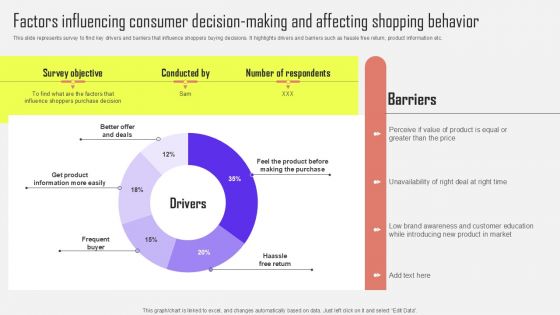
Factors Influencing Consumer Decision Making Optimizing Customer Purchase Experience By Executi Rules PDF
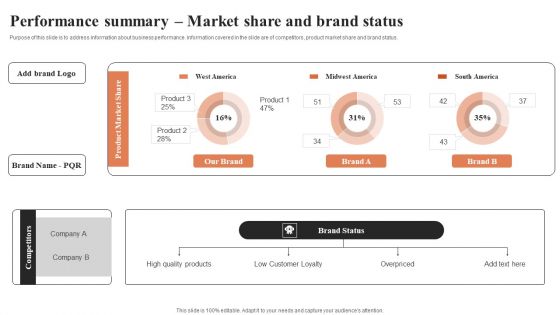
Performance Summary Market Share And Brand Status Ppt Pictures Brochure PDF
Purpose of this slide is to address information about business performance. Information covered in the slide are of competitors, product market share and brand status. Are you in need of a template that can accommodate all of your creative concepts This one is crafted professionally and can be altered to fit any style. Use it with Google Slides or PowerPoint. Include striking photographs, symbols, depictions, and other visuals. Fill, move around, or remove text boxes as desired. Test out color palettes and font mixtures. Edit and save your work, or work with colleagues. Download Performance Summary Market Share And Brand Status Ppt Pictures Brochure PDF and observe how to make your presentation outstanding. Give an impeccable presentation to your group and make your presentation unforgettable.
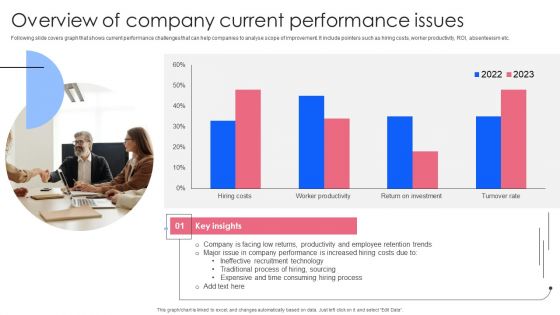
Effective Guide To Build Strong Online Hiring Strategy Overview Of Company Current Performance Issues Designs PDF
Following slide covers graph that shows current performance challenges that can help companies to analyse scope of improvement. It include pointers such as hiring costs, worker productivity, ROI, absenteeism etc. Get a simple yet stunning designed Effective Guide To Build Strong Online Hiring Strategy Overview Of Company Current Performance Issues Designs PDF. It is the best one to establish the tone in your meetings. It is an excellent way to make your presentations highly effective. So, download this PPT today from Slidegeeks and see the positive impacts. Our easy to edit Effective Guide To Build Strong Online Hiring Strategy Overview Of Company Current Performance Issues Designs PDF can be your go to option for all upcoming conferences and meetings. So, what are you waiting for Grab this template today.
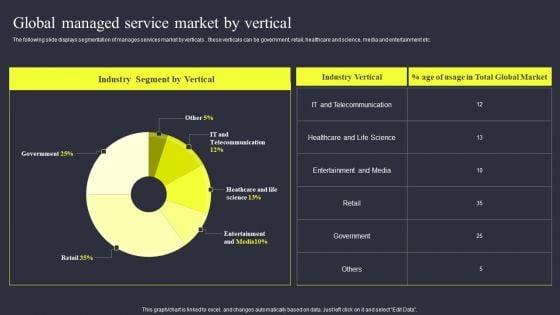
Strategies To Enhance Managed Service Business Global Managed Service Market By Vertical Summary PDF
The following slide displays segmentation of manages services market by verticals , these verticals can be government, retail, healthcare and science, media and entertainment etc. This Strategies To Enhance Managed Service Business Global Managed Service Market By Vertical Summary PDF is perfect for any presentation, be it in front of clients or colleagues. It is a versatile and stylish solution for organizing your meetings. The Strategies To Enhance Managed Service Business Global Managed Service Market By Vertical Summary PDF features a modern design for your presentation meetings. The adjustable and customizable slides provide unlimited possibilities for acing up your presentation. Slidegeeks has done all the homework before launching the product for you. So, do not wait, grab the presentation templates today
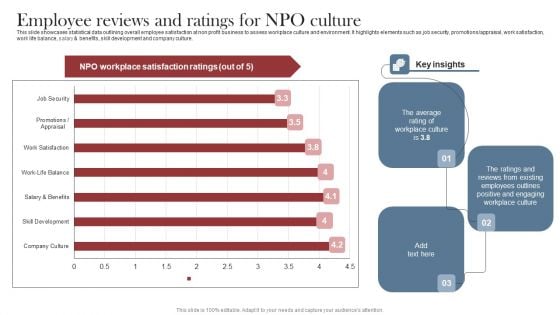
Recruitment Marketing Strategies For NPO Business Employee Reviews And Ratings For NPO Culture Elements PDF
This slide showcases statistical data outlining overall employee satisfaction at non profit business to assess workplace culture and environment. It highlights elements such as job security, promotions appraisal, work satisfaction, work life balance, salary and benefits, skill development and company culture. This Recruitment Marketing Strategies For NPO Business Employee Reviews And Ratings For NPO Culture Elements PDF is perfect for any presentation, be it in front of clients or colleagues. It is a versatile and stylish solution for organizing your meetings. The Recruitment Marketing Strategies For NPO Business Employee Reviews And Ratings For NPO Culture Elements PDF features a modern design for your presentation meetings. The adjustable and customizable slides provide unlimited possibilities for acing up your presentation. Slidegeeks has done all the homework before launching the product for you. So, do not wait, grab the presentation templates today
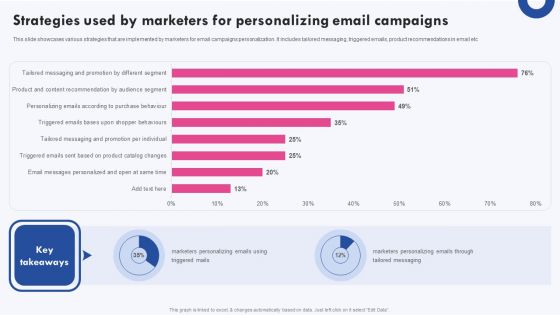
Targeted Marketing Campaigns To Improve Buyers Experience Strategies Used By Marketers For Personalizing Mockup PDF
This slide showcases various strategies that are implemented by marketers for email campaigns personalization. It includes tailored messaging, triggered emails, product recommendations in email etc Formulating a presentation can take up a lot of effort and time, so the content and message should always be the primary focus. The visuals of the PowerPoint can enhance the presenters message, so our Targeted Marketing Campaigns To Improve Buyers Experience Strategies Used By Marketers For Personalizing Mockup PDF was created to help save time. Instead of worrying about the design, the presenter can concentrate on the message while our designers work on creating the ideal templates for whatever situation is needed. Slidegeeks has experts for everything from amazing designs to valuable content, we have put everything into Targeted Marketing Campaigns To Improve Buyers Experience Strategies Used By Marketers For Personalizing Mockup PDF
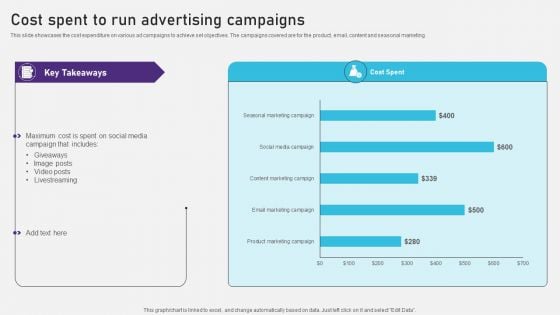
Advertising Campaign Optimization Process Cost Spent To Run Advertising Campaigns Template PDF
This slide showcases the cost expenditure on various ad campaigns to achieve set objectives. The campaigns covered are for the product, email, content and seasonal marketing. Here you can discover an assortment of the finest PowerPoint and Google Slides templates. With these templates, you can create presentations for a variety of purposes while simultaneously providing your audience with an eye catching visual experience. Download Advertising Campaign Optimization Process Cost Spent To Run Advertising Campaigns Template PDF to deliver an impeccable presentation. These templates will make your job of preparing presentations much quicker, yet still, maintain a high level of quality. Slidegeeks has experienced researchers who prepare these templates and write high quality content for you. Later on, you can personalize the content by editing the Advertising Campaign Optimization Process Cost Spent To Run Advertising Campaigns Template PDF.
Predictive Analytics Methods Predictive Analytics Model Performance Tracking Dashboard Structure PDF
This slide represents the predictive analytics model performance tracking dashboard, and it covers the details of total visitors, total buyers, total products added to the cart, filters by date and category, visitors to clients conversion rate, and so on. Want to ace your presentation in front of a live audience Our Predictive Analytics Methods Predictive Analytics Model Performance Tracking Dashboard Structure PDF can help you do that by engaging all the users towards you. Slidegeeks experts have put their efforts and expertise into creating these impeccable powerpoint presentations so that you can communicate your ideas clearly. Moreover, all the templates are customizable, and easy to edit and downloadable. Use these for both personal and commercial use.
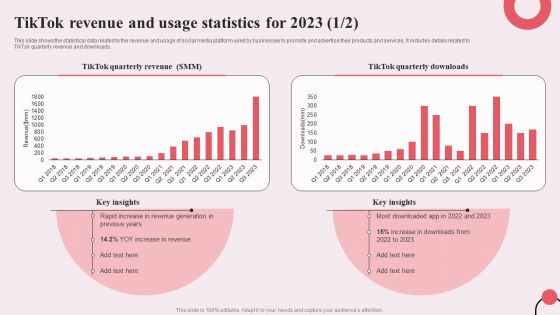
Tiktok Digital Marketing Campaign Tiktok Revenue And Usage Statistics For 2023 Demonstration PDF
This slide shows the statistical data related to the revenue and usage of social media platform used by businesses to promote and advertise their products and services. It includes details related to TikTok quarterly revenue and downloads. Create an editable Tiktok Digital Marketing Campaign Tiktok Revenue And Usage Statistics For 2023 Demonstration PDF that communicates your idea and engages your audience. Whether you are presenting a business or an educational presentation, pre-designed presentation templates help save time. Tiktok Digital Marketing Campaign Tiktok Revenue And Usage Statistics For 2023 Demonstration PDF is highly customizable and very easy to edit, covering many different styles from creative to business presentations. Slidegeeks has creative team members who have crafted amazing templates. So, go and get them without any delay.
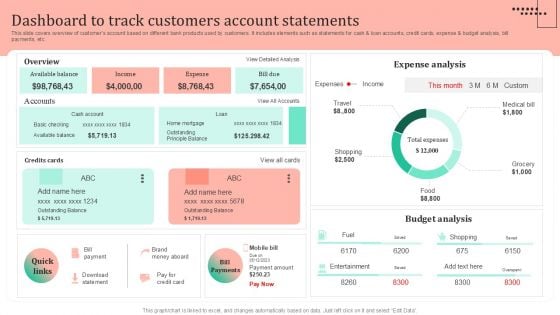
Omnichannel Strategy Implementation For Banking Solutions Dashboard To Track Customers Account Topics PDF
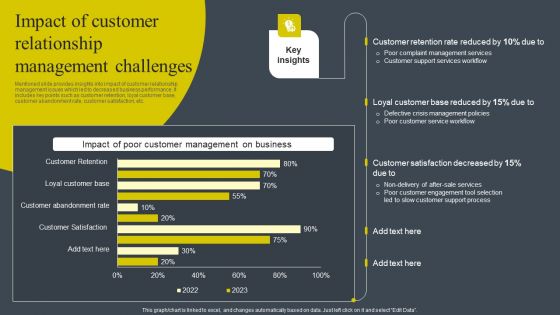
Impact Of Customer Relationship Management Challenges Pictures PDF
Mentioned slide provides insights into impact of customer relationship management issues which led to decreased business performance. It includes key points such as customer retention, loyal customer base, customer abandonment rate, customer satisfaction, etc. This Impact Of Customer Relationship Management Challenges Pictures PDF is perfect for any presentation, be it in front of clients or colleagues. It is a versatile and stylish solution for organizing your meetings. The Impact Of Customer Relationship Management Challenges Pictures PDF features a modern design for your presentation meetings. The adjustable and customizable slides provide unlimited possibilities for acing up your presentation. Slidegeeks has done all the homework before launching the product for you. So, do not wait, grab the presentation templates today
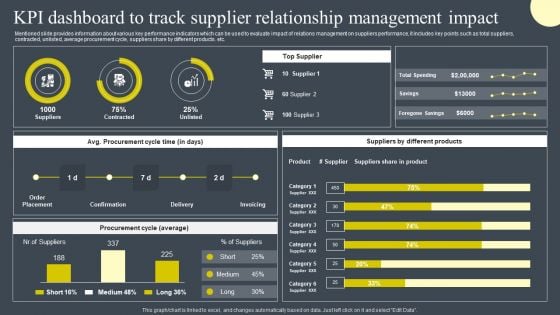
KPI Dashboard To Track Supplier Relationship Management Impact Inspiration PDF
Mentioned slide provides information about various key performance indicators which can be used to evaluate impact of relations management on suppliers performance, it includes key points such as total suppliers, contracted, unlisted, average procurement cycle, suppliers share by different products. etc. Slidegeeks has constructed KPI Dashboard To Track Supplier Relationship Management Impact Inspiration PDF after conducting extensive research and examination. These presentation templates are constantly being generated and modified based on user preferences and critiques from editors. Here, you will find the most attractive templates for a range of purposes while taking into account ratings and remarks from users regarding the content. This is an excellent jumping-off point to explore our content and will give new users an insight into our top-notch PowerPoint Templates.
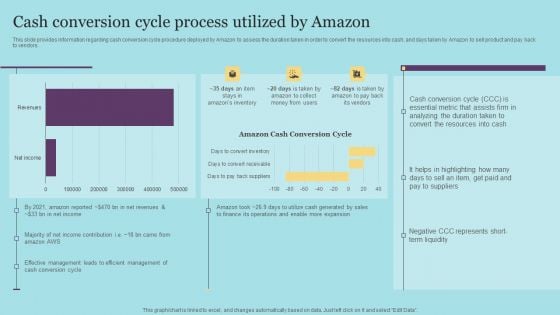
Cash Conversion Cycle Process Utilized By Amazon Download PDF
This slide provides information regarding cash conversion cycle procedure deployed by Amazon to assess the duration taken in order to convert the resources into cash, and days taken by Amazon to sell product and pay back to vendors. Boost your pitch with our creative Cash Conversion Cycle Process Utilized By Amazon Download PDF. Deliver an awe-inspiring pitch that will mesmerize everyone. Using these presentation templates you will surely catch everyones attention. You can browse the ppts collection on our website. We have researchers who are experts at creating the right content for the templates. So you do not have to invest time in any additional work. Just grab the template now and use them.
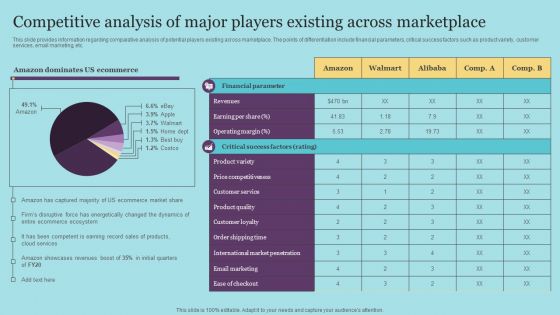
Competitive Analysis Of Major Players Existing Across Marketplace Guidelines PDF
This slide provides information regarding comparative analysis of potential players existing across marketplace. The points of differentiation include financial parameters, critical success factors such as product variety, customer services, email marketing, etc. Create an editable Competitive Analysis Of Major Players Existing Across Marketplace Guidelines PDF that communicates your idea and engages your audience. Whether you are presenting a business or an educational presentation, pre-designed presentation templates help save time. Competitive Analysis Of Major Players Existing Across Marketplace Guidelines PDF is highly customizable and very easy to edit, covering many different styles from creative to business presentations. Slidegeeks has creative team members who have crafted amazing templates. So, go and get them without any delay.
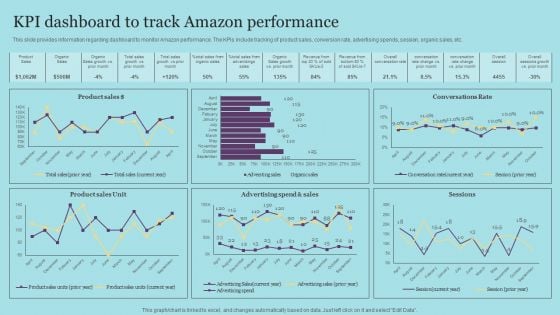
KPI Dashboard To Track Amazon Performance Designs PDF
This slide provides information regarding dashboard to monitor Amazon performance. The KPIs include tracking of product sales, conversion rate, advertising spends, session, organic sales, etc. Do you have to make sure that everyone on your team knows about any specific topic I yes, then you should give KPI Dashboard To Track Amazon Performance Designs PDF a try. Our experts have put a lot of knowledge and effort into creating this impeccable KPI Dashboard To Track Amazon Performance Designs PDF. You can use this template for your upcoming presentations, as the slides are perfect to represent even the tiniest detail. You can download these templates from the Slidegeeks website and these are easy to edit. So grab these today
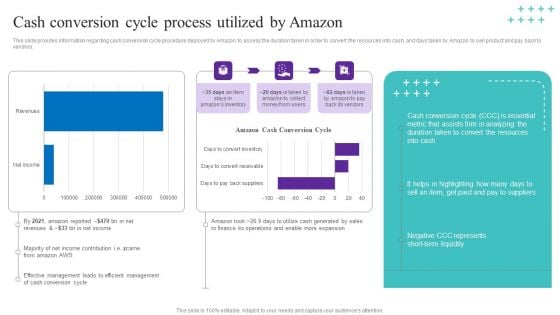
Cash Conversion Cycle Process Utilized By Amazon Portrait PDF
This slide provides information regarding cash conversion cycle procedure deployed by Amazon to assess the duration taken in order to convert the resources into cash, and days taken by Amazon to sell product and pay back to vendors. Boost your pitch with our creative Cash Conversion Cycle Process Utilized By Amazon Portrait PDF. Deliver an awe-inspiring pitch that will mesmerize everyone. Using these presentation templates you will surely catch everyones attention. You can browse the ppts collection on our website. We have researchers who are experts at creating the right content for the templates. So you do not have to invest time in any additional work. Just grab the template now and use them.
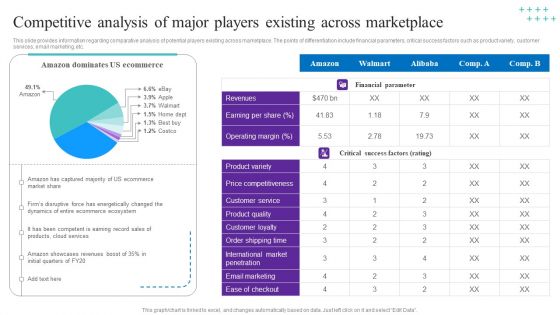
Competitive Analysis Of Major Players Existing Across Marketplace Mockup PDF
This slide provides information regarding comparative analysis of potential players existing across marketplace. The points of differentiation include financial parameters, critical success factors such as product variety, customer services, email marketing, etc. Create an editable Competitive Analysis Of Major Players Existing Across Marketplace Mockup PDF that communicates your idea and engages your audience. Whether you are presenting a business or an educational presentation, pre-designed presentation templates help save time. Competitive Analysis Of Major Players Existing Across Marketplace Mockup PDF is highly customizable and very easy to edit, covering many different styles from creative to business presentations. Slidegeeks has creative team members who have crafted amazing templates. So, go and get them without any delay.
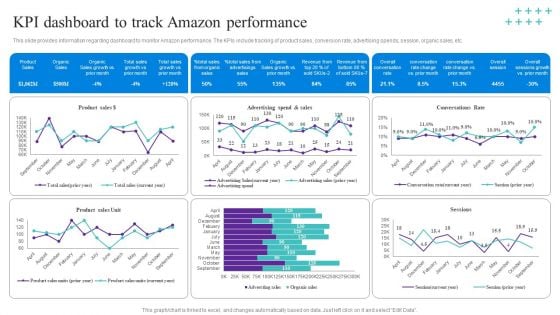
KPI Dashboard To Track Amazon Performance Template PDF
This slide provides information regarding dashboard to monitor Amazon performance. The KPIs include tracking of product sales, conversion rate, advertising spends, session, organic sales, etc. Do you have to make sure that everyone on your team knows about any specific topic I yes, then you should give KPI Dashboard To Track Amazon Performance Template PDF a try. Our experts have put a lot of knowledge and effort into creating this impeccable KPI Dashboard To Track Amazon Performance Template PDF. You can use this template for your upcoming presentations, as the slides are perfect to represent even the tiniest detail. You can download these templates from the Slidegeeks website and these are easy to edit. So grab these today
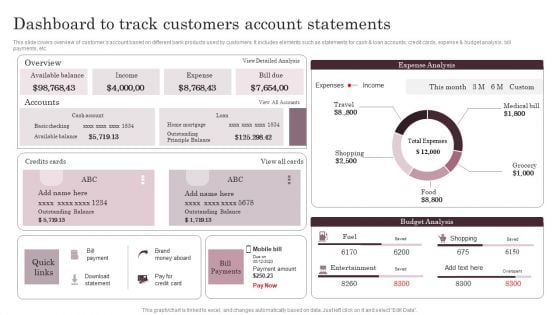
Omnichannel Services Solution In Financial Sector Dashboard To Track Customers Account Statements Guidelines PDF
This slide covers overview of customers account based on different bank products used by customers. It includes elements such as statements for cash and loan accounts, credit cards, expense and budget analysis, bill payments, etc. Create an editable Omnichannel Services Solution In Financial Sector Dashboard To Track Customers Account Statements Guidelines PDF that communicates your idea and engages your audience. Whether you are presenting a business or an educational presentation, pre designed presentation templates help save time. Omnichannel Services Solution In Financial Sector Dashboard To Track Customers Account Statements Guidelines PDF is highly customizable and very easy to edit, covering many different styles from creative to business presentations. Slidegeeks has creative team members who have crafted amazing templates. So, go and get them without any delay.
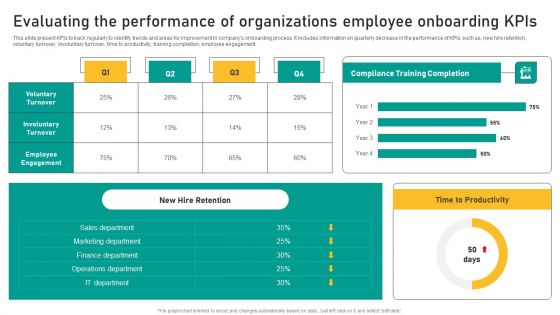
Talent Retention Initiatives For New Hire Onboarding Evaluating The Performance Of Organizations Rules PDF
This slide present KPIs to track regularly to identify trends and areas for improvement in companys onboarding process. It includes information on quarterly decrease in the performance of KPIs such as, new hire retention, voluntary turnover, involuntary turnover, time to productivity, training completion, employee engagement. Slidegeeks is one of the best resources for PowerPoint templates. You can download easily and regulate Talent Retention Initiatives For New Hire Onboarding Evaluating The Performance Of Organizations Rules PDF for your personal presentations from our wonderful collection. A few clicks is all it takes to discover and get the most relevant and appropriate templates. Use our Templates to add a unique zing and appeal to your presentation and meetings. All the slides are easy to edit and you can use them even for advertisement purposes.
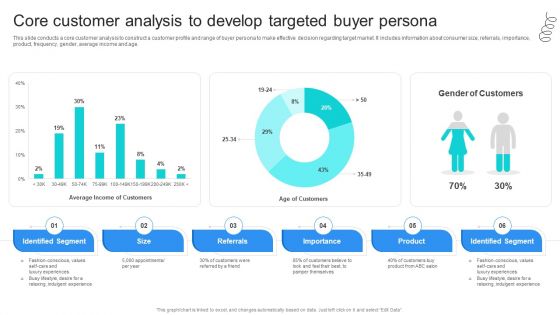
Strategic Marketing For Hair And Beauty Salon To Increase Core Customer Analysis To Develop Clipart PDF
This slide conducts a core customer analysis to construct a customer profile and range of buyer persona to make effective decision regarding target market. It includes information about consumer size, referrals, importance, product, frequency, gender, average income and age. Crafting an eye catching presentation has never been more straightforward. Let your presentation shine with this tasteful yet straightforward Strategic Marketing For Hair And Beauty Salon To Increase Core Customer Analysis To Develop Clipart PDF template. It offers a minimalistic and classy look that is great for making a statement. The colors have been employed intelligently to add a bit of playfulness while still remaining professional. Construct the ideal Strategic Marketing For Hair And Beauty Salon To Increase Core Customer Analysis To Develop Clipart PDF that effortlessly grabs the attention of your audience. Begin now and be certain to wow your customers.
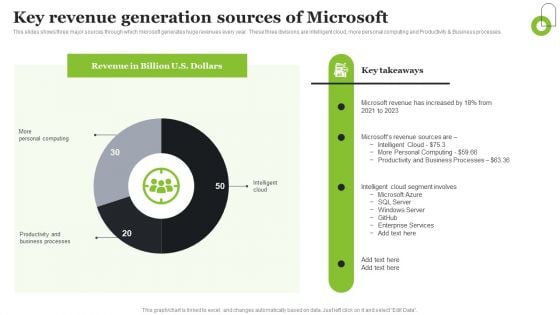
Microsoft Strategic Plan To Become Market Leader Key Revenue Generation Sources Of Microsoft Formats PDF
This slides shows three major sources through which microsoft generates huge revenues every year. These three divisions are intelligent cloud, more personal computing and Productivity and Business processes. Slidegeeks is one of the best resources for PowerPoint templates. You can download easily and regulate Microsoft Strategic Plan To Become Market Leader Key Revenue Generation Sources Of Microsoft Formats PDF for your personal presentations from our wonderful collection. A few clicks is all it takes to discover and get the most relevant and appropriate templates. Use our Templates to add a unique zing and appeal to your presentation and meetings. All the slides are easy to edit and you can use them even for advertisement purposes.
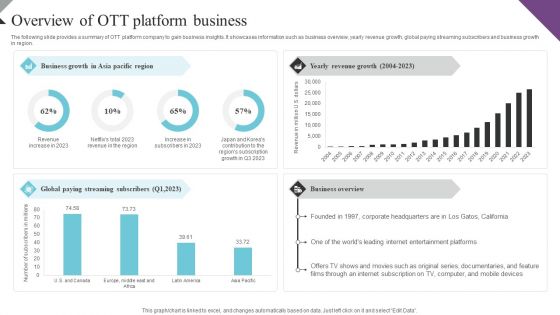
Customer Segmentation And Behavioral Analysis Overview Of OTT Platform Business Structure PDF
The following slide provides a summary of OTT platform company to gain business insights. It showcases information such as business overview, yearly revenue growth, global paying streaming subscribers and business growth in region. This Customer Segmentation And Behavioral Analysis Overview Of OTT Platform Business Structure PDF is perfect for any presentation, be it in front of clients or colleagues. It is a versatile and stylish solution for organizing your meetings. The Customer Segmentation And Behavioral Analysis Overview Of OTT Platform Business Structure PDF features a modern design for your presentation meetings. The adjustable and customizable slides provide unlimited possibilities for acing up your presentation. Slidegeeks has done all the homework before launching the product for you. So, do not wait, grab the presentation templates today
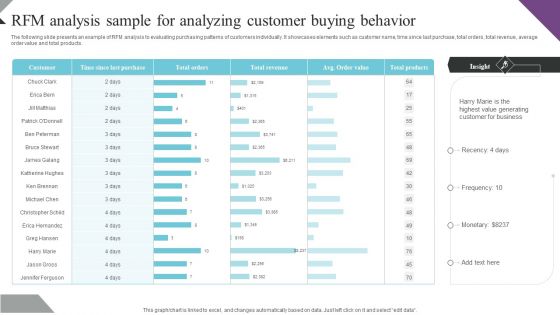
Customer Segmentation And Behavioral Analysis Rfm Analysis Sample For Analyzing Brochure PDF
The following slide presents an example of RFM analysis to evaluating purchasing patterns of customers individually. It showcases elements such as customer name, time since last purchase, total orders, total revenue, average order value and total products. Explore a selection of the finest Customer Segmentation And Behavioral Analysis Rfm Analysis Sample For Analyzing Brochure PDF here. With a plethora of professionally designed and pre made slide templates, you can quickly and easily find the right one for your upcoming presentation. You can use our Customer Segmentation And Behavioral Analysis Rfm Analysis Sample For Analyzing Brochure PDF to effectively convey your message to a wider audience. Slidegeeks has done a lot of research before preparing these presentation templates. The content can be personalized and the slides are highly editable. Grab templates today from Slidegeeks.
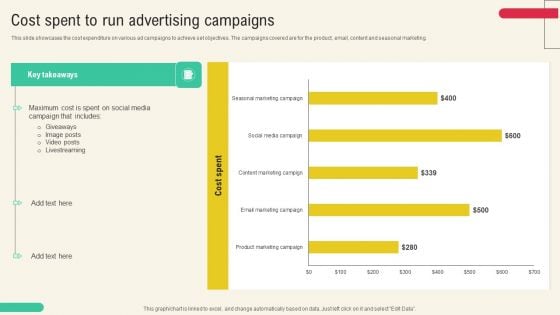
Client Acquisition Through Marketing Campaign Cost Spent To Run Advertising Campaigns Slides PDF
This slide showcases the cost expenditure on various ad campaigns to achieve set objectives. The campaigns covered are for the product, email, content and seasonal marketing. Create an editable Client Acquisition Through Marketing Campaign Cost Spent To Run Advertising Campaigns Slides PDF that communicates your idea and engages your audience. Whether you are presenting a business or an educational presentation, pre designed presentation templates help save time. Client Acquisition Through Marketing Campaign Cost Spent To Run Advertising Campaigns Slides PDF is highly customizable and very easy to edit, covering many different styles from creative to business presentations. Slidegeeks has creative team members who have crafted amazing templates. So, go and get them without any delay.
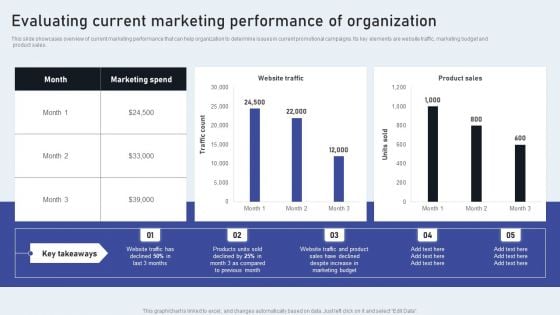
Evaluating Current Marketing Performance Of Organization Rules PDF
This slide showcases overview of current marketing performance that can help organization to determine issues in current promotional campaigns. Its key elements are website traffic, marketing budget and product sales. This Evaluating Current Marketing Performance Of Organization Rules PDF from Slidegeeks makes it easy to present information on your topic with precision. It provides customization options, so you can make changes to the colors, design, graphics, or any other component to create a unique layout. It is also available for immediate download, so you can begin using it right away. Slidegeeks has done good research to ensure that you have everything you need to make your presentation stand out. Make a name out there for a brilliant performance.
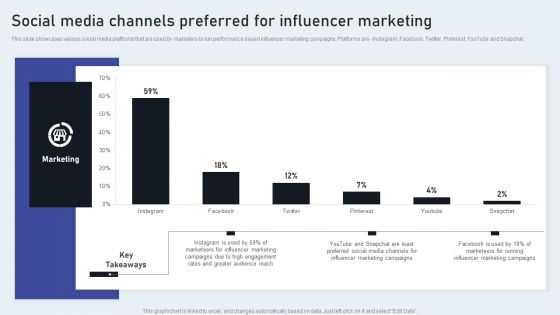
Social Media Channels Preferred For Influencer Marketing Graphics PDF
This slide showcases various social media platforms that are used by marketers to run performance based influencer marketing campaigns. Platforms are - Instagram, Facebook, Twitter, Pinterest, YouTube and Snapchat. This Social Media Channels Preferred For Influencer Marketing Graphics PDF is perfect for any presentation, be it in front of clients or colleagues. It is a versatile and stylish solution for organizing your meetings. The Social Media Channels Preferred For Influencer Marketing Graphics PDF features a modern design for your presentation meetings. The adjustable and customizable slides provide unlimited possibilities for acing up your presentation. Slidegeeks has done all the homework before launching the product for you. So, do not wait, grab the presentation templates today
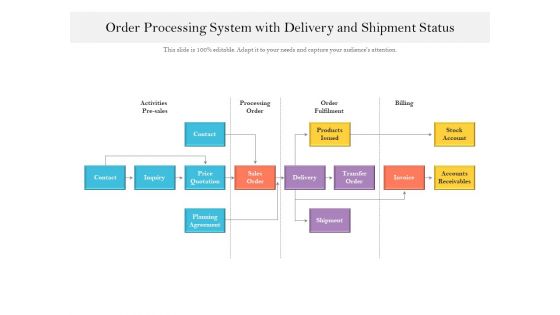
Order Processing System With Delivery And Shipment Status Ppt PowerPoint Presentation Ideas Visual Aids PDF
Presenting order processing system with delivery and shipment status ppt powerpoint presentation ideas visual aids pdf to dispense important information. This template comprises one stages. It also presents valuable insights into the topics including contact, products issued, stock account, order fulfilment, billing, processing order, activities pre sales, contact, inquiry, price quotation, sales order, delivery, transfer order, invoice, accounts receivables, shipment, planning agreement. This is a completely customizable PowerPoint theme that can be put to use immediately. So, download it and address the topic impactfully.
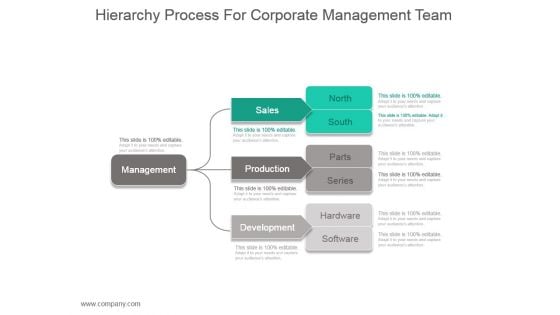
Hierarchy Process For Corporate Management Team Ppt Slide
This is a hierarchy process for corporate management team ppt slide. This is a three stage process. The stages in this process are management, sales, production, development, north, south, parts, series, hardware, software.
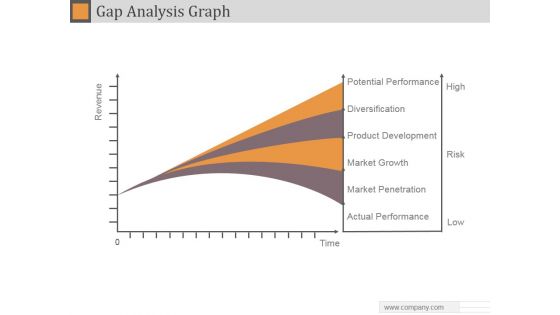
Gap Analysis Graph Ppt PowerPoint Presentation Example 2015
This is a gap analysis graph ppt powerpoint presentation example 2015. This is a four stage process. The stages in this process are potential performance, diversification, product development, market growth, market penetration, actual performance.
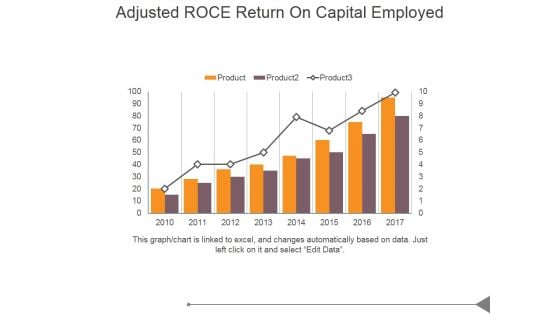
Adjusted Roce Return On Capital Employed Ppt PowerPoint Presentation Tips
This is a adjusted roce return on capital employed ppt powerpoint presentation tips. This is a eight stage process. The stages in this process are business, marketing, success, product, growth.
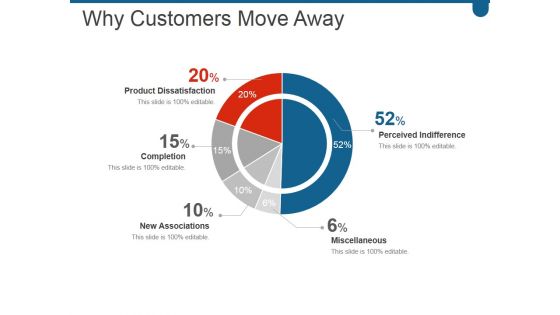
Why Customers Move Away Ppt PowerPoint Presentation Outline Mockup
This is a why customers move away ppt powerpoint presentation outline mockup. This is a five stage process. The stages in this process are product dissatisfaction, completion, new associations, perceived indifference, miscellaneous.
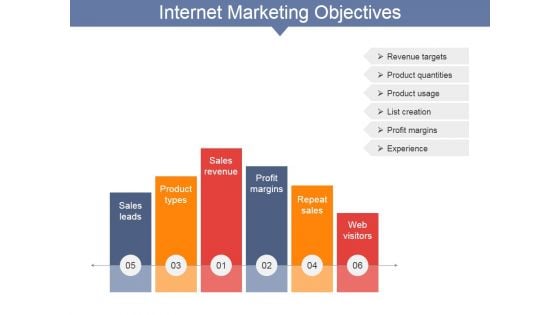
Internet Marketing Objectives Ppt PowerPoint Presentation Layouts Smartart
This is a internet marketing objectives ppt powerpoint presentation layouts smartart. This is a six stage process. The stages in this process are sales leads, product types, sales revenue, profit margins, repeat sales, web visitors.
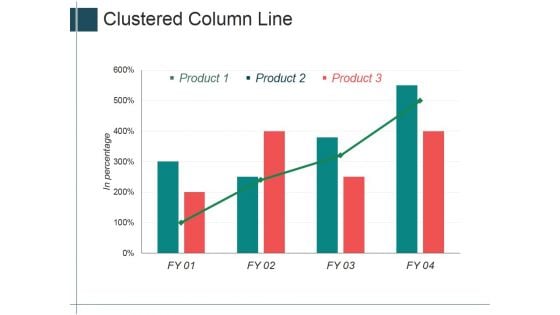
Clustered Column Line Ppt Powerpoint Presentation Ideas Inspiration
This is a clustered column line ppt powerpoint presentation ideas inspiration. This is a four stage process. The stages in this process are product, in percentage, graph, management, business.
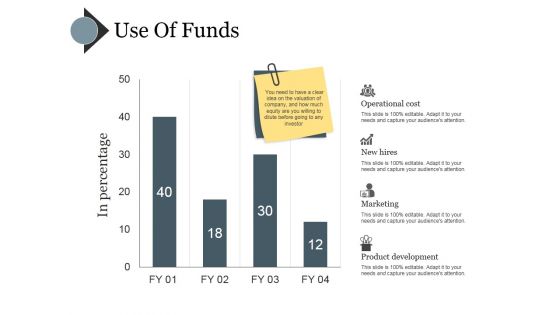
Use Of Funds Ppt PowerPoint Presentation Portfolio Clipart
This is a use of funds ppt powerpoint presentation portfolio clipart. This is a four stage process. The stages in this process are operational cost, new hires, marketing, product development.
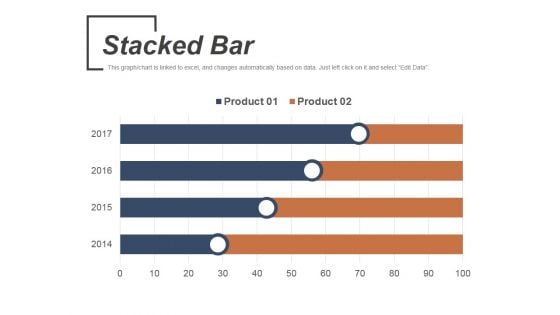
Stacked Bar Template 1 Ppt PowerPoint Presentation Infographic Template Format
This is a stacked bar template 1 ppt powerpoint presentation infographic template format. This is a four stage process. The stages in this process are product, stacked bar, business, marketing, bar graph.
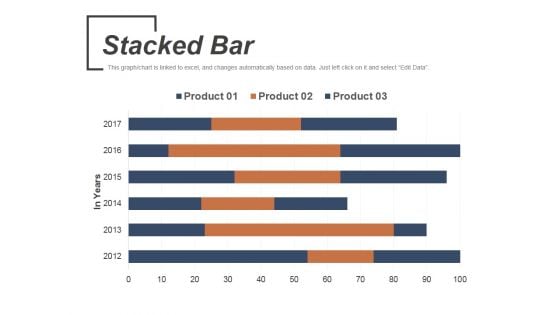
Stacked Bar Template 2 Ppt PowerPoint Presentation Slides Introduction
This is a stacked bar template 2 ppt powerpoint presentation slides introduction. This is a six stage process. The stages in this process are product, stacked bar, business, marketing, in years.
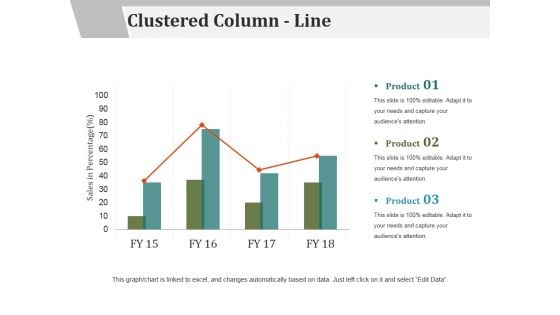
Clustered Column Line Ppt PowerPoint Presentation File Examples
This is a clustered column line ppt powerpoint presentation file examples. This is a three stage process. The stages in this process are sales in percentage, product, business, marketing, success.
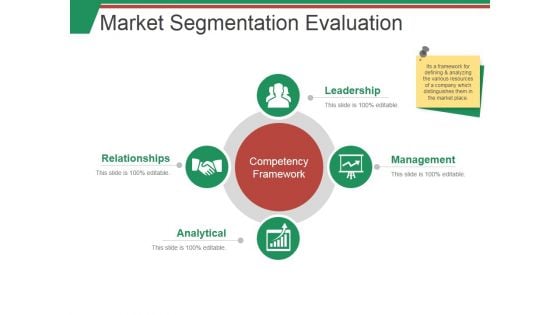
Market Segmentation Evaluation Template 1 Ppt PowerPoint Presentation Summary Smartart
This is a market segmentation evaluation template 1 ppt powerpoint presentation summary smartart. This is a two stage process. The stages in this process are market sales, net profit, beverages, milk product, nutrition.
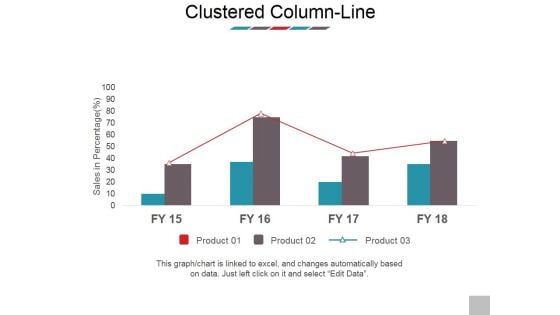
Clustered Column Line Ppt PowerPoint Presentation Model Images
This is a clustered column line ppt powerpoint presentation model images. This is a four stage process. The stages in this process are sales in percentage, product, business, marketing, bar graph.
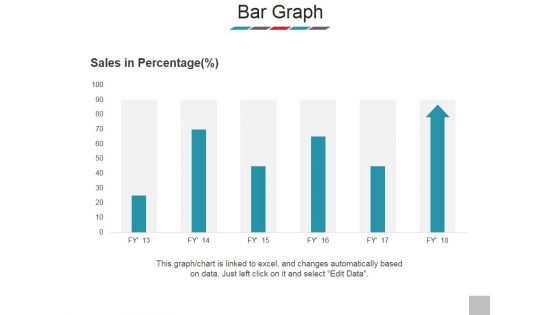
Bar Graph Ppt PowerPoint Presentation Model Clipart
This is a bar graph ppt powerpoint presentation model clipart. This is a six stage process. The stages in this process are sales in percentage, product, bar graph, business, marketing.
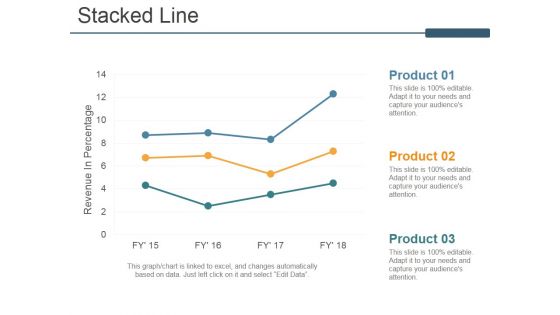
Stacked Line Ppt PowerPoint Presentation Ideas Model
This is a stacked line ppt powerpoint presentation ideas model. This is a three stage process. The stages in this process are revenue in percentage, stacked line, product, business, marketing.
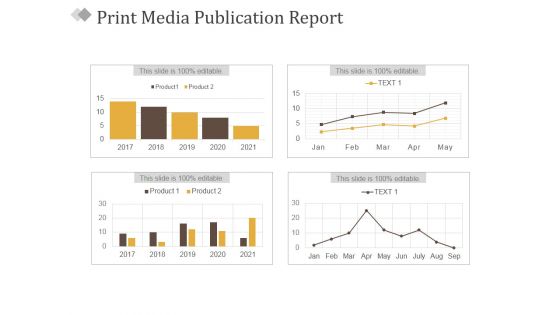
Print Media Publication Report Ppt PowerPoint Presentation Summary Information
This is a print media publication report ppt powerpoint presentation summary information. This is a four stage process. The stages in this process are business, product, marketing, management, success.
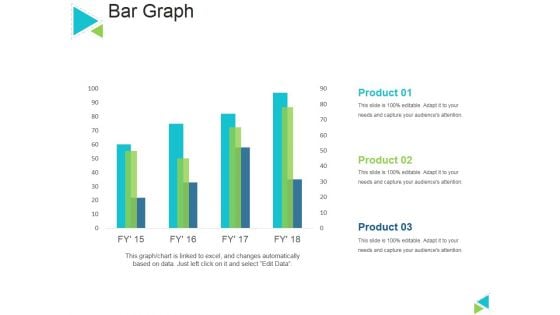
Bar Graph Ppt PowerPoint Presentation Outline Layout
This is a bar graph ppt powerpoint presentation outline layout. This is a four stage process. The stages in this process are sales in percentage, product, bar graph, business, marketing.
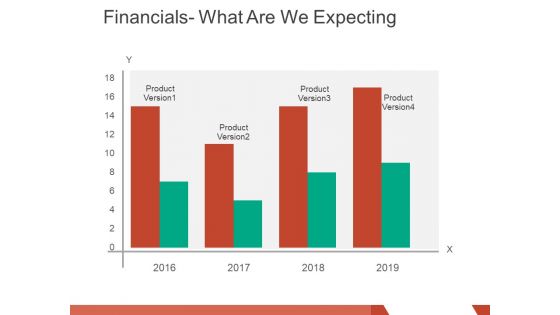
financials what are we expecting ppt powerpoint presentation layouts graphics pictures
This is a financials what are we expecting ppt powerpoint presentation layouts graphics pictures. This is a four stage process. The stages in this process are product version, business, marketing, finance, graph.
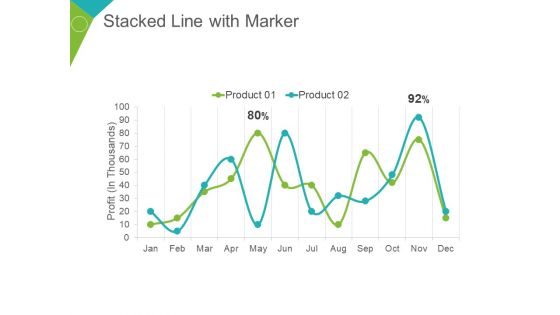
Stacked Line With Marker Ppt PowerPoint Presentation Summary Demonstration
This is a stacked line with marker ppt powerpoint presentation summary demonstration. This is a two stage process. The stages in this process are profit in thousands, product, percentage, finance, business.
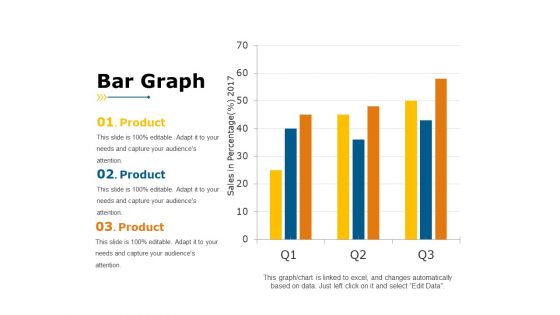
Bar Graph Ppt PowerPoint Presentation Portfolio Example
This is a bar graph ppt powerpoint presentation portfolio example. This is a three stage process. The stages in this process are sales in percentage, year, business, product, business, graph.
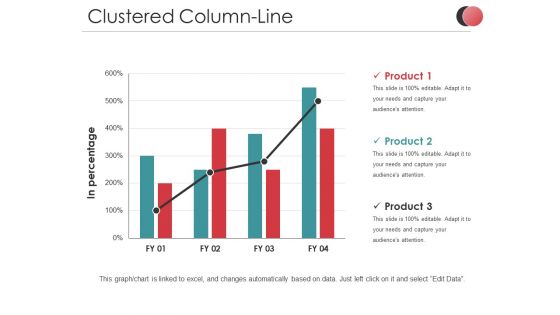
Clustered Column Line Ppt PowerPoint Presentation Infographics Templates
This is a clustered column line ppt powerpoint presentation infographics templates. This is a three stage process. The stages in this process are in percentage, business, marketing, product, finance, graph.
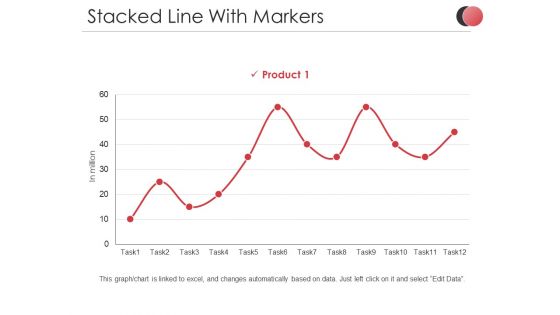
Stacked Line With Markers Ppt PowerPoint Presentation Slides Demonstration
This is a stacked line with markers ppt powerpoint presentation slides demonstration. This is a one stage process. The stages in this process are in million, product, percentage, business, marketing, finance.
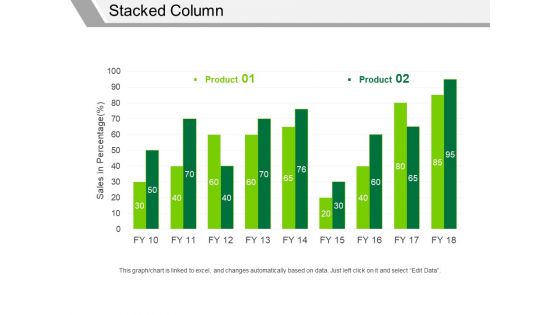
Stacked Column Ppt PowerPoint Presentation Infographics Samples
This is a stacked column ppt powerpoint presentation infographics samples. This is a two stage process. The stages in this process are product, sales in percentage, business, marketing, graph.
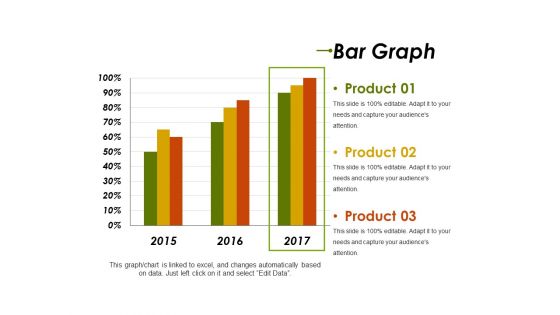
Bar Graph Template 1 Ppt PowerPoint Presentation Slides Format Ideas
This is a bar graph template 1 ppt powerpoint presentation slides format ideas. This is a three stage process. The stages in this process are product, years, bar graph, business, marketing.
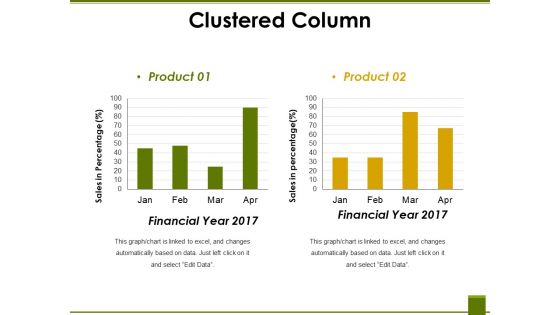
Clustered Column Ppt PowerPoint Presentation Ideas Graphic Tips
This is a clustered column ppt powerpoint presentation ideas graphic tips. This is a two stage process. The stages in this process are financial year, sales in percentage, product, graph, business.
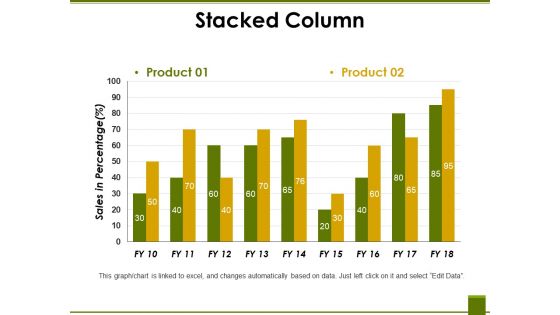
Stacked Column Ppt PowerPoint Presentation Professional Vector
This is a stacked column ppt powerpoint presentation professional vector. This is a two stage process. The stages in this process are product, sales in percentage, business, marketing, graph.
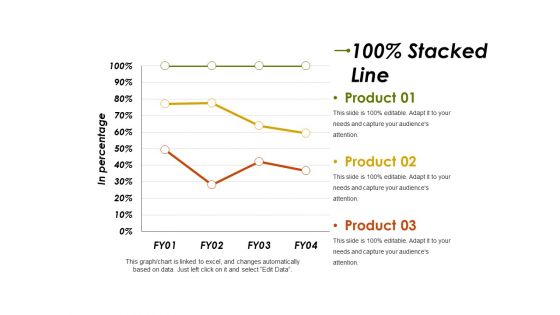
Stacked Line Ppt PowerPoint Presentation Infographic Template Graphics Template
This is a stacked line ppt powerpoint presentation infographic template graphics template. This is a three stage process. The stages in this process are product, in percentage, business, marketing, finance.
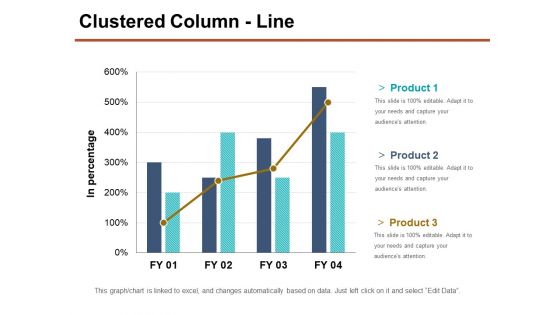
Clustered Column Line Ppt PowerPoint Presentation Inspiration Layouts
This is a clustered column line ppt powerpoint presentation inspiration layouts. This is a four stage process. The stages in this process are in percentage, product, business, strategy, graph.
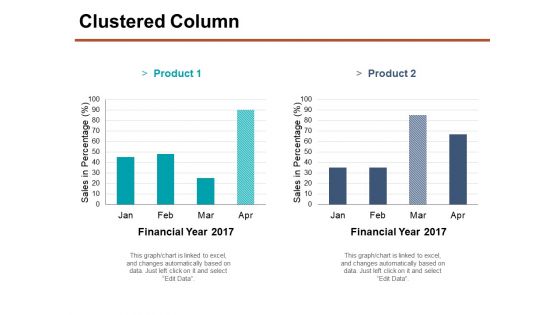
Clustered Column Ppt PowerPoint Presentation Portfolio Smartart
This is a clustered column ppt powerpoint presentation portfolio smartart. This is a two stage process. The stages in this process are financial year, product, sales in percentage, finance, business, graph.
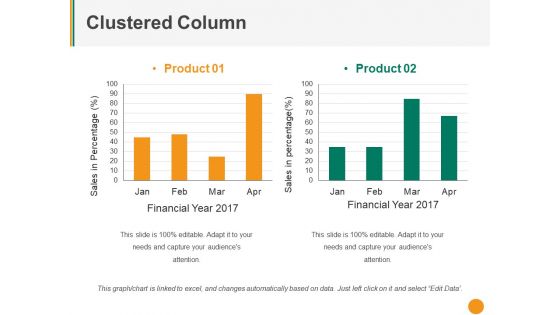
Clustered Column Ppt PowerPoint Presentation Pictures Mockup
This is a clustered column ppt powerpoint presentation pictures mockup. This is a two stage process. The stages in this process are product, sales in percentage, financial year, graph, business.
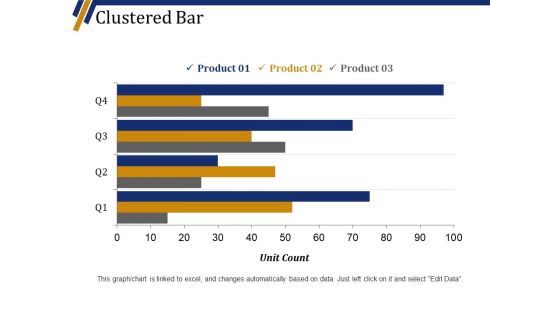
Clustered Bar Ppt PowerPoint Presentation Show Slide Portrait
This is a clustered bar ppt powerpoint presentation show slide portrait. This is a four stage process. The stages in this process are product, unit count, graph, business, marketing.
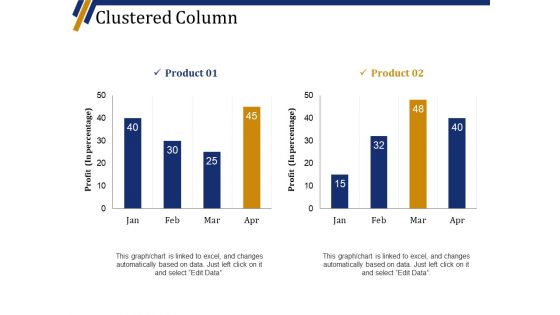
Clustered Column Ppt PowerPoint Presentation Professional Graphic Tips
This is a clustered column ppt powerpoint presentation professional graphic tips. This is a two stage process. The stages in this process are product, profit in percentage, graph, business, marketing.
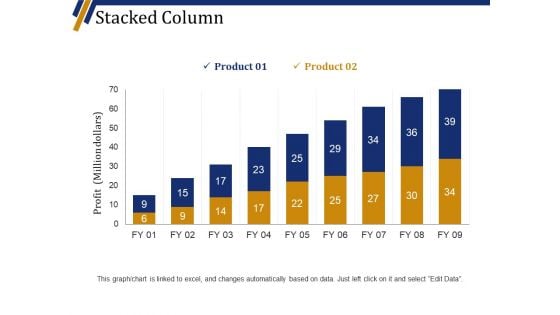
Stacked Column Ppt PowerPoint Presentation Professional Template
This is a stacked column ppt powerpoint presentation professional template. This is a nine stage process. The stages in this process are product, profit million dollars, business, marketing, graph.
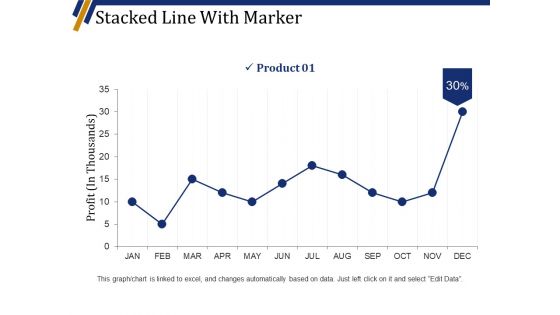
Stacked Line With Marker Ppt PowerPoint Presentation Professional Pictures
This is a stacked line with marker ppt powerpoint presentation professional pictures. This is a twelve stage process. The stages in this process are product, profit in thousands, business, graph, marketing.
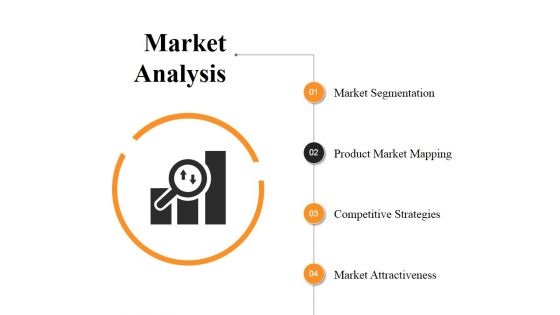
Market Analysis Ppt PowerPoint Presentation Show Design Inspiration
This is a market analysis ppt powerpoint presentation show design inspiration. This is a four stage process. The stages in this process are market segmentation, product market mapping, competitive strategies, market attractiveness.
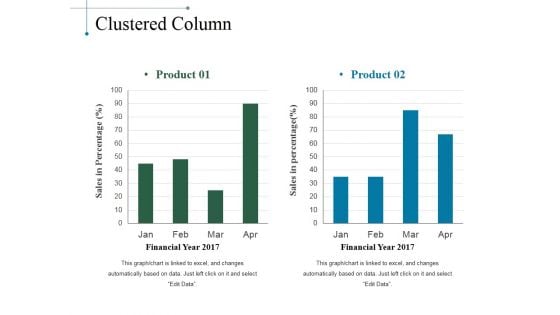
Clustered Column Ppt PowerPoint Presentation Slides Smartart
This is a clustered column ppt powerpoint presentation slides smartart. This is a two stage process. The stages in this process are product, sales in percentage, financial year, bar graph.
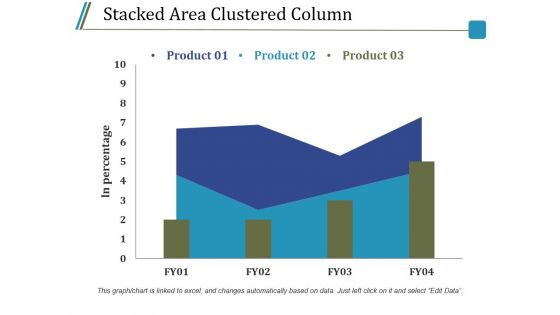
Stacked Area Clustered Column Ppt PowerPoint Presentation Model Guidelines
This is a stacked area clustered column ppt powerpoint presentation model guidelines. This is a three stage process. The stages in this process are product, in percentage, bar graph, growth, success.
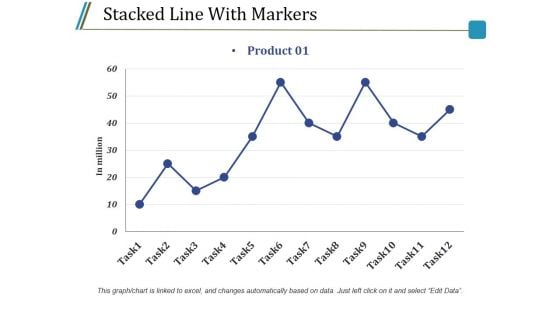
Stacked Line With Markers Ppt PowerPoint Presentation Infographic Template Graphics Example
This is a stacked line with markers ppt powerpoint presentation infographic template graphics example. This is a one stage process. The stages in this process are in million, task, product, finance, line graph.
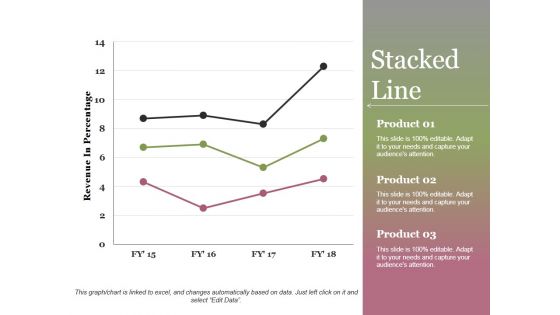
Stacked Line Ppt PowerPoint Presentation Show
This is a stacked line ppt powerpoint presentation show. This is a three stage process. The stages in this process are revenue in percentage, product, stacked line, growth, success.
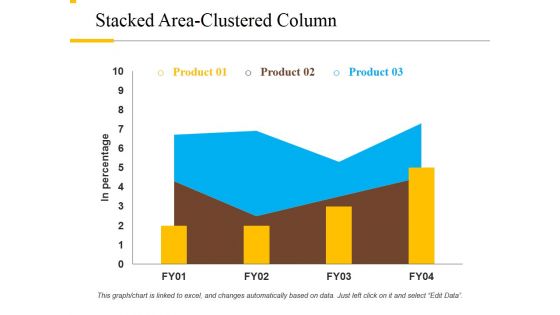
Stacked Area Clustered Column Ppt PowerPoint Presentation File Background Designs
This is a stacked area clustered column ppt powerpoint presentation file background designs. This is a three stage process. The stages in this process are product, in percentage, growth, success, bar graph.
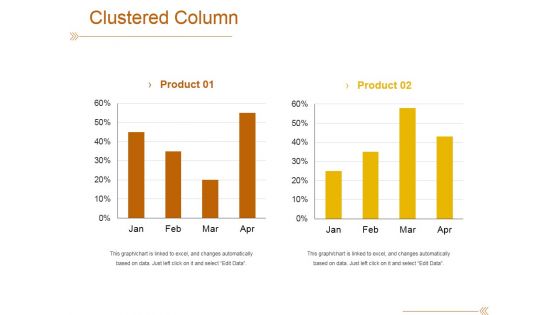
Clustered Column Template 1 Ppt PowerPoint Presentation Outline File Formats
This is a clustered column template 1 ppt powerpoint presentation outline file formats. This is a two stage process. The stages in this process are product, bar graph, success, growth, finance.
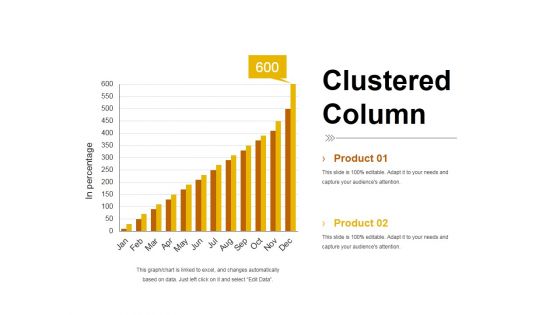
Clustered Column Template 2 Ppt PowerPoint Presentation Summary Smartart
This is a clustered column template 2 ppt powerpoint presentation summary smartart. This is a two stage process. The stages in this process are product, bar graph, in percentage, clustered column, growth.
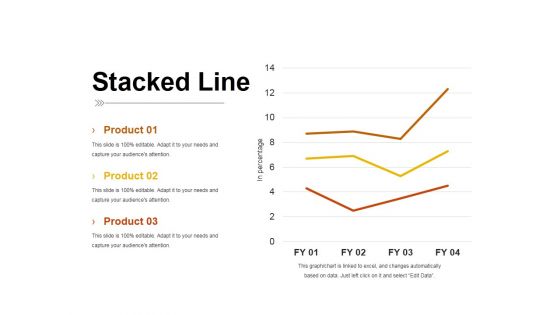
Stacked Line Ppt PowerPoint Presentation Inspiration Pictures
This is a stacked line ppt powerpoint presentation inspiration pictures. This is a three stage process. The stages in this process are product, stacked line, in percentage, business, growth.
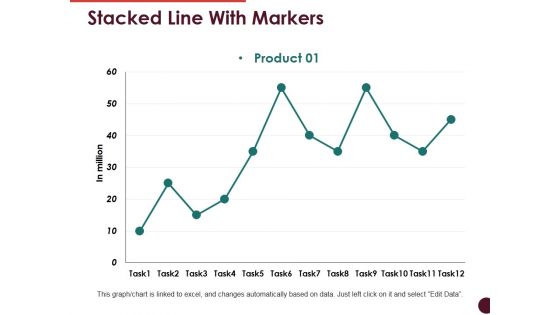
Stacked Line With Markers Ppt PowerPoint Presentation Show Templates
This is a stacked line with markers ppt powerpoint presentation show templates. This is a one stage process. The stages in this process are product, bar graph, growth, success, business.
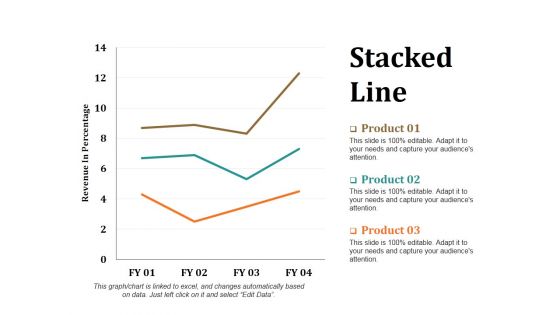
Stacked Line Ppt PowerPoint Presentation Layouts Portrait
This is a stacked line ppt powerpoint presentation layouts portrait. This is a three stage process. The stages in this process are revenue in percentage, stacked line, product, growth, success.
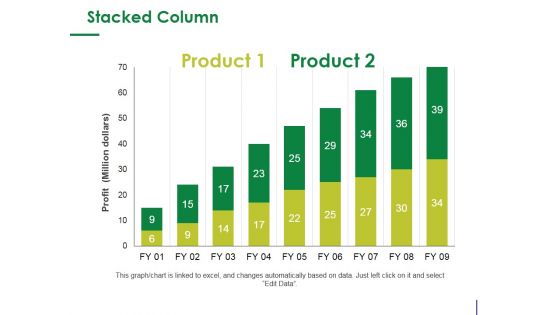
Stacked Column Ppt PowerPoint Presentation Infographic Template Design Ideas
This is a stacked column ppt powerpoint presentation infographic template design ideas. This is a two stage process. The stages in this process are product, profit, bar graph, growth, success.
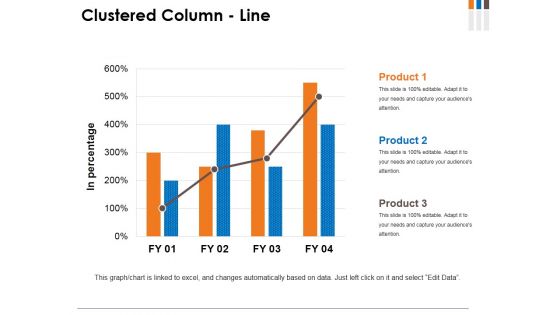
Clustered Column Line Ppt PowerPoint Presentation Summary Background Image
This is a clustered column line ppt powerpoint presentation summary background image. This is a four stage process. The stages in this process are in percentage, product, graph, growth, success.
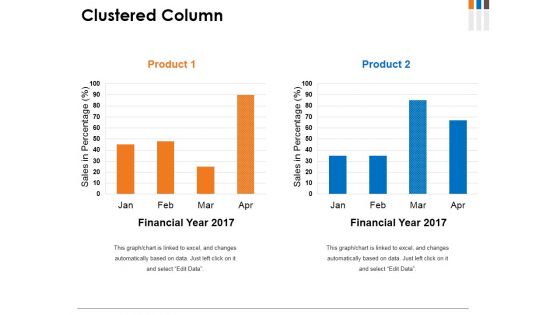
Clustered Column Ppt PowerPoint Presentation File Graphics
This is a clustered column ppt powerpoint presentation file graphics. This is a two stage process. The stages in this process are product, financial year, sales in percentage, graph, growth.

Sales Kpi Performance Summary Ppt PowerPoint Presentation Infographic Template Infographics
This is a sales kpi performance summary ppt powerpoint presentation infographic template infographics. This is a seven stage process. The stages in this process are revenue comparison, quantity comparison, product sales mix, regional sales mix.
Sales Kpi Tracker Ppt PowerPoint Presentation Visual Aids Files
This is a sales kpi tracker ppt powerpoint presentation visual aids files. This is a six stage process. The stages in this process are leads created, sales ratio, opportunities won, top products in revenue, open deals vs last yr.

Sales Kpi Performance Summary Ppt PowerPoint Presentation Ideas Graphics Template
This is a sales kpi performance summary ppt powerpoint presentation ideas graphics template. This is a seven stage process. The stages in this process are revenue comparison, quantity comparison, product sales mix, regional sales mix.
Sales Kpi Tracker Ppt PowerPoint Presentation Pictures Designs
This is a sales kpi tracker ppt powerpoint presentation pictures designs. This is a two stage process. The stages in this process are leads created, sales ratio, opportunities won, top products in revenue, win ratio vs last yr.
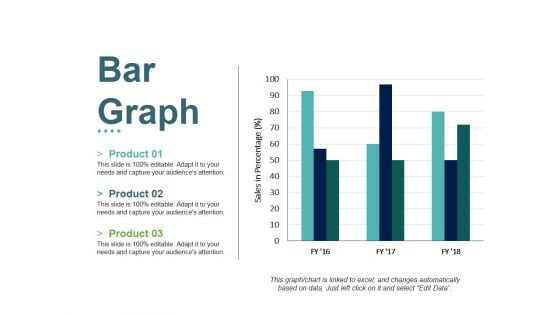
Bar Graph Ppt PowerPoint Presentation File Slides
This is a bar graph ppt powerpoint presentation file slides. This is a three stage process. The stages in this process are product, sales in percentage, bar graph, growth, success.
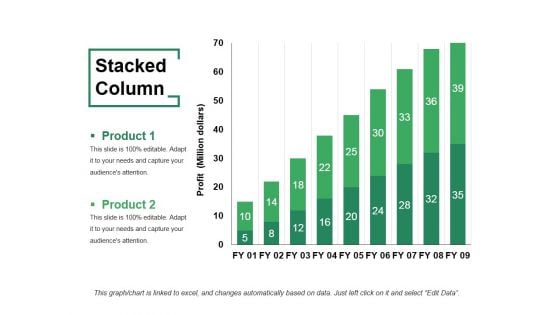
Stacked Column Ppt PowerPoint Presentation Layouts Example
This is a stacked column ppt powerpoint presentation layouts example. This is a two stage process. The stages in this process are product, stacked column, bar graph, growth, success.
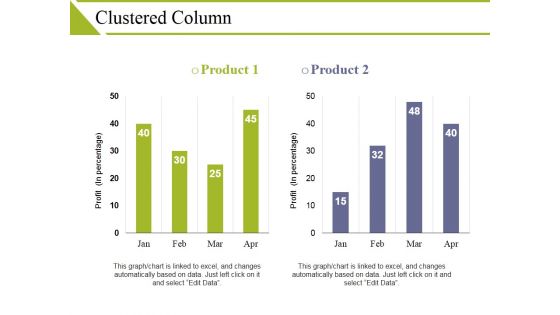
Clustered Column Ppt PowerPoint Presentation Visual Aids Show
This is a clustered column ppt powerpoint presentation visual aids show. This is a two stage process. The stages in this process are product, profit, business, bar graph, finance.
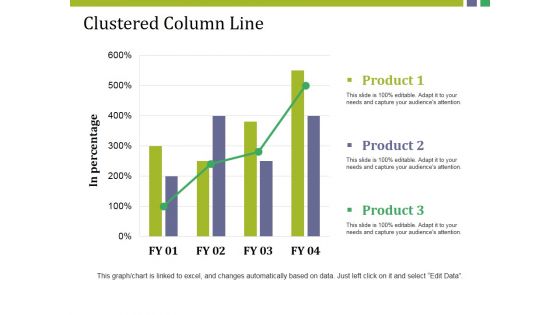
Clustered Column Line Ppt PowerPoint Presentation Pictures Example
This is a clustered column line ppt powerpoint presentation pictures example. This is a three stage process. The stages in this process are product, in percentage, bar graph, growth, success.
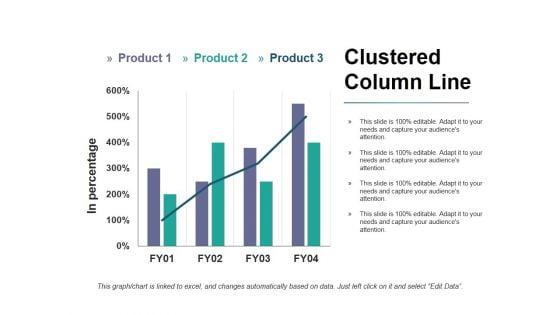
Clustered Column Line Ppt PowerPoint Presentation Infographic Template Pictures
This is a clustered column line ppt powerpoint presentation infographic template pictures. This is a three stage process. The stages in this process are product, in percentage, bar graph, growth, success.
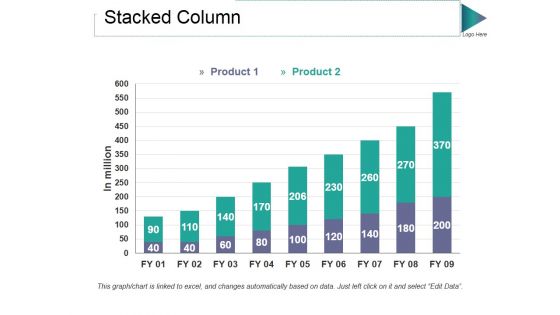
Stacked Column Ppt PowerPoint Presentation Styles Graphic Tips
This is a stacked column ppt powerpoint presentation styles graphic tips. This is a two stage process. The stages in this process are product, in million, bar graph, growth, success.
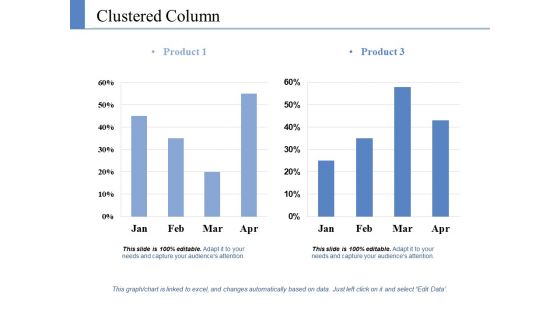
Clustered Column Ppt PowerPoint Presentation Pictures Graphics Template
This is a clustered column ppt powerpoint presentation pictures graphics template. This is a two stage process. The stages in this process are product, growth, success, business, bar graph.
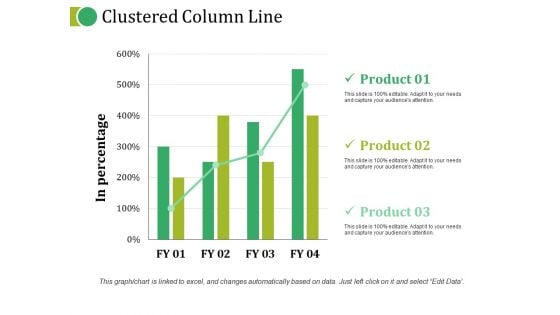
Clustered Column Line Ppt PowerPoint Presentation Topics
This is a clustered column line ppt powerpoint presentation topics. This is a three stage process. The stages in this process are product, in percentage, growth, bar graph, business.
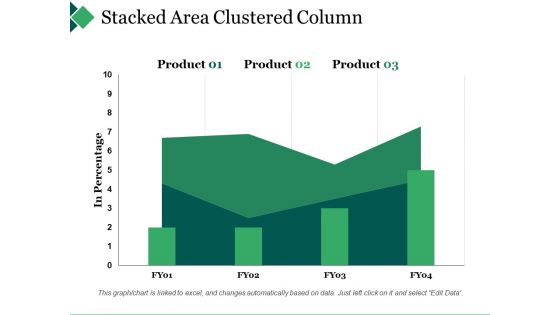
Stacked Area Clustered Column Ppt PowerPoint Presentation Gallery Gridlines
This is a stacked area clustered column ppt powerpoint presentation gallery gridlines. This is a three stage process. The stages in this process are bar graph, product, in percentage.
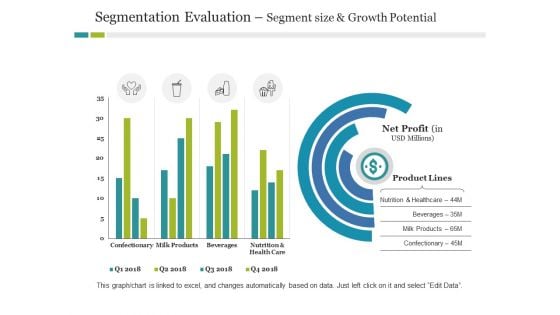
Segmentation Evaluation Segment Size And Growth Potential Ppt PowerPoint Presentation Infographic Template Outline
This is a segmentation evaluation segment size and growth potential ppt powerpoint presentation infographic template outline. This is a two stage process. The stages in this process are business, product lines, finance, marketing, strategy.
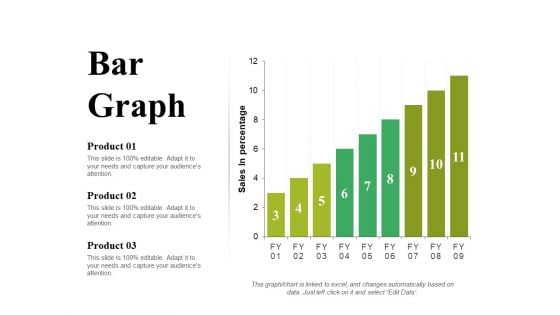
Bar Graph Ppt PowerPoint Presentation Portfolio Slide Portrait
This is a bar graph ppt powerpoint presentation portfolio slide portrait. This is a three stage process. The stages in this process are product, sales in percentage, bar graph, growth, success.
Sales Kpi Tracker Ppt PowerPoint Presentation Pictures Layout Ideas
This is a sales kpi tracker ppt powerpoint presentation pictures layout ideas. This is a four stage process. The stages in this process are opportunities won, top products in revenue, leads created, win ratio vs last yr, open deals vs.
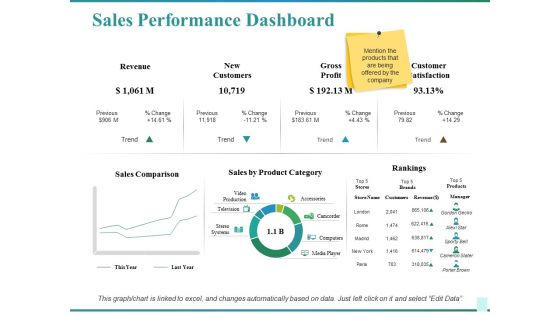
Sales Performance Dashboard Ppt PowerPoint Presentation Show Graphics Design
This is a sales performance dashboard ppt powerpoint presentation show graphics design. This is a two stage process. The stages in this process are sales comparison, sales by product category, rankings, customer satisfaction, revenue.
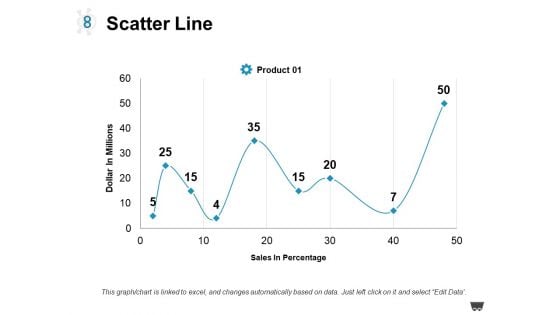
Scatter Line Ppt PowerPoint Presentation Styles Graphics Pictures
This is a scatter line ppt powerpoint presentation styles graphics pictures. This is a one stage process. The stages in this process are product, dollar in millions, sales in percentage.
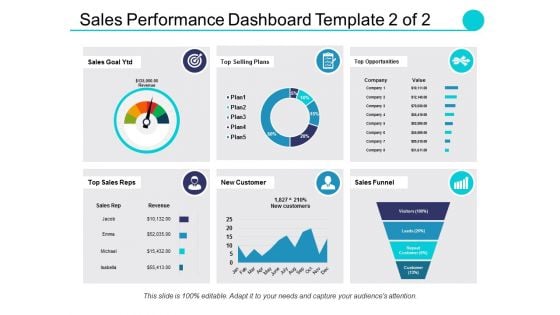
Sales Performance Dashboard Template Ppt PowerPoint Presentation Professional Elements
This is a sales performance dashboard template ppt powerpoint presentation professional elements. This is a eight stage process. The stages in this process are sales comparison, sales by product category, sales by month, brand profitability, revenue.
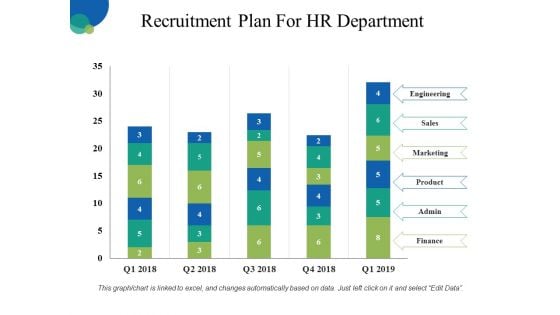
Recruitment Plan For HR Department Ppt PowerPoint Presentation Inspiration Layout Ideas
This is a recruitment plan for hr department ppt powerpoint presentation inspiration layout ideas. This is a five stage process. The stages in this process are engineering, sales, marketing, product, finance.
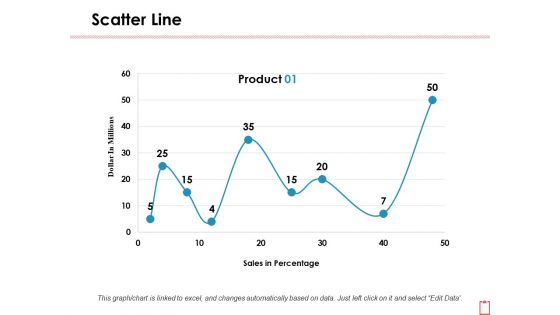
Scatter Line Ppt PowerPoint Presentation Infographics Background Images
This is a scatter line ppt powerpoint presentation infographics background images. This is a one stage process. The stages in this process are dollar in millions, product, sales in percentage.
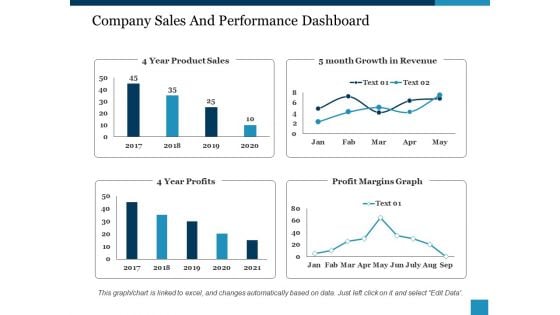
Company Sales And Performance Dashboard Ppt PowerPoint Presentation Show Structure
This is a company sales and performance dashboard ppt powerpoint presentation show structure. This is a four stage process. The stages in this process are year product sales, month growth in revenue, profit margins graph, year profits.
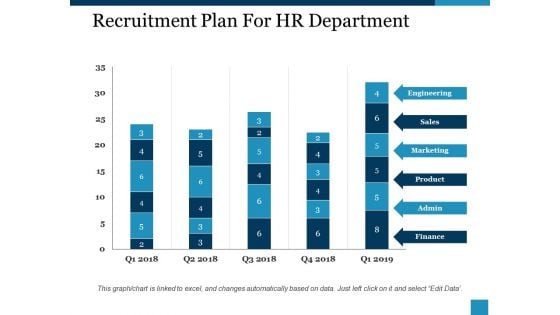
Recruitment Plan For Hr Department Ppt PowerPoint Presentation Show
This is a recruitment plan for hr department ppt powerpoint presentation show. This is a five stage process. The stages in this process are engineering, sales, marketing, product, finance.
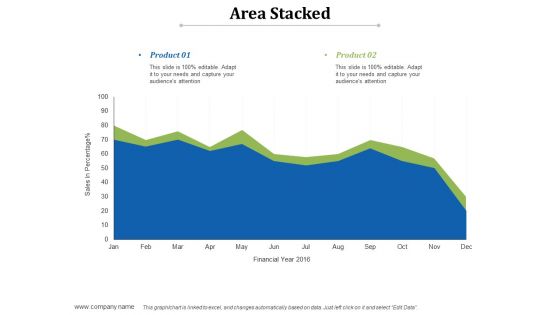
Area Stacked Ppt PowerPoint Presentation Infographics Shapes
This is a area stacked ppt powerpoint presentation infographics shapes. This is a two stage process. The stages in this process are product, area stacked, sales in percentage, financial year.
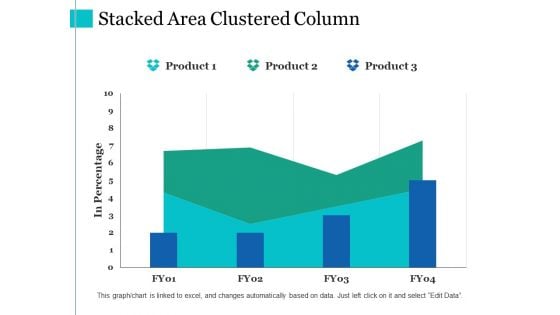
Stacked Area Clustered Column Ppt PowerPoint Presentation Summary Slides
This is a stacked area clustered column ppt powerpoint presentation summary slides. This is a three stage process. The stages in this process are product, in percentage, financial year, bar graph.
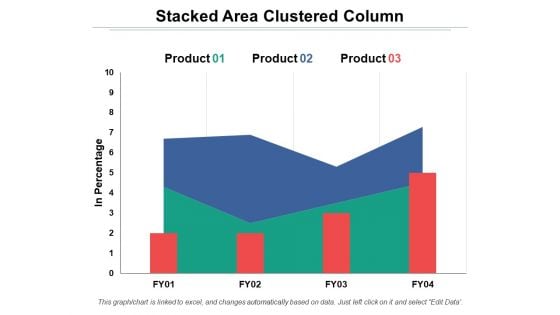
Stacked Area Clustered Column Ppt PowerPoint Presentation Professional Influencers
This is a stacked area clustered column ppt powerpoint presentation professional influencers. This is a three stage process. The stages in this process are stacked area clustered column, percentage, product, year.
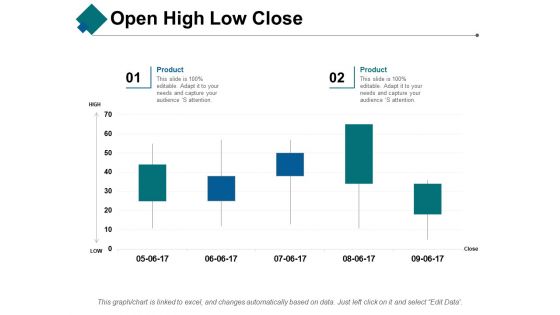
Open High Low Close Ppt PowerPoint Presentation Show Aids
This is a open high low close ppt powerpoint presentation show aids. This is a two stage process. The stages in this process are open, high, low, close, product.
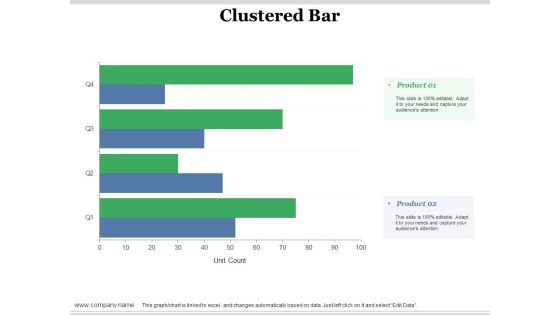
Clustered Bar Ppt PowerPoint Presentation Slides Example Topics
This is a clustered bar ppt powerpoint presentation slides example topics. This is a two stage process. The stages in this process are clustered bar, product, unit count, business, marketing.
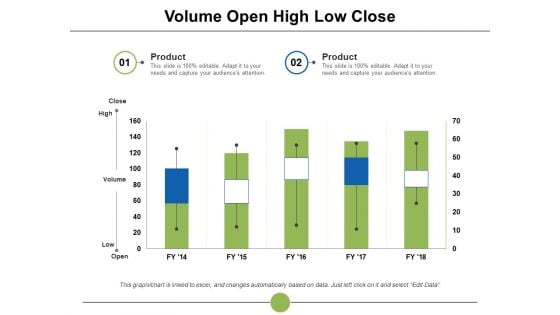
Volume Open High Low Close Ppt PowerPoint Presentation Slides Maker
This is a volume open high low close ppt powerpoint presentation slides maker. This is a two stage process. The stages in this process are volume, open, high, low, close, product.
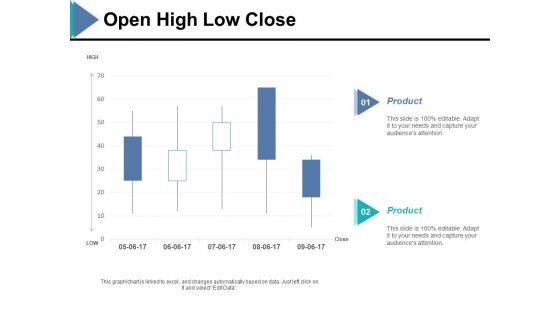
Open High Low Close Ppt PowerPoint Presentation Model Good
This is a open high low close ppt powerpoint presentation model good. This is a two stage process. The stages in this process are open, high, low, close, product.
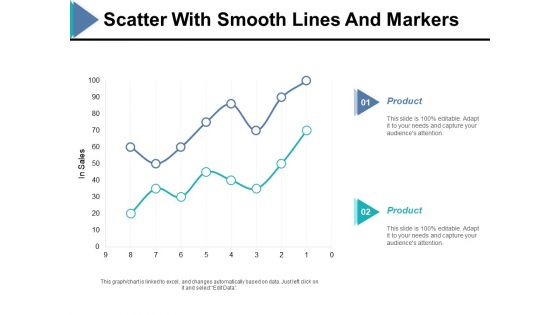
Scatter With Smooth Lines And Markers Ppt PowerPoint Presentation Ideas Example
This is a scatter with smooth lines and markers ppt powerpoint presentation ideas example. This is a two stage process. The stages in this process are in sales, finance, bar graph, product, business.
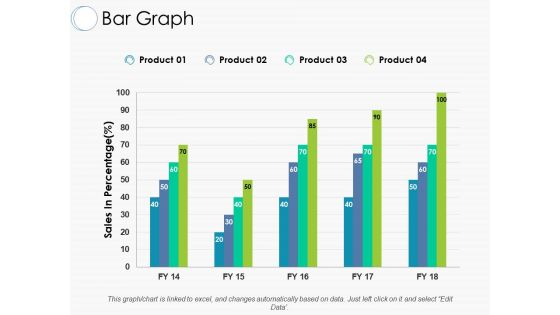
Bar Graph Ppt PowerPoint Presentation Summary Brochure
This is a bar graph ppt powerpoint presentation summary brochure. This is a four stage process. The stages in this process are business, market strategy, management, bar graph, product
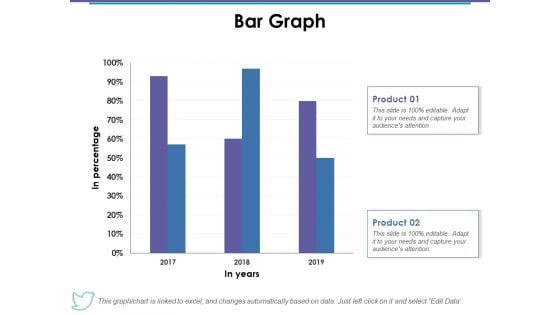
Bar Graph Ppt PowerPoint Presentation Styles Skills
This is a bar graph ppt powerpoint presentation styles skills. This is a two stage process. The stages in this process are bar graph, product, in year, in percentage, business.
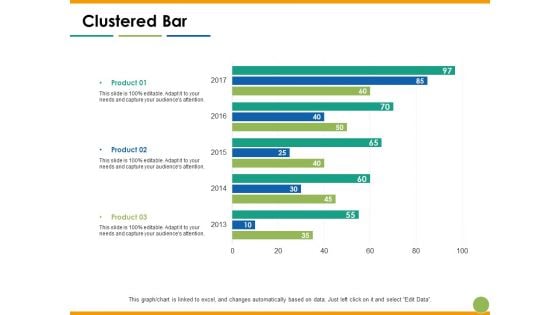
Clustered Bar Capability Maturity Matrix Ppt PowerPoint Presentation Summary Show
This is a clustered bar capability maturity matrix ppt powerpoint presentation summary show. This is a three stage process. The stages in this process are clustered bar, product, year, business, marketing.
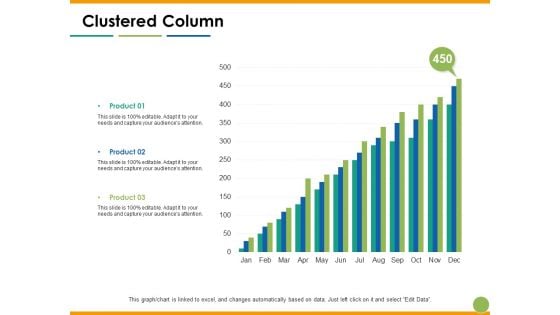
Clustered Column Capability Maturity Matrix Ppt PowerPoint Presentation Pictures Slideshow
This is a clustered column capability maturity matrix ppt powerpoint presentation pictures slideshow. This is a three stage process. The stages in this process are clustered column, product, year, business, marketing.
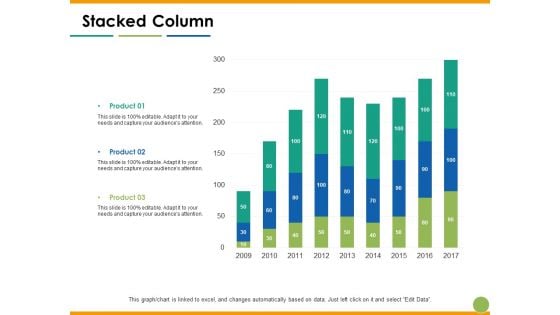
Stacked Column Capability Maturity Matrix Ppt PowerPoint Presentation Model Shapes
This is a stacked column capability maturity matrix ppt powerpoint presentation model shapes. This is a three stage process. The stages in this process are stacked column, product, year, finance, business.
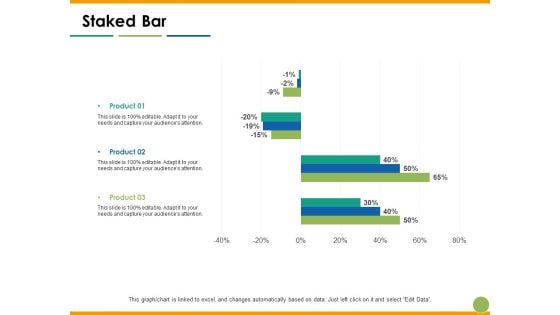
Staked Bar Capability Maturity Matrix Ppt PowerPoint Presentation Slides Outfit
This is a staked bar capability maturity matrix ppt powerpoint presentation slides outfit. This is a three stage process. The stages in this process are staked bar, product, year, finance, percentage.
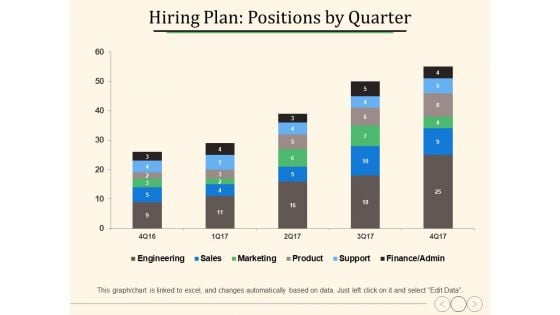
Hiring Plan Positions By Quarter Ppt PowerPoint Presentation Slides Deck
This is a hiring plan positions by quarter ppt powerpoint presentation slides deck. This is a five stage process. The stages in this process are percentage, product, business, management.
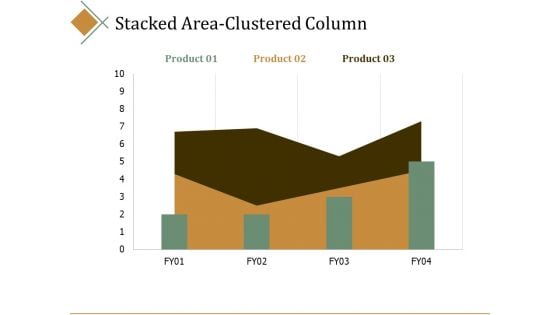
Stacked Area Clustered Column Ppt PowerPoint Presentation Infographics Portrait
This is a stacked area clustered column ppt powerpoint presentation infographics portrait. This is a three stage process. The stages in this process are percentage, product, business, management, marketing.
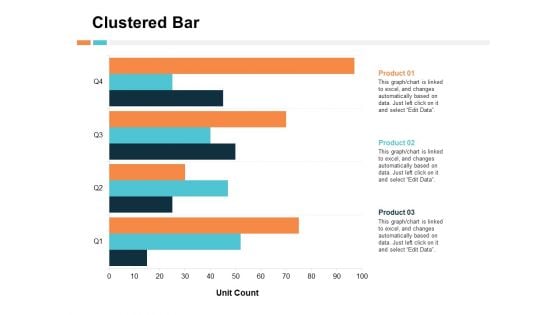
Clustered Bar Financial Ppt PowerPoint Presentation Gallery Designs Download
This is a clustered bar financial ppt powerpoint presentation gallery designs download. This is a three stage process. The stages in this process are percentage, product, business, management, marketing.
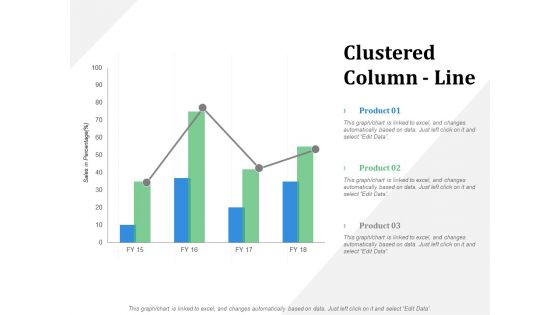
Clustered Column Line Financial Ppt PowerPoint Presentation Summary Slide
This is a clustered column line financial ppt powerpoint presentation summary slide. This is a three stage process. The stages in this process are business, management, marketing, product, percentage.

Stacked Area Clustered Column Marketing Ppt PowerPoint Presentation Infographic Template Vector
This is a stacked area clustered column marketing ppt powerpoint presentation infographic template vector. This is a three stage process. The stages in this process are business, management, marketing, product, percentage.
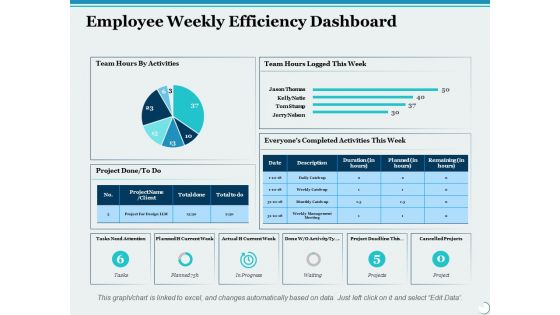
Employee Weekly Efficiency Dashboard Ppt PowerPoint Presentation Infographic Template Graphic Images
This is a employee weekly efficiency dashboard ppt powerpoint presentation infographic template graphic images. This is a six stage process. The stages in this process are percentage, product, business, management, marketing.
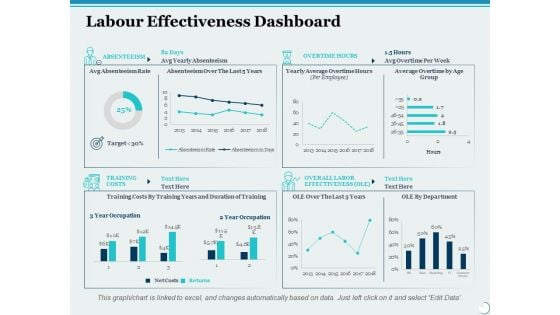
Labour Effectiveness Dashboard Ppt PowerPoint Presentation Slides File Formats
This is a labour effectiveness dashboard ppt powerpoint presentation slides file formats. This is a four stage process. The stages in this process are percentage, product, management, marketing, business.

Negative Impacts Of Workplace Stress Ppt PowerPoint Presentation Outline Slide Download
This is a negative impacts of workplace stress ppt powerpoint presentation outline slide download. This is a five stage process. The stages in this process are percentage, product, management, marketing, business.
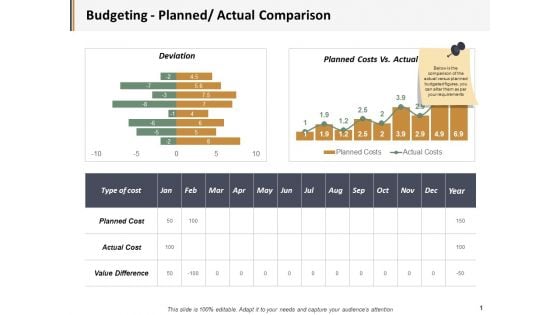
Budgeting Planned Actual Comparison Ppt PowerPoint Presentation Visual Aids Gallery
This is a budgeting planned actual comparison ppt powerpoint presentation visual aids gallery. This is a three stage process. The stages in this process are business, management, marketing, percentage, product.
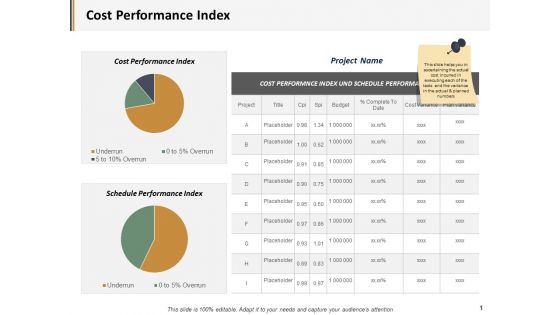
Cost Performance Index Ppt PowerPoint Presentation Inspiration Graphics Example
This is a cost performance index ppt powerpoint presentation inspiration graphics example. This is a three stage process. The stages in this process are business, management, marketing, percentage, product.
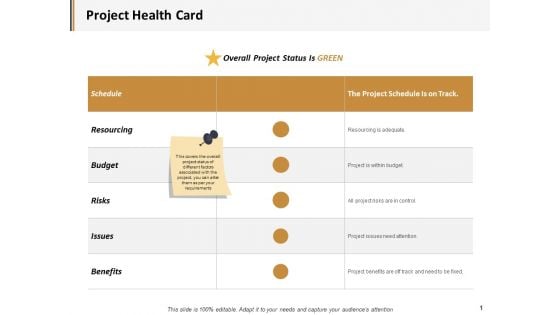
Project Health Card Resourcing Ppt PowerPoint Presentation Summary Graphics Download
This is a project health card resourcing ppt powerpoint presentation summary graphics download. This is a six stage process. The stages in this process are business, management, marketing, percentage, product.
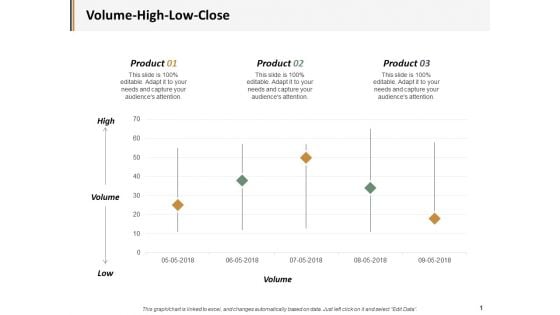
Volume High Low Close Ppt PowerPoint Presentation Ideas Example Introduction
This is a volume high low close ppt powerpoint presentation ideas example introduction. This is a three stage process. The stages in this process are business, management, marketing, percentage, product.
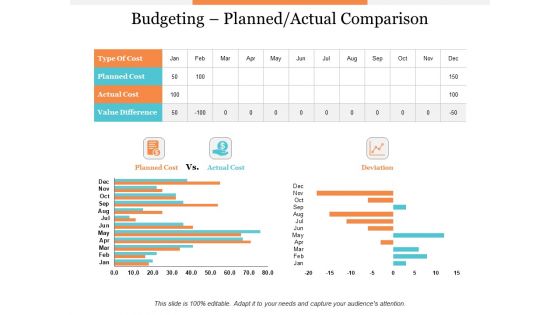
Budgeting Planned Actual Comparison Ppt PowerPoint Presentation Styles File Formats
This is a budgeting planned actual comparison ppt powerpoint presentation styles file formats. This is a three stage process. The stages in this process are product, percentage, business, management, marketing.
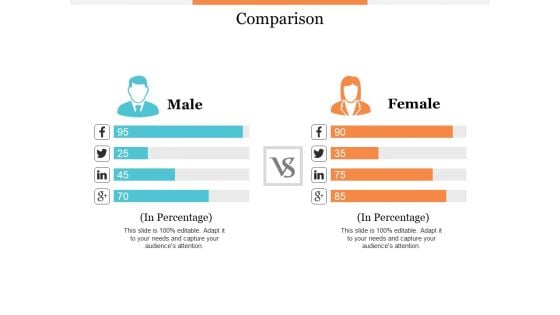
Comparison Male And Female Ppt PowerPoint Presentation Professional Skills
This is a comparison male and female ppt powerpoint presentation professional skills. This is a two stage process. The stages in this process are product, percentage, business, management, marketing.
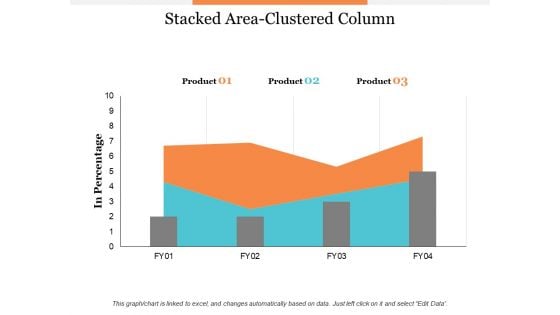
Stacked Area Clustered Column Ppt PowerPoint Presentation Infographic Template Summary
This is a stacked area clustered column ppt powerpoint presentation infographic template summary. This is a three stage process. The stages in this process are business, management, marketing, percentage, product.
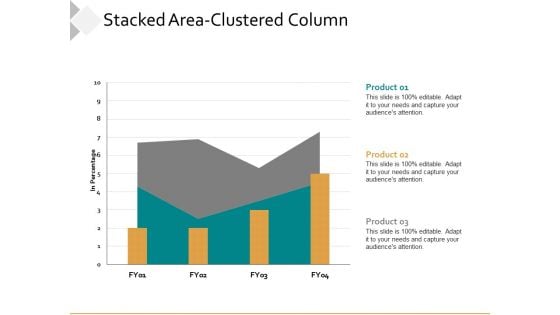
Stacked Area Clustered Column Ppt PowerPoint Presentation Model Slides
This is a stacked area clustered column ppt powerpoint presentation model slides. This is a three stage process. The stages in this process are business, management, percentage, product, marketing.
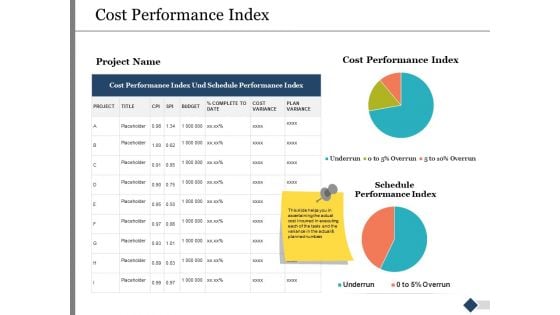
Cost Performance Index Ppt PowerPoint Presentation Infographics Mockup
This is a cost performance index ppt powerpoint presentation infographics mockup. This is a three stage process. The stages in this process are finance, marketing, management, investment, product, percentage.
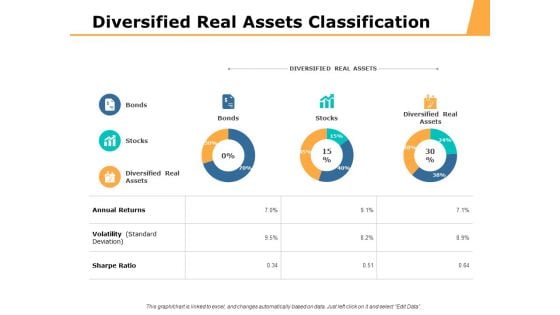
Diversified Real Assets Classification Ppt PowerPoint Presentation Ideas Tips
This is a diversified real assets classification ppt powerpoint presentation ideas tips. This is a three stage process. The stages in this process are percentage, product, business, management, marketing.
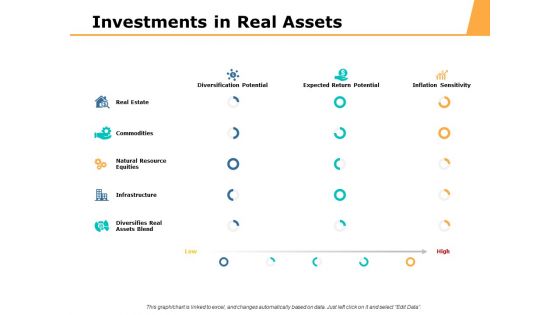
Investments In Real Assets Ppt PowerPoint Presentation Styles Pictures
This is a investments in real assets ppt powerpoint presentation styles pictures. This is a three stage process. The stages in this process are percentage, product, business, management, marketing.
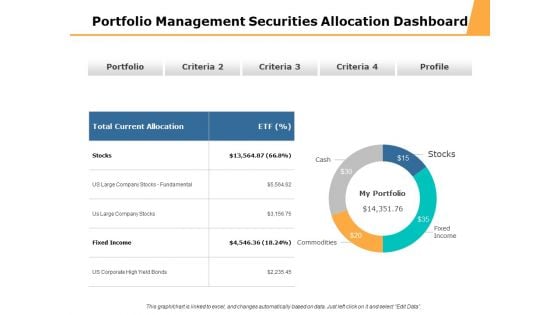
Portfolio Management Securities Allocation Dashboard Ppt PowerPoint Presentation Professional Design Ideas
This is a portfolio management securities allocation dashboard ppt powerpoint presentation professional design ideas. This is a four stage process. The stages in this process are percentage product, business, management, marketing.

Portfolio Summary Management Dashboard Ppt PowerPoint Presentation File Design Templates
This is a portfolio summary management dashboard ppt powerpoint presentation file design templates. This is a five stage process. The stages in this process are percentage product, business, management, marketing.
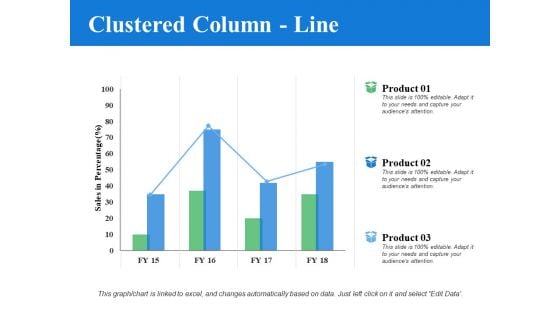
Clustered Column Line Analysis Ppt PowerPoint Presentation Layouts Visual Aids
This is a clustered column line analysis ppt powerpoint presentation layouts visual aids. This is a three stage process. The stages in this process are percentage, product, business, management.
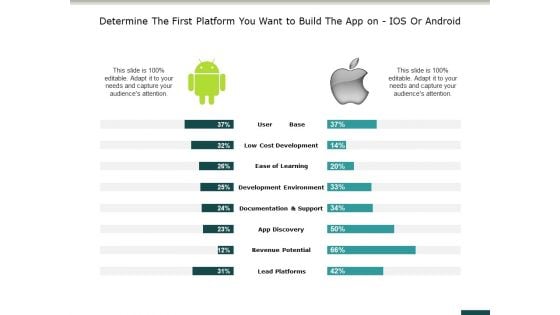
Determine The First Platform You Want To Build The App On Ios Or Android Ppt PowerPoint Presentation Pictures Master Slide
This is a determine the first platform you want to build the app on ios or android ppt powerpoint presentation pictures master slide. This is a two stage process. The stages in this process are business, management, marketing, percentage, product.
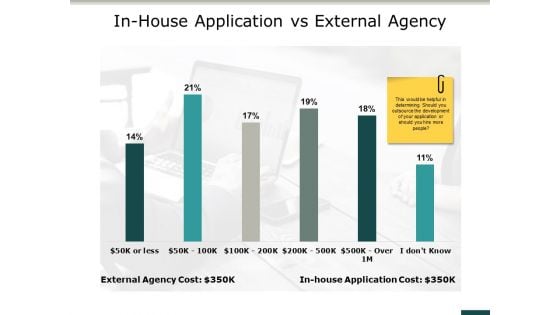
In House Application Vs External Agency Ppt PowerPoint Presentation Portfolio Images
This is a in house application vs external agency ppt powerpoint presentation portfolio images. This is a two stage process. The stages in this process are business, management, marketing, parentage, product.
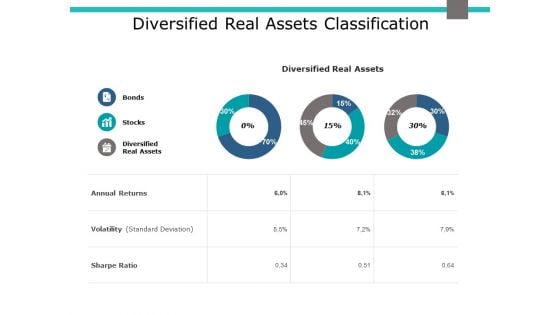
Diversified Real Assets Classification Ppt PowerPoint Presentation Slides Grid
This is a diversified real assets classification ppt powerpoint presentation slides grid. This is a three stage process. The stages in this process are business, management, marketing, percentage, product.
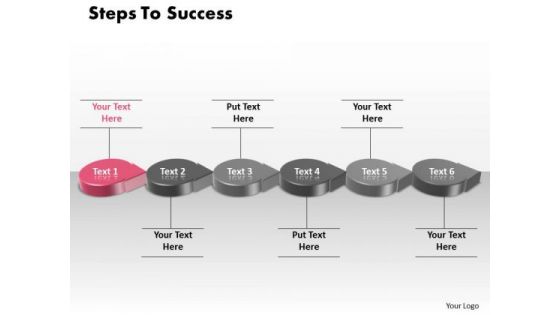
Ppt 3d PowerPoint Slide Numbers To Success Using Circular Arrows Templates
PPT 3d powerpoint slide numbers to success using circular arrows Templates-This is a professional-look process steps diagram. This Process steps diagram is widely used to show sequence of actions. Use this linear process diagram to emphasize direction of movement and interconnections of stages in a flow.-PPT 3d powerpoint slide numbers to success using circular arrows Templates-achievement, active, advice, attempt, background, business, businessman, climb, competition, concept, develop, development, education, goal, graph, growth, improve, increase, industry, investment, ladder, level, man, management, manager, people, perform, progress, start, step, success, target, upward Exult in the comfort of our Ppt 3d PowerPoint Slide Numbers To Success Using Circular Arrows Templates. Experience the convenience they deliver.
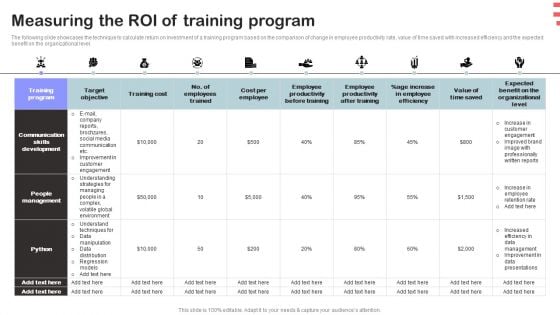
Corporate Training Program Measuring The ROI Of Training Program Diagrams PDF
The following slide showcases the technique to calculate return on investment of a training program based on the comparison of change in employee productivity rate, value of time saved with increased efficiency and the expected benefit on the organizational level. Boost your pitch with our creative Corporate Training Program Leadership Skill Matrix Of Managers Infographics PDF. Deliver an awe-inspiring pitch that will mesmerize everyone. Using these presentation templates you will surely catch everyones attention. You can browse the ppts collection on our website. We have researchers who are experts at creating the right content for the templates. So you do not have to invest time in any additional work. Just grab the template now and use them.
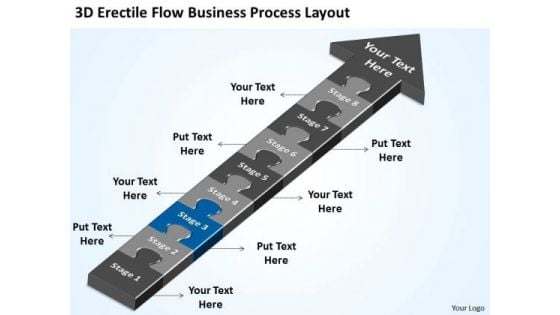
3d Flow Business Process Layout Ppt How To Create Plan PowerPoint Templates
We present our 3d flow business process layout ppt how to create plan PowerPoint templates.Download and present our Arrows PowerPoint Templates because it Saves your time as a prized possession, an ideal aid to give an ideal presentation. Download and present our Puzzles or Jigsaws PowerPoint Templates because with the help of our Slides you can Illustrate your plans on using the many social media modes available to inform soceity at large of the benefits of your product. Download our Shapes PowerPoint Templates because your marketing strategies can funnel down to the cone, stage by stage, refining as you go along. Download our Business PowerPoint Templates because this template helps to pierce through the doubts of your audience. Present our Flow Charts PowerPoint Templates because our PowerPoint templates designed for your ideas to sell.Use these PowerPoint slides for presentations relating to arrow, assemble, attached, business, challenge, connect, connection, cycle, diagram, direction, element, fit, flow, flowchart, idea, jigsaw, join, loop, management, planning, process, puzzle, sign, solution, solving, spinning, step, strategy, success, symbol, team, teamwork. The prominent colors used in the PowerPoint template are Blue, Gray, Black. PowerPoint presentation experts tell us our 3d flow business process layout ppt how to create plan PowerPoint templates will make the presenter successul in his career/life. The feedback we get is that our cycle PowerPoint templates and PPT Slides are designed by professionals We assure you our 3d flow business process layout ppt how to create plan PowerPoint templates are Fancy. We assure you our connection PowerPoint templates and PPT Slides are Vintage. You can be sure our 3d flow business process layout ppt how to create plan PowerPoint templates are Nice. The feedback we get is that our connection PowerPoint templates and PPT Slides will generate and maintain the level of interest you desire. They will create the impression you want to imprint on your audience. There is never a dull moment with our 3d Flow Business Process Layout Ppt How To Create Plan PowerPoint Templates. They keep it going at fever pitch.
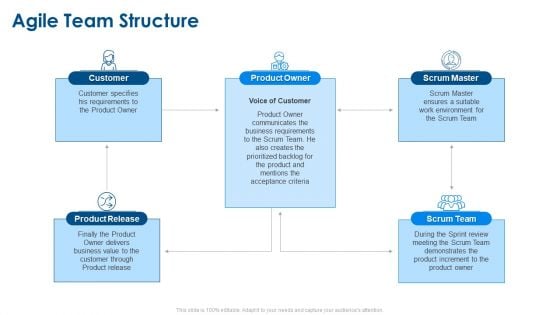
Agile Project Planning Agile Team Structure Ppt Summary Gridlines PDF
This is a agile project planning agile team structure ppt summary gridlines pdf template with various stages. Focus and dispense information on five stages using this creative set, that comes with editable features. It contains large content boxes to add your information on topics like customer, product release, product owner, scrum master, scrum team. You can also showcase facts, figures, and other relevant content using this PPT layout. Grab it now.
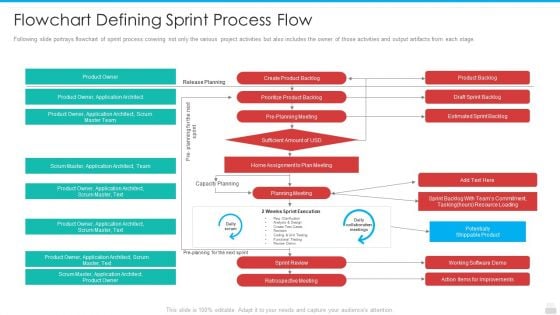
Flowchart Defining Sprint Process Flow Rules PDF
This is a flowchart defining sprint process flow rules pdf template with various stages. Focus and dispense information on two stages using this creative set, that comes with editable features. It contains large content boxes to add your information on topics like prioritize product backlog, product backlog, draft sprint backlog. You can also showcase facts, figures, and other relevant content using this PPT layout. Grab it now.
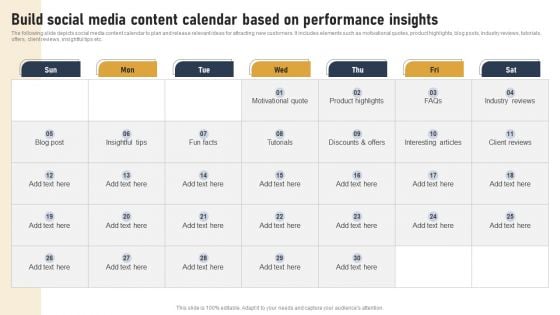
Incorporating Real Time Marketing For Improved Consumer Build Social Media Content Calendar Background PDF
The following slide depicts social media content calendar to plan and release relevant ideas for attracting new customers. It includes elements such as motivational quotes, product highlights, blog posts, industry reviews, tutorials, offers, client reviews, insightful tips etc. If you are looking for a format to display your unique thoughts, then the professionally designed Incorporating Real Time Marketing For Improved Consumer Build Social Media Content Calendar Background PDF is the one for you. You can use it as a Google Slides template or a PowerPoint template. Incorporate impressive visuals, symbols, images, and other charts. Modify or reorganize the text boxes as you desire. Experiment with shade schemes and font pairings. Alter, share or cooperate with other people on your work. Download Incorporating Real Time Marketing For Improved Consumer Build Social Media Content Calendar Background PDF and find out how to give a successful presentation. Present a perfect display to your team and make your presentation unforgettable.

Major Achievements Powerpoint Ppt Template Bundles
This Major Achievements Powerpoint Ppt Template Bundles is meant to inspire a sense of awe about the organization, planning, skill and innovation you bring to business, and the ways it pays you back. The presentation template in Technological Achievements, Achievements In Healthcare Industry, Accomplishments Of AI slides also lists the roles and duties of a business organization and its members in building a wholesome, prosperous society. You can create a comprehensive chart on business functions and showcase specifics that make you special due to the 100 percent editable and customizable nature of the presentation. Encourage stakeholders to dig deep into business knowledge and use it in practice to deliver quality products and service with the uses of this PPT Template for the ages. Download now. Our Major Achievements PowerPoint Template Bundles are expertly designed to enhance any presentation. Use them to present your accomplishments with a professional and visually appealing backdrop.
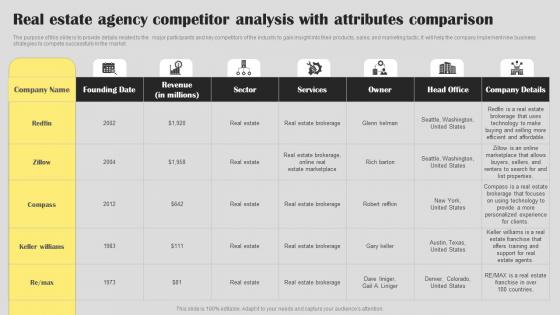
Real Estate Agency Competitor Real Estate Agent Business Plan Go To Market Strategy Topics Pdf
The purpose of this slide is to provide details related to the major participants and key competitors of the industry to gain insight into their products, sales, and marketing tactic. It will help the company implement new business strategies to compete successfully in the market. Are you searching for a Real Estate Agency Competitor Real Estate Agent Business Plan Go To Market Strategy Topics Pdf that is uncluttered, straightforward, and original Its easy to edit, and you can change the colors to suit your personal or business branding. For a presentation that expresses how much effort you have put in, this template is ideal With all of its features, including tables, diagrams, statistics, and lists, its perfect for a business plan presentation. Make your ideas more appealing with these professional slides. Download Real Estate Agency Competitor Real Estate Agent Business Plan Go To Market Strategy Topics Pdf from Slidegeeks today. The purpose of this slide is to provide details related to the major participants and key competitors of the industry to gain insight into their products, sales, and marketing tactic. It will help the company implement new business strategies to compete successfully in the market.
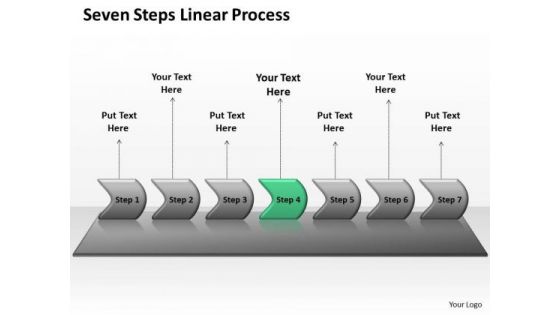
Sales Ppt Background Seven PowerPoint Slide Numbers Linear Process 5 Image
We present our sales PPT Background seven PowerPoint slide numbers linear Process 5 Image. Use our Arrows PowerPoint Templates because, but you have had fair success in helping victims fight the disease. Use our Business PowerPoint Templates because, Marketing Strategy Business Template:- Maximizing sales of your product is the intended destination. Use our Marketing PowerPoint Templates because, hence this diagram has the unique ability to drive home your ideas and show how they mesh to guarantee success. Use our Technology PowerPoint Templates because; illustrate these thoughts with this slide. Use our Process and flows PowerPoint Templates because, Use them to your advantage to priorities your ideas. Use these PowerPoint slides for presentations relating to Algorithm, arrow, arrow chart, business, chart, color, connection, development, diagram, direction, flow chart, flow diagram, flowchart, kind of diagram, linear, linear diagram, management, motion, organization, plan, process, process arrows, process chart, process diagram, process flow, program, sign, solution, strategy, symbol, technology. The prominent colors used in the PowerPoint template are Green, Gray, and White Face the storm with our Sales Ppt Background Seven PowerPoint Slide Numbers Linear Process 5 Image. Just download, type and present.
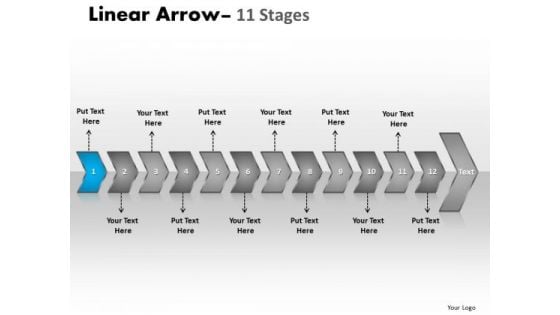
Business PowerPoint Template Chronological Representation Of 12 Arrows Ppt Image
We present our Business PowerPoint template chronological representation of 12 arrows ppt Image. Use our Arrows PowerPoint Templates because, Timelines Template: - Getting it done may not be enough. Use our Process and Flows PowerPoint Templates because, Will surely see the all making the grade. Use our Business PowerPoint Templates because, Marketing Strategy Business Template: - Maximizing sales of your product is the intended destination. Use our Marketing PowerPoint Templates because, Individual components well researched and understood in their place. Use our Shapes PowerPoint Templates because; educate your listeners on the means to keep it ticking over. Use these PowerPoint slides for presentations relating to Algorithm, Arrow, Chart, Block, Diagram, Business, Chart, Connection, Design, Development, Diagram, Direction, Element, Flow, Chart, Flow, Diagram, Flowchart, Graph, Kind, Of, Diagram, Linear, Diagram, Management, Model, Module, Motion, Organization, Plan, Process, Arrows, Process, Chart, Process, Diagram, Process, Flow, Program, Section, Segment, Set, Sign, Solution, Strategy, Symbol, Technology. The prominent colors used in the PowerPoint template are Blue, Gray, and Black Put your customer in the spotlight with your thoughts. Centre it on him with our Business PowerPoint Template Chronological Representation Of 12 Arrows Ppt Image.
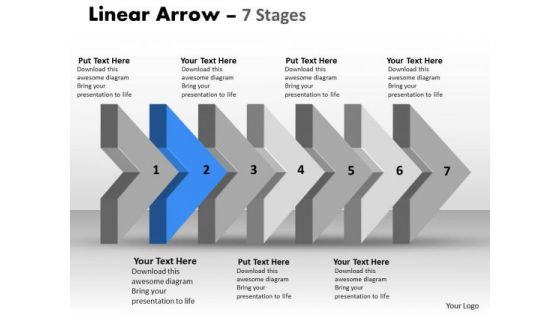
PowerPoint Template 3d Arrow Representing Realistic Steps Business Plan Image
We present our PowerPoint template 3d arrow representing realistic steps business plan Image. Use our Business PowerPoint Templates because, Marketing Strategy Business Template:- Maximizing sales of your product is the intended destination. Use our Arrows PowerPoint Templates because, If making a mark is your obsession,. Use our Process and flows PowerPoint Templates because, illustrate the means to prevent or control them using our imaginative templates. Use our Marketing PowerPoint Templates because, they pinpoint the core values of your organization. Use our Success PowerPoint Templates because, If making a mark is your obsession,. Use these PowerPoint slides for presentations relating to Algorithm, arrow, arrow chart, block diagram, business, chart, connection, design, development, diagram, direction, element, flow, flow chart, flow diagram, flowchart, graph, kind of diagram, linear, linear diagram, management, organization, process, process arrows, process chart, process diagram, process flow, program, section, segment, set, sign, solution, strategy, symbol. The prominent colors used in the PowerPoint template are Blue, Gray, and White Our PowerPoint Template 3d Arrow Representing Realistic Steps Business Plan Image need no exaggeration. They are an advertisement for themselves.

 Home
Home